Zip Codes with the Highest Percentage of Population Employed in Legal Services & Support in Indianapolis, IN
RELATED REPORTS & OPTIONS
Legal Services & Support
Indianapolis
Compare Zip Codes
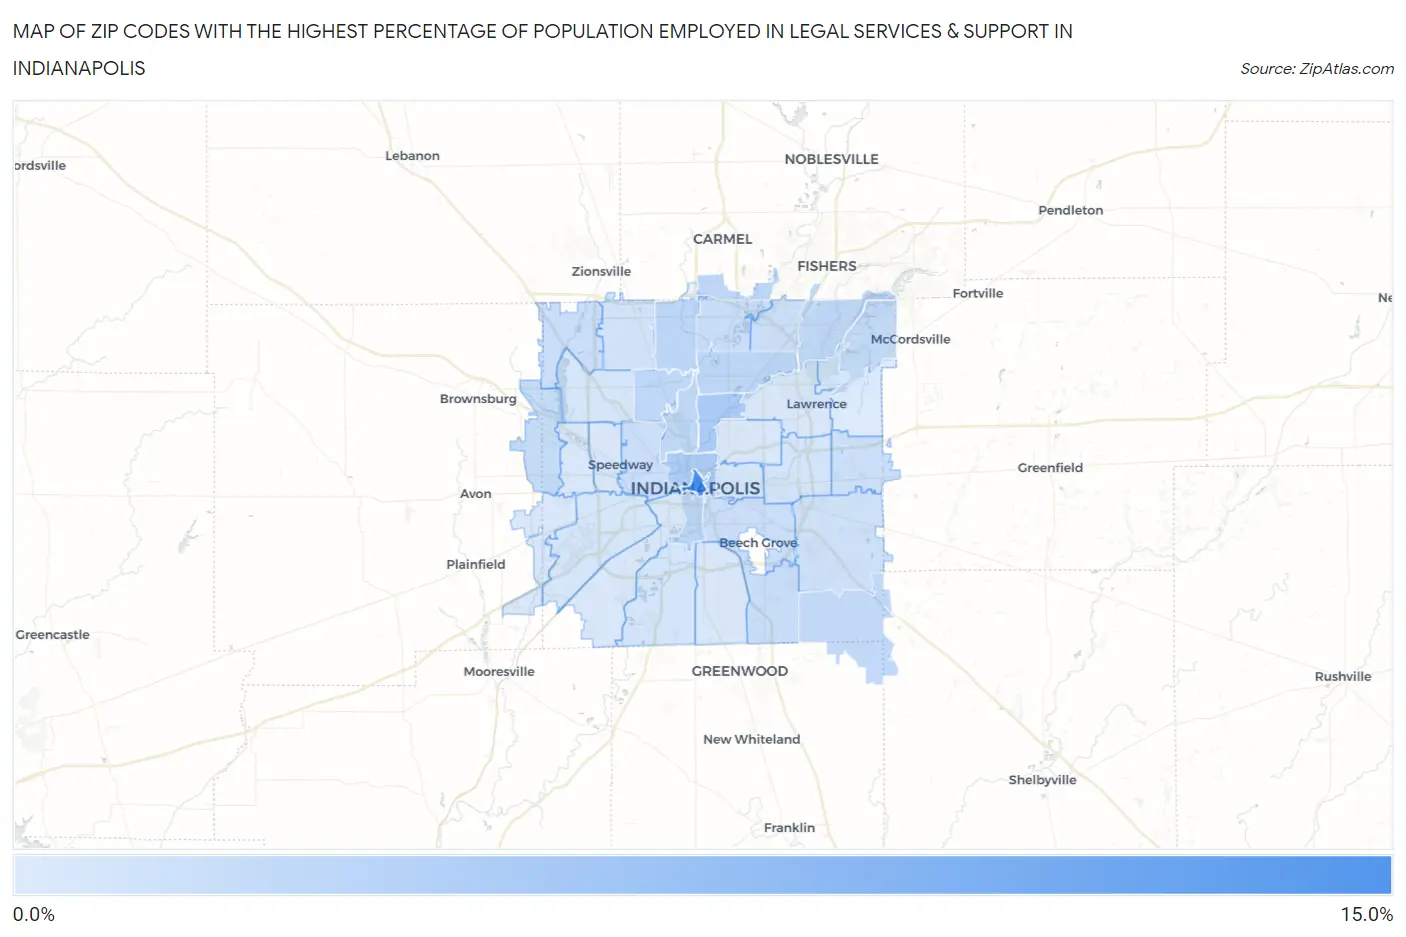
Map of Zip Codes with the Highest Percentage of Population Employed in Legal Services & Support in Indianapolis
0.073%
10.8%
Zip Codes with the Highest Percentage of Population Employed in Legal Services & Support in Indianapolis, IN
| Zip Code | % Employed | vs State | vs National | |
| 1. | 46204 | 10.8% | 0.76%(+10.0)#2 | 1.2%(+9.58)#134 |
| 2. | 46205 | 3.5% | 0.76%(+2.74)#15 | 1.2%(+2.32)#1,437 |
| 3. | 46202 | 3.5% | 0.76%(+2.73)#16 | 1.2%(+2.30)#1,445 |
| 4. | 46220 | 2.3% | 0.76%(+1.58)#26 | 1.2%(+1.16)#2,770 |
| 5. | 46280 | 2.3% | 0.76%(+1.51)#30 | 1.2%(+1.09)#2,887 |
| 6. | 46225 | 2.2% | 0.76%(+1.49)#31 | 1.2%(+1.07)#2,937 |
| 7. | 46260 | 2.2% | 0.76%(+1.45)#33 | 1.2%(+1.03)#3,012 |
| 8. | 46228 | 2.2% | 0.76%(+1.44)#34 | 1.2%(+1.01)#3,042 |
| 9. | 46208 | 2.1% | 0.76%(+1.29)#38 | 1.2%(+0.868)#3,333 |
| 10. | 46259 | 2.0% | 0.76%(+1.23)#40 | 1.2%(+0.807)#3,505 |
| 11. | 46256 | 1.9% | 0.76%(+1.18)#41 | 1.2%(+0.762)#3,612 |
| 12. | 46236 | 1.7% | 0.76%(+0.971)#49 | 1.2%(+0.550)#4,195 |
| 13. | 46234 | 1.7% | 0.76%(+0.908)#50 | 1.2%(+0.486)#4,425 |
| 14. | 46240 | 1.5% | 0.76%(+0.780)#53 | 1.2%(+0.358)#4,880 |
| 15. | 46237 | 1.5% | 0.76%(+0.690)#60 | 1.2%(+0.269)#5,248 |
| 16. | 46278 | 1.4% | 0.76%(+0.635)#64 | 1.2%(+0.213)#5,494 |
| 17. | 46222 | 1.3% | 0.76%(+0.528)#75 | 1.2%(+0.106)#5,983 |
| 18. | 46203 | 1.3% | 0.76%(+0.513)#78 | 1.2%(+0.091)#6,064 |
| 19. | 46229 | 1.2% | 0.76%(+0.423)#91 | 1.2%(+0.002)#6,609 |
| 20. | 46250 | 1.1% | 0.76%(+0.366)#97 | 1.2%(-0.056)#6,958 |
| 21. | 46239 | 1.0% | 0.76%(+0.246)#110 | 1.2%(-0.175)#7,766 |
| 22. | 46268 | 0.88% | 0.76%(+0.123)#127 | 1.2%(-0.299)#8,742 |
| 23. | 46219 | 0.77% | 0.76%(+0.012)#148 | 1.2%(-0.409)#9,697 |
| 24. | 46216 | 0.73% | 0.76%(-0.035)#156 | 1.2%(-0.457)#10,136 |
| 25. | 46217 | 0.65% | 0.76%(-0.114)#168 | 1.2%(-0.536)#10,961 |
| 26. | 46254 | 0.57% | 0.76%(-0.191)#186 | 1.2%(-0.613)#11,800 |
| 27. | 46241 | 0.56% | 0.76%(-0.203)#191 | 1.2%(-0.625)#11,952 |
| 28. | 46201 | 0.55% | 0.76%(-0.209)#192 | 1.2%(-0.630)#12,017 |
| 29. | 46218 | 0.45% | 0.76%(-0.315)#226 | 1.2%(-0.737)#13,285 |
| 30. | 46226 | 0.43% | 0.76%(-0.328)#232 | 1.2%(-0.750)#13,438 |
| 31. | 46224 | 0.37% | 0.76%(-0.388)#253 | 1.2%(-0.809)#14,148 |
| 32. | 46214 | 0.36% | 0.76%(-0.401)#257 | 1.2%(-0.823)#14,320 |
| 33. | 46221 | 0.34% | 0.76%(-0.424)#267 | 1.2%(-0.846)#14,608 |
| 34. | 46227 | 0.33% | 0.76%(-0.433)#276 | 1.2%(-0.855)#14,720 |
| 35. | 46231 | 0.26% | 0.76%(-0.506)#297 | 1.2%(-0.927)#15,559 |
| 36. | 46235 | 0.073% | 0.76%(-0.689)#371 | 1.2%(-1.11)#17,312 |
1
Common Questions
What are the Top 10 Zip Codes with the Highest Percentage of Population Employed in Legal Services & Support in Indianapolis, IN?
Top 10 Zip Codes with the Highest Percentage of Population Employed in Legal Services & Support in Indianapolis, IN are:
What zip code has the Highest Percentage of Population Employed in Legal Services & Support in Indianapolis, IN?
46204 has the Highest Percentage of Population Employed in Legal Services & Support in Indianapolis, IN with 10.8%.
What is the Percentage of Population Employed in Legal Services & Support in Indianapolis, IN?
Percentage of Population Employed in Legal Services & Support in Indianapolis is 1.3%.
What is the Percentage of Population Employed in Legal Services & Support in Indiana?
Percentage of Population Employed in Legal Services & Support in Indiana is 0.76%.
What is the Percentage of Population Employed in Legal Services & Support in the United States?
Percentage of Population Employed in Legal Services & Support in the United States is 1.2%.