Zip Codes with the Highest Percentage of Population Employed in Architecture & Engineering in Indianapolis, IN
RELATED REPORTS & OPTIONS
Architecture & Engineering
Indianapolis
Compare Zip Codes
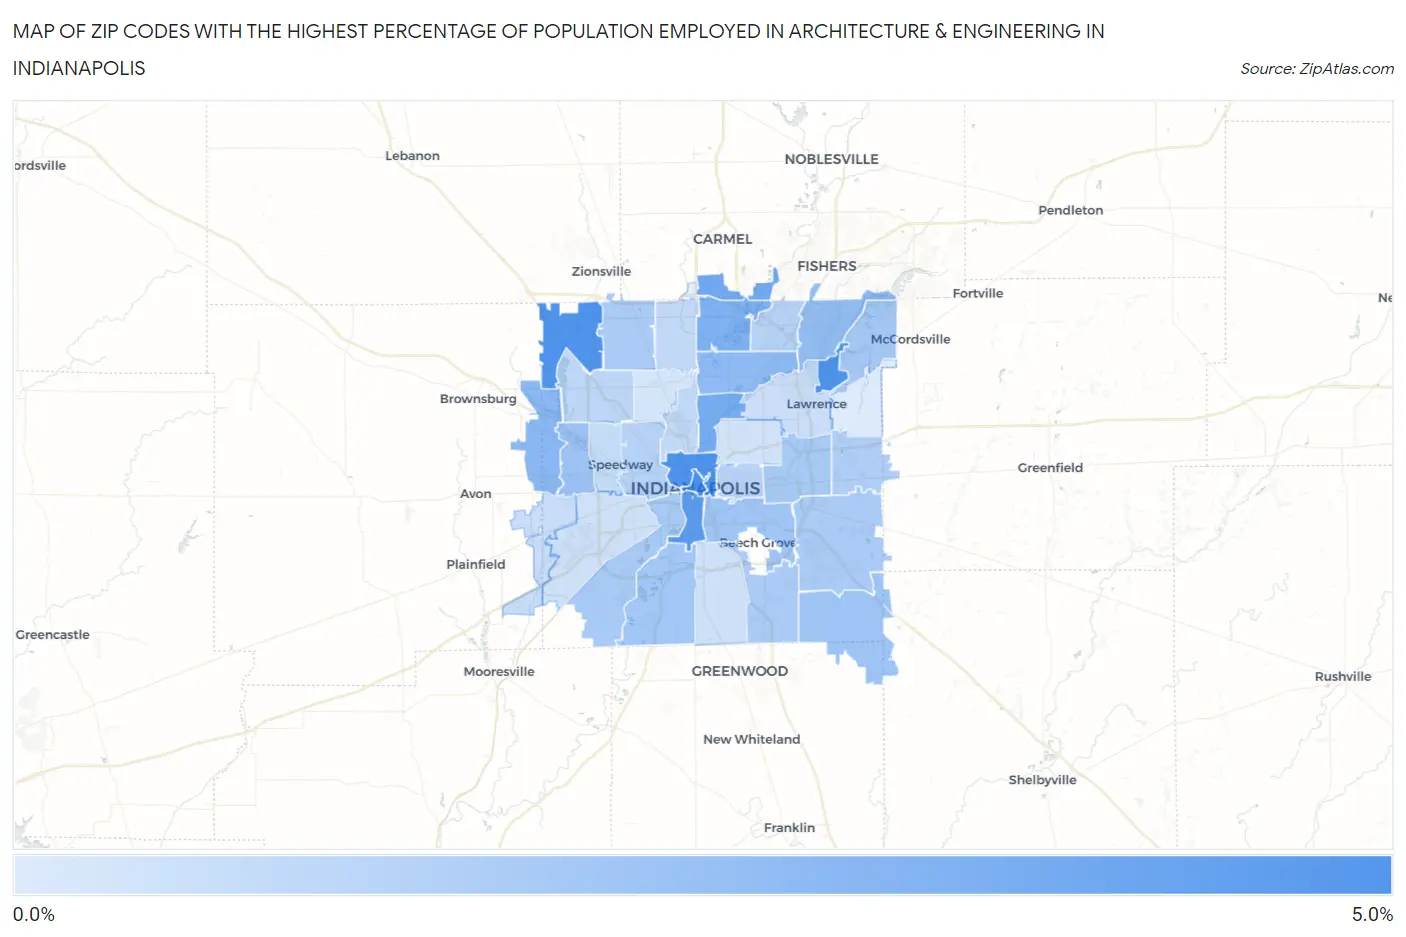
Map of Zip Codes with the Highest Percentage of Population Employed in Architecture & Engineering in Indianapolis
0.18%
4.6%
Zip Codes with the Highest Percentage of Population Employed in Architecture & Engineering in Indianapolis, IN
| Zip Code | % Employed | vs State | vs National | |
| 1. | 46204 | 4.6% | 2.2%(+2.41)#59 | 2.1%(+2.48)#1,993 |
| 2. | 46202 | 4.4% | 2.2%(+2.22)#64 | 2.1%(+2.29)#2,197 |
| 3. | 46278 | 4.4% | 2.2%(+2.15)#69 | 2.1%(+2.22)#2,294 |
| 4. | 46216 | 4.4% | 2.2%(+2.14)#70 | 2.1%(+2.21)#2,308 |
| 5. | 46225 | 4.0% | 2.2%(+1.76)#85 | 2.1%(+1.83)#2,803 |
| 6. | 46280 | 3.4% | 2.2%(+1.14)#130 | 2.1%(+1.21)#4,048 |
| 7. | 46205 | 3.2% | 2.2%(+1.02)#137 | 2.1%(+1.09)#4,342 |
| 8. | 46240 | 3.0% | 2.2%(+0.769)#158 | 2.1%(+0.842)#5,088 |
| 9. | 46234 | 2.6% | 2.2%(+0.385)#195 | 2.1%(+0.458)#6,548 |
| 10. | 46220 | 2.5% | 2.2%(+0.245)#212 | 2.1%(+0.318)#7,149 |
| 11. | 46256 | 2.3% | 2.2%(+0.108)#231 | 2.1%(+0.180)#7,800 |
| 12. | 46214 | 2.2% | 2.2%(-0.048)#264 | 2.1%(+0.025)#8,643 |
| 13. | 46259 | 2.0% | 2.2%(-0.188)#284 | 2.1%(-0.116)#9,402 |
| 14. | 46203 | 1.9% | 2.2%(-0.286)#297 | 2.1%(-0.214)#10,009 |
| 15. | 46217 | 1.9% | 2.2%(-0.321)#307 | 2.1%(-0.249)#10,243 |
| 16. | 46236 | 1.8% | 2.2%(-0.447)#322 | 2.1%(-0.375)#10,979 |
| 17. | 46221 | 1.8% | 2.2%(-0.466)#325 | 2.1%(-0.394)#11,103 |
| 18. | 46219 | 1.7% | 2.2%(-0.474)#331 | 2.1%(-0.401)#11,179 |
| 19. | 46268 | 1.7% | 2.2%(-0.551)#342 | 2.1%(-0.479)#11,690 |
| 20. | 46237 | 1.7% | 2.2%(-0.552)#343 | 2.1%(-0.480)#11,700 |
| 21. | 46239 | 1.7% | 2.2%(-0.571)#347 | 2.1%(-0.498)#11,818 |
| 22. | 46229 | 1.6% | 2.2%(-0.667)#357 | 2.1%(-0.595)#12,479 |
| 23. | 46250 | 1.3% | 2.2%(-0.883)#406 | 2.1%(-0.810)#14,036 |
| 24. | 46222 | 1.3% | 2.2%(-0.906)#412 | 2.1%(-0.834)#14,212 |
| 25. | 46201 | 1.2% | 2.2%(-0.982)#422 | 2.1%(-0.909)#14,757 |
| 26. | 46254 | 1.1% | 2.2%(-1.09)#446 | 2.1%(-1.02)#15,637 |
| 27. | 46208 | 1.0% | 2.2%(-1.22)#472 | 2.1%(-1.15)#16,584 |
| 28. | 46260 | 0.99% | 2.2%(-1.24)#476 | 2.1%(-1.16)#16,708 |
| 29. | 46224 | 0.83% | 2.2%(-1.39)#501 | 2.1%(-1.32)#17,900 |
| 30. | 46231 | 0.77% | 2.2%(-1.45)#511 | 2.1%(-1.38)#18,361 |
| 31. | 46226 | 0.69% | 2.2%(-1.53)#524 | 2.1%(-1.46)#18,961 |
| 32. | 46241 | 0.62% | 2.2%(-1.61)#529 | 2.1%(-1.53)#19,523 |
| 33. | 46227 | 0.59% | 2.2%(-1.63)#534 | 2.1%(-1.56)#19,708 |
| 34. | 46218 | 0.51% | 2.2%(-1.71)#551 | 2.1%(-1.64)#20,187 |
| 35. | 46228 | 0.46% | 2.2%(-1.76)#556 | 2.1%(-1.69)#20,498 |
| 36. | 46235 | 0.18% | 2.2%(-2.04)#586 | 2.1%(-1.97)#22,115 |
1
Common Questions
What are the Top 10 Zip Codes with the Highest Percentage of Population Employed in Architecture & Engineering in Indianapolis, IN?
Top 10 Zip Codes with the Highest Percentage of Population Employed in Architecture & Engineering in Indianapolis, IN are:
What zip code has the Highest Percentage of Population Employed in Architecture & Engineering in Indianapolis, IN?
46204 has the Highest Percentage of Population Employed in Architecture & Engineering in Indianapolis, IN with 4.6%.
What is the Percentage of Population Employed in Architecture & Engineering in Indianapolis, IN?
Percentage of Population Employed in Architecture & Engineering in Indianapolis is 1.6%.
What is the Percentage of Population Employed in Architecture & Engineering in Indiana?
Percentage of Population Employed in Architecture & Engineering in Indiana is 2.2%.
What is the Percentage of Population Employed in Architecture & Engineering in the United States?
Percentage of Population Employed in Architecture & Engineering in the United States is 2.1%.