Zip Codes with the Highest Percentage of Population Employed in Life, Physical & Social Science in Indianapolis, IN
RELATED REPORTS & OPTIONS
Life, Physical & Social Science
Indianapolis
Compare Zip Codes
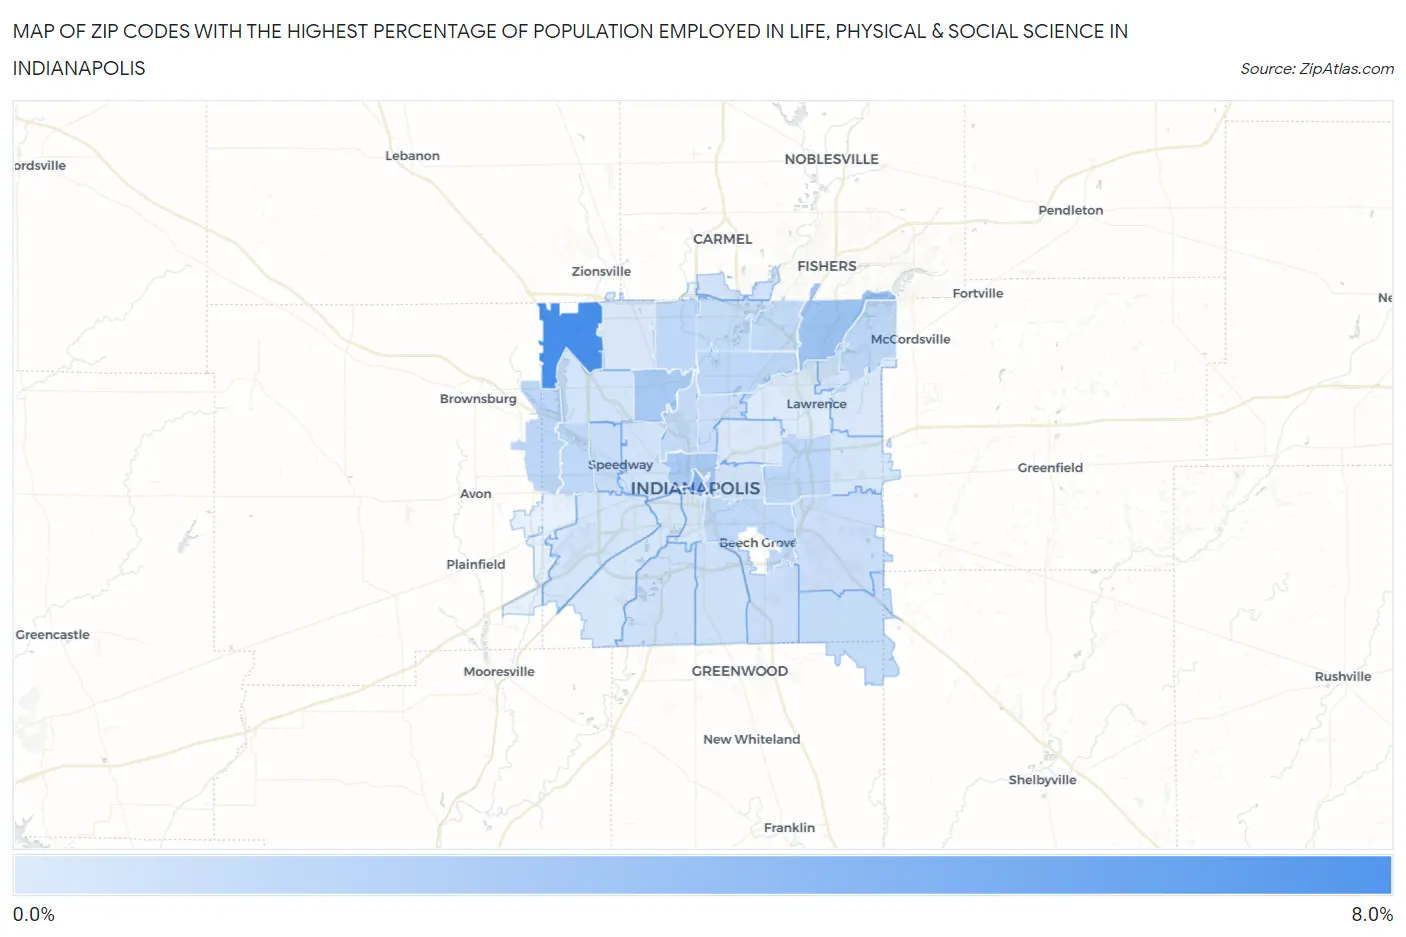
Map of Zip Codes with the Highest Percentage of Population Employed in Life, Physical & Social Science in Indianapolis
0.12%
6.9%
Zip Codes with the Highest Percentage of Population Employed in Life, Physical & Social Science in Indianapolis, IN
| Zip Code | % Employed | vs State | vs National | |
| 1. | 46278 | 6.9% | 0.83%(+6.11)#3 | 1.1%(+5.85)#416 |
| 2. | 46204 | 3.8% | 0.83%(+2.98)#11 | 1.1%(+2.72)#1,261 |
| 3. | 46256 | 2.9% | 0.83%(+2.07)#21 | 1.1%(+1.81)#1,996 |
| 4. | 46228 | 2.5% | 0.83%(+1.64)#35 | 1.1%(+1.38)#2,630 |
| 5. | 46202 | 2.4% | 0.83%(+1.59)#37 | 1.1%(+1.33)#2,717 |
| 6. | 46234 | 1.6% | 0.83%(+0.729)#72 | 1.1%(+0.469)#5,333 |
| 7. | 46220 | 1.5% | 0.83%(+0.654)#81 | 1.1%(+0.395)#5,729 |
| 8. | 46260 | 1.5% | 0.83%(+0.642)#85 | 1.1%(+0.382)#5,812 |
| 9. | 46219 | 1.5% | 0.83%(+0.623)#87 | 1.1%(+0.364)#5,898 |
| 10. | 46214 | 1.5% | 0.83%(+0.621)#88 | 1.1%(+0.361)#5,910 |
| 11. | 46203 | 1.5% | 0.83%(+0.620)#89 | 1.1%(+0.361)#5,912 |
| 12. | 46236 | 1.4% | 0.83%(+0.587)#93 | 1.1%(+0.327)#6,094 |
| 13. | 46208 | 1.3% | 0.83%(+0.450)#105 | 1.1%(+0.191)#6,920 |
| 14. | 46250 | 1.2% | 0.83%(+0.370)#111 | 1.1%(+0.110)#7,485 |
| 15. | 46259 | 1.2% | 0.83%(+0.335)#114 | 1.1%(+0.075)#7,756 |
| 16. | 46240 | 1.1% | 0.83%(+0.287)#117 | 1.1%(+0.027)#8,082 |
| 17. | 46224 | 1.00% | 0.83%(+0.167)#138 | 1.1%(-0.092)#9,055 |
| 18. | 46205 | 0.97% | 0.83%(+0.139)#142 | 1.1%(-0.120)#9,320 |
| 19. | 46239 | 0.95% | 0.83%(+0.117)#146 | 1.1%(-0.142)#9,505 |
| 20. | 46237 | 0.93% | 0.83%(+0.102)#150 | 1.1%(-0.157)#9,632 |
| 21. | 46227 | 0.71% | 0.83%(-0.123)#203 | 1.1%(-0.383)#11,931 |
| 22. | 46217 | 0.70% | 0.83%(-0.129)#207 | 1.1%(-0.389)#12,000 |
| 23. | 46201 | 0.67% | 0.83%(-0.159)#218 | 1.1%(-0.418)#12,381 |
| 24. | 46222 | 0.64% | 0.83%(-0.189)#225 | 1.1%(-0.449)#12,757 |
| 25. | 46280 | 0.64% | 0.83%(-0.193)#227 | 1.1%(-0.453)#12,817 |
| 26. | 46216 | 0.58% | 0.83%(-0.250)#245 | 1.1%(-0.510)#13,526 |
| 27. | 46254 | 0.55% | 0.83%(-0.280)#257 | 1.1%(-0.540)#13,897 |
| 28. | 46241 | 0.50% | 0.83%(-0.329)#269 | 1.1%(-0.589)#14,472 |
| 29. | 46221 | 0.45% | 0.83%(-0.385)#290 | 1.1%(-0.645)#15,186 |
| 30. | 46229 | 0.44% | 0.83%(-0.390)#294 | 1.1%(-0.650)#15,249 |
| 31. | 46235 | 0.37% | 0.83%(-0.466)#322 | 1.1%(-0.725)#16,195 |
| 32. | 46268 | 0.36% | 0.83%(-0.470)#323 | 1.1%(-0.730)#16,266 |
| 33. | 46225 | 0.35% | 0.83%(-0.485)#326 | 1.1%(-0.745)#16,455 |
| 34. | 46218 | 0.21% | 0.83%(-0.622)#364 | 1.1%(-0.882)#18,089 |
| 35. | 46226 | 0.12% | 0.83%(-0.711)#392 | 1.1%(-0.970)#18,937 |
1
Common Questions
What are the Top 10 Zip Codes with the Highest Percentage of Population Employed in Life, Physical & Social Science in Indianapolis, IN?
Top 10 Zip Codes with the Highest Percentage of Population Employed in Life, Physical & Social Science in Indianapolis, IN are:
What zip code has the Highest Percentage of Population Employed in Life, Physical & Social Science in Indianapolis, IN?
46278 has the Highest Percentage of Population Employed in Life, Physical & Social Science in Indianapolis, IN with 6.9%.
What is the Percentage of Population Employed in Life, Physical & Social Science in Indianapolis, IN?
Percentage of Population Employed in Life, Physical & Social Science in Indianapolis is 1.1%.
What is the Percentage of Population Employed in Life, Physical & Social Science in Indiana?
Percentage of Population Employed in Life, Physical & Social Science in Indiana is 0.83%.
What is the Percentage of Population Employed in Life, Physical & Social Science in the United States?
Percentage of Population Employed in Life, Physical & Social Science in the United States is 1.1%.