Zip Codes with the Highest Percentage of Population Employed in Computer, Engineering & Science in Indianapolis, IN
RELATED REPORTS & OPTIONS
Computer, Engineering & Science
Indianapolis
Compare Zip Codes
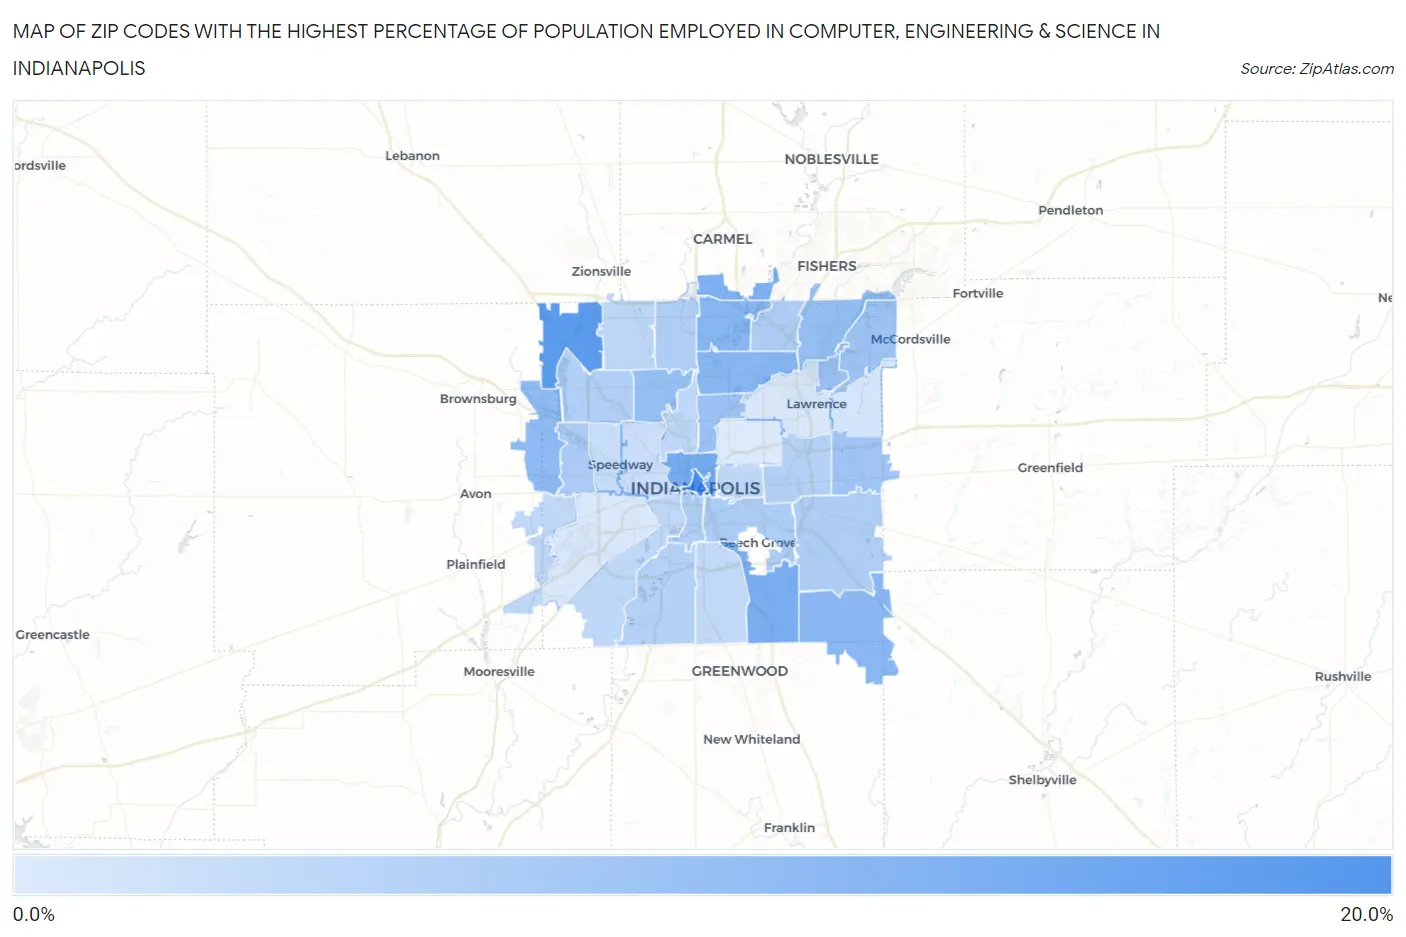
Map of Zip Codes with the Highest Percentage of Population Employed in Computer, Engineering & Science in Indianapolis
1.7%
15.8%
Zip Codes with the Highest Percentage of Population Employed in Computer, Engineering & Science in Indianapolis, IN
| Zip Code | % Employed | vs State | vs National | |
| 1. | 46204 | 15.8% | 5.5%(+10.4)#11 | 6.8%(+9.07)#982 |
| 2. | 46278 | 14.1% | 5.5%(+8.59)#15 | 6.8%(+7.29)#1,323 |
| 3. | 46202 | 11.4% | 5.5%(+5.91)#30 | 6.8%(+4.62)#2,361 |
| 4. | 46237 | 10.8% | 5.5%(+5.32)#34 | 6.8%(+4.02)#2,684 |
| 5. | 46280 | 10.4% | 5.5%(+4.89)#40 | 6.8%(+3.59)#2,963 |
| 6. | 46220 | 9.6% | 5.5%(+4.13)#57 | 6.8%(+2.83)#3,526 |
| 7. | 46240 | 9.5% | 5.5%(+4.01)#61 | 6.8%(+2.72)#3,617 |
| 8. | 46259 | 9.3% | 5.5%(+3.86)#63 | 6.8%(+2.56)#3,759 |
| 9. | 46234 | 8.8% | 5.5%(+3.37)#73 | 6.8%(+2.07)#4,228 |
| 10. | 46228 | 8.2% | 5.5%(+2.75)#81 | 6.8%(+1.46)#4,968 |
| 11. | 46256 | 8.2% | 5.5%(+2.72)#82 | 6.8%(+1.42)#5,019 |
| 12. | 46216 | 7.8% | 5.5%(+2.38)#93 | 6.8%(+1.08)#5,483 |
| 13. | 46205 | 7.7% | 5.5%(+2.24)#103 | 6.8%(+0.943)#5,675 |
| 14. | 46236 | 7.3% | 5.5%(+1.83)#116 | 6.8%(+0.532)#6,311 |
| 15. | 46229 | 7.1% | 5.5%(+1.61)#123 | 6.8%(+0.312)#6,666 |
| 16. | 46214 | 6.2% | 5.5%(+0.735)#157 | 6.8%(-0.562)#8,331 |
| 17. | 46203 | 6.1% | 5.5%(+0.647)#162 | 6.8%(-0.650)#8,553 |
| 18. | 46260 | 5.9% | 5.5%(+0.409)#178 | 6.8%(-0.889)#9,133 |
| 19. | 46250 | 5.9% | 5.5%(+0.401)#181 | 6.8%(-0.896)#9,152 |
| 20. | 46239 | 5.8% | 5.5%(+0.368)#182 | 6.8%(-0.930)#9,222 |
| 21. | 46254 | 5.7% | 5.5%(+0.206)#191 | 6.8%(-1.09)#9,616 |
| 22. | 46225 | 5.6% | 5.5%(+0.112)#200 | 6.8%(-1.19)#9,858 |
| 23. | 46219 | 5.3% | 5.5%(-0.141)#216 | 6.8%(-1.44)#10,514 |
| 24. | 46217 | 5.2% | 5.5%(-0.237)#223 | 6.8%(-1.53)#10,755 |
| 25. | 46268 | 4.6% | 5.5%(-0.852)#276 | 6.8%(-2.15)#12,450 |
| 26. | 46231 | 4.4% | 5.5%(-1.11)#294 | 6.8%(-2.40)#13,297 |
| 27. | 46208 | 4.4% | 5.5%(-1.11)#295 | 6.8%(-2.41)#13,314 |
| 28. | 46221 | 4.4% | 5.5%(-1.12)#296 | 6.8%(-2.41)#13,325 |
| 29. | 46201 | 4.3% | 5.5%(-1.19)#305 | 6.8%(-2.49)#13,600 |
| 30. | 46227 | 4.2% | 5.5%(-1.24)#310 | 6.8%(-2.54)#13,766 |
| 31. | 46224 | 3.6% | 5.5%(-1.83)#370 | 6.8%(-3.12)#15,711 |
| 32. | 46222 | 3.4% | 5.5%(-2.04)#393 | 6.8%(-3.34)#16,539 |
| 33. | 46235 | 2.4% | 5.5%(-3.03)#495 | 6.8%(-4.33)#20,259 |
| 34. | 46226 | 2.1% | 5.5%(-3.39)#542 | 6.8%(-4.69)#21,576 |
| 35. | 46241 | 2.0% | 5.5%(-3.51)#554 | 6.8%(-4.81)#22,029 |
| 36. | 46218 | 1.7% | 5.5%(-3.75)#572 | 6.8%(-5.04)#22,851 |
1
Common Questions
What are the Top 10 Zip Codes with the Highest Percentage of Population Employed in Computer, Engineering & Science in Indianapolis, IN?
Top 10 Zip Codes with the Highest Percentage of Population Employed in Computer, Engineering & Science in Indianapolis, IN are:
What zip code has the Highest Percentage of Population Employed in Computer, Engineering & Science in Indianapolis, IN?
46204 has the Highest Percentage of Population Employed in Computer, Engineering & Science in Indianapolis, IN with 15.8%.
What is the Percentage of Population Employed in Computer, Engineering & Science in Indianapolis, IN?
Percentage of Population Employed in Computer, Engineering & Science in Indianapolis is 6.0%.
What is the Percentage of Population Employed in Computer, Engineering & Science in Indiana?
Percentage of Population Employed in Computer, Engineering & Science in Indiana is 5.5%.
What is the Percentage of Population Employed in Computer, Engineering & Science in the United States?
Percentage of Population Employed in Computer, Engineering & Science in the United States is 6.8%.