Zip Codes with the Highest Percentage of Population with a Degree in Computers and Mathematics in Indianapolis, IN

RELATED REPORTS & OPTIONS

Computers and Mathematics
Population
Families and Households
Female Fertility
Female Fertility (Unmarried)
Race (Community Size)
Race (Percentage)
Ancestry (Community Size)
AfghanAfricanAlaskan AthabascanAlbanianAlsatianAmericanApacheArabArgentineanArmenianAustralianAustrianBahamianBangladeshiBarbadianBasqueBelgianBelizeanBhutaneseBlackfeetBolivianBrazilianBritishBritish West IndianBulgarianBurmeseCajunCanadianCelticCentral AmericanCentral American IndianCherokeeChickasawChileanChippewaChoctawColombianCosta RicanCroatianCrowCubanCzechCzechoslovakianDanishDominicanDutchEastern EuropeanEcuadorianEgyptianEnglishEstonianEthiopianEuropeanFilipinoFinnishFrenchFrench CanadianGermanGerman RussianGhanaianGreekGuamanian / ChamorroGuatemalanGuyaneseHaitianHonduranHopiHungarianIcelanderIndian (Asian)IndonesianInupiatIranianIraqiIrishIroquoisIsraeliItalianJamaicanJapaneseJordanianKenyanKoreanLaotianLatvianLebaneseLiberianLithuanianLuxembourgerMacedonianMalaysianMenomineeMexicanMexican American IndianMongolianMoroccanNative HawaiianNavajoNew ZealanderNicaraguanNigerianNorthern EuropeanNorwegianPakistaniPalestinianPanamanianPennsylvania GermanPeruvianPolishPortuguesePotawatomiPuerto RicanRomanianRussianSalvadoranSamoanScandinavianScotch-IrishScottishSeminoleSenegaleseSerbianSierra LeoneanSiouxSlavicSlovakSloveneSouth AfricanSouth AmericanSouth American IndianSpaniardSpanishSri LankanSubsaharan AfricanSudaneseSwedishSwissSyrianThaiTonganTrinidadian and TobagonianTurkishUgandanUkrainianUruguayanVenezuelanVietnameseWelshWest IndianYugoslavianZimbabwean
Ancestry (Percentage)
AfghanAfricanAlaskan AthabascanAlbanianAlsatianAmericanApacheArabArgentineanArmenianAustralianAustrianBahamianBangladeshiBarbadianBasqueBelgianBelizeanBhutaneseBlackfeetBolivianBrazilianBritishBritish West IndianBulgarianBurmeseCajunCanadianCelticCentral AmericanCentral American IndianCherokeeChickasawChileanChippewaChoctawColombianCosta RicanCroatianCrowCubanCzechCzechoslovakianDanishDominicanDutchEastern EuropeanEcuadorianEgyptianEnglishEstonianEthiopianEuropeanFilipinoFinnishFrenchFrench CanadianGermanGerman RussianGhanaianGreekGuamanian / ChamorroGuatemalanGuyaneseHaitianHonduranHopiHungarianIcelanderIndian (Asian)IndonesianInupiatIranianIraqiIrishIroquoisIsraeliItalianJamaicanJapaneseJordanianKenyanKoreanLaotianLatvianLebaneseLiberianLithuanianLuxembourgerMacedonianMalaysianMenomineeMexicanMexican American IndianMongolianMoroccanNative HawaiianNavajoNew ZealanderNicaraguanNigerianNorthern EuropeanNorwegianPakistaniPalestinianPanamanianPennsylvania GermanPeruvianPolishPortuguesePotawatomiPuerto RicanRomanianRussianSalvadoranSamoanScandinavianScotch-IrishScottishSeminoleSenegaleseSerbianSierra LeoneanSiouxSlavicSlovakSloveneSouth AfricanSouth AmericanSouth American IndianSpaniardSpanishSri LankanSubsaharan AfricanSudaneseSwedishSwissSyrianThaiTonganTrinidadian and TobagonianTurkishUgandanUkrainianUruguayanVenezuelanVietnameseWelshWest IndianYugoslavianZimbabwean
Immigrant Origin (Total)
AfghanistanAfricaArgentinaAsiaAustraliaAustriaBahamasBangladeshBarbadosBelarusBoliviaBosnia and HerzegovinaBrazilBulgariaBurma / MyanmarCambodiaCameroonCanadaCaribbeanCentral AmericaChileChinaColombiaCongoCosta RicaCubaDenmarkDominican RepublicEastern AfricaEastern AsiaEastern EuropeEcuadorEgyptEl SalvadorEnglandEritreaEthiopiaEuropeFranceGermanyGhanaGreeceGuatemalaGuyanaHaitiHondurasHong KongHungaryIndiaIndonesiaIranIraqIrelandIsraelItalyJamaicaJapanJordanKenyaKoreaLaosLatin AmericaLatviaLebanonLiberiaMalaysiaMexicoMiddle AfricaMoldovaMoroccoNepalNetherlandsNicaraguaNigeriaNorth MacedoniaNorthern AfricaNorthern EuropeNorwayOceaniaPakistanPanamaPeruPhilippinesPolandPortugalRomaniaRussiaSaudi ArabiaScotlandSenegalSerbiaSierra LeoneSingaporeSouth AfricaSouth AmericaSouth Central AsiaSouth Eastern AsiaSouthern EuropeSpainSt. Vincent and the GrenadinesSudanSyriaTaiwanThailandTrinidad and TobagoTurkeyUgandaUkraineUzbekistanVenezuelaVietnamWest IndiesWestern AfricaWestern AsiaWestern EuropeYemenZaireZimbabwe
Immigrant Origin (Percentage)
AfghanistanAfricaArgentinaAsiaAustraliaAustriaBahamasBangladeshBarbadosBelarusBoliviaBosnia and HerzegovinaBrazilBulgariaBurma / MyanmarCambodiaCameroonCanadaCaribbeanCentral AmericaChileChinaColombiaCongoCosta RicaCubaDenmarkDominican RepublicEastern AfricaEastern AsiaEastern EuropeEcuadorEgyptEl SalvadorEnglandEritreaEthiopiaEuropeFranceGermanyGhanaGreeceGuatemalaGuyanaHaitiHondurasHong KongHungaryIndiaIndonesiaIranIraqIrelandIsraelItalyJamaicaJapanJordanKenyaKoreaLaosLatin AmericaLatviaLebanonLiberiaMalaysiaMexicoMiddle AfricaMoldovaMoroccoNepalNetherlandsNicaraguaNigeriaNorth MacedoniaNorthern AfricaNorthern EuropeNorwayOceaniaPakistanPanamaPeruPhilippinesPolandPortugalRomaniaRussiaSaudi ArabiaScotlandSenegalSerbiaSierra LeoneSingaporeSouth AfricaSouth AmericaSouth Central AsiaSouth Eastern AsiaSouthern EuropeSpainSt. Vincent and the GrenadinesSudanSyriaTaiwanThailandTrinidad and TobagoTurkeyUgandaUkraineUzbekistanVenezuelaVietnamWest IndiesWestern AfricaWestern AsiaWestern EuropeYemenZaireZimbabwe
Income
Income (Families)
Income (Households)
Poverty
Poverty (Families)
Unemployment
Employment Occupations
Employment Industries
Employer Class
Commute Time
Commute Means
School Enrollment
Education by Degree Field
Occupancy
Finances
Physical Characteristics
Indianapolis
Compare Zip Codes
Comparison Subject

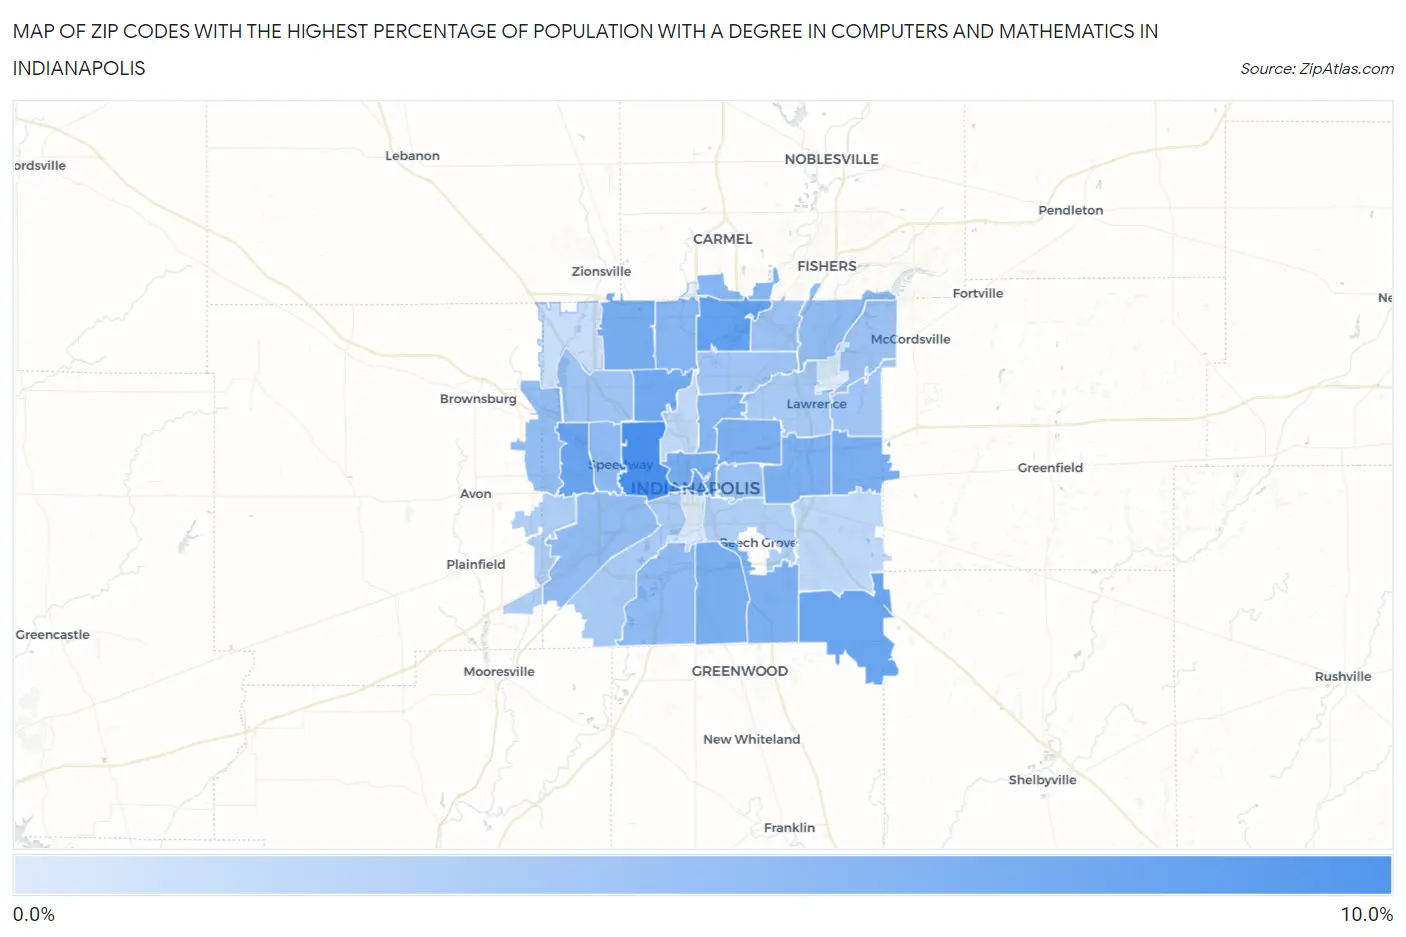
Map of Zip Codes with the Highest Percentage of Population with a Degree in Computers and Mathematics in Indianapolis

0.0%
10.0%
Zip Codes with the Highest Percentage of Population with a Degree in Computers and Mathematics in Indianapolis Map

Zip Codes with the Highest Percentage of Population with a Degree in Computers and Mathematics in Indianapolis, IN

Zip Code % Graduates vs State vs National
1.462228.3%4.2%(+4.06)#604.9%(+3.41)#2,666
2.462406.8%4.2%(+2.59)#854.9%(+1.94)#4,016
3.462146.7%4.2%(+2.41)#944.9%(+1.76)#4,268
4.462046.5%4.2%(+2.28)#964.9%(+1.63)#4,415
5.462596.4%4.2%(+2.12)#1014.9%(+1.47)#4,663
6.462286.0%4.2%(+1.71)#1124.9%(+1.07)#5,362
7.462025.9%4.2%(+1.67)#1144.9%(+1.03)#5,438
8.462685.9%4.2%(+1.67)#1164.9%(+1.02)#5,452
9.462275.7%4.2%(+1.49)#1244.9%(+0.847)#5,795
10.462295.6%4.2%(+1.36)#1334.9%(+0.710)#6,060
11.462185.6%4.2%(+1.34)#1344.9%(+0.696)#6,085
12.462195.6%4.2%(+1.32)#1364.9%(+0.678)#6,133
13.462375.5%4.2%(+1.28)#1384.9%(+0.629)#6,255
14.462605.1%4.2%(+0.850)#1604.9%(+0.203)#7,219
15.462055.1%4.2%(+0.819)#1644.9%(+0.172)#7,289
16.462805.1%4.2%(+0.810)#1664.9%(+0.164)#7,312
17.462244.6%4.2%(+0.368)#1914.9%(-0.279)#8,533
18.462174.6%4.2%(+0.323)#1944.9%(-0.324)#8,649
19.462414.5%4.2%(+0.233)#2054.9%(-0.414)#8,939
20.462564.4%4.2%(+0.184)#2094.9%(-0.463)#9,088
21.462344.3%4.2%(+0.061)#2224.9%(-0.586)#9,517
22.462014.0%4.2%(-0.286)#2504.9%(-0.933)#10,585
23.462363.8%4.2%(-0.406)#2584.9%(-1.05)#11,042
24.462503.8%4.2%(-0.413)#2594.9%(-1.06)#11,061
25.462543.7%4.2%(-0.547)#2704.9%(-1.19)#11,544
26.462203.7%4.2%(-0.590)#2734.9%(-1.24)#11,685
27.462353.6%4.2%(-0.627)#2764.9%(-1.27)#11,818
28.462263.3%4.2%(-0.928)#2994.9%(-1.57)#12,952
29.462213.2%4.2%(-1.00)#3044.9%(-1.65)#13,208
30.462313.0%4.2%(-1.29)#3324.9%(-1.94)#14,226
31.462032.8%4.2%(-1.43)#3414.9%(-2.08)#14,735
32.462392.1%4.2%(-2.11)#3844.9%(-2.76)#17,189
33.462082.1%4.2%(-2.15)#3854.9%(-2.79)#17,287
34.462781.7%4.2%(-2.55)#4214.9%(-3.20)#18,540
35.462250.72%4.2%(-3.52)#4784.9%(-4.17)#21,110
36.462160.63%4.2%(-3.62)#4864.9%(-4.27)#21,260

Common Questions

What are the Top 10 Zip Codes with the Highest Percentage of Population with a Degree in Computers and Mathematics in Indianapolis, IN?
Top 10 Zip Codes with the Highest Percentage of Population with a Degree in Computers and Mathematics in Indianapolis, IN are:
#1
8.3%
#2
6.8%
#3
6.7%
#4
6.5%
#5
6.4%
#6
6.0%
#7
5.9%
#8
5.9%
#9
5.7%
#10
5.6%
What zip code has the Highest Percentage of Population with a Degree in Computers and Mathematics in Indianapolis, IN?
46222 has the Highest Percentage of Population with a Degree in Computers and Mathematics in Indianapolis, IN with 8.3%.
What is the Percentage of Population with a Degree in Computers and Mathematics in Indianapolis, IN?
Percentage of Population with a Degree in Computers and Mathematics in Indianapolis is 4.7%.
What is the Percentage of Population with a Degree in Computers and Mathematics in Indiana?
Percentage of Population with a Degree in Computers and Mathematics in Indiana is 4.2%.
What is the Percentage of Population with a Degree in Computers and Mathematics in the United States?
Percentage of Population with a Degree in Computers and Mathematics in the United States is 4.9%.