Zip Codes with the Highest Percentage of Population with a Degree in Science and Engineering in Indianapolis, IN

RELATED REPORTS & OPTIONS

Science and Engineering
Population
Families and Households
Female Fertility
Female Fertility (Unmarried)
Race (Community Size)
Race (Percentage)
Ancestry (Community Size)
AfghanAfricanAlaskan AthabascanAlbanianAlsatianAmericanApacheArabArgentineanArmenianAustralianAustrianBahamianBangladeshiBarbadianBasqueBelgianBelizeanBhutaneseBlackfeetBolivianBrazilianBritishBritish West IndianBulgarianBurmeseCajunCanadianCelticCentral AmericanCentral American IndianCherokeeChickasawChileanChippewaChoctawColombianCosta RicanCroatianCrowCubanCzechCzechoslovakianDanishDominicanDutchEastern EuropeanEcuadorianEgyptianEnglishEstonianEthiopianEuropeanFilipinoFinnishFrenchFrench CanadianGermanGerman RussianGhanaianGreekGuamanian / ChamorroGuatemalanGuyaneseHaitianHonduranHopiHungarianIcelanderIndian (Asian)IndonesianInupiatIranianIraqiIrishIroquoisIsraeliItalianJamaicanJapaneseJordanianKenyanKoreanLaotianLatvianLebaneseLiberianLithuanianLuxembourgerMacedonianMalaysianMenomineeMexicanMexican American IndianMongolianMoroccanNative HawaiianNavajoNew ZealanderNicaraguanNigerianNorthern EuropeanNorwegianPakistaniPalestinianPanamanianPennsylvania GermanPeruvianPolishPortuguesePotawatomiPuerto RicanRomanianRussianSalvadoranSamoanScandinavianScotch-IrishScottishSeminoleSenegaleseSerbianSierra LeoneanSiouxSlavicSlovakSloveneSouth AfricanSouth AmericanSouth American IndianSpaniardSpanishSri LankanSubsaharan AfricanSudaneseSwedishSwissSyrianThaiTonganTrinidadian and TobagonianTurkishUgandanUkrainianUruguayanVenezuelanVietnameseWelshWest IndianYugoslavianZimbabwean
Ancestry (Percentage)
AfghanAfricanAlaskan AthabascanAlbanianAlsatianAmericanApacheArabArgentineanArmenianAustralianAustrianBahamianBangladeshiBarbadianBasqueBelgianBelizeanBhutaneseBlackfeetBolivianBrazilianBritishBritish West IndianBulgarianBurmeseCajunCanadianCelticCentral AmericanCentral American IndianCherokeeChickasawChileanChippewaChoctawColombianCosta RicanCroatianCrowCubanCzechCzechoslovakianDanishDominicanDutchEastern EuropeanEcuadorianEgyptianEnglishEstonianEthiopianEuropeanFilipinoFinnishFrenchFrench CanadianGermanGerman RussianGhanaianGreekGuamanian / ChamorroGuatemalanGuyaneseHaitianHonduranHopiHungarianIcelanderIndian (Asian)IndonesianInupiatIranianIraqiIrishIroquoisIsraeliItalianJamaicanJapaneseJordanianKenyanKoreanLaotianLatvianLebaneseLiberianLithuanianLuxembourgerMacedonianMalaysianMenomineeMexicanMexican American IndianMongolianMoroccanNative HawaiianNavajoNew ZealanderNicaraguanNigerianNorthern EuropeanNorwegianPakistaniPalestinianPanamanianPennsylvania GermanPeruvianPolishPortuguesePotawatomiPuerto RicanRomanianRussianSalvadoranSamoanScandinavianScotch-IrishScottishSeminoleSenegaleseSerbianSierra LeoneanSiouxSlavicSlovakSloveneSouth AfricanSouth AmericanSouth American IndianSpaniardSpanishSri LankanSubsaharan AfricanSudaneseSwedishSwissSyrianThaiTonganTrinidadian and TobagonianTurkishUgandanUkrainianUruguayanVenezuelanVietnameseWelshWest IndianYugoslavianZimbabwean
Immigrant Origin (Total)
AfghanistanAfricaArgentinaAsiaAustraliaAustriaBahamasBangladeshBarbadosBelarusBoliviaBosnia and HerzegovinaBrazilBulgariaBurma / MyanmarCambodiaCameroonCanadaCaribbeanCentral AmericaChileChinaColombiaCongoCosta RicaCubaDenmarkDominican RepublicEastern AfricaEastern AsiaEastern EuropeEcuadorEgyptEl SalvadorEnglandEritreaEthiopiaEuropeFranceGermanyGhanaGreeceGuatemalaGuyanaHaitiHondurasHong KongHungaryIndiaIndonesiaIranIraqIrelandIsraelItalyJamaicaJapanJordanKenyaKoreaLaosLatin AmericaLatviaLebanonLiberiaMalaysiaMexicoMiddle AfricaMoldovaMoroccoNepalNetherlandsNicaraguaNigeriaNorth MacedoniaNorthern AfricaNorthern EuropeNorwayOceaniaPakistanPanamaPeruPhilippinesPolandPortugalRomaniaRussiaSaudi ArabiaScotlandSenegalSerbiaSierra LeoneSingaporeSouth AfricaSouth AmericaSouth Central AsiaSouth Eastern AsiaSouthern EuropeSpainSt. Vincent and the GrenadinesSudanSyriaTaiwanThailandTrinidad and TobagoTurkeyUgandaUkraineUzbekistanVenezuelaVietnamWest IndiesWestern AfricaWestern AsiaWestern EuropeYemenZaireZimbabwe
Immigrant Origin (Percentage)
AfghanistanAfricaArgentinaAsiaAustraliaAustriaBahamasBangladeshBarbadosBelarusBoliviaBosnia and HerzegovinaBrazilBulgariaBurma / MyanmarCambodiaCameroonCanadaCaribbeanCentral AmericaChileChinaColombiaCongoCosta RicaCubaDenmarkDominican RepublicEastern AfricaEastern AsiaEastern EuropeEcuadorEgyptEl SalvadorEnglandEritreaEthiopiaEuropeFranceGermanyGhanaGreeceGuatemalaGuyanaHaitiHondurasHong KongHungaryIndiaIndonesiaIranIraqIrelandIsraelItalyJamaicaJapanJordanKenyaKoreaLaosLatin AmericaLatviaLebanonLiberiaMalaysiaMexicoMiddle AfricaMoldovaMoroccoNepalNetherlandsNicaraguaNigeriaNorth MacedoniaNorthern AfricaNorthern EuropeNorwayOceaniaPakistanPanamaPeruPhilippinesPolandPortugalRomaniaRussiaSaudi ArabiaScotlandSenegalSerbiaSierra LeoneSingaporeSouth AfricaSouth AmericaSouth Central AsiaSouth Eastern AsiaSouthern EuropeSpainSt. Vincent and the GrenadinesSudanSyriaTaiwanThailandTrinidad and TobagoTurkeyUgandaUkraineUzbekistanVenezuelaVietnamWest IndiesWestern AfricaWestern AsiaWestern EuropeYemenZaireZimbabwe
Income
Income (Families)
Income (Households)
Poverty
Poverty (Families)
Unemployment
Employment Occupations
Employment Industries
Employer Class
Commute Time
Commute Means
School Enrollment
Education by Degree Field
Occupancy
Finances
Physical Characteristics
Indianapolis
Compare Zip Codes
Comparison Subject

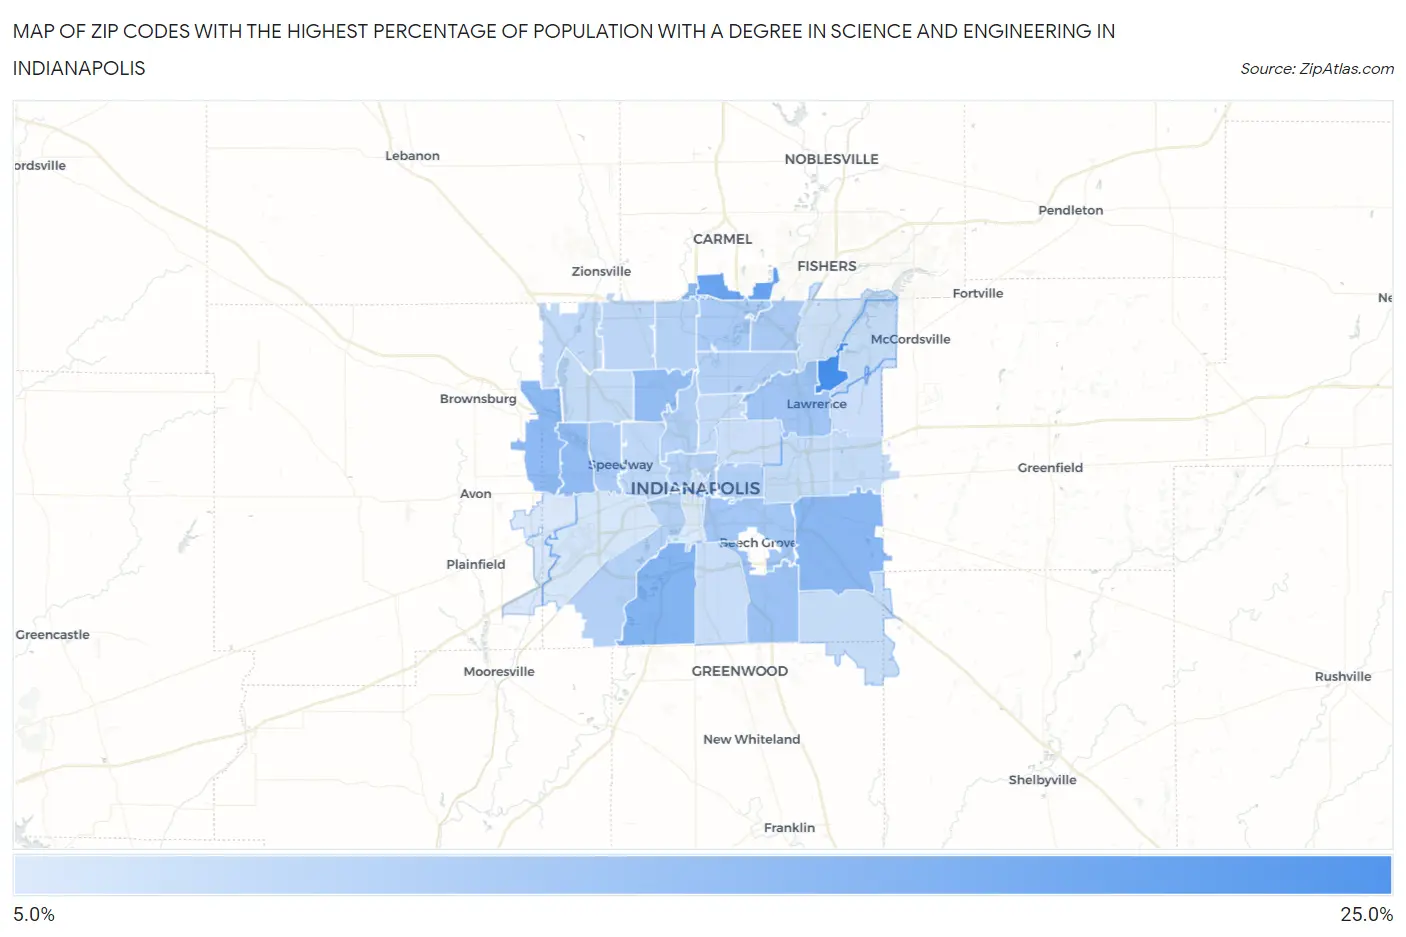
Map of Zip Codes with the Highest Percentage of Population with a Degree in Science and Engineering in Indianapolis

0.0%
25.0%
Zip Codes with the Highest Percentage of Population with a Degree in Science and Engineering in Indianapolis Map

Zip Codes with the Highest Percentage of Population with a Degree in Science and Engineering in Indianapolis, IN

Zip Code % Graduates vs State vs National
1.4621623.5%12.7%(+10.9)#849.8%(+13.8)#2,249
2.4628019.6%12.7%(+6.97)#1309.8%(+9.86)#3,495
3.4621716.2%12.7%(+3.55)#2139.8%(+6.44)#5,557
4.4623915.6%12.7%(+2.89)#2369.8%(+5.78)#6,123
5.4629015.6%12.7%(+2.89)#2389.8%(+5.77)#6,139
6.4623414.9%12.7%(+2.24)#2639.8%(+5.13)#6,816
7.4621414.6%12.7%(+1.94)#2769.8%(+4.83)#7,110
8.4622814.5%12.7%(+1.83)#2829.8%(+4.71)#7,249
9.4623713.5%12.7%(+0.814)#3189.8%(+3.70)#8,521
10.4622612.9%12.7%(+0.218)#3399.8%(+3.11)#9,421
11.4620312.7%12.7%(+0.029)#3529.8%(+2.92)#9,708
12.4625011.9%12.7%(-0.773)#3939.8%(+2.11)#11,091
13.4624011.7%12.7%(-0.920)#3979.8%(+1.97)#11,379
14.4622411.7%12.7%(-0.978)#4029.8%(+1.91)#11,487
15.4620810.9%12.7%(-1.78)#4379.8%(+1.11)#13,099
16.4620110.7%12.7%(-1.96)#4439.8%(+0.927)#13,506
17.4622110.7%12.7%(-1.98)#4469.8%(+0.906)#13,555
18.4622010.6%12.7%(-2.03)#4509.8%(+0.857)#13,668
19.4620210.6%12.7%(-2.04)#4519.8%(+0.851)#13,675
20.4626010.6%12.7%(-2.11)#4549.8%(+0.776)#13,820
21.462689.8%12.7%(-2.91)#4849.8%(-0.020)#15,548
22.462229.5%12.7%(-3.17)#4949.8%(-0.285)#16,184
23.462789.4%12.7%(-3.23)#4969.8%(-0.342)#16,301
24.462549.1%12.7%(-3.59)#5119.8%(-0.704)#17,159
25.462059.0%12.7%(-3.64)#5139.8%(-0.758)#17,291
26.462298.9%12.7%(-3.73)#5159.8%(-0.838)#17,460
27.462368.8%12.7%(-3.86)#5209.8%(-0.977)#17,787
28.462598.8%12.7%(-3.90)#5219.8%(-1.02)#17,876
29.462198.7%12.7%(-3.99)#5259.8%(-1.10)#18,087
30.462278.4%12.7%(-4.30)#5379.8%(-1.42)#18,781
31.462188.2%12.7%(-4.45)#5429.8%(-1.56)#19,154
32.462358.1%12.7%(-4.53)#5459.8%(-1.64)#19,347
33.462568.1%12.7%(-4.60)#5489.8%(-1.72)#19,484
34.462047.6%12.7%(-5.05)#5619.8%(-2.16)#20,495
35.462417.0%12.7%(-5.69)#5709.8%(-2.80)#21,754
36.462316.5%12.7%(-6.17)#5839.8%(-3.28)#22,589
37.462256.2%12.7%(-6.44)#5969.8%(-3.55)#23,062

Common Questions

What are the Top 10 Zip Codes with the Highest Percentage of Population with a Degree in Science and Engineering in Indianapolis, IN?
Top 10 Zip Codes with the Highest Percentage of Population with a Degree in Science and Engineering in Indianapolis, IN are:
#1
23.5%
#2
19.6%
#3
16.2%
#4
15.6%
#5
15.6%
#6
14.9%
#7
14.6%
#8
14.5%
#9
13.5%
#10
12.9%
What zip code has the Highest Percentage of Population with a Degree in Science and Engineering in Indianapolis, IN?
46216 has the Highest Percentage of Population with a Degree in Science and Engineering in Indianapolis, IN with 23.5%.
What is the Percentage of Population with a Degree in Science and Engineering in Indianapolis, IN?
Percentage of Population with a Degree in Science and Engineering in Indianapolis is 11.0%.
What is the Percentage of Population with a Degree in Science and Engineering in Indiana?
Percentage of Population with a Degree in Science and Engineering in Indiana is 12.7%.
What is the Percentage of Population with a Degree in Science and Engineering in the United States?
Percentage of Population with a Degree in Science and Engineering in the United States is 9.8%.