Zip Codes with the Highest Percentage of Population Employed in Office & Administration in Indianapolis, IN
RELATED REPORTS & OPTIONS
Office & Administration
Indianapolis
Compare Zip Codes
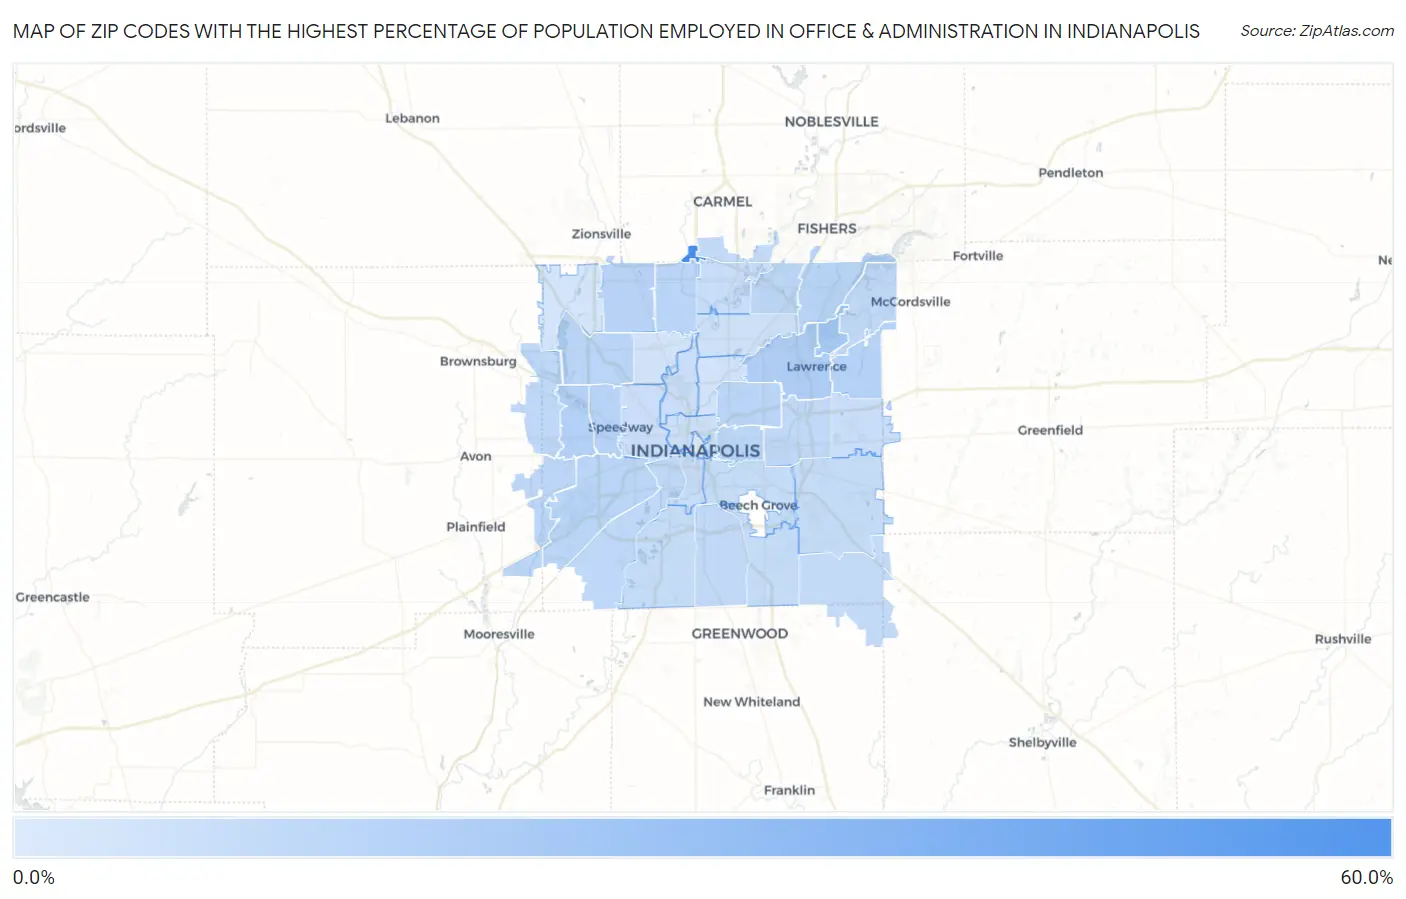
Map of Zip Codes with the Highest Percentage of Population Employed in Office & Administration in Indianapolis
4.6%
55.2%
Zip Codes with the Highest Percentage of Population Employed in Office & Administration in Indianapolis, IN
| Zip Code | % Employed | vs State | vs National | |
| 1. | 46290 | 55.2% | 11.0%(+44.2)#2 | 10.9%(+44.3)#87 |
| 2. | 46216 | 20.2% | 11.0%(+9.22)#26 | 10.9%(+9.35)#1,646 |
| 3. | 46226 | 17.8% | 11.0%(+6.84)#39 | 10.9%(+6.97)#2,438 |
| 4. | 46214 | 16.4% | 11.0%(+5.39)#56 | 10.9%(+5.53)#3,267 |
| 5. | 46235 | 16.3% | 11.0%(+5.30)#57 | 10.9%(+5.43)#3,338 |
| 6. | 46268 | 15.6% | 11.0%(+4.62)#71 | 10.9%(+4.75)#3,914 |
| 7. | 46224 | 15.4% | 11.0%(+4.43)#76 | 10.9%(+4.56)#4,081 |
| 8. | 46260 | 14.9% | 11.0%(+3.92)#94 | 10.9%(+4.06)#4,666 |
| 9. | 46256 | 14.8% | 11.0%(+3.84)#98 | 10.9%(+3.97)#4,795 |
| 10. | 46254 | 14.6% | 11.0%(+3.63)#102 | 10.9%(+3.76)#5,092 |
| 11. | 46218 | 14.5% | 11.0%(+3.56)#104 | 10.9%(+3.69)#5,192 |
| 12. | 46241 | 14.3% | 11.0%(+3.28)#113 | 10.9%(+3.42)#5,604 |
| 13. | 46250 | 14.2% | 11.0%(+3.17)#117 | 10.9%(+3.30)#5,772 |
| 14. | 46231 | 13.9% | 11.0%(+2.90)#123 | 10.9%(+3.03)#6,222 |
| 15. | 46201 | 13.8% | 11.0%(+2.81)#125 | 10.9%(+2.94)#6,366 |
| 16. | 46234 | 13.1% | 11.0%(+2.08)#155 | 10.9%(+2.21)#7,902 |
| 17. | 46221 | 13.1% | 11.0%(+2.07)#157 | 10.9%(+2.20)#7,942 |
| 18. | 46236 | 12.7% | 11.0%(+1.68)#184 | 10.9%(+1.81)#8,877 |
| 19. | 46227 | 12.2% | 11.0%(+1.19)#208 | 10.9%(+1.32)#10,209 |
| 20. | 46219 | 12.2% | 11.0%(+1.19)#209 | 10.9%(+1.32)#10,216 |
| 21. | 46280 | 12.0% | 11.0%(+1.03)#226 | 10.9%(+1.16)#10,679 |
| 22. | 46259 | 11.7% | 11.0%(+0.673)#257 | 10.9%(+0.805)#11,756 |
| 23. | 46203 | 11.3% | 11.0%(+0.341)#285 | 10.9%(+0.473)#12,801 |
| 24. | 46237 | 11.3% | 11.0%(+0.286)#289 | 10.9%(+0.418)#12,962 |
| 25. | 46239 | 11.2% | 11.0%(+0.232)#294 | 10.9%(+0.363)#13,150 |
| 26. | 46217 | 10.9% | 11.0%(-0.092)#322 | 10.9%(+0.040)#14,198 |
| 27. | 46229 | 10.6% | 11.0%(-0.420)#350 | 10.9%(-0.288)#15,241 |
| 28. | 46240 | 10.4% | 11.0%(-0.550)#359 | 10.9%(-0.418)#15,698 |
| 29. | 46225 | 10.4% | 11.0%(-0.564)#361 | 10.9%(-0.433)#15,741 |
| 30. | 46208 | 10.0% | 11.0%(-0.958)#389 | 10.9%(-0.827)#17,026 |
| 31. | 46222 | 9.9% | 11.0%(-1.09)#405 | 10.9%(-0.956)#17,449 |
| 32. | 46202 | 9.2% | 11.0%(-1.74)#455 | 10.9%(-1.61)#19,541 |
| 33. | 46220 | 8.5% | 11.0%(-2.50)#512 | 10.9%(-2.37)#21,720 |
| 34. | 46228 | 8.1% | 11.0%(-2.84)#535 | 10.9%(-2.71)#22,669 |
| 35. | 46205 | 7.6% | 11.0%(-3.34)#566 | 10.9%(-3.21)#23,830 |
| 36. | 46278 | 7.2% | 11.0%(-3.80)#592 | 10.9%(-3.67)#24,858 |
| 37. | 46204 | 4.6% | 11.0%(-6.39)#688 | 10.9%(-6.26)#28,473 |
1
Common Questions
What are the Top 10 Zip Codes with the Highest Percentage of Population Employed in Office & Administration in Indianapolis, IN?
Top 10 Zip Codes with the Highest Percentage of Population Employed in Office & Administration in Indianapolis, IN are:
What zip code has the Highest Percentage of Population Employed in Office & Administration in Indianapolis, IN?
46290 has the Highest Percentage of Population Employed in Office & Administration in Indianapolis, IN with 55.2%.
What is the Percentage of Population Employed in Office & Administration in Indianapolis, IN?
Percentage of Population Employed in Office & Administration in Indianapolis is 12.3%.
What is the Percentage of Population Employed in Office & Administration in Indiana?
Percentage of Population Employed in Office & Administration in Indiana is 11.0%.
What is the Percentage of Population Employed in Office & Administration in the United States?
Percentage of Population Employed in Office & Administration in the United States is 10.9%.