Zip Codes with the Highest Percentage of Population Employed in Community & Social Service in Indianapolis, IN

RELATED REPORTS & OPTIONS

Community & Social Service
Population
Families and Households
Female Fertility
Female Fertility (Unmarried)
Race (Community Size)
Race (Percentage)
Ancestry (Community Size)
AfghanAfricanAlaskan AthabascanAlbanianAlsatianAmericanApacheArabArgentineanArmenianAustralianAustrianBahamianBangladeshiBarbadianBasqueBelgianBelizeanBhutaneseBlackfeetBolivianBrazilianBritishBritish West IndianBulgarianBurmeseCajunCanadianCelticCentral AmericanCentral American IndianCherokeeChickasawChileanChippewaChoctawColombianCosta RicanCroatianCrowCubanCzechCzechoslovakianDanishDominicanDutchEastern EuropeanEcuadorianEgyptianEnglishEstonianEthiopianEuropeanFilipinoFinnishFrenchFrench CanadianGermanGerman RussianGhanaianGreekGuamanian / ChamorroGuatemalanGuyaneseHaitianHonduranHopiHungarianIcelanderIndian (Asian)IndonesianInupiatIranianIraqiIrishIroquoisIsraeliItalianJamaicanJapaneseJordanianKenyanKoreanLaotianLatvianLebaneseLiberianLithuanianLuxembourgerMacedonianMalaysianMenomineeMexicanMexican American IndianMongolianMoroccanNative HawaiianNavajoNew ZealanderNicaraguanNigerianNorthern EuropeanNorwegianPakistaniPalestinianPanamanianPennsylvania GermanPeruvianPolishPortuguesePotawatomiPuerto RicanRomanianRussianSalvadoranSamoanScandinavianScotch-IrishScottishSeminoleSenegaleseSerbianSierra LeoneanSiouxSlavicSlovakSloveneSouth AfricanSouth AmericanSouth American IndianSpaniardSpanishSri LankanSubsaharan AfricanSudaneseSwedishSwissSyrianThaiTonganTrinidadian and TobagonianTurkishUgandanUkrainianUruguayanVenezuelanVietnameseWelshWest IndianYugoslavianZimbabwean
Ancestry (Percentage)
AfghanAfricanAlaskan AthabascanAlbanianAlsatianAmericanApacheArabArgentineanArmenianAustralianAustrianBahamianBangladeshiBarbadianBasqueBelgianBelizeanBhutaneseBlackfeetBolivianBrazilianBritishBritish West IndianBulgarianBurmeseCajunCanadianCelticCentral AmericanCentral American IndianCherokeeChickasawChileanChippewaChoctawColombianCosta RicanCroatianCrowCubanCzechCzechoslovakianDanishDominicanDutchEastern EuropeanEcuadorianEgyptianEnglishEstonianEthiopianEuropeanFilipinoFinnishFrenchFrench CanadianGermanGerman RussianGhanaianGreekGuamanian / ChamorroGuatemalanGuyaneseHaitianHonduranHopiHungarianIcelanderIndian (Asian)IndonesianInupiatIranianIraqiIrishIroquoisIsraeliItalianJamaicanJapaneseJordanianKenyanKoreanLaotianLatvianLebaneseLiberianLithuanianLuxembourgerMacedonianMalaysianMenomineeMexicanMexican American IndianMongolianMoroccanNative HawaiianNavajoNew ZealanderNicaraguanNigerianNorthern EuropeanNorwegianPakistaniPalestinianPanamanianPennsylvania GermanPeruvianPolishPortuguesePotawatomiPuerto RicanRomanianRussianSalvadoranSamoanScandinavianScotch-IrishScottishSeminoleSenegaleseSerbianSierra LeoneanSiouxSlavicSlovakSloveneSouth AfricanSouth AmericanSouth American IndianSpaniardSpanishSri LankanSubsaharan AfricanSudaneseSwedishSwissSyrianThaiTonganTrinidadian and TobagonianTurkishUgandanUkrainianUruguayanVenezuelanVietnameseWelshWest IndianYugoslavianZimbabwean
Immigrant Origin (Total)
AfghanistanAfricaArgentinaAsiaAustraliaAustriaBahamasBangladeshBarbadosBelarusBoliviaBosnia and HerzegovinaBrazilBulgariaBurma / MyanmarCambodiaCameroonCanadaCaribbeanCentral AmericaChileChinaColombiaCongoCosta RicaCubaDenmarkDominican RepublicEastern AfricaEastern AsiaEastern EuropeEcuadorEgyptEl SalvadorEnglandEritreaEthiopiaEuropeFranceGermanyGhanaGreeceGuatemalaGuyanaHaitiHondurasHong KongHungaryIndiaIndonesiaIranIraqIrelandIsraelItalyJamaicaJapanJordanKenyaKoreaLaosLatin AmericaLatviaLebanonLiberiaMalaysiaMexicoMiddle AfricaMoldovaMoroccoNepalNetherlandsNicaraguaNigeriaNorth MacedoniaNorthern AfricaNorthern EuropeNorwayOceaniaPakistanPanamaPeruPhilippinesPolandPortugalRomaniaRussiaSaudi ArabiaScotlandSenegalSerbiaSierra LeoneSingaporeSouth AfricaSouth AmericaSouth Central AsiaSouth Eastern AsiaSouthern EuropeSpainSt. Vincent and the GrenadinesSudanSyriaTaiwanThailandTrinidad and TobagoTurkeyUgandaUkraineUzbekistanVenezuelaVietnamWest IndiesWestern AfricaWestern AsiaWestern EuropeYemenZaireZimbabwe
Immigrant Origin (Percentage)
AfghanistanAfricaArgentinaAsiaAustraliaAustriaBahamasBangladeshBarbadosBelarusBoliviaBosnia and HerzegovinaBrazilBulgariaBurma / MyanmarCambodiaCameroonCanadaCaribbeanCentral AmericaChileChinaColombiaCongoCosta RicaCubaDenmarkDominican RepublicEastern AfricaEastern AsiaEastern EuropeEcuadorEgyptEl SalvadorEnglandEritreaEthiopiaEuropeFranceGermanyGhanaGreeceGuatemalaGuyanaHaitiHondurasHong KongHungaryIndiaIndonesiaIranIraqIrelandIsraelItalyJamaicaJapanJordanKenyaKoreaLaosLatin AmericaLatviaLebanonLiberiaMalaysiaMexicoMiddle AfricaMoldovaMoroccoNepalNetherlandsNicaraguaNigeriaNorth MacedoniaNorthern AfricaNorthern EuropeNorwayOceaniaPakistanPanamaPeruPhilippinesPolandPortugalRomaniaRussiaSaudi ArabiaScotlandSenegalSerbiaSierra LeoneSingaporeSouth AfricaSouth AmericaSouth Central AsiaSouth Eastern AsiaSouthern EuropeSpainSt. Vincent and the GrenadinesSudanSyriaTaiwanThailandTrinidad and TobagoTurkeyUgandaUkraineUzbekistanVenezuelaVietnamWest IndiesWestern AfricaWestern AsiaWestern EuropeYemenZaireZimbabwe
Income
Income (Families)
Income (Households)
Poverty
Poverty (Families)
Unemployment
Employment Occupations
Employment Industries
Employer Class
Commute Time
Commute Means
School Enrollment
Education by Degree Field
Occupancy
Finances
Physical Characteristics
Indianapolis
Compare Zip Codes
Comparison Subject

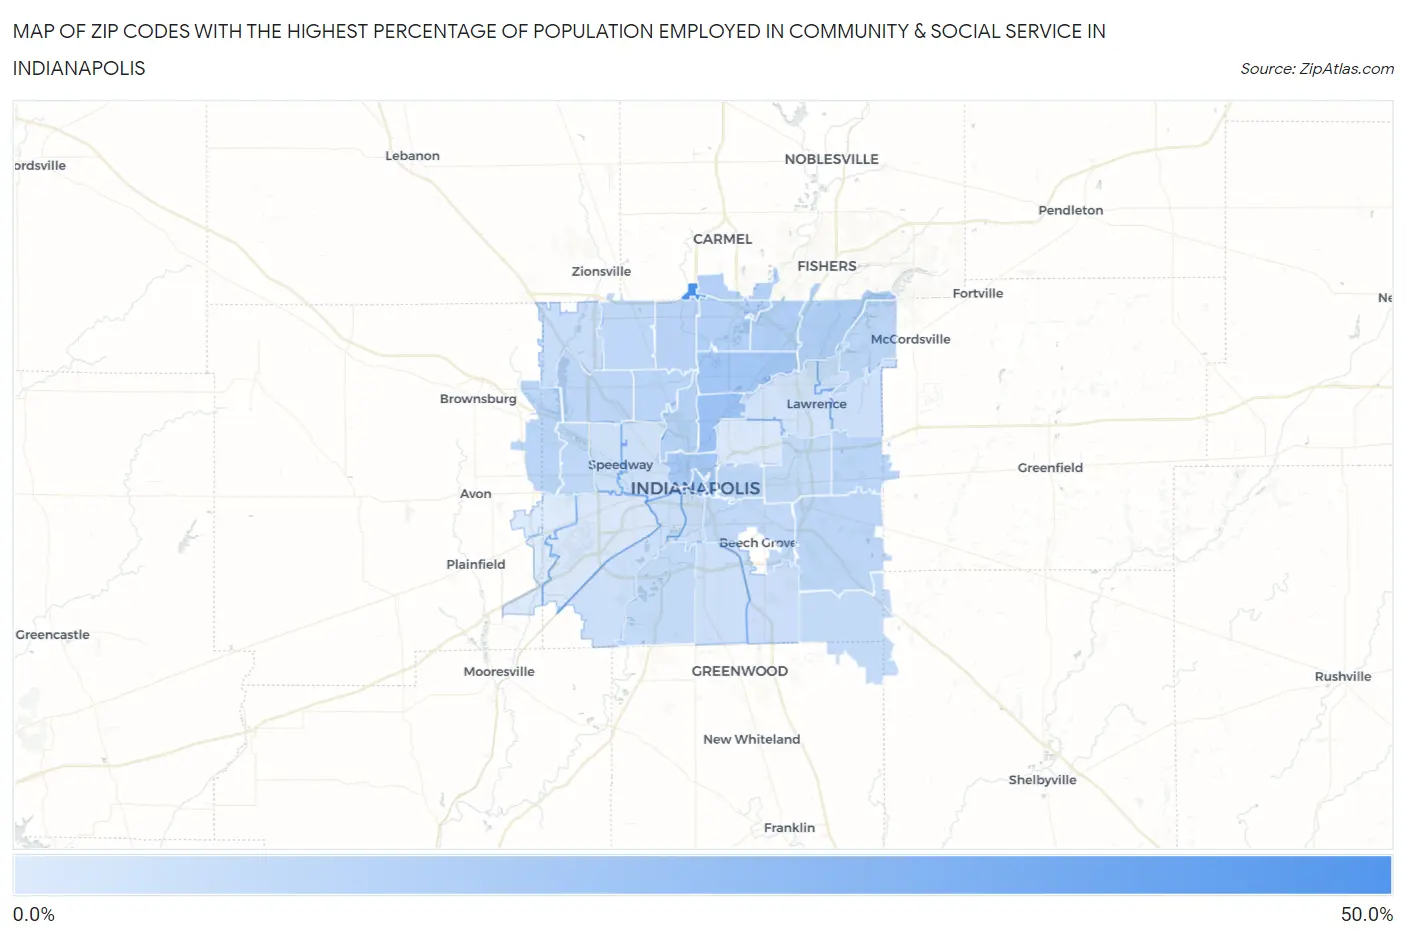
Map of Zip Codes with the Highest Percentage of Population Employed in Community & Social Service in Indianapolis

0.0%
50.0%
Zip Codes with the Highest Percentage of Population Employed in Community & Social Service  in Indianapolis Map

Zip Codes with the Highest Percentage of Population Employed in Community & Social Service in Indianapolis, IN

Zip Code % Employed vs State vs National
1.4629044.8%9.7%(+35.1)#111.2%(+33.6)#225
2.4620519.4%9.7%(+9.69)#1911.2%(+8.20)#2,231
3.4622017.7%9.7%(+8.02)#2611.2%(+6.53)#2,950
4.4620417.5%9.7%(+7.76)#2711.2%(+6.27)#3,069
5.4620217.0%9.7%(+7.31)#3611.2%(+5.82)#3,358
6.4625014.1%9.7%(+4.42)#6611.2%(+2.93)#5,900
7.4625613.8%9.7%(+4.03)#7211.2%(+2.54)#6,416
8.4624013.6%9.7%(+3.89)#7511.2%(+2.40)#6,595
9.4628013.3%9.7%(+3.61)#8011.2%(+2.12)#7,018
10.4620813.0%9.7%(+3.28)#8811.2%(+1.79)#7,543
11.4626012.4%9.7%(+2.71)#10511.2%(+1.22)#8,542
12.4622811.9%9.7%(+2.18)#12511.2%(+0.695)#9,562
13.4623411.8%9.7%(+2.07)#12911.2%(+0.583)#9,768
14.4622911.8%9.7%(+2.05)#13111.2%(+0.561)#9,827
15.4625411.3%9.7%(+1.53)#14711.2%(+0.043)#10,998
16.4623611.2%9.7%(+1.44)#14811.2%(-0.046)#11,209
17.4620110.9%9.7%(+1.21)#15411.2%(-0.280)#11,800
18.4623910.9%9.7%(+1.13)#16411.2%(-0.355)#11,994
19.4626810.4%9.7%(+0.702)#18511.2%(-0.787)#13,050
20.4621410.2%9.7%(+0.481)#20211.2%(-1.01)#13,595
21.4620310.1%9.7%(+0.358)#21011.2%(-1.13)#13,919
22.462599.6%9.7%(-0.154)#24111.2%(-1.64)#15,221
23.462199.1%9.7%(-0.632)#27311.2%(-2.12)#16,545
24.462179.1%9.7%(-0.645)#27411.2%(-2.13)#16,610
25.462788.5%9.7%(-1.25)#31111.2%(-2.74)#18,256
26.462377.9%9.7%(-1.84)#35911.2%(-3.33)#19,913
27.462257.6%9.7%(-2.16)#38411.2%(-3.65)#20,711
28.462167.4%9.7%(-2.31)#39611.2%(-3.80)#21,107
29.462277.3%9.7%(-2.46)#40911.2%(-3.95)#21,479
30.462217.2%9.7%(-2.52)#41911.2%(-4.01)#21,651
31.462357.0%9.7%(-2.76)#44411.2%(-4.25)#22,221
32.462226.7%9.7%(-3.04)#45711.2%(-4.53)#22,843
33.462246.7%9.7%(-3.07)#46011.2%(-4.56)#22,927
34.462266.1%9.7%(-3.67)#50711.2%(-5.16)#24,270
35.462414.4%9.7%(-5.30)#60411.2%(-6.79)#27,041
36.462183.6%9.7%(-6.14)#63811.2%(-7.63)#28,021
37.462313.2%9.7%(-6.48)#64811.2%(-7.97)#28,326

Common Questions

What are the Top 10 Zip Codes with the Highest Percentage of Population Employed in Community & Social Service in Indianapolis, IN?
Top 10 Zip Codes with the Highest Percentage of Population Employed in Community & Social Service in Indianapolis, IN are:
#1
44.8%
#2
19.4%
#3
17.7%
#4
17.5%
#5
17.0%
#6
14.1%
#7
13.8%
#8
13.6%
#9
13.3%
#10
13.0%
What zip code has the Highest Percentage of Population Employed in Community & Social Service in Indianapolis, IN?
46290 has the Highest Percentage of Population Employed in Community & Social Service in Indianapolis, IN with 44.8%.
What is the Percentage of Population Employed in Community & Social Service in Indianapolis, IN?
Percentage of Population Employed in Community & Social Service in Indianapolis is 10.5%.
What is the Percentage of Population Employed in Community & Social Service in Indiana?
Percentage of Population Employed in Community & Social Service in Indiana is 9.7%.
What is the Percentage of Population Employed in Community & Social Service in the United States?
Percentage of Population Employed in Community & Social Service in the United States is 11.2%.