Zip Codes with the Highest Percentage of Families with Income Above $200,000 in Indianapolis, IN
RELATED REPORTS & OPTIONS
Family Income | $200k+
Indianapolis
Compare Zip Codes
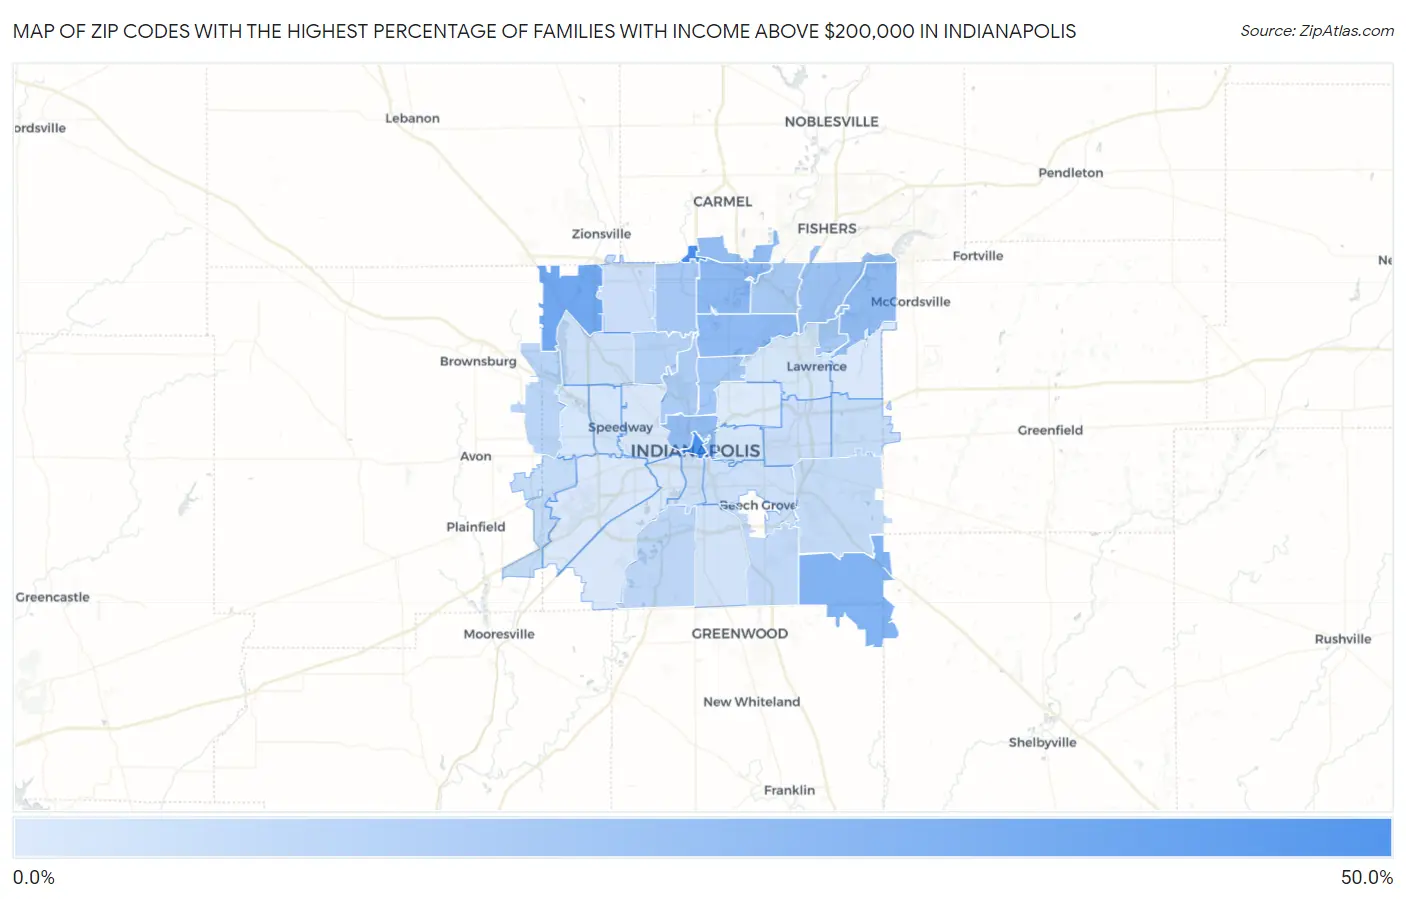
Map of Zip Codes with the Highest Percentage of Families with Income Above $200,000 in Indianapolis
1.1%
46.2%
Zip Codes with the Highest Percentage of Families with Income Above $200,000 in Indianapolis, IN
| Zip Code | Families with Income > $200k | vs State | vs National | |
| 1. | 46290 | 46.2% | 9.3%(+36.9)#3 | 14.8%(+31.4)#859 |
| 2. | 46204 | 43.4% | 9.3%(+34.1)#4 | 14.8%(+28.6)#1,031 |
| 3. | 46278 | 31.8% | 9.3%(+22.5)#10 | 14.8%(+17.0)#2,260 |
| 4. | 46259 | 26.8% | 9.3%(+17.5)#15 | 14.8%(+12.0)#3,086 |
| 5. | 46240 | 23.2% | 9.3%(+13.9)#22 | 14.8%(+8.40)#3,895 |
| 6. | 46220 | 22.7% | 9.3%(+13.4)#25 | 14.8%(+7.90)#4,010 |
| 7. | 46236 | 21.8% | 9.3%(+12.5)#26 | 14.8%(+7.00)#4,268 |
| 8. | 46202 | 21.2% | 9.3%(+11.9)#28 | 14.8%(+6.40)#4,444 |
| 9. | 46280 | 21.1% | 9.3%(+11.8)#29 | 14.8%(+6.30)#4,478 |
| 10. | 46256 | 19.5% | 9.3%(+10.2)#35 | 14.8%(+4.70)#4,968 |
| 11. | 46205 | 16.8% | 9.3%(+7.50)#53 | 14.8%(+2.00)#6,072 |
| 12. | 46260 | 16.1% | 9.3%(+6.80)#58 | 14.8%(+1.30)#6,394 |
| 13. | 46216 | 16.0% | 9.3%(+6.70)#59 | 14.8%(+1.20)#6,466 |
| 14. | 46250 | 15.3% | 9.3%(+6.00)#62 | 14.8%(+0.500)#6,801 |
| 15. | 46208 | 14.1% | 9.3%(+4.80)#78 | 14.8%(-0.700)#7,480 |
| 16. | 46228 | 11.3% | 9.3%(+2.00)#122 | 14.8%(-3.50)#9,548 |
| 17. | 46234 | 9.9% | 9.3%(+0.600)#155 | 14.8%(-4.90)#10,901 |
| 18. | 46217 | 9.6% | 9.3%(+0.300)#163 | 14.8%(-5.20)#11,194 |
| 19. | 46237 | 8.5% | 9.3%(-0.800)#198 | 14.8%(-6.30)#12,502 |
| 20. | 46239 | 7.6% | 9.3%(-1.70)#228 | 14.8%(-7.20)#13,717 |
| 21. | 46231 | 7.3% | 9.3%(-2.00)#241 | 14.8%(-7.50)#14,204 |
| 22. | 46229 | 6.7% | 9.3%(-2.60)#258 | 14.8%(-8.10)#15,188 |
| 23. | 46219 | 5.9% | 9.3%(-3.40)#302 | 14.8%(-8.90)#16,607 |
| 24. | 46268 | 5.9% | 9.3%(-3.40)#304 | 14.8%(-8.90)#16,627 |
| 25. | 46254 | 5.2% | 9.3%(-4.10)#348 | 14.8%(-9.60)#17,981 |
| 26. | 46203 | 5.0% | 9.3%(-4.30)#367 | 14.8%(-9.80)#18,401 |
| 27. | 46225 | 4.8% | 9.3%(-4.50)#381 | 14.8%(-10.0)#18,860 |
| 28. | 46227 | 4.3% | 9.3%(-5.00)#401 | 14.8%(-10.5)#19,750 |
| 29. | 46224 | 3.6% | 9.3%(-5.70)#444 | 14.8%(-11.2)#21,231 |
| 30. | 46226 | 3.1% | 9.3%(-6.20)#478 | 14.8%(-11.7)#22,243 |
| 31. | 46214 | 3.0% | 9.3%(-6.30)#487 | 14.8%(-11.8)#22,471 |
| 32. | 46201 | 2.7% | 9.3%(-6.60)#520 | 14.8%(-12.1)#23,092 |
| 33. | 46221 | 2.4% | 9.3%(-6.90)#537 | 14.8%(-12.4)#23,697 |
| 34. | 46222 | 2.2% | 9.3%(-7.10)#544 | 14.8%(-12.6)#24,074 |
| 35. | 46235 | 1.9% | 9.3%(-7.40)#556 | 14.8%(-12.9)#24,617 |
| 36. | 46241 | 1.8% | 9.3%(-7.50)#561 | 14.8%(-13.0)#24,781 |
| 37. | 46218 | 1.1% | 9.3%(-8.20)#598 | 14.8%(-13.7)#25,916 |
1
Common Questions
What are the Top 10 Zip Codes with the Highest Percentage of Families with Income Above $200,000 in Indianapolis, IN?
Top 10 Zip Codes with the Highest Percentage of Families with Income Above $200,000 in Indianapolis, IN are:
What zip code has the Highest Percentage of Families with Income Above $200,000 in Indianapolis, IN?
46290 has the Highest Percentage of Families with Income Above $200,000 in Indianapolis, IN with 46.2%.
What is the Percentage of Families with Income Above $200,000 in Indianapolis, IN?
Percentage of Families with Income Above $200,000 in Indianapolis is 9.0%.
What is the Percentage of Families with Income Above $200,000 in Indiana?
Percentage of Families with Income Above $200,000 in Indiana is 9.3%.
What is the Percentage of Families with Income Above $200,000 in the United States?
Percentage of Families with Income Above $200,000 in the United States is 14.8%.