Zip Codes with the Highest Percentage of Population Employed in Food Preparation & Serving in Indianapolis, IN
RELATED REPORTS & OPTIONS
Food Preparation & Serving
Indianapolis
Compare Zip Codes
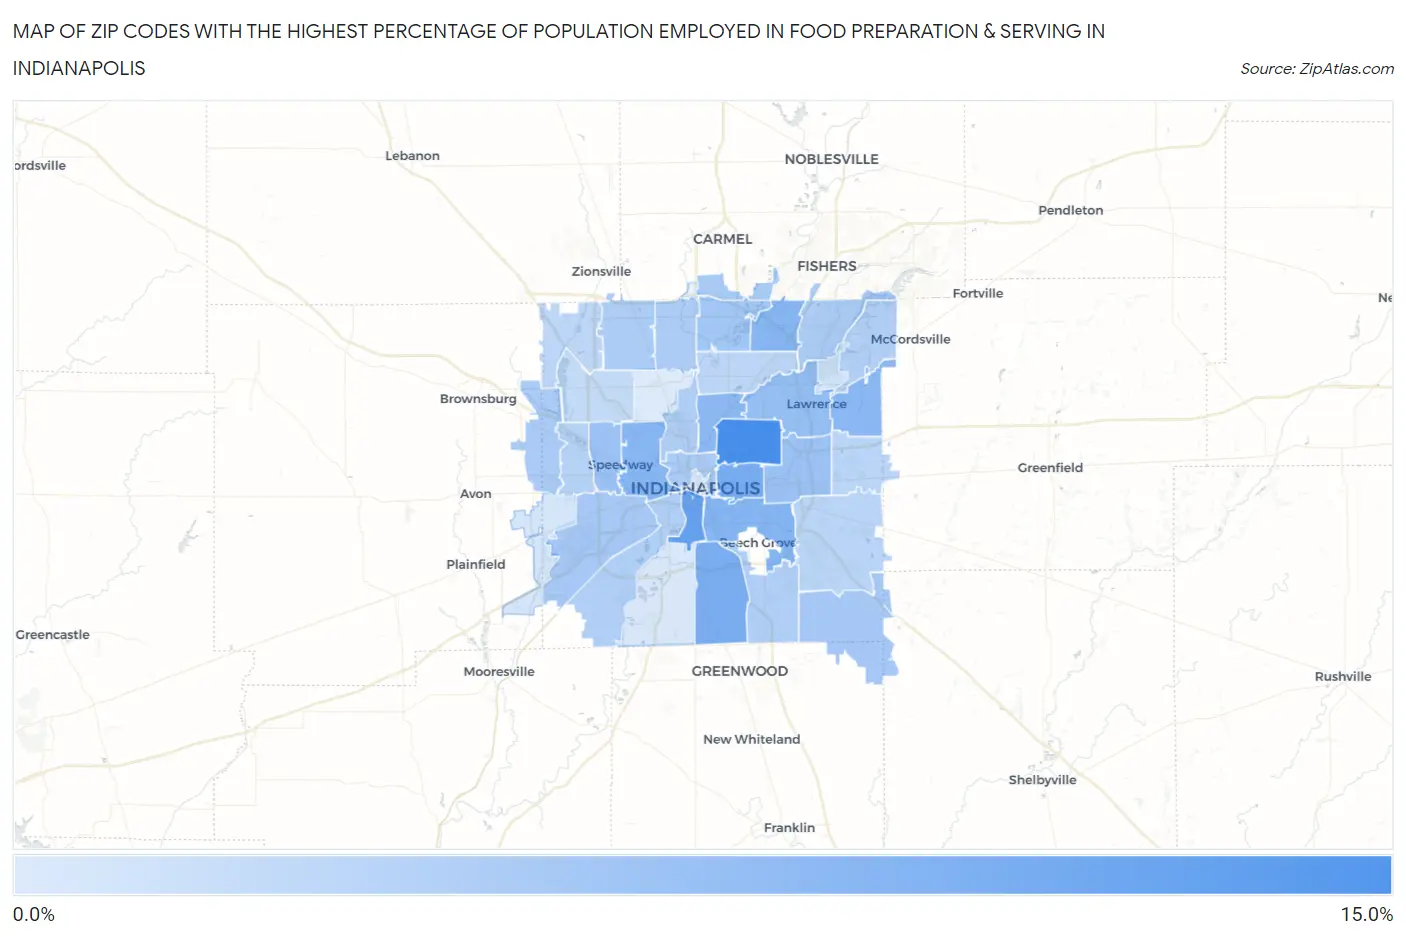
Map of Zip Codes with the Highest Percentage of Population Employed in Food Preparation & Serving in Indianapolis
1.7%
11.5%
Zip Codes with the Highest Percentage of Population Employed in Food Preparation & Serving in Indianapolis, IN
| Zip Code | % Employed | vs State | vs National | |
| 1. | 46218 | 11.5% | 5.3%(+6.15)#35 | 5.3%(+6.18)#1,855 |
| 2. | 46225 | 9.3% | 5.3%(+3.94)#72 | 5.3%(+3.97)#3,275 |
| 3. | 46201 | 8.2% | 5.3%(+2.90)#101 | 5.3%(+2.93)#4,411 |
| 4. | 46227 | 8.0% | 5.3%(+2.69)#106 | 5.3%(+2.72)#4,713 |
| 5. | 46203 | 7.3% | 5.3%(+1.96)#131 | 5.3%(+1.98)#5,985 |
| 6. | 46250 | 7.2% | 5.3%(+1.90)#134 | 5.3%(+1.93)#6,104 |
| 7. | 46222 | 7.1% | 5.3%(+1.82)#136 | 5.3%(+1.84)#6,279 |
| 8. | 46235 | 7.1% | 5.3%(+1.76)#140 | 5.3%(+1.78)#6,398 |
| 9. | 46205 | 6.9% | 5.3%(+1.61)#152 | 5.3%(+1.64)#6,765 |
| 10. | 46226 | 6.3% | 5.3%(+1.00)#198 | 5.3%(+1.03)#8,387 |
| 11. | 46224 | 6.0% | 5.3%(+0.651)#236 | 5.3%(+0.679)#9,457 |
| 12. | 46219 | 6.0% | 5.3%(+0.643)#240 | 5.3%(+0.671)#9,480 |
| 13. | 46240 | 5.4% | 5.3%(+0.040)#290 | 5.3%(+0.069)#11,564 |
| 14. | 46259 | 5.2% | 5.3%(-0.109)#303 | 5.3%(-0.081)#12,118 |
| 15. | 46241 | 5.2% | 5.3%(-0.152)#312 | 5.3%(-0.123)#12,306 |
| 16. | 46280 | 5.0% | 5.3%(-0.275)#326 | 5.3%(-0.247)#12,786 |
| 17. | 46202 | 4.9% | 5.3%(-0.417)#338 | 5.3%(-0.388)#13,356 |
| 18. | 46234 | 4.8% | 5.3%(-0.470)#347 | 5.3%(-0.441)#13,588 |
| 19. | 46260 | 4.8% | 5.3%(-0.547)#351 | 5.3%(-0.519)#13,880 |
| 20. | 46256 | 4.7% | 5.3%(-0.596)#356 | 5.3%(-0.568)#14,096 |
| 21. | 46268 | 4.7% | 5.3%(-0.614)#358 | 5.3%(-0.586)#14,158 |
| 22. | 46208 | 4.6% | 5.3%(-0.709)#365 | 5.3%(-0.681)#14,567 |
| 23. | 46237 | 4.5% | 5.3%(-0.830)#377 | 5.3%(-0.802)#15,090 |
| 24. | 46221 | 4.4% | 5.3%(-0.890)#385 | 5.3%(-0.862)#15,319 |
| 25. | 46236 | 4.4% | 5.3%(-0.936)#389 | 5.3%(-0.908)#15,518 |
| 26. | 46214 | 4.1% | 5.3%(-1.21)#419 | 5.3%(-1.18)#16,686 |
| 27. | 46229 | 3.9% | 5.3%(-1.40)#443 | 5.3%(-1.37)#17,464 |
| 28. | 46239 | 3.8% | 5.3%(-1.48)#450 | 5.3%(-1.46)#17,813 |
| 29. | 46220 | 3.7% | 5.3%(-1.59)#458 | 5.3%(-1.57)#18,246 |
| 30. | 46278 | 3.7% | 5.3%(-1.63)#463 | 5.3%(-1.61)#18,442 |
| 31. | 46254 | 3.4% | 5.3%(-1.95)#498 | 5.3%(-1.92)#19,760 |
| 32. | 46216 | 2.5% | 5.3%(-2.84)#577 | 5.3%(-2.82)#23,251 |
| 33. | 46231 | 2.1% | 5.3%(-3.19)#607 | 5.3%(-3.16)#24,329 |
| 34. | 46204 | 2.0% | 5.3%(-3.29)#616 | 5.3%(-3.26)#24,627 |
| 35. | 46217 | 2.0% | 5.3%(-3.30)#617 | 5.3%(-3.27)#24,648 |
| 36. | 46228 | 1.7% | 5.3%(-3.60)#640 | 5.3%(-3.58)#25,496 |
1
Common Questions
What are the Top 10 Zip Codes with the Highest Percentage of Population Employed in Food Preparation & Serving in Indianapolis, IN?
Top 10 Zip Codes with the Highest Percentage of Population Employed in Food Preparation & Serving in Indianapolis, IN are:
What zip code has the Highest Percentage of Population Employed in Food Preparation & Serving in Indianapolis, IN?
46218 has the Highest Percentage of Population Employed in Food Preparation & Serving in Indianapolis, IN with 11.5%.
What is the Percentage of Population Employed in Food Preparation & Serving in Indianapolis, IN?
Percentage of Population Employed in Food Preparation & Serving in Indianapolis is 5.4%.
What is the Percentage of Population Employed in Food Preparation & Serving in Indiana?
Percentage of Population Employed in Food Preparation & Serving in Indiana is 5.3%.
What is the Percentage of Population Employed in Food Preparation & Serving in the United States?
Percentage of Population Employed in Food Preparation & Serving in the United States is 5.3%.