Whittemore, IA Map & Demographics
Whittemore Map
Whittemore Overview
$36,642
PER CAPITA INCOME
$86,563
AVG FAMILY INCOME
$74,231
AVG HOUSEHOLD INCOME
23.7%
WAGE / INCOME GAP [ % ]
76.3¢/ $1
WAGE / INCOME GAP [ $ ]
0.30
INEQUALITY / GINI INDEX
537
TOTAL POPULATION
272
MALE POPULATION
265
FEMALE POPULATION
102.64
MALES / 100 FEMALES
97.43
FEMALES / 100 MALES
43.9
MEDIAN AGE
2.9
AVG FAMILY SIZE
2.1
AVG HOUSEHOLD SIZE
305
LABOR FORCE [ PEOPLE ]
71.6%
PERCENT IN LABOR FORCE
Whittemore Zip Codes
Whittemore Area Codes
Income in Whittemore
Income Overview in Whittemore
Per Capita Income in Whittemore is $36,642, while median incomes of families and households are $86,563 and $74,231 respectively.
| Characteristic | Number | Measure |
| Per Capita Income | 537 | $36,642 |
| Median Family Income | 137 | $86,563 |
| Mean Family Income | 137 | $89,253 |
| Median Household Income | 254 | $74,231 |
| Mean Household Income | 254 | $78,390 |
| Income Deficit | 137 | $0 |
| Wage / Income Gap (%) | 537 | 23.68% |
| Wage / Income Gap ($) | 537 | 76.32¢ per $1 |
| Gini / Inequality Index | 537 | 0.30 |
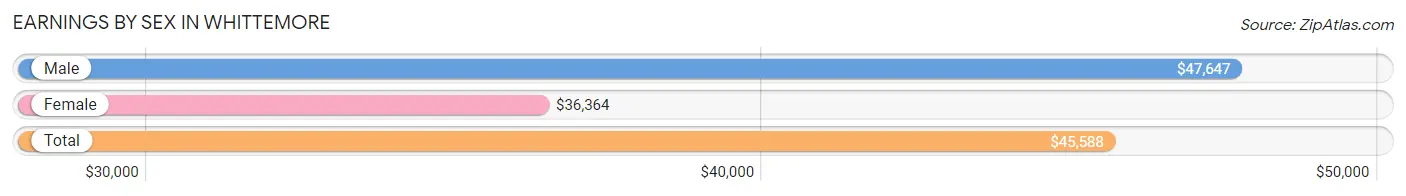
Earnings by Sex in Whittemore
Average Earnings in Whittemore are $45,588, $47,647 for men and $36,364 for women, a difference of 23.7%.
| Sex | Number | Average Earnings |
| Male | 188 (58.8%) | $47,647 |
| Female | 132 (41.2%) | $36,364 |
| Total | 320 (100.0%) | $45,588 |
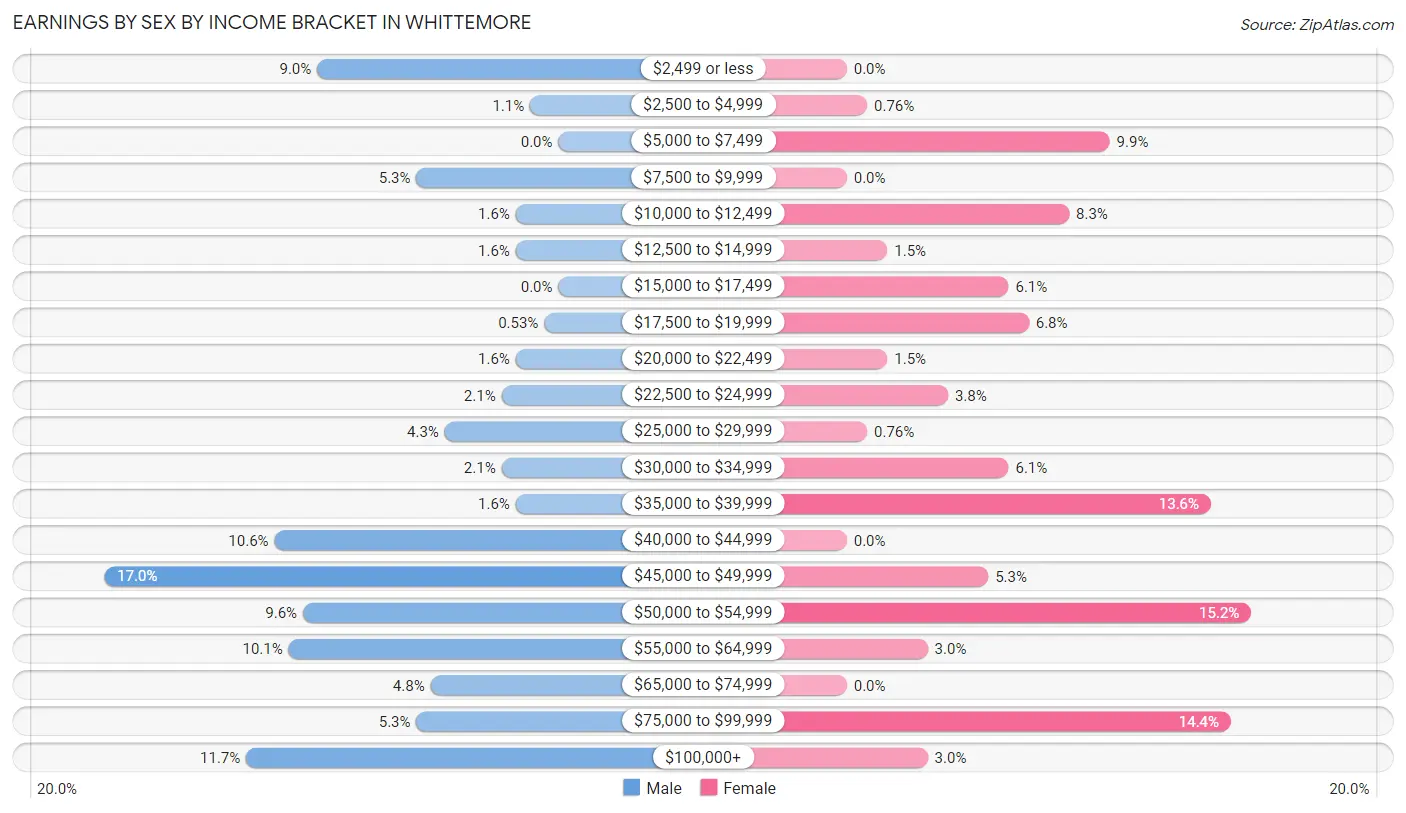
Earnings by Sex by Income Bracket in Whittemore
The most common earnings brackets in Whittemore are $45,000 to $49,999 for men (32 | 17.0%) and $50,000 to $54,999 for women (20 | 15.1%).
| Income | Male | Female |
| $2,499 or less | 17 (9.0%) | 0 (0.0%) |
| $2,500 to $4,999 | 2 (1.1%) | 1 (0.8%) |
| $5,000 to $7,499 | 0 (0.0%) | 13 (9.9%) |
| $7,500 to $9,999 | 10 (5.3%) | 0 (0.0%) |
| $10,000 to $12,499 | 3 (1.6%) | 11 (8.3%) |
| $12,500 to $14,999 | 3 (1.6%) | 2 (1.5%) |
| $15,000 to $17,499 | 0 (0.0%) | 8 (6.1%) |
| $17,500 to $19,999 | 1 (0.5%) | 9 (6.8%) |
| $20,000 to $22,499 | 3 (1.6%) | 2 (1.5%) |
| $22,500 to $24,999 | 4 (2.1%) | 5 (3.8%) |
| $25,000 to $29,999 | 8 (4.3%) | 1 (0.8%) |
| $30,000 to $34,999 | 4 (2.1%) | 8 (6.1%) |
| $35,000 to $39,999 | 3 (1.6%) | 18 (13.6%) |
| $40,000 to $44,999 | 20 (10.6%) | 0 (0.0%) |
| $45,000 to $49,999 | 32 (17.0%) | 7 (5.3%) |
| $50,000 to $54,999 | 18 (9.6%) | 20 (15.1%) |
| $55,000 to $64,999 | 19 (10.1%) | 4 (3.0%) |
| $65,000 to $74,999 | 9 (4.8%) | 0 (0.0%) |
| $75,000 to $99,999 | 10 (5.3%) | 19 (14.4%) |
| $100,000+ | 22 (11.7%) | 4 (3.0%) |
| Total | 188 (100.0%) | 132 (100.0%) |
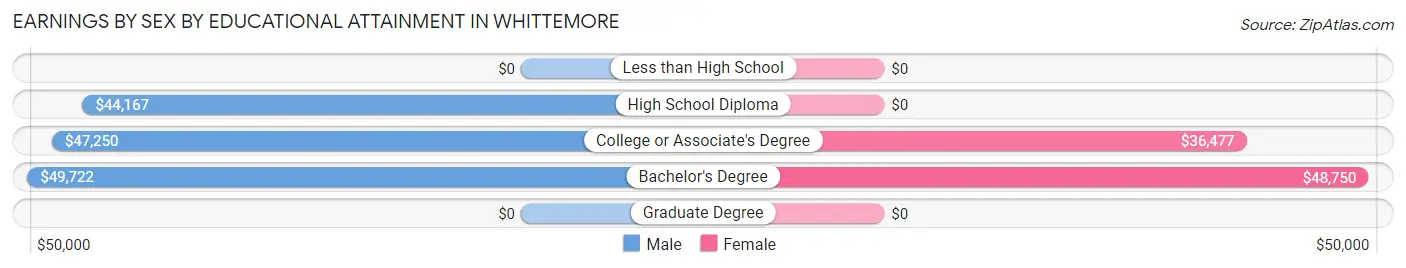
Earnings by Sex by Educational Attainment in Whittemore
Average earnings in Whittemore are $48,088 for men and $37,857 for women, a difference of 21.3%. Men with an educational attainment of bachelor's degree enjoy the highest average annual earnings of $49,722, while those with high school diploma education earn the least with $44,167. Women with an educational attainment of bachelor's degree earn the most with the average annual earnings of $48,750, while those with college or associate's degree education have the smallest earnings of $36,477.
| Educational Attainment | Male Income | Female Income |
| Less than High School | - | - |
| High School Diploma | $44,167 | $0 |
| College or Associate's Degree | $47,250 | $36,477 |
| Bachelor's Degree | $49,722 | $48,750 |
| Graduate Degree | - | - |
| Total | $48,088 | $37,857 |
Family Income in Whittemore
Family Income Brackets in Whittemore
According to the Whittemore family income data, there are 54 families falling into the $75,000 to $99,999 income range, which is the most common income bracket and makes up 39.4% of all families.
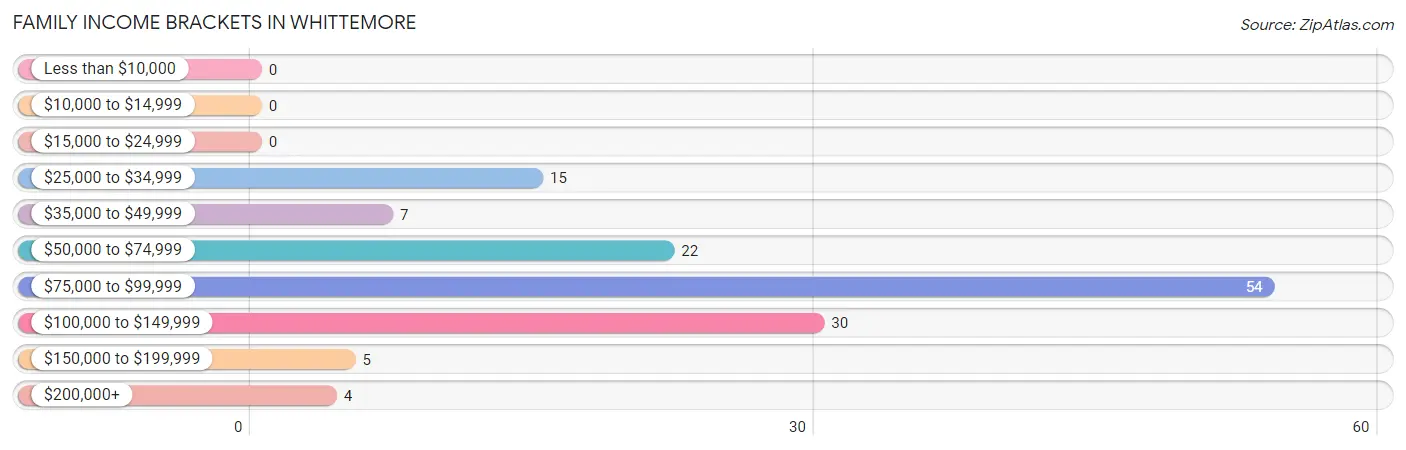
| Income Bracket | # Families | % Families |
| Less than $10,000 | 0 | 0.0% |
| $10,000 to $14,999 | 0 | 0.0% |
| $15,000 to $24,999 | 0 | 0.0% |
| $25,000 to $34,999 | 15 | 10.9% |
| $35,000 to $49,999 | 7 | 5.1% |
| $50,000 to $74,999 | 22 | 16.1% |
| $75,000 to $99,999 | 54 | 39.4% |
| $100,000 to $149,999 | 30 | 21.9% |
| $150,000 to $199,999 | 5 | 3.6% |
| $200,000+ | 4 | 2.9% |
Family Income by Famaliy Size in Whittemore
5-person families (16 | 11.7%) account for the highest median family income in Whittemore with $117,778 per family, while 2-person families (92 | 67.1%) have the highest median income of $42,125 per family member.
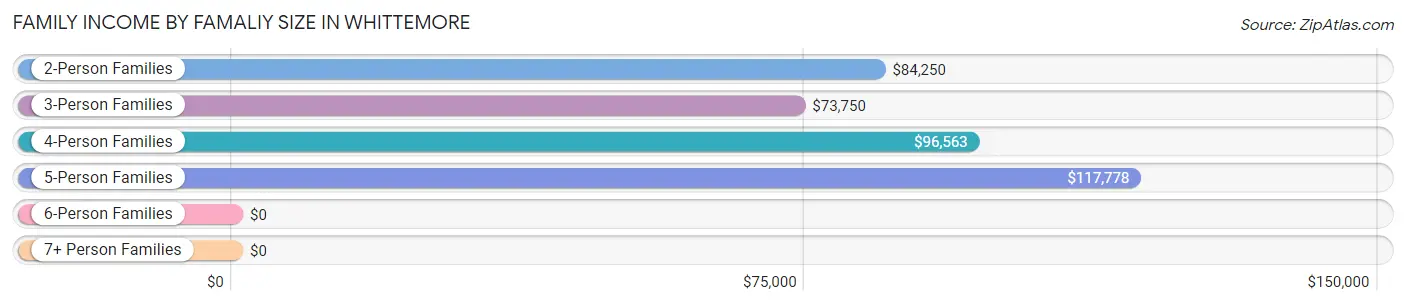
| Income Bracket | # Families | Median Income |
| 2-Person Families | 92 (67.1%) | $84,250 |
| 3-Person Families | 8 (5.8%) | $73,750 |
| 4-Person Families | 21 (15.3%) | $96,563 |
| 5-Person Families | 16 (11.7%) | $117,778 |
| 6-Person Families | 0 (0.0%) | $0 |
| 7+ Person Families | 0 (0.0%) | $0 |
| Total | 137 (100.0%) | $86,563 |
Family Income by Number of Earners in Whittemore
The median family income in Whittemore is $86,563, with families comprising 3+ earners (14) having the highest median family income of $118,611, while families with no earners (12) have the lowest median family income of $75,000, accounting for 10.2% and 8.8% of families, respectively.
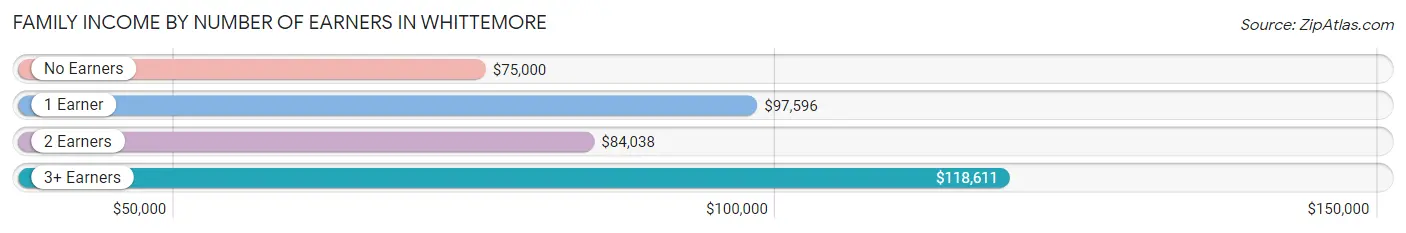
| Number of Earners | # Families | Median Income |
| No Earners | 12 (8.8%) | $75,000 |
| 1 Earner | 29 (21.2%) | $97,596 |
| 2 Earners | 82 (59.9%) | $84,038 |
| 3+ Earners | 14 (10.2%) | $118,611 |
| Total | 137 (100.0%) | $86,563 |
Household Income in Whittemore
Household Income Brackets in Whittemore
With 67 households falling in the category, the $100,000 to $149,999 income range is the most frequent in Whittemore, accounting for 26.4% of all households. In contrast, only 2 households (0.8%) fall into the $10,000 to $14,999 income bracket, making it the least populous group.
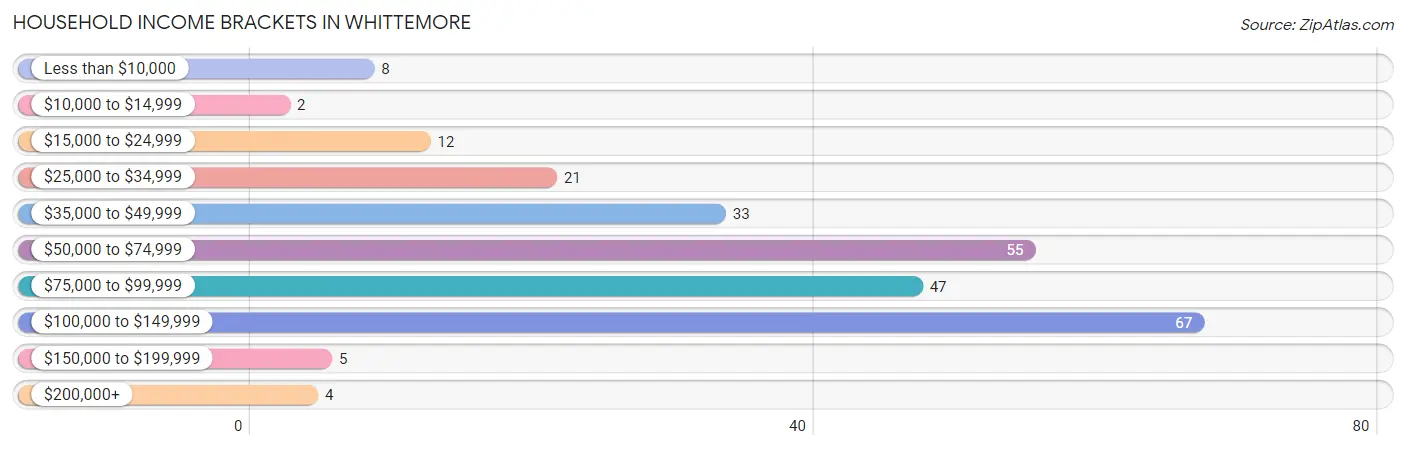
| Income Bracket | # Households | % Households |
| Less than $10,000 | 8 | 3.1% |
| $10,000 to $14,999 | 2 | 0.8% |
| $15,000 to $24,999 | 12 | 4.7% |
| $25,000 to $34,999 | 21 | 8.3% |
| $35,000 to $49,999 | 33 | 13.0% |
| $50,000 to $74,999 | 55 | 21.7% |
| $75,000 to $99,999 | 47 | 18.5% |
| $100,000 to $149,999 | 67 | 26.4% |
| $150,000 to $199,999 | 5 | 2.0% |
| $200,000+ | 4 | 1.6% |
Household Income by Householder Age in Whittemore
The median household income in Whittemore is $74,231, with the highest median household income of $86,250 found in the 45 to 64 years age bracket for the primary householder. A total of 98 households (38.6%) fall into this category. Meanwhile, the 15 to 24 years age bracket for the primary householder has the lowest median household income of $0, with 4 households (1.6%) in this group.
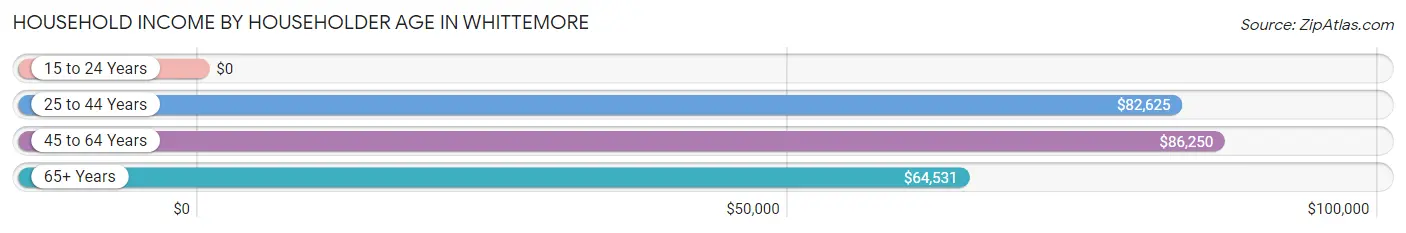
| Income Bracket | # Households | Median Income |
| 15 to 24 Years | 4 (1.6%) | $0 |
| 25 to 44 Years | 73 (28.7%) | $82,625 |
| 45 to 64 Years | 98 (38.6%) | $86,250 |
| 65+ Years | 79 (31.1%) | $64,531 |
| Total | 254 (100.0%) | $74,231 |
Poverty in Whittemore
Income Below Poverty by Sex and Age in Whittemore
With 3.3% poverty level for males and 4.2% for females among the residents of Whittemore, 5 year old males and 35 to 44 year old females are the most vulnerable to poverty, with 2 males (100.0%) and 4 females (25.0%) in their respective age groups living below the poverty level.
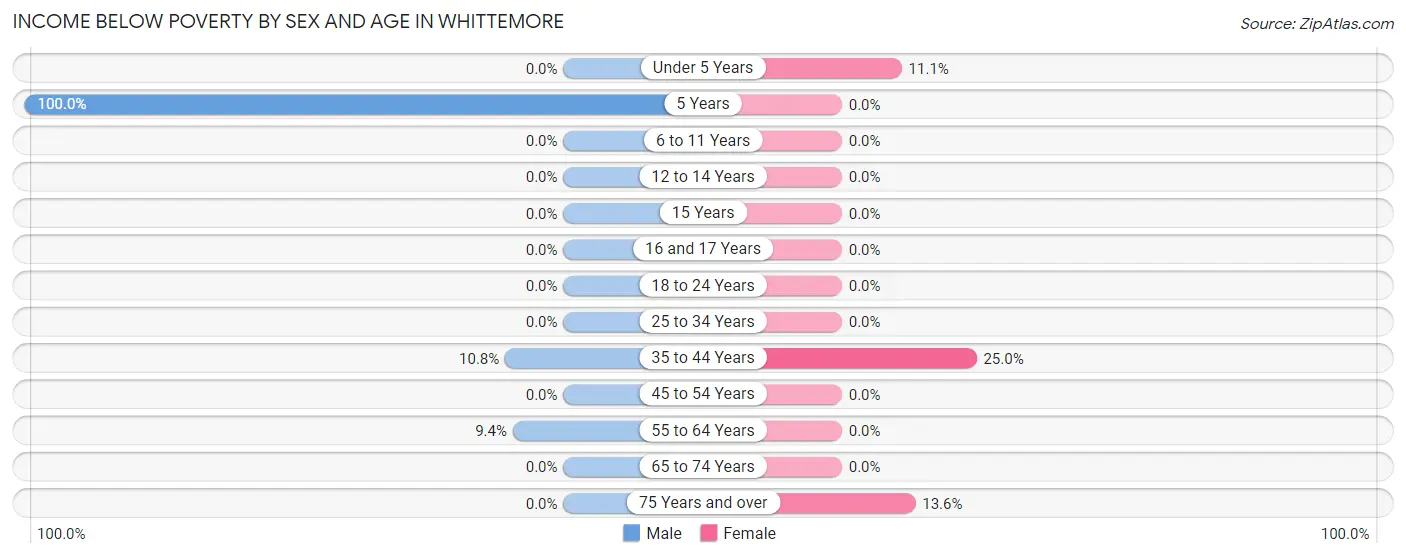
| Age Bracket | Male | Female |
| Under 5 Years | 0 (0.0%) | 1 (11.1%) |
| 5 Years | 2 (100.0%) | 0 (0.0%) |
| 6 to 11 Years | 0 (0.0%) | 0 (0.0%) |
| 12 to 14 Years | 0 (0.0%) | 0 (0.0%) |
| 15 Years | 0 (0.0%) | 0 (0.0%) |
| 16 and 17 Years | 0 (0.0%) | 0 (0.0%) |
| 18 to 24 Years | 0 (0.0%) | 0 (0.0%) |
| 25 to 34 Years | 0 (0.0%) | 0 (0.0%) |
| 35 to 44 Years | 4 (10.8%) | 4 (25.0%) |
| 45 to 54 Years | 0 (0.0%) | 0 (0.0%) |
| 55 to 64 Years | 3 (9.4%) | 0 (0.0%) |
| 65 to 74 Years | 0 (0.0%) | 0 (0.0%) |
| 75 Years and over | 0 (0.0%) | 6 (13.6%) |
| Total | 9 (3.3%) | 11 (4.2%) |
Income Above Poverty by Sex and Age in Whittemore
According to the poverty statistics in Whittemore, males aged under 5 years and females aged 5 years are the age groups that are most secure financially, with 100.0% of males and 100.0% of females in these age groups living above the poverty line.
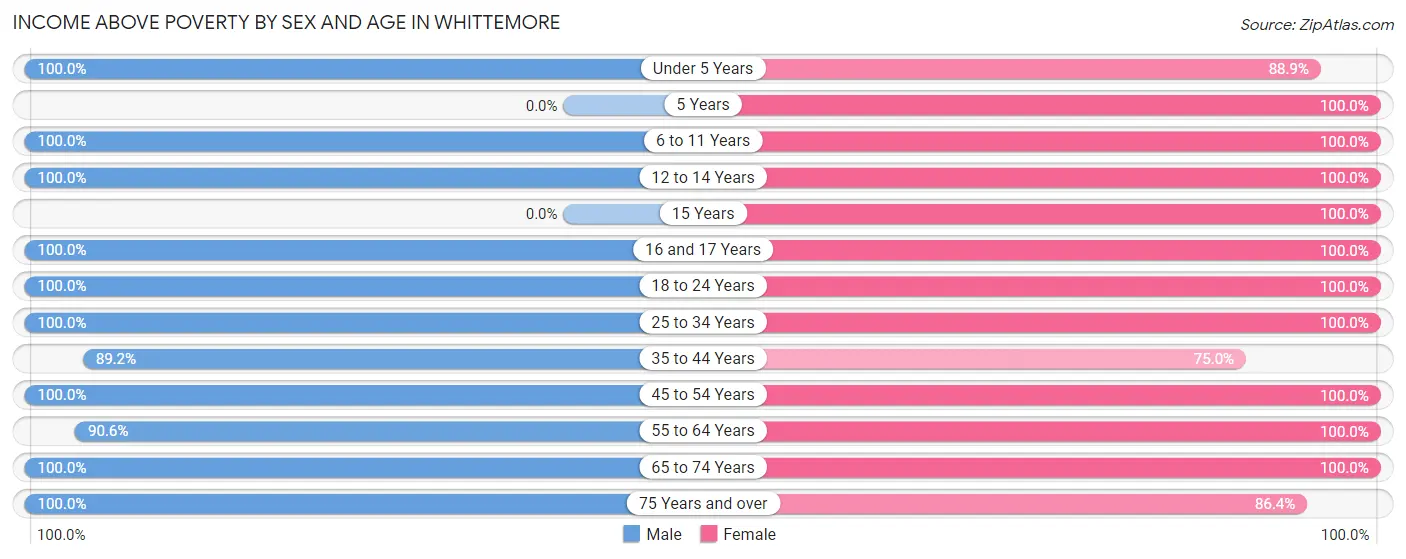
| Age Bracket | Male | Female |
| Under 5 Years | 6 (100.0%) | 8 (88.9%) |
| 5 Years | 0 (0.0%) | 21 (100.0%) |
| 6 to 11 Years | 30 (100.0%) | 26 (100.0%) |
| 12 to 14 Years | 8 (100.0%) | 2 (100.0%) |
| 15 Years | 0 (0.0%) | 7 (100.0%) |
| 16 and 17 Years | 8 (100.0%) | 10 (100.0%) |
| 18 to 24 Years | 18 (100.0%) | 2 (100.0%) |
| 25 to 34 Years | 34 (100.0%) | 36 (100.0%) |
| 35 to 44 Years | 33 (89.2%) | 12 (75.0%) |
| 45 to 54 Years | 50 (100.0%) | 36 (100.0%) |
| 55 to 64 Years | 29 (90.6%) | 33 (100.0%) |
| 65 to 74 Years | 31 (100.0%) | 23 (100.0%) |
| 75 Years and over | 16 (100.0%) | 38 (86.4%) |
| Total | 263 (96.7%) | 254 (95.9%) |
Income Below Poverty Among Married-Couple Families in Whittemore
The poverty statistics for married-couple families in Whittemore show that 0.9% or 1 of the total 115 families live below the poverty line. Families with 1 or 2 children have the highest poverty rate of 4.8%, comprising of 1 families. On the other hand, families with no children have the lowest poverty rate of 0.0%, which includes 0 families.
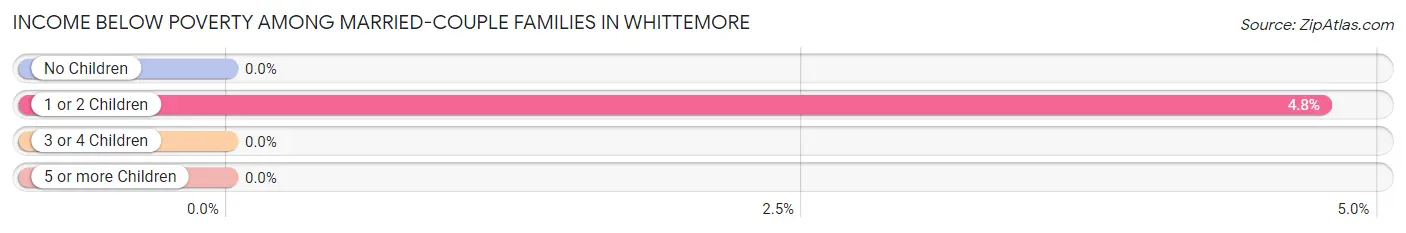
| Children | Above Poverty | Below Poverty |
| No Children | 78 (100.0%) | 0 (0.0%) |
| 1 or 2 Children | 20 (95.2%) | 1 (4.8%) |
| 3 or 4 Children | 16 (100.0%) | 0 (0.0%) |
| 5 or more Children | 0 (0.0%) | 0 (0.0%) |
| Total | 114 (99.1%) | 1 (0.9%) |
Income Below Poverty Among Single-Parent Households in Whittemore
| Children | Single Father | Single Mother |
| No Children | 0 (0.0%) | 0 (0.0%) |
| 1 or 2 Children | 0 (0.0%) | 0 (0.0%) |
| 3 or 4 Children | 0 (0.0%) | 0 (0.0%) |
| 5 or more Children | 0 (0.0%) | 0 (0.0%) |
| Total | 0 (0.0%) | 0 (0.0%) |
Income Below Poverty Among Married-Couple vs Single-Parent Households in Whittemore
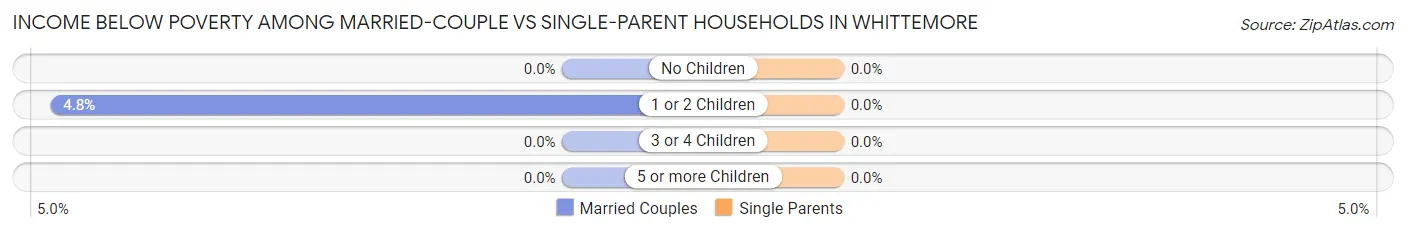
| Children | Married-Couple Families | Single-Parent Households |
| No Children | 0 (0.0%) | 0 (0.0%) |
| 1 or 2 Children | 1 (4.8%) | 0 (0.0%) |
| 3 or 4 Children | 0 (0.0%) | 0 (0.0%) |
| 5 or more Children | 0 (0.0%) | 0 (0.0%) |
| Total | 1 (0.9%) | 0 (0.0%) |
Race in Whittemore
The most populous races in Whittemore are White / Caucasian (510 | 95.0%), Two or more Races (25 | 4.7%), and Hawaiian / Pacific (2 | 0.4%).
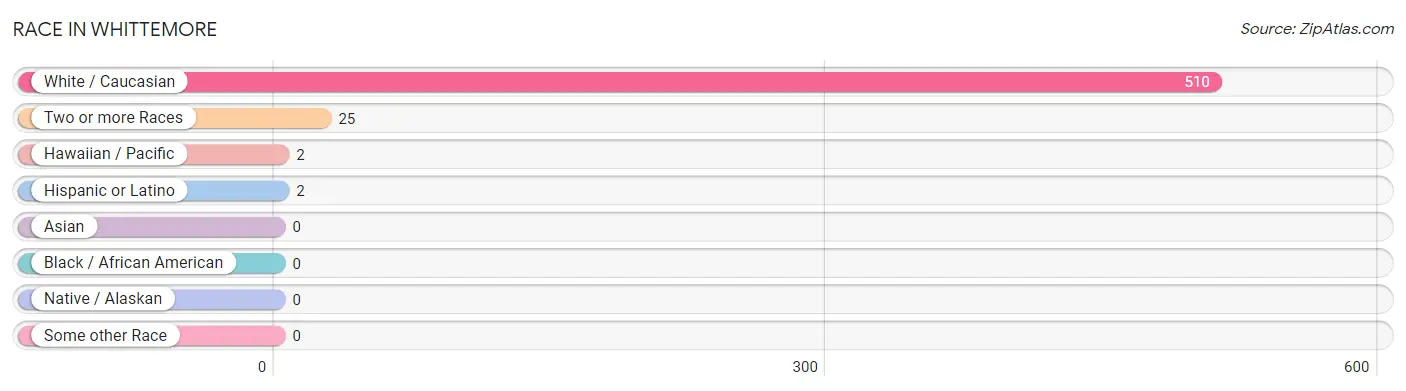
| Race | # Population | % Population |
| Asian | 0 | 0.0% |
| Black / African American | 0 | 0.0% |
| Hawaiian / Pacific | 2 | 0.4% |
| Hispanic or Latino | 2 | 0.4% |
| Native / Alaskan | 0 | 0.0% |
| White / Caucasian | 510 | 95.0% |
| Two or more Races | 25 | 4.7% |
| Some other Race | 0 | 0.0% |
| Total | 537 | 100.0% |
Ancestry in Whittemore
The most populous ancestries reported in Whittemore are German (331 | 61.6%), Irish (102 | 19.0%), Norwegian (51 | 9.5%), Dutch (46 | 8.6%), and English (35 | 6.5%), together accounting for 105.2% of all Whittemore residents.
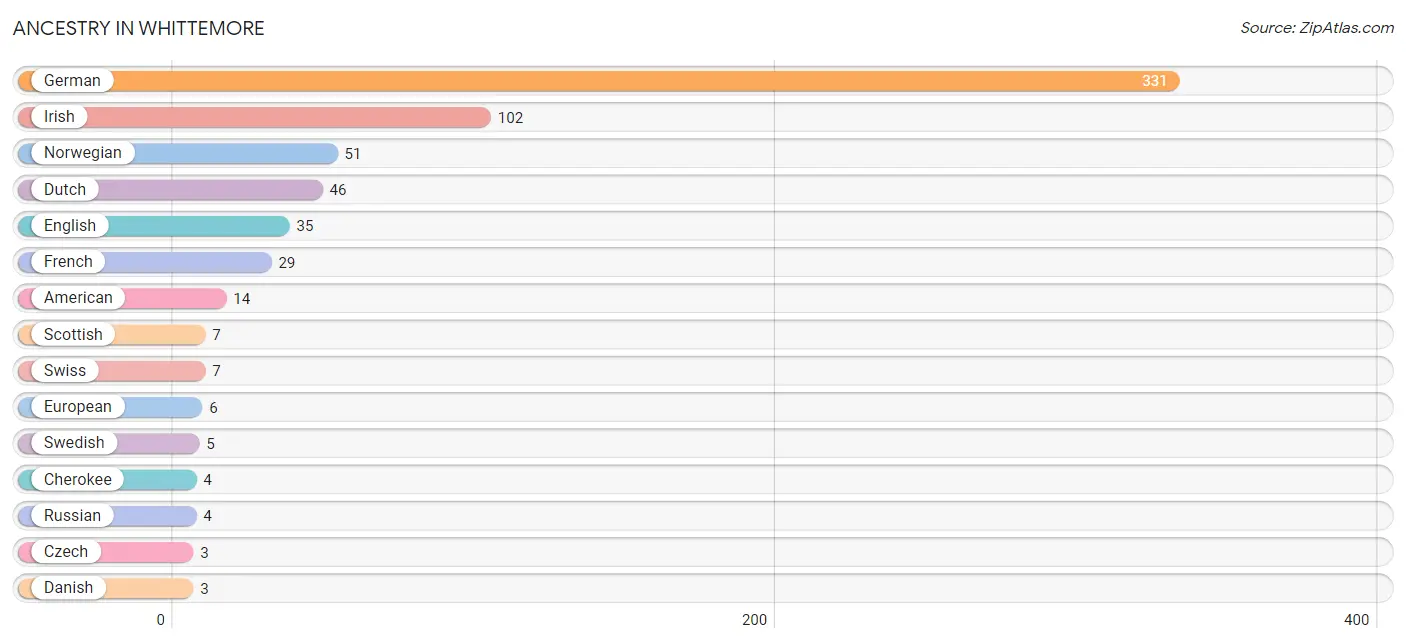
| Ancestry | # Population | % Population |
| American | 14 | 2.6% |
| Central American | 2 | 0.4% |
| Cherokee | 4 | 0.7% |
| Czech | 3 | 0.6% |
| Danish | 3 | 0.6% |
| Dutch | 46 | 8.6% |
| English | 35 | 6.5% |
| European | 6 | 1.1% |
| French | 29 | 5.4% |
| German | 331 | 61.6% |
| Guamanian / Chamorro | 2 | 0.4% |
| Guatemalan | 2 | 0.4% |
| Irish | 102 | 19.0% |
| Italian | 1 | 0.2% |
| Norwegian | 51 | 9.5% |
| Russian | 4 | 0.7% |
| Scotch-Irish | 2 | 0.4% |
| Scottish | 7 | 1.3% |
| Swedish | 5 | 0.9% |
| Swiss | 7 | 1.3% | View All 20 Rows |
Immigrants in Whittemore
The most numerous immigrant groups reported in Whittemore came from Africa (12 | 2.2%), South Africa (12 | 2.2%), Central America (2 | 0.4%), Europe (2 | 0.4%), and Guatemala (2 | 0.4%), together accounting for 5.6% of all Whittemore residents.
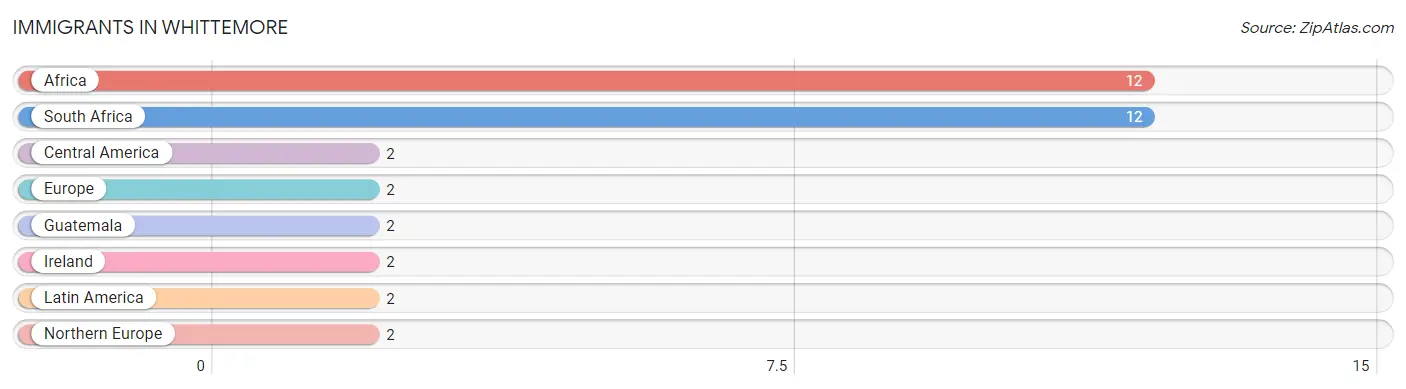
| Immigration Origin | # Population | % Population |
| Africa | 12 | 2.2% |
| Central America | 2 | 0.4% |
| Europe | 2 | 0.4% |
| Guatemala | 2 | 0.4% |
| Ireland | 2 | 0.4% |
| Latin America | 2 | 0.4% |
| Northern Europe | 2 | 0.4% |
| South Africa | 12 | 2.2% | View All 8 Rows |
Sex and Age in Whittemore
Sex and Age in Whittemore
The most populous age groups in Whittemore are 5 to 9 Years (30 | 11.0%) for men and 5 to 9 Years (30 | 11.3%) for women.
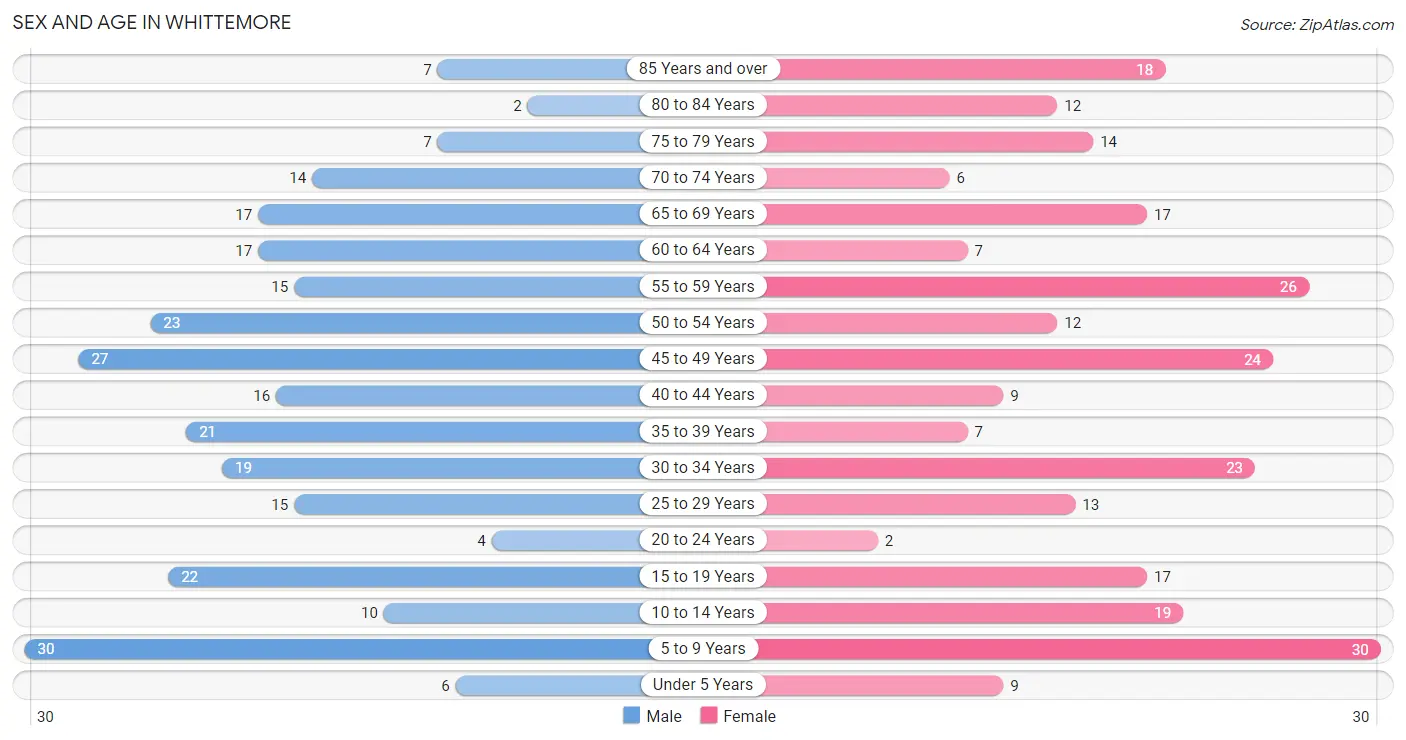
| Age Bracket | Male | Female |
| Under 5 Years | 6 (2.2%) | 9 (3.4%) |
| 5 to 9 Years | 30 (11.0%) | 30 (11.3%) |
| 10 to 14 Years | 10 (3.7%) | 19 (7.2%) |
| 15 to 19 Years | 22 (8.1%) | 17 (6.4%) |
| 20 to 24 Years | 4 (1.5%) | 2 (0.7%) |
| 25 to 29 Years | 15 (5.5%) | 13 (4.9%) |
| 30 to 34 Years | 19 (7.0%) | 23 (8.7%) |
| 35 to 39 Years | 21 (7.7%) | 7 (2.6%) |
| 40 to 44 Years | 16 (5.9%) | 9 (3.4%) |
| 45 to 49 Years | 27 (9.9%) | 24 (9.1%) |
| 50 to 54 Years | 23 (8.5%) | 12 (4.5%) |
| 55 to 59 Years | 15 (5.5%) | 26 (9.8%) |
| 60 to 64 Years | 17 (6.2%) | 7 (2.6%) |
| 65 to 69 Years | 17 (6.2%) | 17 (6.4%) |
| 70 to 74 Years | 14 (5.1%) | 6 (2.3%) |
| 75 to 79 Years | 7 (2.6%) | 14 (5.3%) |
| 80 to 84 Years | 2 (0.7%) | 12 (4.5%) |
| 85 Years and over | 7 (2.6%) | 18 (6.8%) |
| Total | 272 (100.0%) | 265 (100.0%) |
Families and Households in Whittemore
Median Family Size in Whittemore
The median family size in Whittemore is 2.91 persons per family, with single female/mother families (16 | 11.7%) accounting for the largest median family size of 3.19 persons per family. On the other hand, married-couple families (115 | 83.9%) represent the smallest median family size with 2.86 persons per family.
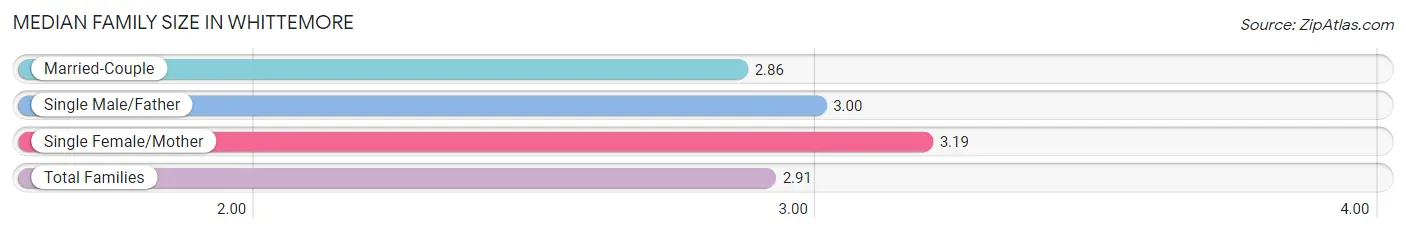
| Family Type | # Families | Family Size |
| Married-Couple | 115 (83.9%) | 2.86 |
| Single Male/Father | 6 (4.4%) | 3.00 |
| Single Female/Mother | 16 (11.7%) | 3.19 |
| Total Families | 137 (100.0%) | 2.91 |
Median Household Size in Whittemore
The median household size in Whittemore is 2.11 persons per household, with single female/mother households (16 | 6.3%) accounting for the largest median household size of 3.94 persons per household. non-family households (117 | 46.1%) represent the smallest median household size with 1.07 persons per household.
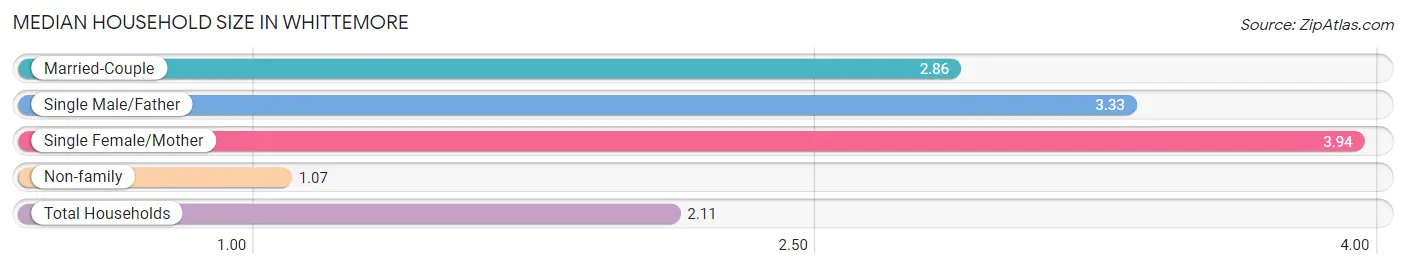
| Household Type | # Households | Household Size |
| Married-Couple | 115 (45.3%) | 2.86 |
| Single Male/Father | 6 (2.4%) | 3.33 |
| Single Female/Mother | 16 (6.3%) | 3.94 |
| Non-family | 117 (46.1%) | 1.07 |
| Total Households | 254 (100.0%) | 2.11 |
Household Size by Marriage Status in Whittemore
Out of a total of 254 households in Whittemore, 137 (53.9%) are family households, while 117 (46.1%) are nonfamily households. The most numerous type of family households are 2-person households, comprising 81, and the most common type of nonfamily households are 1-person households, comprising 108.
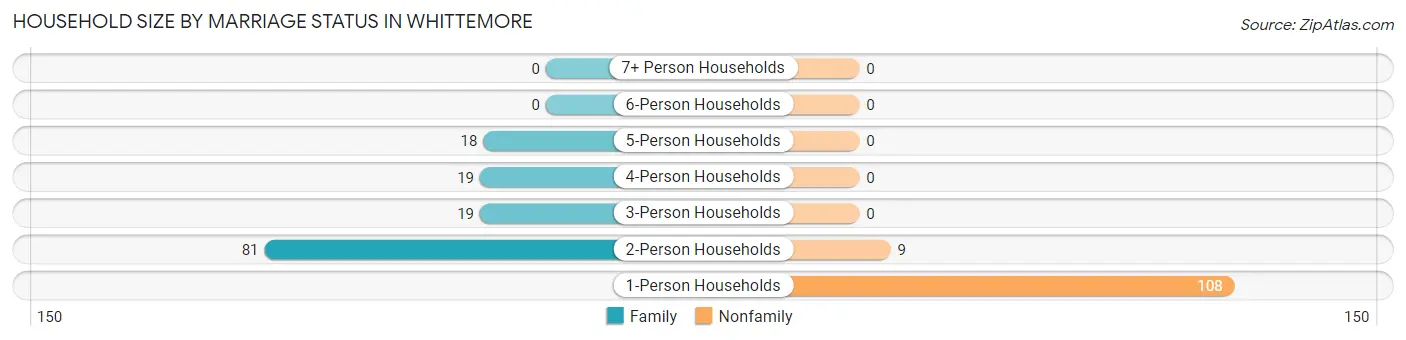
| Household Size | Family Households | Nonfamily Households |
| 1-Person Households | - | 108 (42.5%) |
| 2-Person Households | 81 (31.9%) | 9 (3.5%) |
| 3-Person Households | 19 (7.5%) | 0 (0.0%) |
| 4-Person Households | 19 (7.5%) | 0 (0.0%) |
| 5-Person Households | 18 (7.1%) | 0 (0.0%) |
| 6-Person Households | 0 (0.0%) | 0 (0.0%) |
| 7+ Person Households | 0 (0.0%) | 0 (0.0%) |
| Total | 137 (53.9%) | 117 (46.1%) |
Female Fertility in Whittemore
Fertility by Age in Whittemore
Average fertility rate in Whittemore is 21.0 births per 1,000 women. Women in the age bracket of 35 to 50 years have the highest fertility rate with 48.0 births per 1,000 women. Women in the age bracket of 35 to 50 years acount for 100.0% of all women with births.
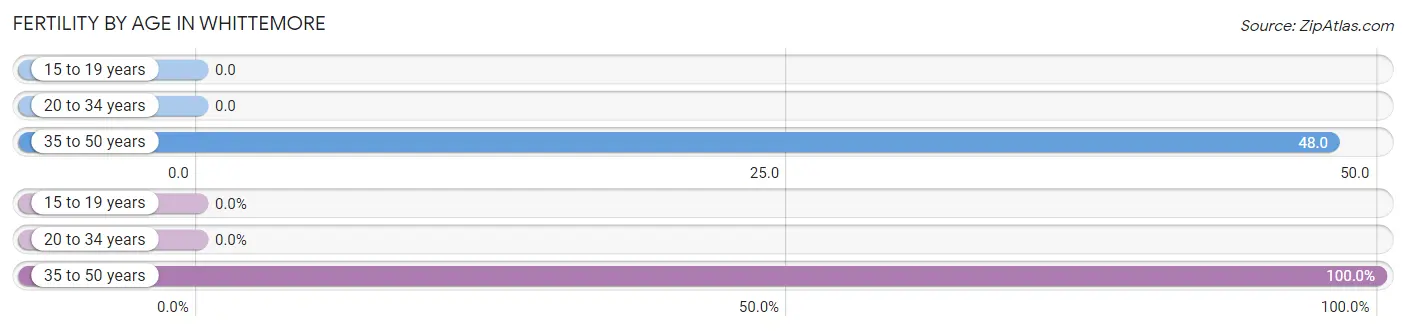
| Age Bracket | Women with Births | Births / 1,000 Women |
| 15 to 19 years | 0 (0.0%) | 0.0 |
| 20 to 34 years | 0 (0.0%) | 0.0 |
| 35 to 50 years | 2 (100.0%) | 48.0 |
| Total | 2 (100.0%) | 21.0 |
Fertility by Age by Marriage Status in Whittemore
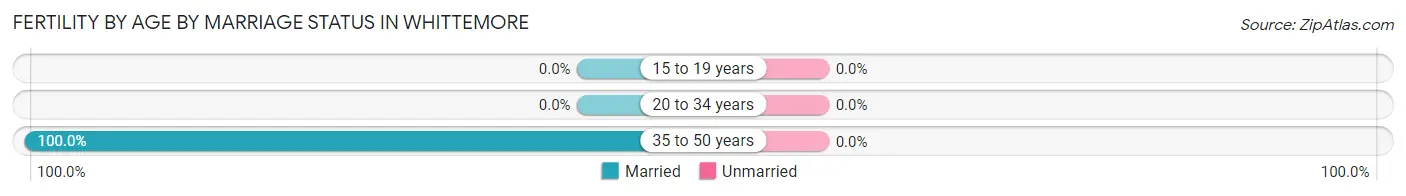
| Age Bracket | Married | Unmarried |
| 15 to 19 years | 0 (0.0%) | 0 (0.0%) |
| 20 to 34 years | 0 (0.0%) | 0 (0.0%) |
| 35 to 50 years | 2 (100.0%) | 0 (0.0%) |
| Total | 2 (100.0%) | 0 (0.0%) |
Fertility by Education in Whittemore
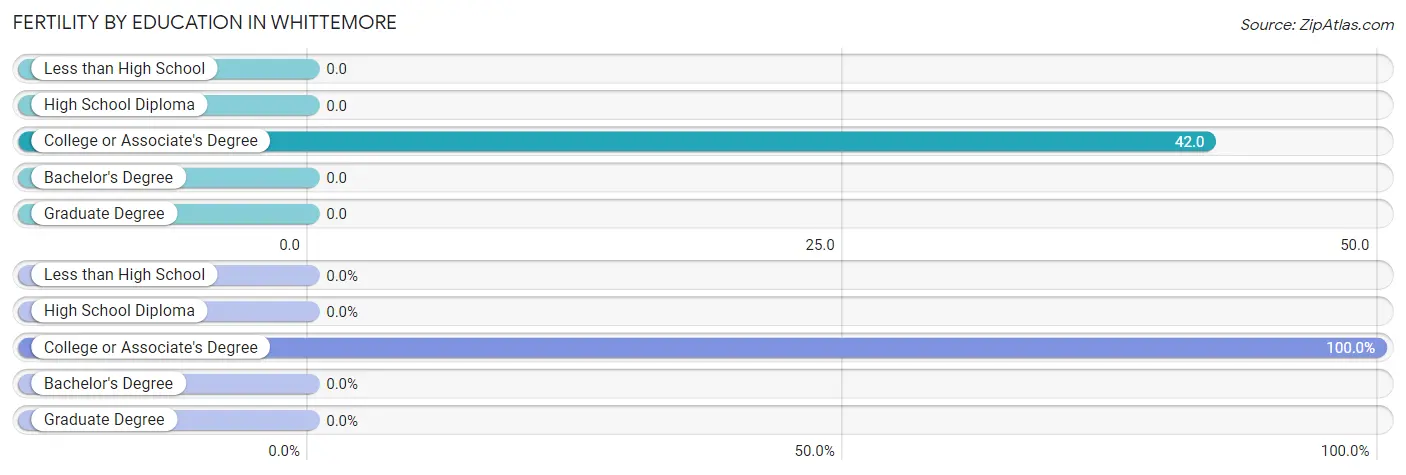
| Educational Attainment | Women with Births | Births / 1,000 Women |
| Less than High School | 0 (0.0%) | 0.0 |
| High School Diploma | 0 (0.0%) | 0.0 |
| College or Associate's Degree | 2 (100.0%) | 42.0 |
| Bachelor's Degree | 0 (0.0%) | 0.0 |
| Graduate Degree | 0 (0.0%) | 0.0 |
| Total | 2 (100.0%) | 21.0 |
Fertility by Education by Marriage Status in Whittemore
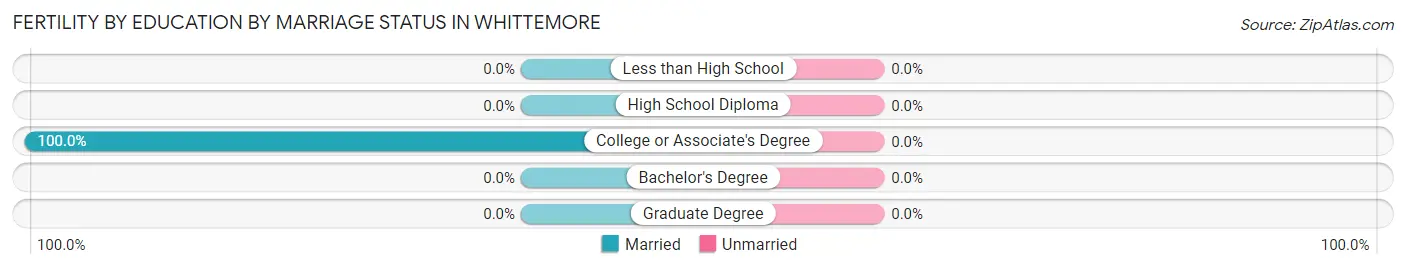
| Educational Attainment | Married | Unmarried |
| Less than High School | 0 (0.0%) | 0 (0.0%) |
| High School Diploma | 0 (0.0%) | 0 (0.0%) |
| College or Associate's Degree | 2 (100.0%) | 0 (0.0%) |
| Bachelor's Degree | 0 (0.0%) | 0 (0.0%) |
| Graduate Degree | 0 (0.0%) | 0 (0.0%) |
| Total | 2 (100.0%) | 0 (0.0%) |
Employment Characteristics in Whittemore
Employment by Class of Employer in Whittemore
Among the 305 employed individuals in Whittemore, private company employees (205 | 67.2%), not-for-profit organizations (31 | 10.2%), and local government employees (28 | 9.2%) make up the most common classes of employment.
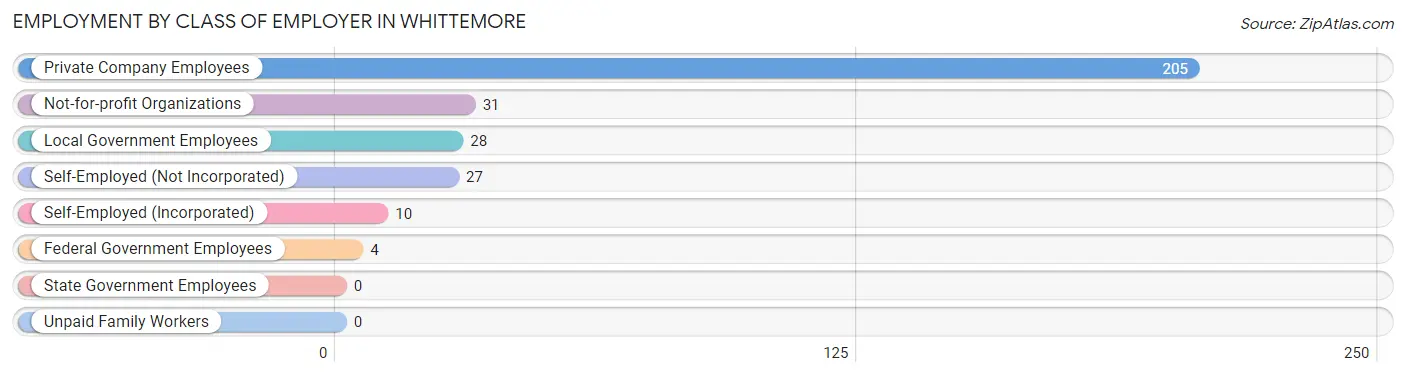
| Employer Class | # Employees | % Employees |
| Private Company Employees | 205 | 67.2% |
| Self-Employed (Incorporated) | 10 | 3.3% |
| Self-Employed (Not Incorporated) | 27 | 8.8% |
| Not-for-profit Organizations | 31 | 10.2% |
| Local Government Employees | 28 | 9.2% |
| State Government Employees | 0 | 0.0% |
| Federal Government Employees | 4 | 1.3% |
| Unpaid Family Workers | 0 | 0.0% |
| Total | 305 | 100.0% |
Employment Status by Age in Whittemore
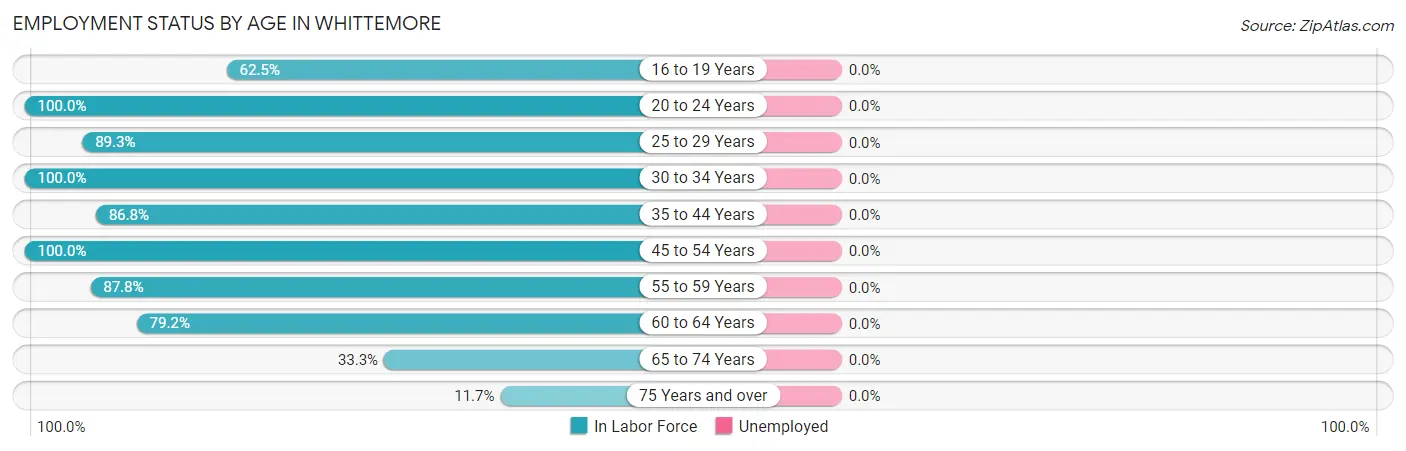
| Age Bracket | In Labor Force | Unemployed |
| 16 to 19 Years | 20 (62.5%) | 0 (0.0%) |
| 20 to 24 Years | 6 (100.0%) | 0 (0.0%) |
| 25 to 29 Years | 25 (89.3%) | 0 (0.0%) |
| 30 to 34 Years | 42 (100.0%) | 0 (0.0%) |
| 35 to 44 Years | 46 (86.8%) | 0 (0.0%) |
| 45 to 54 Years | 86 (100.0%) | 0 (0.0%) |
| 55 to 59 Years | 36 (87.8%) | 0 (0.0%) |
| 60 to 64 Years | 19 (79.2%) | 0 (0.0%) |
| 65 to 74 Years | 18 (33.3%) | 0 (0.0%) |
| 75 Years and over | 7 (11.7%) | 0 (0.0%) |
| Total | 305 (71.6%) | 0 (0.0%) |
Employment Status by Educational Attainment in Whittemore
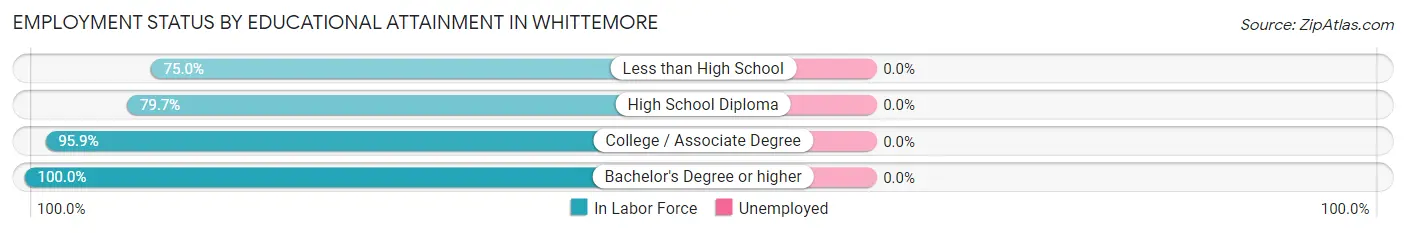
| Educational Attainment | In Labor Force | Unemployed |
| Less than High School | 6 (75.0%) | 0 (0.0%) |
| High School Diploma | 47 (79.7%) | 0 (0.0%) |
| College / Associate Degree | 142 (95.9%) | 0 (0.0%) |
| Bachelor's Degree or higher | 59 (100.0%) | 0 (0.0%) |
| Total | 254 (92.7%) | 0 (0.0%) |
Employment Occupations by Sex in Whittemore
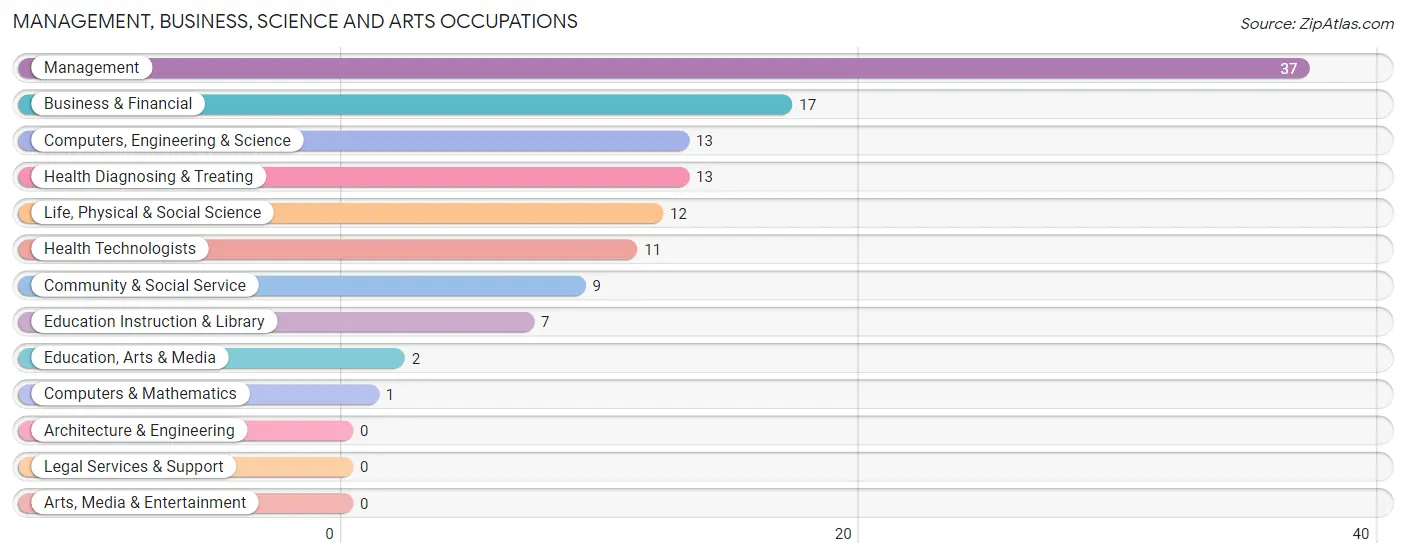
Management, Business, Science and Arts Occupations
The most common Management, Business, Science and Arts occupations in Whittemore are Management (37 | 12.1%), Business & Financial (17 | 5.6%), Computers, Engineering & Science (13 | 4.3%), Health Diagnosing & Treating (13 | 4.3%), and Life, Physical & Social Science (12 | 3.9%).
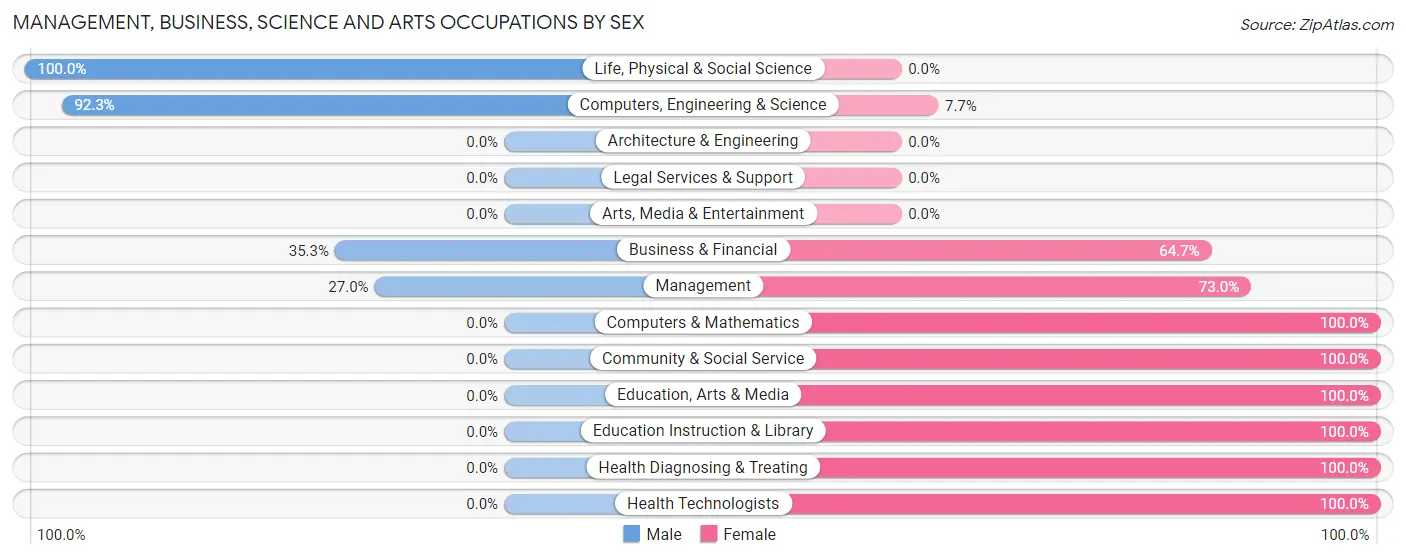
Management, Business, Science and Arts Occupations by Sex
Within the Management, Business, Science and Arts occupations in Whittemore, the most male-oriented occupations are Life, Physical & Social Science (100.0%), Computers, Engineering & Science (92.3%), and Business & Financial (35.3%), while the most female-oriented occupations are Computers & Mathematics (100.0%), Community & Social Service (100.0%), and Education, Arts & Media (100.0%).
| Occupation | Male | Female |
| Management | 10 (27.0%) | 27 (73.0%) |
| Business & Financial | 6 (35.3%) | 11 (64.7%) |
| Computers, Engineering & Science | 12 (92.3%) | 1 (7.7%) |
| Computers & Mathematics | 0 (0.0%) | 1 (100.0%) |
| Architecture & Engineering | 0 (0.0%) | 0 (0.0%) |
| Life, Physical & Social Science | 12 (100.0%) | 0 (0.0%) |
| Community & Social Service | 0 (0.0%) | 9 (100.0%) |
| Education, Arts & Media | 0 (0.0%) | 2 (100.0%) |
| Legal Services & Support | 0 (0.0%) | 0 (0.0%) |
| Education Instruction & Library | 0 (0.0%) | 7 (100.0%) |
| Arts, Media & Entertainment | 0 (0.0%) | 0 (0.0%) |
| Health Diagnosing & Treating | 0 (0.0%) | 13 (100.0%) |
| Health Technologists | 0 (0.0%) | 11 (100.0%) |
| Total (Category) | 28 (31.5%) | 61 (68.5%) |
| Total (Overall) | 176 (57.7%) | 129 (42.3%) |
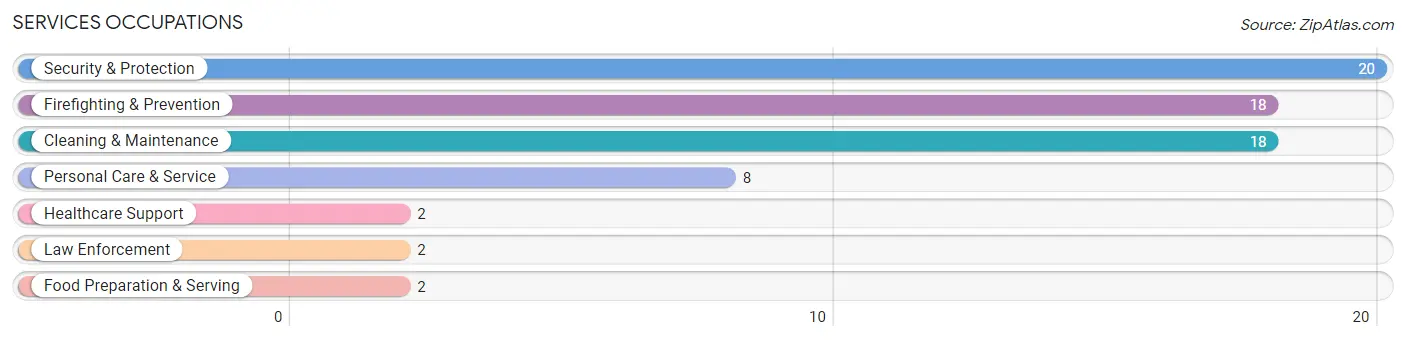
Services Occupations
The most common Services occupations in Whittemore are Security & Protection (20 | 6.6%), Firefighting & Prevention (18 | 5.9%), Cleaning & Maintenance (18 | 5.9%), Personal Care & Service (8 | 2.6%), and Healthcare Support (2 | 0.7%).
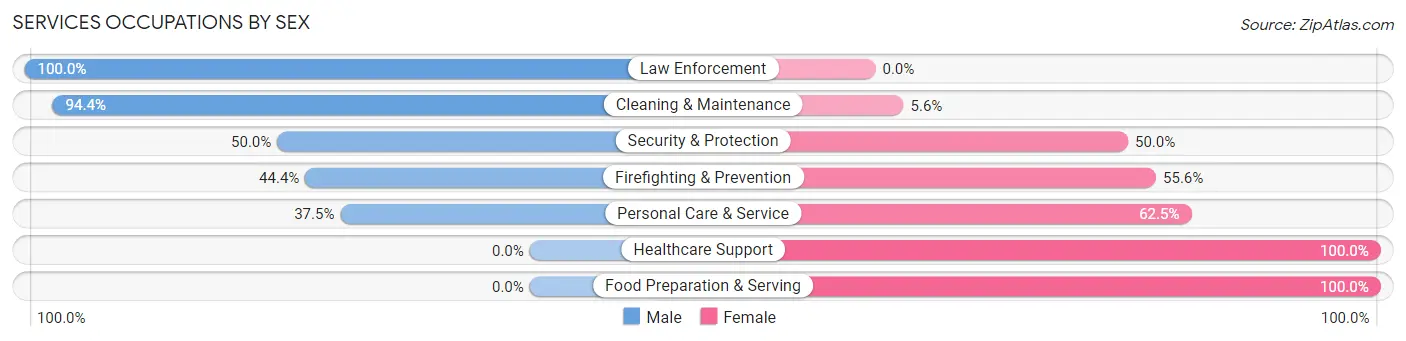
Services Occupations by Sex
Within the Services occupations in Whittemore, the most male-oriented occupations are Law Enforcement (100.0%), Cleaning & Maintenance (94.4%), and Security & Protection (50.0%), while the most female-oriented occupations are Healthcare Support (100.0%), Food Preparation & Serving (100.0%), and Personal Care & Service (62.5%).
| Occupation | Male | Female |
| Healthcare Support | 0 (0.0%) | 2 (100.0%) |
| Security & Protection | 10 (50.0%) | 10 (50.0%) |
| Firefighting & Prevention | 8 (44.4%) | 10 (55.6%) |
| Law Enforcement | 2 (100.0%) | 0 (0.0%) |
| Food Preparation & Serving | 0 (0.0%) | 2 (100.0%) |
| Cleaning & Maintenance | 17 (94.4%) | 1 (5.6%) |
| Personal Care & Service | 3 (37.5%) | 5 (62.5%) |
| Total (Category) | 30 (60.0%) | 20 (40.0%) |
| Total (Overall) | 176 (57.7%) | 129 (42.3%) |
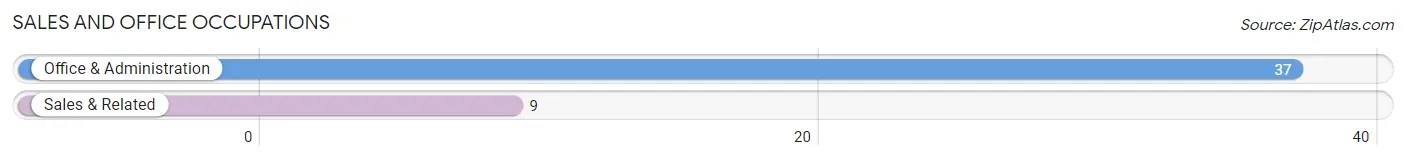
Sales and Office Occupations
The most common Sales and Office occupations in Whittemore are Office & Administration (37 | 12.1%), and Sales & Related (9 | 2.9%).
Sales and Office Occupations by Sex
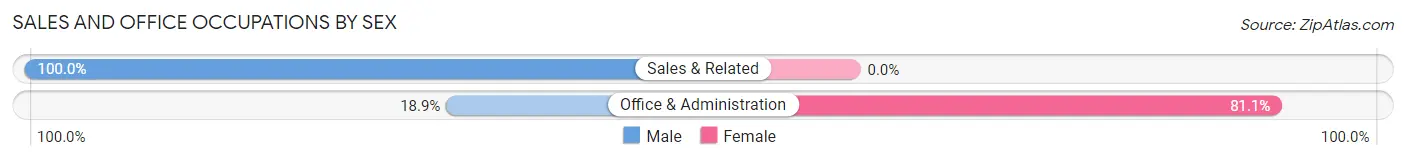
| Occupation | Male | Female |
| Sales & Related | 9 (100.0%) | 0 (0.0%) |
| Office & Administration | 7 (18.9%) | 30 (81.1%) |
| Total (Category) | 16 (34.8%) | 30 (65.2%) |
| Total (Overall) | 176 (57.7%) | 129 (42.3%) |
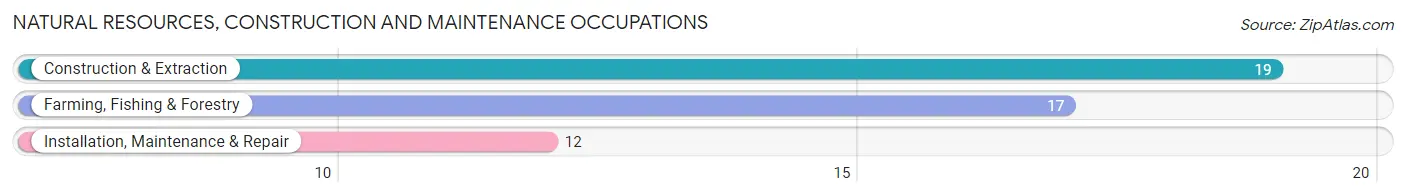
Natural Resources, Construction and Maintenance Occupations
The most common Natural Resources, Construction and Maintenance occupations in Whittemore are Construction & Extraction (19 | 6.2%), Farming, Fishing & Forestry (17 | 5.6%), and Installation, Maintenance & Repair (12 | 3.9%).
Natural Resources, Construction and Maintenance Occupations by Sex
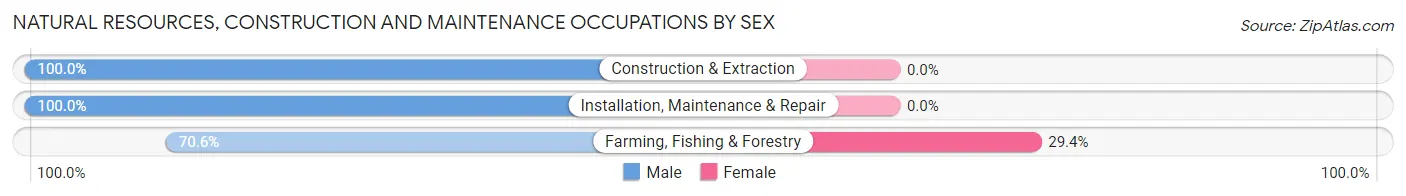
| Occupation | Male | Female |
| Farming, Fishing & Forestry | 12 (70.6%) | 5 (29.4%) |
| Construction & Extraction | 19 (100.0%) | 0 (0.0%) |
| Installation, Maintenance & Repair | 12 (100.0%) | 0 (0.0%) |
| Total (Category) | 43 (89.6%) | 5 (10.4%) |
| Total (Overall) | 176 (57.7%) | 129 (42.3%) |
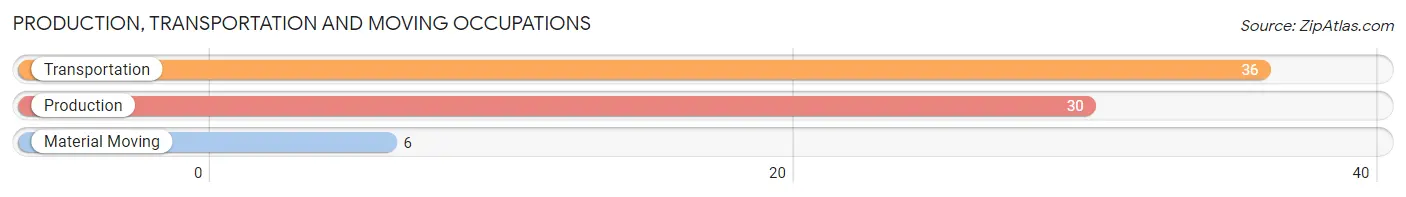
Production, Transportation and Moving Occupations
The most common Production, Transportation and Moving occupations in Whittemore are Transportation (36 | 11.8%), Production (30 | 9.8%), and Material Moving (6 | 2.0%).
Production, Transportation and Moving Occupations by Sex
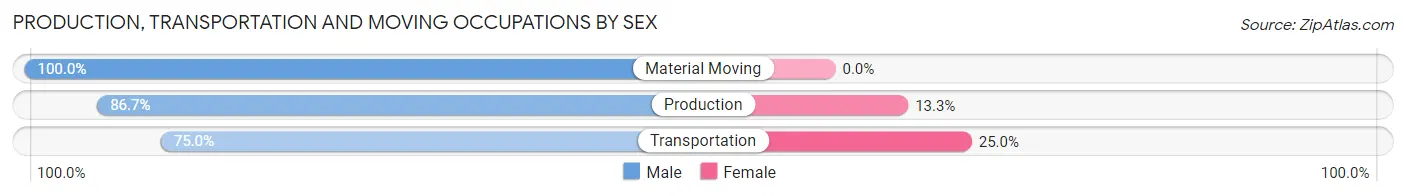
| Occupation | Male | Female |
| Production | 26 (86.7%) | 4 (13.3%) |
| Transportation | 27 (75.0%) | 9 (25.0%) |
| Material Moving | 6 (100.0%) | 0 (0.0%) |
| Total (Category) | 59 (81.9%) | 13 (18.1%) |
| Total (Overall) | 176 (57.7%) | 129 (42.3%) |
Employment Industries by Sex in Whittemore
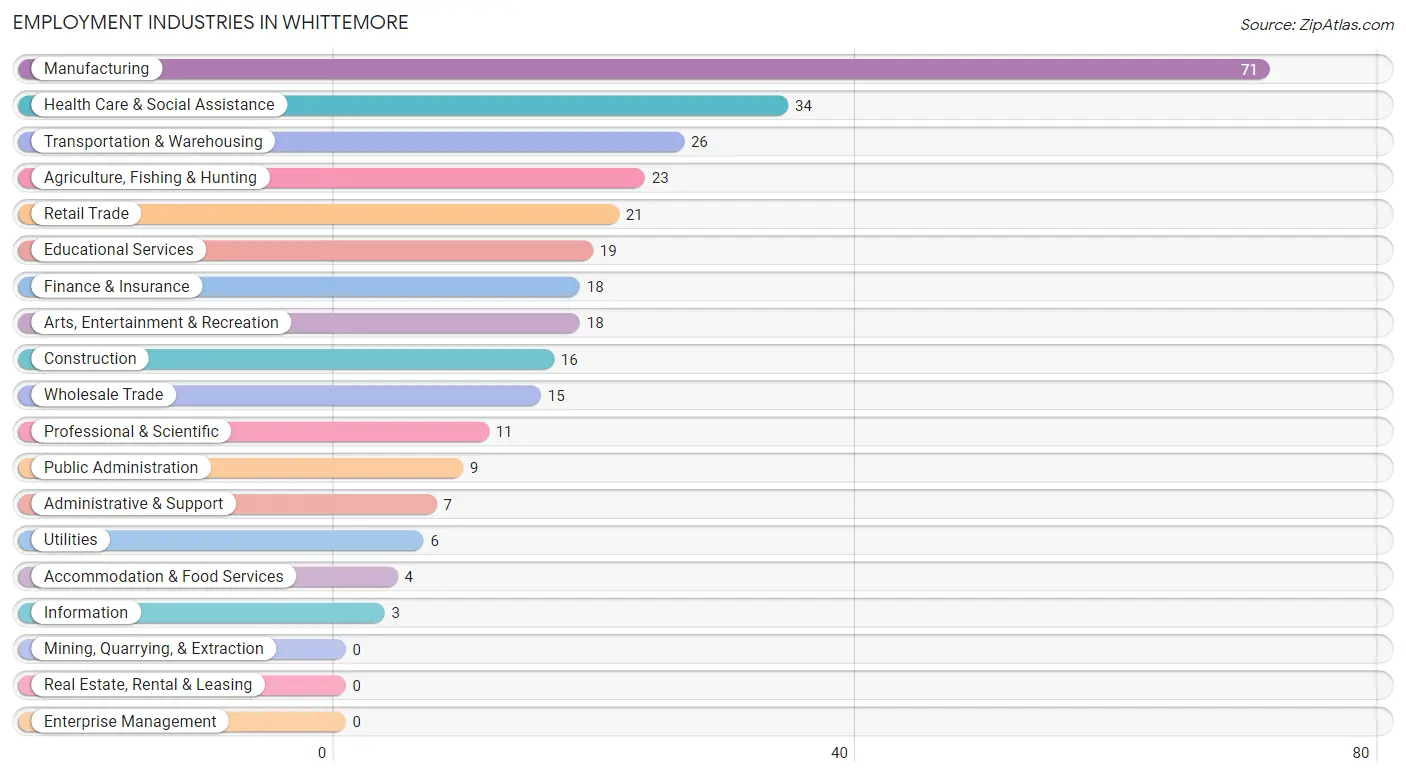
Employment Industries in Whittemore
The major employment industries in Whittemore include Manufacturing (71 | 23.3%), Health Care & Social Assistance (34 | 11.2%), Transportation & Warehousing (26 | 8.5%), Agriculture, Fishing & Hunting (23 | 7.5%), and Retail Trade (21 | 6.9%).
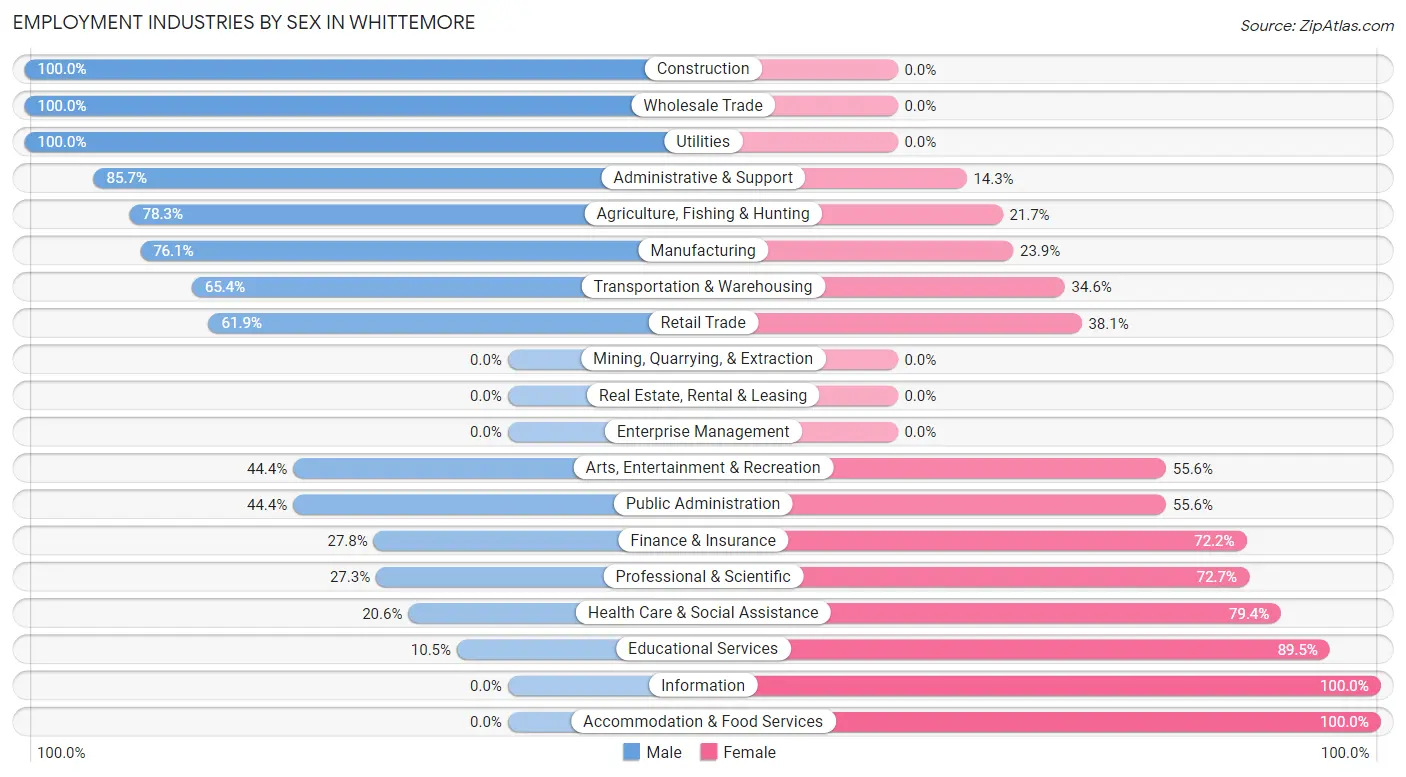
Employment Industries by Sex in Whittemore
The Whittemore industries that see more men than women are Construction (100.0%), Wholesale Trade (100.0%), and Utilities (100.0%), whereas the industries that tend to have a higher number of women are Information (100.0%), Accommodation & Food Services (100.0%), and Educational Services (89.5%).
| Industry | Male | Female |
| Agriculture, Fishing & Hunting | 18 (78.3%) | 5 (21.7%) |
| Mining, Quarrying, & Extraction | 0 (0.0%) | 0 (0.0%) |
| Construction | 16 (100.0%) | 0 (0.0%) |
| Manufacturing | 54 (76.1%) | 17 (23.9%) |
| Wholesale Trade | 15 (100.0%) | 0 (0.0%) |
| Retail Trade | 13 (61.9%) | 8 (38.1%) |
| Transportation & Warehousing | 17 (65.4%) | 9 (34.6%) |
| Utilities | 6 (100.0%) | 0 (0.0%) |
| Information | 0 (0.0%) | 3 (100.0%) |
| Finance & Insurance | 5 (27.8%) | 13 (72.2%) |
| Real Estate, Rental & Leasing | 0 (0.0%) | 0 (0.0%) |
| Professional & Scientific | 3 (27.3%) | 8 (72.7%) |
| Enterprise Management | 0 (0.0%) | 0 (0.0%) |
| Administrative & Support | 6 (85.7%) | 1 (14.3%) |
| Educational Services | 2 (10.5%) | 17 (89.5%) |
| Health Care & Social Assistance | 7 (20.6%) | 27 (79.4%) |
| Arts, Entertainment & Recreation | 8 (44.4%) | 10 (55.6%) |
| Accommodation & Food Services | 0 (0.0%) | 4 (100.0%) |
| Public Administration | 4 (44.4%) | 5 (55.6%) |
| Total | 176 (57.7%) | 129 (42.3%) |
Education in Whittemore
School Enrollment in Whittemore
The most common levels of schooling among the 133 students in Whittemore are high school (39 | 29.3%), kindergarten (30 | 22.6%), and elementary school (30 | 22.6%).
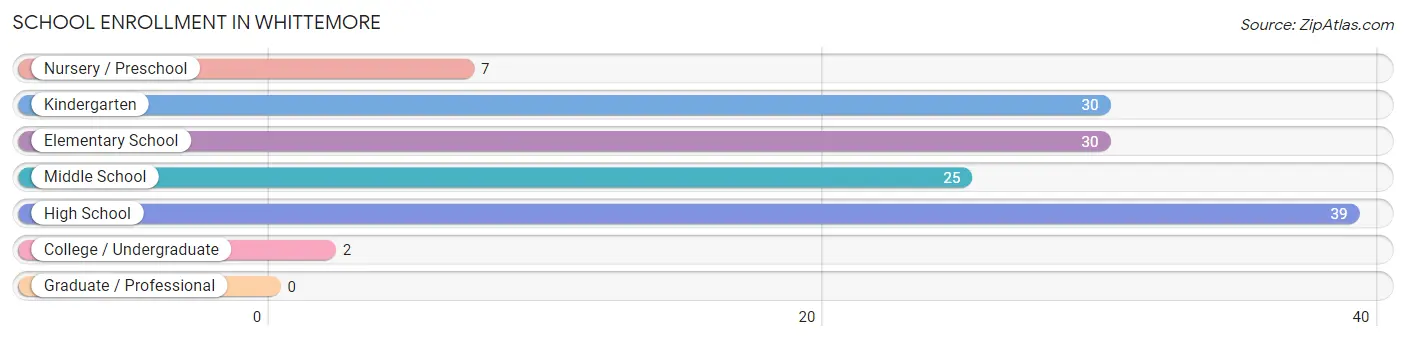
| School Level | # Students | % Students |
| Nursery / Preschool | 7 | 5.3% |
| Kindergarten | 30 | 22.6% |
| Elementary School | 30 | 22.6% |
| Middle School | 25 | 18.8% |
| High School | 39 | 29.3% |
| College / Undergraduate | 2 | 1.5% |
| Graduate / Professional | 0 | 0.0% |
| Total | 133 | 100.0% |
School Enrollment by Age by Funding Source in Whittemore
Out of a total of 133 students who are enrolled in schools in Whittemore, 75 (56.4%) attend a private institution, while the remaining 58 (43.6%) are enrolled in public schools. The age group of 10 to 14 year olds has the highest likelihood of being enrolled in private schools, with 25 (86.2% in the age bracket) enrolled. Conversely, the age group of 18 to 19 year olds has the lowest likelihood of being enrolled in a private school, with 14 (100.0% in the age bracket) attending a public institution.
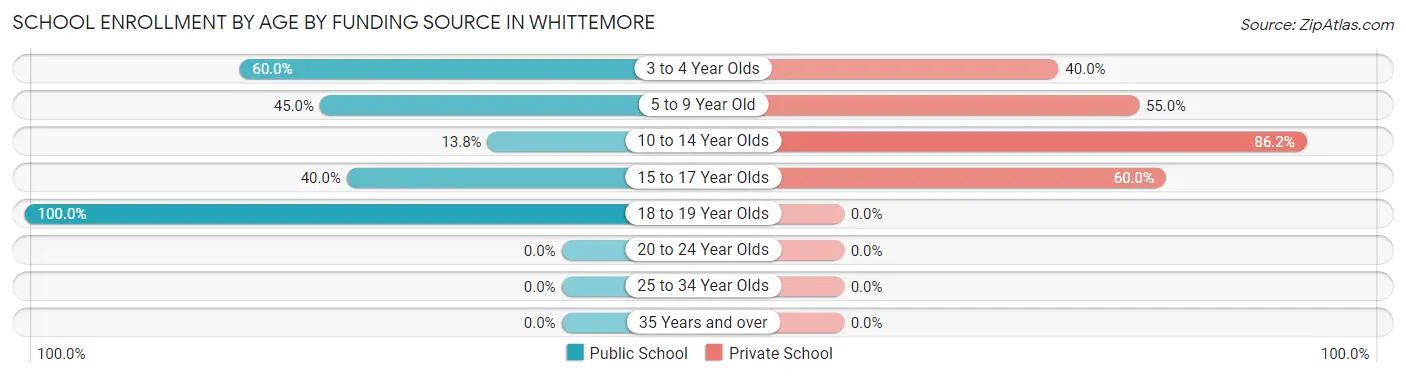
| Age Bracket | Public School | Private School |
| 3 to 4 Year Olds | 3 (60.0%) | 2 (40.0%) |
| 5 to 9 Year Old | 27 (45.0%) | 33 (55.0%) |
| 10 to 14 Year Olds | 4 (13.8%) | 25 (86.2%) |
| 15 to 17 Year Olds | 10 (40.0%) | 15 (60.0%) |
| 18 to 19 Year Olds | 14 (100.0%) | 0 (0.0%) |
| 20 to 24 Year Olds | 0 (0.0%) | 0 (0.0%) |
| 25 to 34 Year Olds | 0 (0.0%) | 0 (0.0%) |
| 35 Years and over | 0 (0.0%) | 0 (0.0%) |
| Total | 58 (43.6%) | 75 (56.4%) |
Educational Attainment by Field of Study in Whittemore
Business (33 | 45.2%), bio, nature & agricultural (18 | 24.7%), education (13 | 17.8%), social sciences (2 | 2.7%), and visual & performing arts (2 | 2.7%) are the most common fields of study among 73 individuals in Whittemore who have obtained a bachelor's degree or higher.
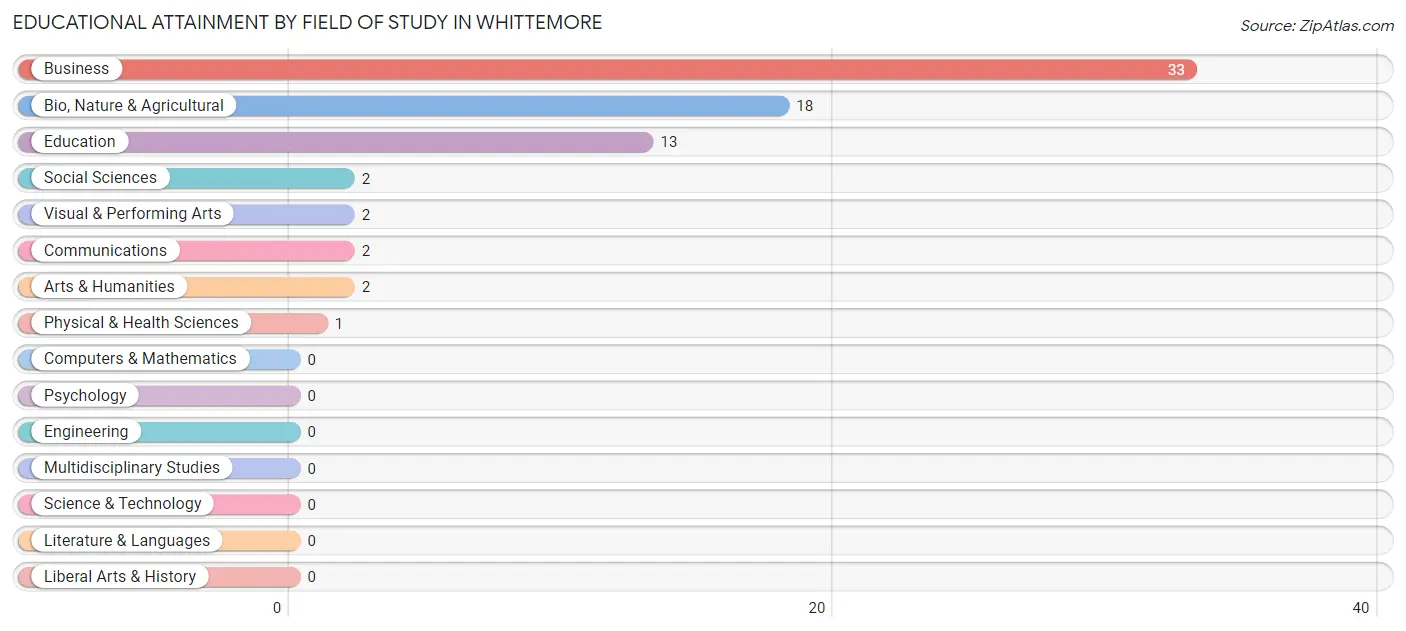
| Field of Study | # Graduates | % Graduates |
| Computers & Mathematics | 0 | 0.0% |
| Bio, Nature & Agricultural | 18 | 24.7% |
| Physical & Health Sciences | 1 | 1.4% |
| Psychology | 0 | 0.0% |
| Social Sciences | 2 | 2.7% |
| Engineering | 0 | 0.0% |
| Multidisciplinary Studies | 0 | 0.0% |
| Science & Technology | 0 | 0.0% |
| Business | 33 | 45.2% |
| Education | 13 | 17.8% |
| Literature & Languages | 0 | 0.0% |
| Liberal Arts & History | 0 | 0.0% |
| Visual & Performing Arts | 2 | 2.7% |
| Communications | 2 | 2.7% |
| Arts & Humanities | 2 | 2.7% |
| Total | 73 | 100.0% |
Transportation & Commute in Whittemore
Vehicle Availability by Sex in Whittemore
The most prevalent vehicle ownership categories in Whittemore are males with 2 vehicles (73, accounting for 41.5%) and females with 2 vehicles (69, making up 56.6%).
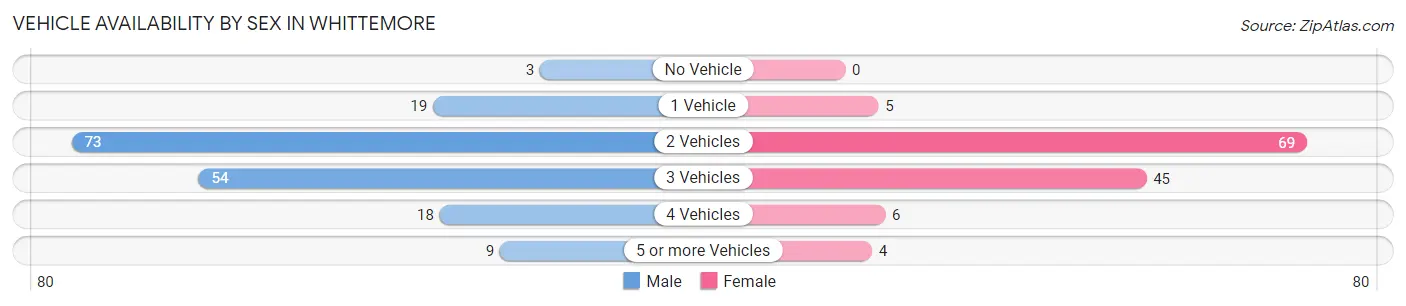
| Vehicles Available | Male | Female |
| No Vehicle | 3 (1.7%) | 0 (0.0%) |
| 1 Vehicle | 19 (10.8%) | 5 (3.9%) |
| 2 Vehicles | 73 (41.5%) | 69 (53.5%) |
| 3 Vehicles | 54 (30.7%) | 45 (34.9%) |
| 4 Vehicles | 18 (10.2%) | 6 (4.6%) |
| 5 or more Vehicles | 9 (5.1%) | 4 (3.1%) |
| Total | 176 (100.0%) | 129 (100.0%) |
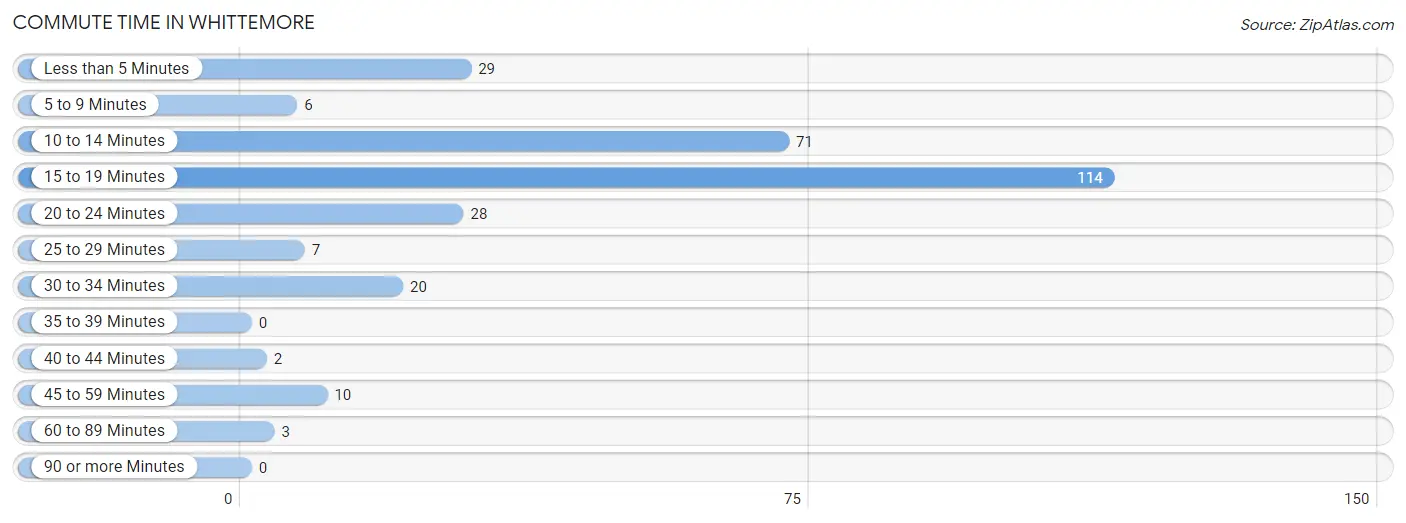
Commute Time in Whittemore
The most frequently occuring commute durations in Whittemore are 15 to 19 minutes (114 commuters, 39.3%), 10 to 14 minutes (71 commuters, 24.5%), and less than 5 minutes (29 commuters, 10.0%).
| Commute Time | # Commuters | % Commuters |
| Less than 5 Minutes | 29 | 10.0% |
| 5 to 9 Minutes | 6 | 2.1% |
| 10 to 14 Minutes | 71 | 24.5% |
| 15 to 19 Minutes | 114 | 39.3% |
| 20 to 24 Minutes | 28 | 9.7% |
| 25 to 29 Minutes | 7 | 2.4% |
| 30 to 34 Minutes | 20 | 6.9% |
| 35 to 39 Minutes | 0 | 0.0% |
| 40 to 44 Minutes | 2 | 0.7% |
| 45 to 59 Minutes | 10 | 3.5% |
| 60 to 89 Minutes | 3 | 1.0% |
| 90 or more Minutes | 0 | 0.0% |
Commute Time by Sex in Whittemore
The most common commute times in Whittemore are 10 to 14 minutes (52 commuters, 30.9%) for males and 15 to 19 minutes (68 commuters, 55.7%) for females.
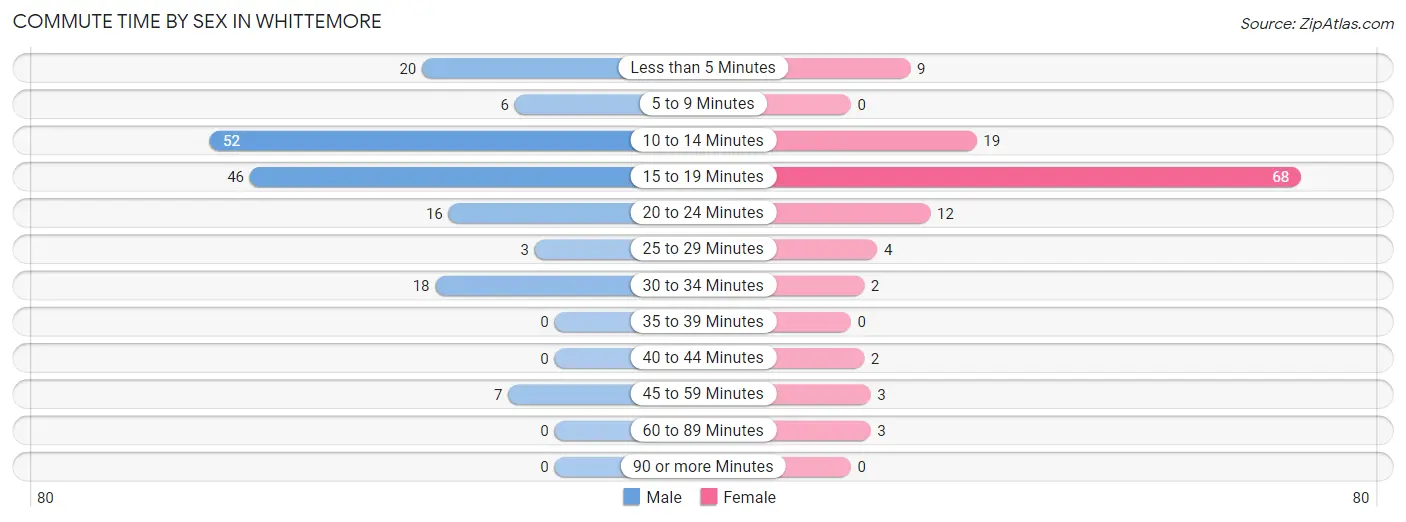
| Commute Time | Male | Female |
| Less than 5 Minutes | 20 (11.9%) | 9 (7.4%) |
| 5 to 9 Minutes | 6 (3.6%) | 0 (0.0%) |
| 10 to 14 Minutes | 52 (30.9%) | 19 (15.6%) |
| 15 to 19 Minutes | 46 (27.4%) | 68 (55.7%) |
| 20 to 24 Minutes | 16 (9.5%) | 12 (9.8%) |
| 25 to 29 Minutes | 3 (1.8%) | 4 (3.3%) |
| 30 to 34 Minutes | 18 (10.7%) | 2 (1.6%) |
| 35 to 39 Minutes | 0 (0.0%) | 0 (0.0%) |
| 40 to 44 Minutes | 0 (0.0%) | 2 (1.6%) |
| 45 to 59 Minutes | 7 (4.2%) | 3 (2.5%) |
| 60 to 89 Minutes | 0 (0.0%) | 3 (2.5%) |
| 90 or more Minutes | 0 (0.0%) | 0 (0.0%) |
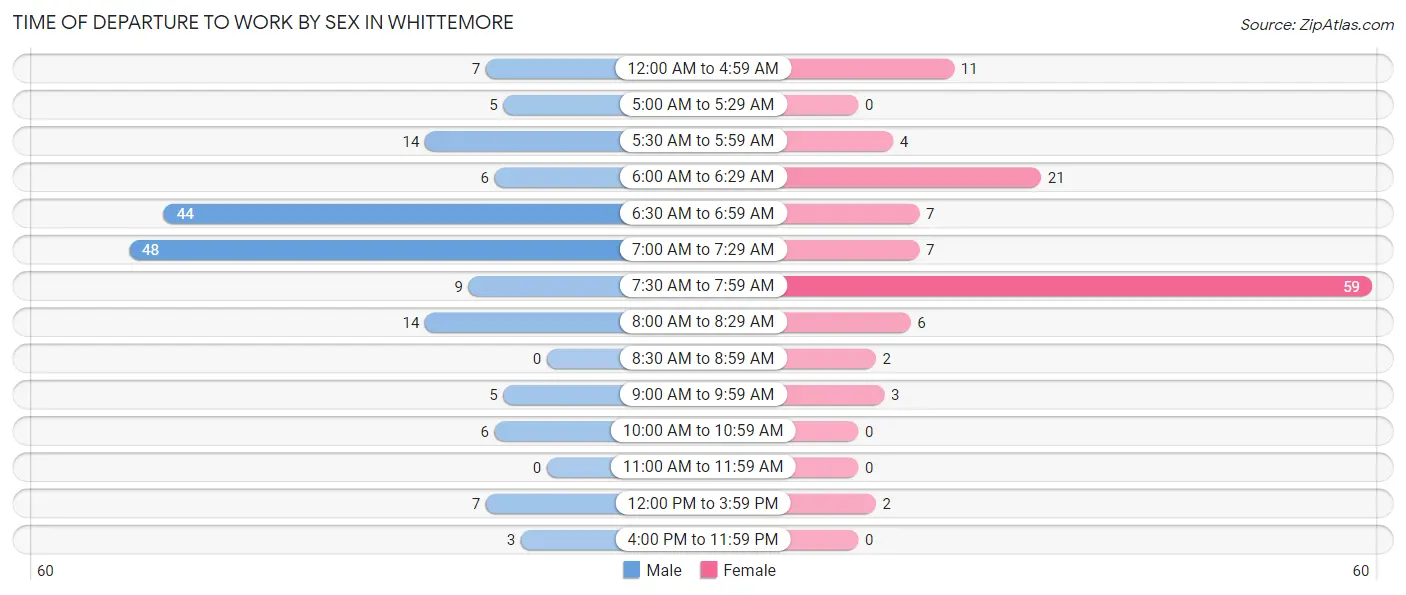
Time of Departure to Work by Sex in Whittemore
The most frequent times of departure to work in Whittemore are 7:00 AM to 7:29 AM (48, 28.6%) for males and 7:30 AM to 7:59 AM (59, 48.4%) for females.
| Time of Departure | Male | Female |
| 12:00 AM to 4:59 AM | 7 (4.2%) | 11 (9.0%) |
| 5:00 AM to 5:29 AM | 5 (3.0%) | 0 (0.0%) |
| 5:30 AM to 5:59 AM | 14 (8.3%) | 4 (3.3%) |
| 6:00 AM to 6:29 AM | 6 (3.6%) | 21 (17.2%) |
| 6:30 AM to 6:59 AM | 44 (26.2%) | 7 (5.7%) |
| 7:00 AM to 7:29 AM | 48 (28.6%) | 7 (5.7%) |
| 7:30 AM to 7:59 AM | 9 (5.4%) | 59 (48.4%) |
| 8:00 AM to 8:29 AM | 14 (8.3%) | 6 (4.9%) |
| 8:30 AM to 8:59 AM | 0 (0.0%) | 2 (1.6%) |
| 9:00 AM to 9:59 AM | 5 (3.0%) | 3 (2.5%) |
| 10:00 AM to 10:59 AM | 6 (3.6%) | 0 (0.0%) |
| 11:00 AM to 11:59 AM | 0 (0.0%) | 0 (0.0%) |
| 12:00 PM to 3:59 PM | 7 (4.2%) | 2 (1.6%) |
| 4:00 PM to 11:59 PM | 3 (1.8%) | 0 (0.0%) |
| Total | 168 (100.0%) | 122 (100.0%) |
Housing Occupancy in Whittemore
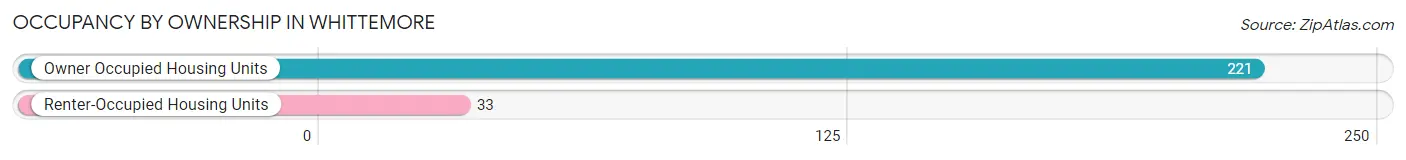
Occupancy by Ownership in Whittemore
Of the total 254 dwellings in Whittemore, owner-occupied units account for 221 (87.0%), while renter-occupied units make up 33 (13.0%).
| Occupancy | # Housing Units | % Housing Units |
| Owner Occupied Housing Units | 221 | 87.0% |
| Renter-Occupied Housing Units | 33 | 13.0% |
| Total Occupied Housing Units | 254 | 100.0% |
Occupancy by Household Size in Whittemore
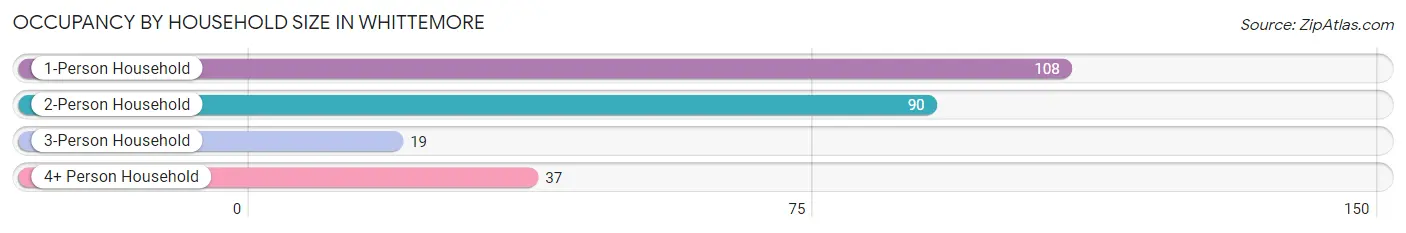
| Household Size | # Housing Units | % Housing Units |
| 1-Person Household | 108 | 42.5% |
| 2-Person Household | 90 | 35.4% |
| 3-Person Household | 19 | 7.5% |
| 4+ Person Household | 37 | 14.6% |
| Total Housing Units | 254 | 100.0% |
Occupancy by Ownership by Household Size in Whittemore
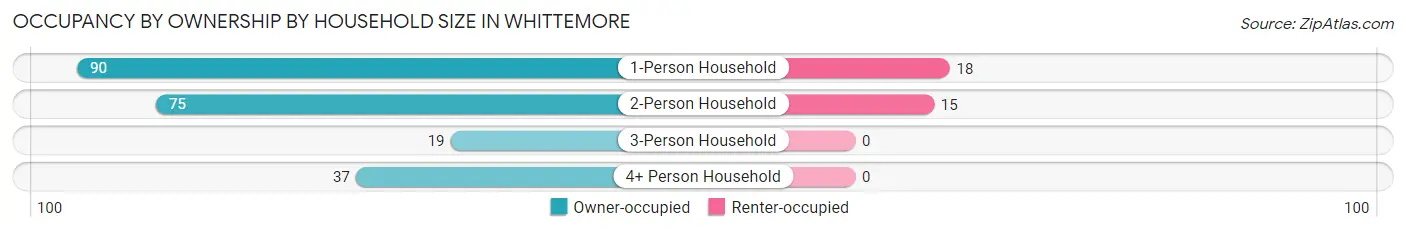
| Household Size | Owner-occupied | Renter-occupied |
| 1-Person Household | 90 (83.3%) | 18 (16.7%) |
| 2-Person Household | 75 (83.3%) | 15 (16.7%) |
| 3-Person Household | 19 (100.0%) | 0 (0.0%) |
| 4+ Person Household | 37 (100.0%) | 0 (0.0%) |
| Total Housing Units | 221 (87.0%) | 33 (13.0%) |
Occupancy by Educational Attainment in Whittemore
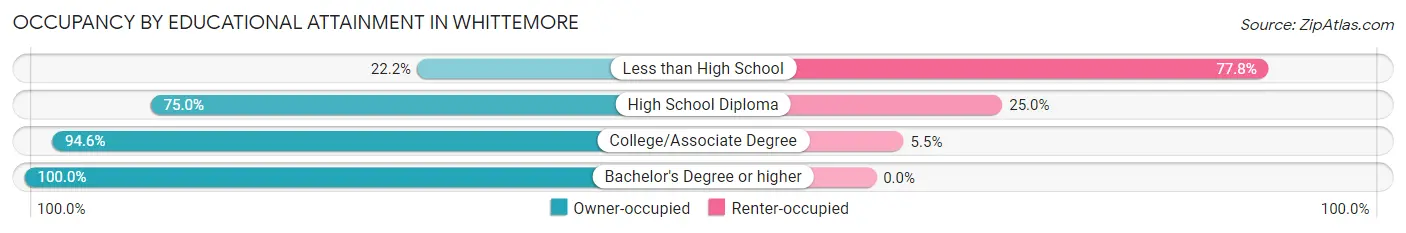
| Household Size | Owner-occupied | Renter-occupied |
| Less than High School | 2 (22.2%) | 7 (77.8%) |
| High School Diploma | 60 (75.0%) | 20 (25.0%) |
| College/Associate Degree | 104 (94.6%) | 6 (5.4%) |
| Bachelor's Degree or higher | 55 (100.0%) | 0 (0.0%) |
Occupancy by Age of Householder in Whittemore
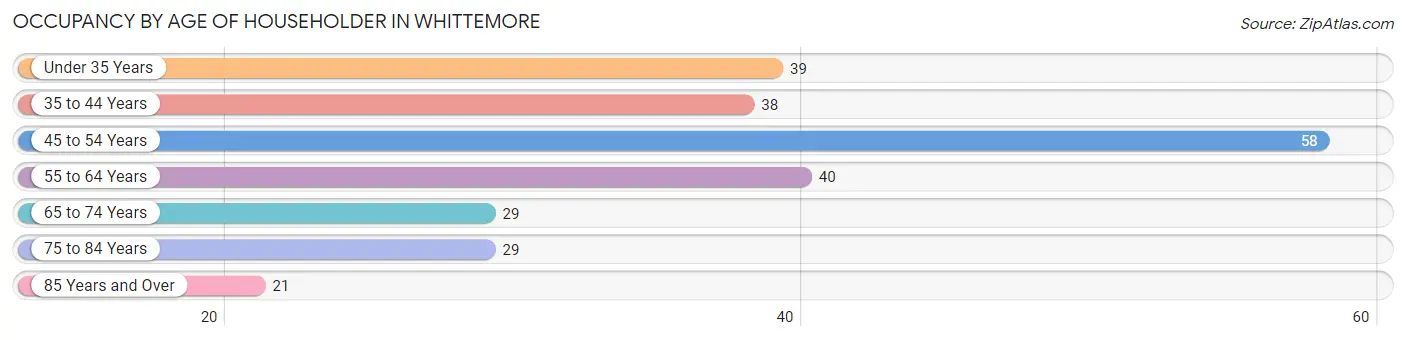
| Age Bracket | # Households | % Households |
| Under 35 Years | 39 | 15.3% |
| 35 to 44 Years | 38 | 15.0% |
| 45 to 54 Years | 58 | 22.8% |
| 55 to 64 Years | 40 | 15.8% |
| 65 to 74 Years | 29 | 11.4% |
| 75 to 84 Years | 29 | 11.4% |
| 85 Years and Over | 21 | 8.3% |
| Total | 254 | 100.0% |
Housing Finances in Whittemore
Median Income by Occupancy in Whittemore
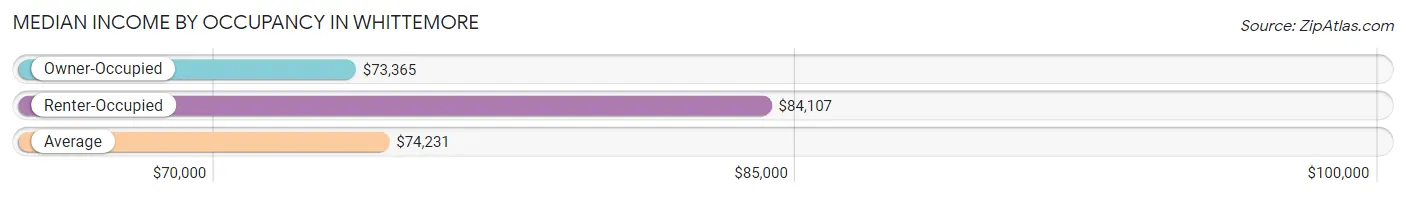
| Occupancy Type | # Households | Median Income |
| Owner-Occupied | 221 (87.0%) | $73,365 |
| Renter-Occupied | 33 (13.0%) | $84,107 |
| Average | 254 (100.0%) | $74,231 |
Occupancy by Householder Income Bracket in Whittemore
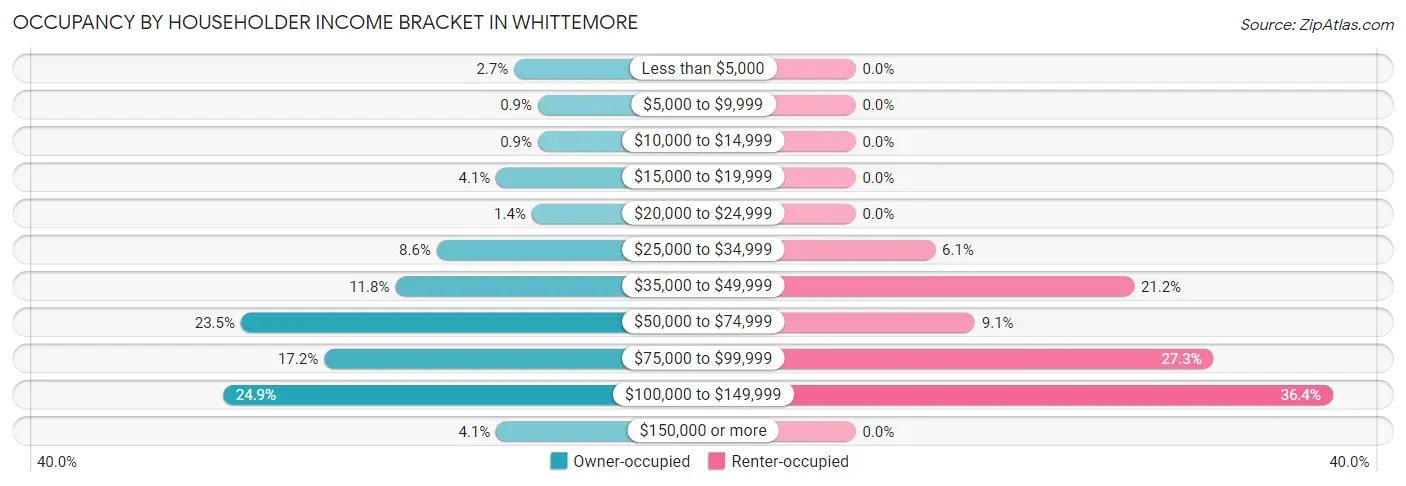
| Income Bracket | Owner-occupied | Renter-occupied |
| Less than $5,000 | 6 (2.7%) | 0 (0.0%) |
| $5,000 to $9,999 | 2 (0.9%) | 0 (0.0%) |
| $10,000 to $14,999 | 2 (0.9%) | 0 (0.0%) |
| $15,000 to $19,999 | 9 (4.1%) | 0 (0.0%) |
| $20,000 to $24,999 | 3 (1.4%) | 0 (0.0%) |
| $25,000 to $34,999 | 19 (8.6%) | 2 (6.1%) |
| $35,000 to $49,999 | 26 (11.8%) | 7 (21.2%) |
| $50,000 to $74,999 | 52 (23.5%) | 3 (9.1%) |
| $75,000 to $99,999 | 38 (17.2%) | 9 (27.3%) |
| $100,000 to $149,999 | 55 (24.9%) | 12 (36.4%) |
| $150,000 or more | 9 (4.1%) | 0 (0.0%) |
| Total | 221 (100.0%) | 33 (100.0%) |
Monthly Housing Cost Tiers in Whittemore
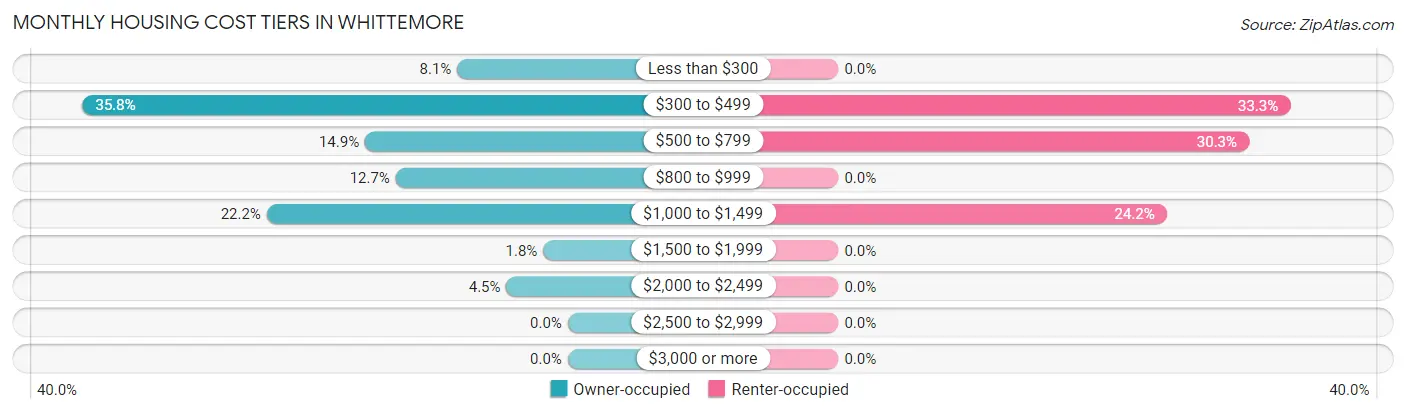
| Monthly Cost | Owner-occupied | Renter-occupied |
| Less than $300 | 18 (8.1%) | 0 (0.0%) |
| $300 to $499 | 79 (35.7%) | 11 (33.3%) |
| $500 to $799 | 33 (14.9%) | 10 (30.3%) |
| $800 to $999 | 28 (12.7%) | 0 (0.0%) |
| $1,000 to $1,499 | 49 (22.2%) | 8 (24.2%) |
| $1,500 to $1,999 | 4 (1.8%) | 0 (0.0%) |
| $2,000 to $2,499 | 10 (4.5%) | 0 (0.0%) |
| $2,500 to $2,999 | 0 (0.0%) | 0 (0.0%) |
| $3,000 or more | 0 (0.0%) | 0 (0.0%) |
| Total | 221 (100.0%) | 33 (100.0%) |
Physical Housing Characteristics in Whittemore
Housing Structures in Whittemore
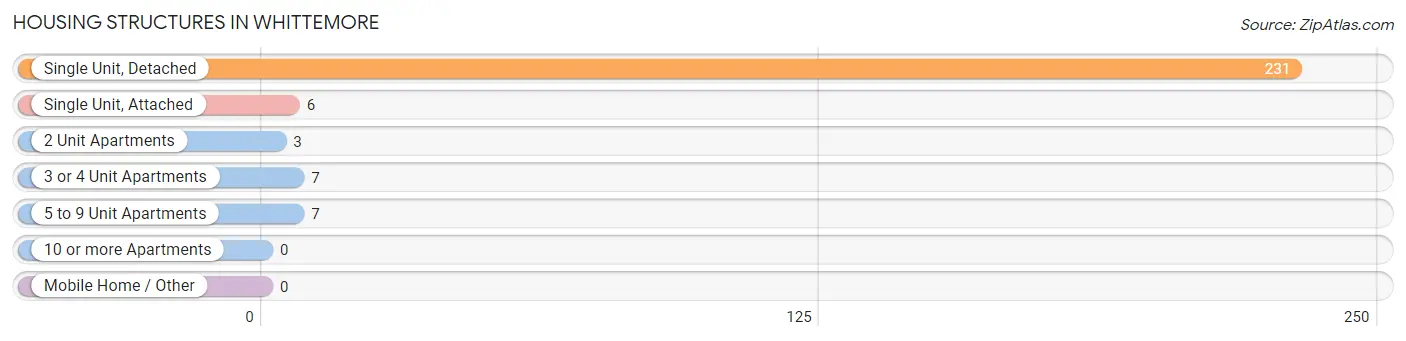
| Structure Type | # Housing Units | % Housing Units |
| Single Unit, Detached | 231 | 90.9% |
| Single Unit, Attached | 6 | 2.4% |
| 2 Unit Apartments | 3 | 1.2% |
| 3 or 4 Unit Apartments | 7 | 2.8% |
| 5 to 9 Unit Apartments | 7 | 2.8% |
| 10 or more Apartments | 0 | 0.0% |
| Mobile Home / Other | 0 | 0.0% |
| Total | 254 | 100.0% |
Housing Structures by Occupancy in Whittemore
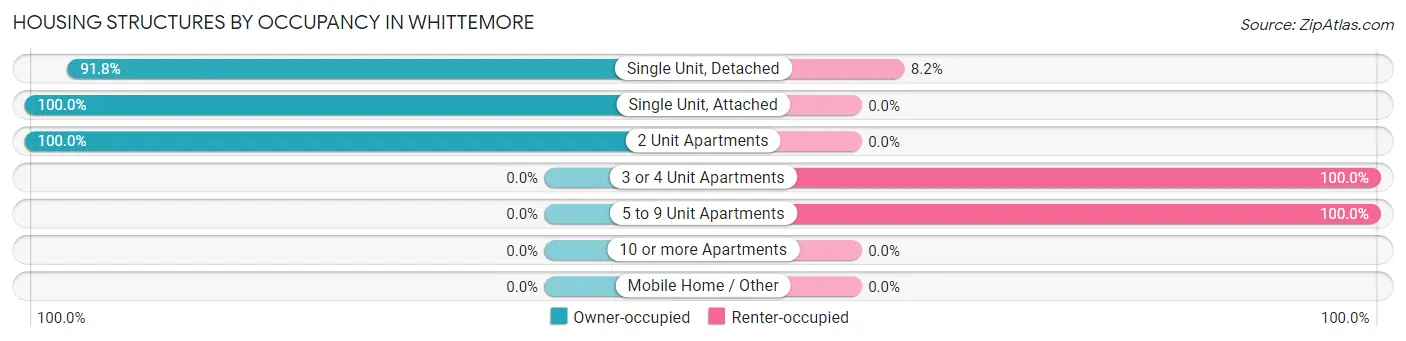
| Structure Type | Owner-occupied | Renter-occupied |
| Single Unit, Detached | 212 (91.8%) | 19 (8.2%) |
| Single Unit, Attached | 6 (100.0%) | 0 (0.0%) |
| 2 Unit Apartments | 3 (100.0%) | 0 (0.0%) |
| 3 or 4 Unit Apartments | 0 (0.0%) | 7 (100.0%) |
| 5 to 9 Unit Apartments | 0 (0.0%) | 7 (100.0%) |
| 10 or more Apartments | 0 (0.0%) | 0 (0.0%) |
| Mobile Home / Other | 0 (0.0%) | 0 (0.0%) |
| Total | 221 (87.0%) | 33 (13.0%) |
Housing Structures by Number of Rooms in Whittemore
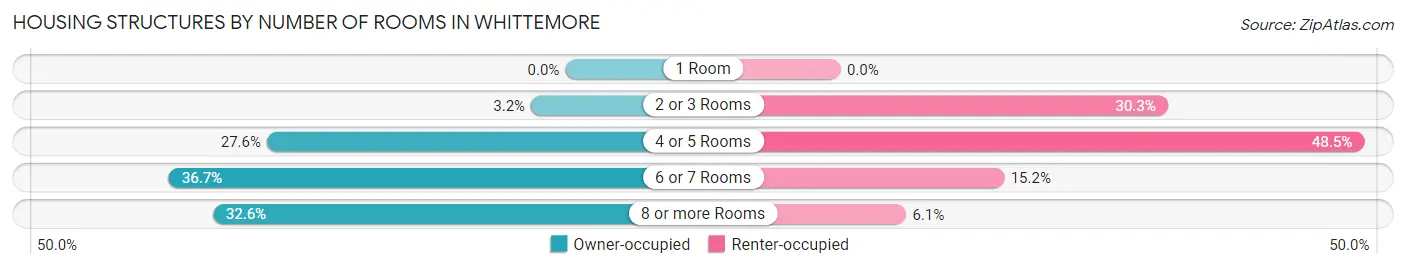
| Number of Rooms | Owner-occupied | Renter-occupied |
| 1 Room | 0 (0.0%) | 0 (0.0%) |
| 2 or 3 Rooms | 7 (3.2%) | 10 (30.3%) |
| 4 or 5 Rooms | 61 (27.6%) | 16 (48.5%) |
| 6 or 7 Rooms | 81 (36.6%) | 5 (15.1%) |
| 8 or more Rooms | 72 (32.6%) | 2 (6.1%) |
| Total | 221 (100.0%) | 33 (100.0%) |
Housing Structure by Heating Type in Whittemore
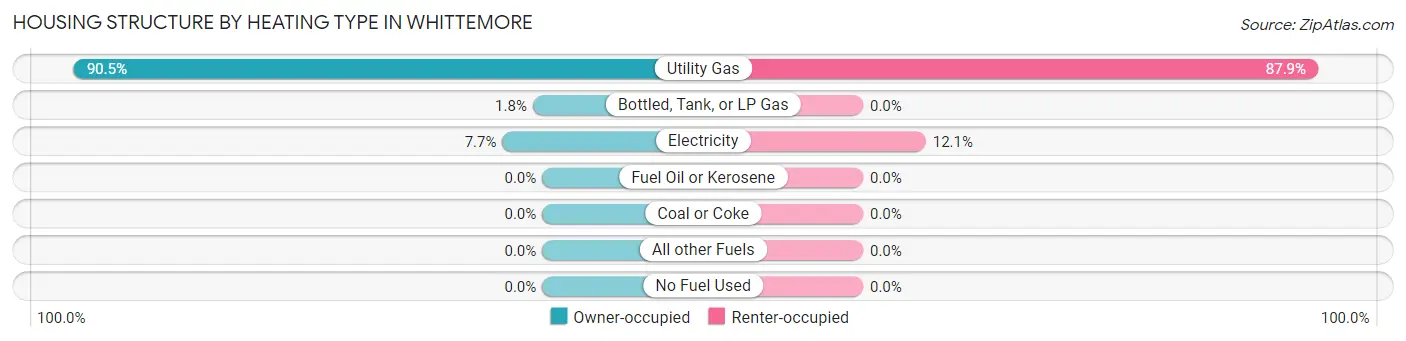
| Heating Type | Owner-occupied | Renter-occupied |
| Utility Gas | 200 (90.5%) | 29 (87.9%) |
| Bottled, Tank, or LP Gas | 4 (1.8%) | 0 (0.0%) |
| Electricity | 17 (7.7%) | 4 (12.1%) |
| Fuel Oil or Kerosene | 0 (0.0%) | 0 (0.0%) |
| Coal or Coke | 0 (0.0%) | 0 (0.0%) |
| All other Fuels | 0 (0.0%) | 0 (0.0%) |
| No Fuel Used | 0 (0.0%) | 0 (0.0%) |
| Total | 221 (100.0%) | 33 (100.0%) |
Household Vehicle Usage in Whittemore
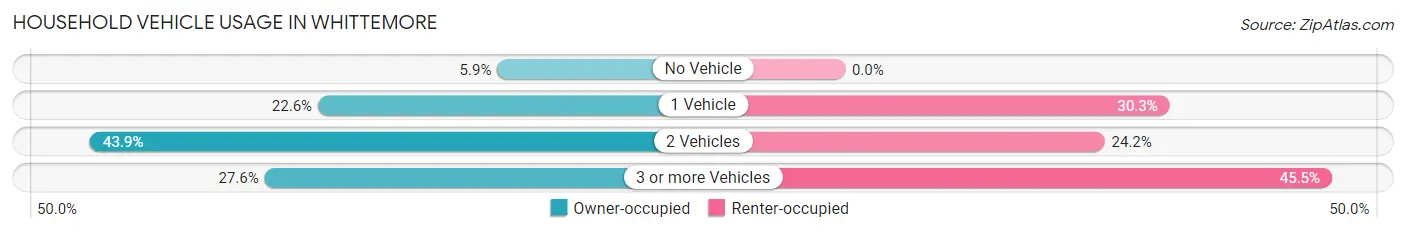
| Vehicles per Household | Owner-occupied | Renter-occupied |
| No Vehicle | 13 (5.9%) | 0 (0.0%) |
| 1 Vehicle | 50 (22.6%) | 10 (30.3%) |
| 2 Vehicles | 97 (43.9%) | 8 (24.2%) |
| 3 or more Vehicles | 61 (27.6%) | 15 (45.5%) |
| Total | 221 (100.0%) | 33 (100.0%) |
Real Estate & Mortgages in Whittemore
Real Estate and Mortgage Overview in Whittemore
| Characteristic | Without Mortgage | With Mortgage |
| Housing Units | 110 | 111 |
| Median Property Value | $79,400 | $91,100 |
| Median Household Income | $51,250 | $7 |
| Monthly Housing Costs | $413 | $0 |
| Real Estate Taxes | $967 | $0 |
Property Value by Mortgage Status in Whittemore
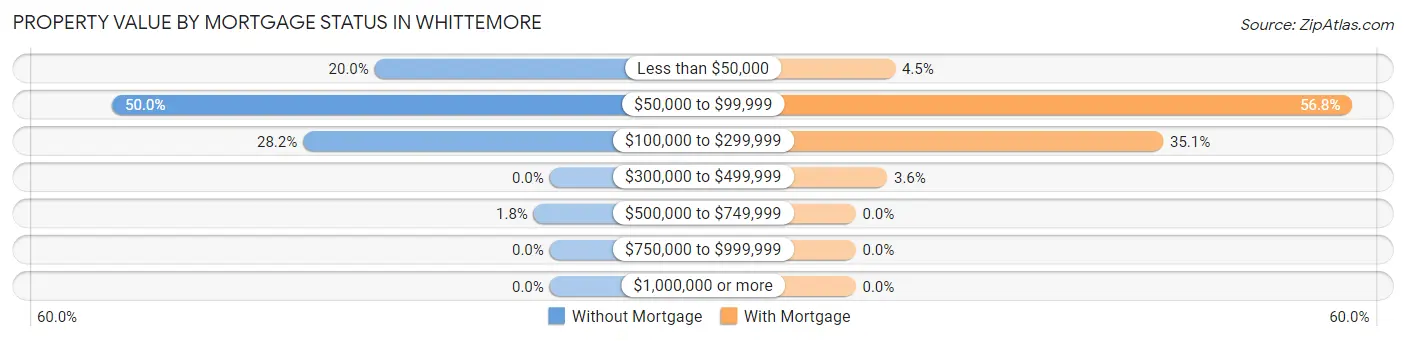
| Property Value | Without Mortgage | With Mortgage |
| Less than $50,000 | 22 (20.0%) | 5 (4.5%) |
| $50,000 to $99,999 | 55 (50.0%) | 63 (56.8%) |
| $100,000 to $299,999 | 31 (28.2%) | 39 (35.1%) |
| $300,000 to $499,999 | 0 (0.0%) | 4 (3.6%) |
| $500,000 to $749,999 | 2 (1.8%) | 0 (0.0%) |
| $750,000 to $999,999 | 0 (0.0%) | 0 (0.0%) |
| $1,000,000 or more | 0 (0.0%) | 0 (0.0%) |
| Total | 110 (100.0%) | 111 (100.0%) |
Household Income by Mortgage Status in Whittemore
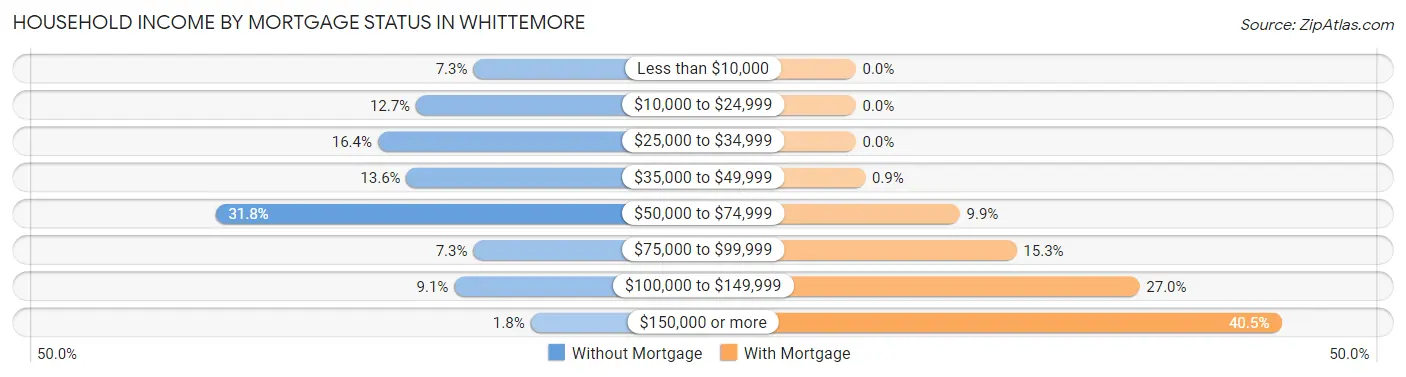
| Household Income | Without Mortgage | With Mortgage |
| Less than $10,000 | 8 (7.3%) | 0 (0.0%) |
| $10,000 to $24,999 | 14 (12.7%) | 0 (0.0%) |
| $25,000 to $34,999 | 18 (16.4%) | 0 (0.0%) |
| $35,000 to $49,999 | 15 (13.6%) | 1 (0.9%) |
| $50,000 to $74,999 | 35 (31.8%) | 11 (9.9%) |
| $75,000 to $99,999 | 8 (7.3%) | 17 (15.3%) |
| $100,000 to $149,999 | 10 (9.1%) | 30 (27.0%) |
| $150,000 or more | 2 (1.8%) | 45 (40.5%) |
| Total | 110 (100.0%) | 111 (100.0%) |
Property Value to Household Income Ratio in Whittemore
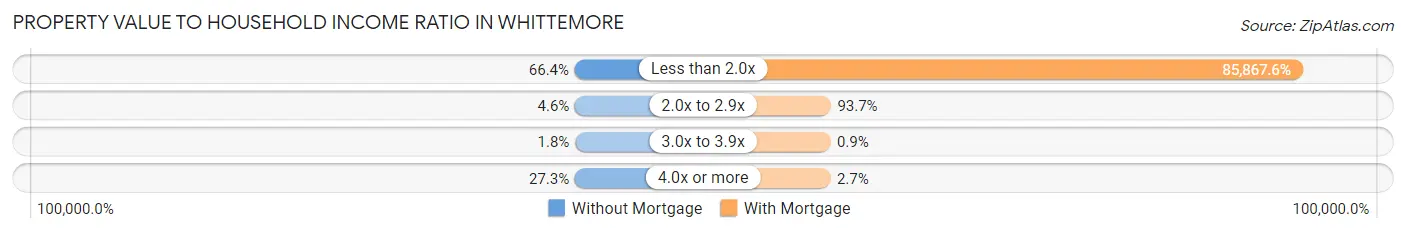
| Value-to-Income Ratio | Without Mortgage | With Mortgage |
| Less than 2.0x | 73 (66.4%) | 95,313 (85,867.6%) |
| 2.0x to 2.9x | 5 (4.5%) | 104 (93.7%) |
| 3.0x to 3.9x | 2 (1.8%) | 1 (0.9%) |
| 4.0x or more | 30 (27.3%) | 3 (2.7%) |
| Total | 110 (100.0%) | 111 (100.0%) |
Real Estate Taxes by Mortgage Status in Whittemore
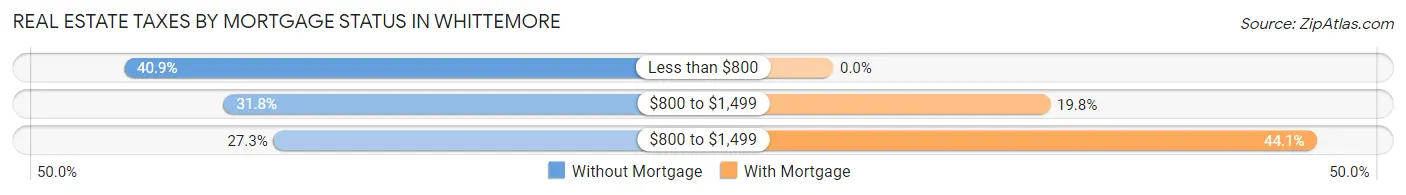
| Property Taxes | Without Mortgage | With Mortgage |
| Less than $800 | 45 (40.9%) | 0 (0.0%) |
| $800 to $1,499 | 35 (31.8%) | 22 (19.8%) |
| $800 to $1,499 | 30 (27.3%) | 49 (44.1%) |
| Total | 110 (100.0%) | 111 (100.0%) |
Health & Disability in Whittemore
Health Insurance Coverage by Age in Whittemore
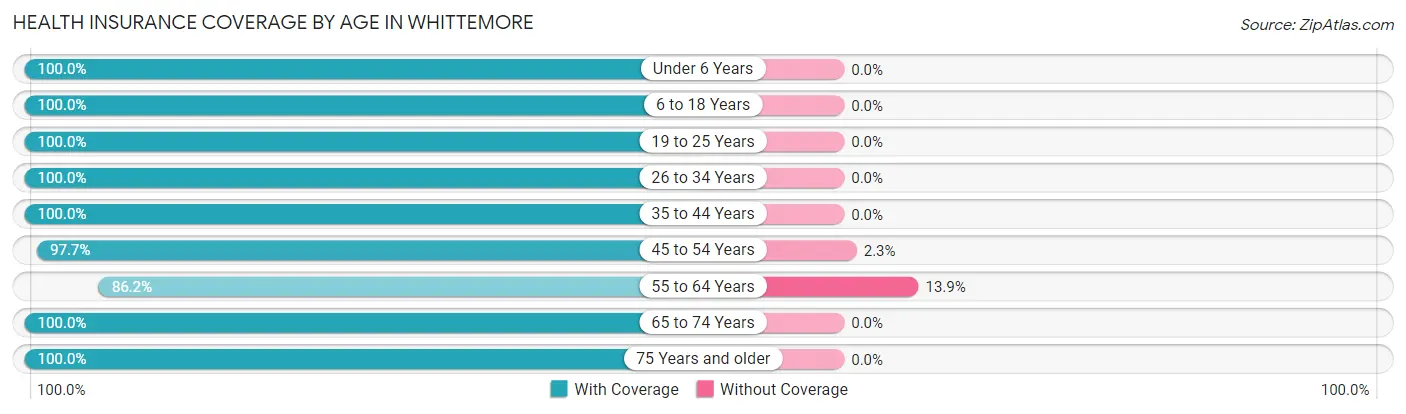
| Age Bracket | With Coverage | Without Coverage |
| Under 6 Years | 38 (100.0%) | 0 (0.0%) |
| 6 to 18 Years | 103 (100.0%) | 0 (0.0%) |
| 19 to 25 Years | 15 (100.0%) | 0 (0.0%) |
| 26 to 34 Years | 63 (100.0%) | 0 (0.0%) |
| 35 to 44 Years | 53 (100.0%) | 0 (0.0%) |
| 45 to 54 Years | 84 (97.7%) | 2 (2.3%) |
| 55 to 64 Years | 56 (86.2%) | 9 (13.9%) |
| 65 to 74 Years | 54 (100.0%) | 0 (0.0%) |
| 75 Years and older | 60 (100.0%) | 0 (0.0%) |
| Total | 526 (98.0%) | 11 (2.1%) |
Health Insurance Coverage by Citizenship Status in Whittemore
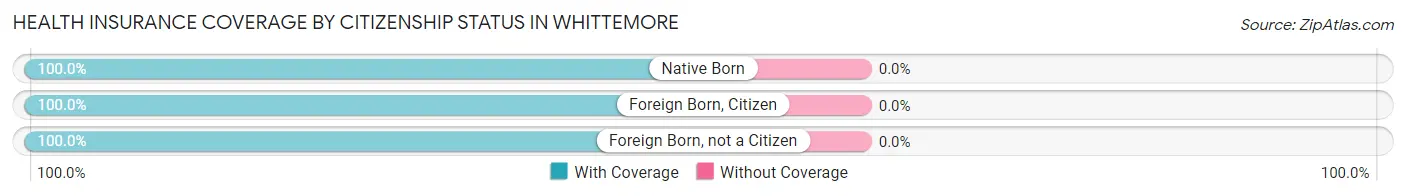
| Citizenship Status | With Coverage | Without Coverage |
| Native Born | 38 (100.0%) | 0 (0.0%) |
| Foreign Born, Citizen | 103 (100.0%) | 0 (0.0%) |
| Foreign Born, not a Citizen | 15 (100.0%) | 0 (0.0%) |
Health Insurance Coverage by Household Income in Whittemore
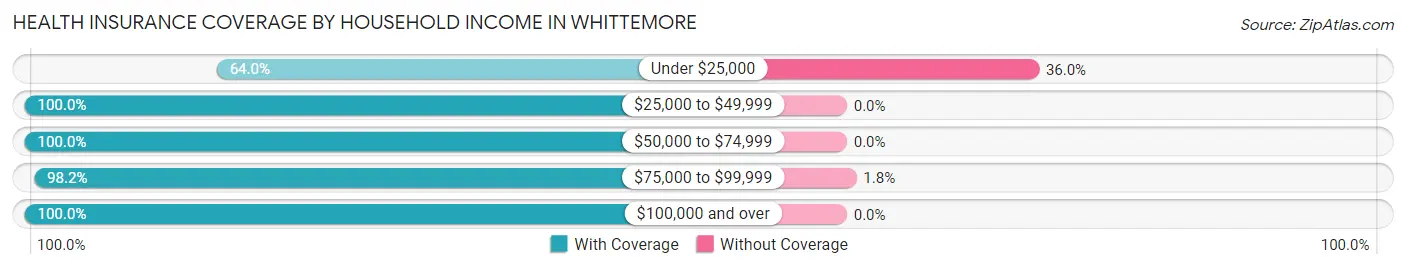
| Household Income | With Coverage | Without Coverage |
| Under $25,000 | 16 (64.0%) | 9 (36.0%) |
| $25,000 to $49,999 | 90 (100.0%) | 0 (0.0%) |
| $50,000 to $74,999 | 81 (100.0%) | 0 (0.0%) |
| $75,000 to $99,999 | 109 (98.2%) | 2 (1.8%) |
| $100,000 and over | 230 (100.0%) | 0 (0.0%) |
Public vs Private Health Insurance Coverage by Age in Whittemore
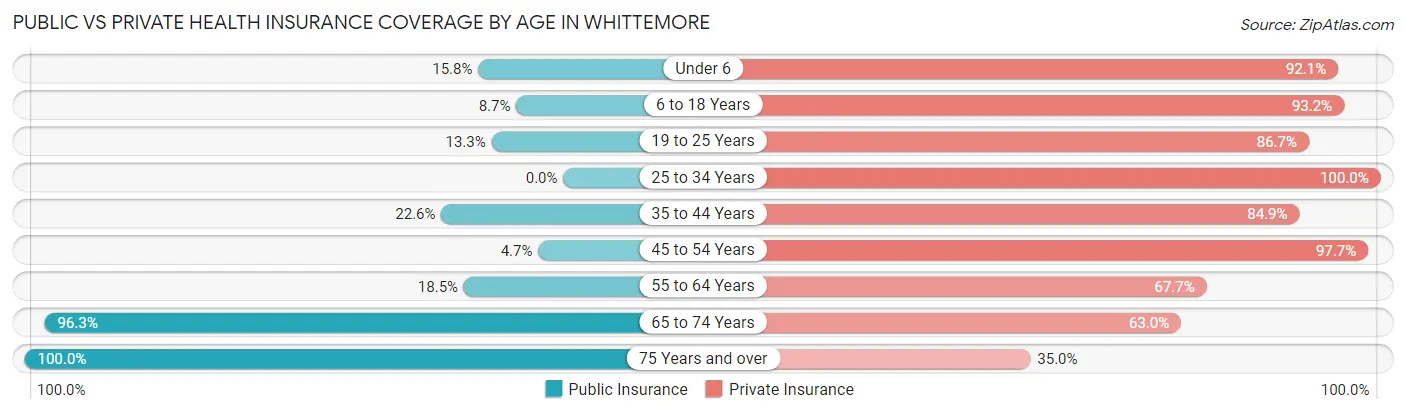
| Age Bracket | Public Insurance | Private Insurance |
| Under 6 | 6 (15.8%) | 35 (92.1%) |
| 6 to 18 Years | 9 (8.7%) | 96 (93.2%) |
| 19 to 25 Years | 2 (13.3%) | 13 (86.7%) |
| 25 to 34 Years | 0 (0.0%) | 63 (100.0%) |
| 35 to 44 Years | 12 (22.6%) | 45 (84.9%) |
| 45 to 54 Years | 4 (4.6%) | 84 (97.7%) |
| 55 to 64 Years | 12 (18.5%) | 44 (67.7%) |
| 65 to 74 Years | 52 (96.3%) | 34 (63.0%) |
| 75 Years and over | 60 (100.0%) | 21 (35.0%) |
| Total | 157 (29.2%) | 435 (81.0%) |
Disability Status by Sex by Age in Whittemore
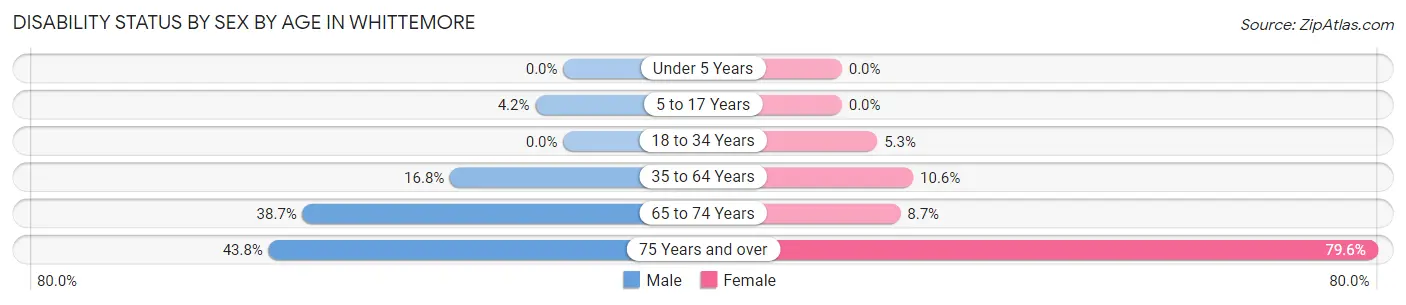
| Age Bracket | Male | Female |
| Under 5 Years | 0 (0.0%) | 0 (0.0%) |
| 5 to 17 Years | 2 (4.2%) | 0 (0.0%) |
| 18 to 34 Years | 0 (0.0%) | 2 (5.3%) |
| 35 to 64 Years | 20 (16.8%) | 9 (10.6%) |
| 65 to 74 Years | 12 (38.7%) | 2 (8.7%) |
| 75 Years and over | 7 (43.8%) | 35 (79.5%) |
Disability Class by Sex by Age in Whittemore
Disability Class: Hearing Difficulty
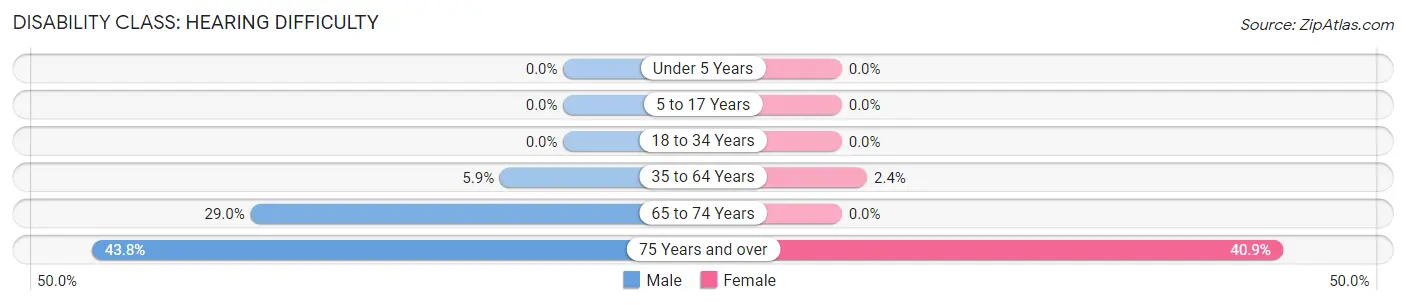
| Age Bracket | Male | Female |
| Under 5 Years | 0 (0.0%) | 0 (0.0%) |
| 5 to 17 Years | 0 (0.0%) | 0 (0.0%) |
| 18 to 34 Years | 0 (0.0%) | 0 (0.0%) |
| 35 to 64 Years | 7 (5.9%) | 2 (2.4%) |
| 65 to 74 Years | 9 (29.0%) | 0 (0.0%) |
| 75 Years and over | 7 (43.8%) | 18 (40.9%) |
Disability Class: Vision Difficulty
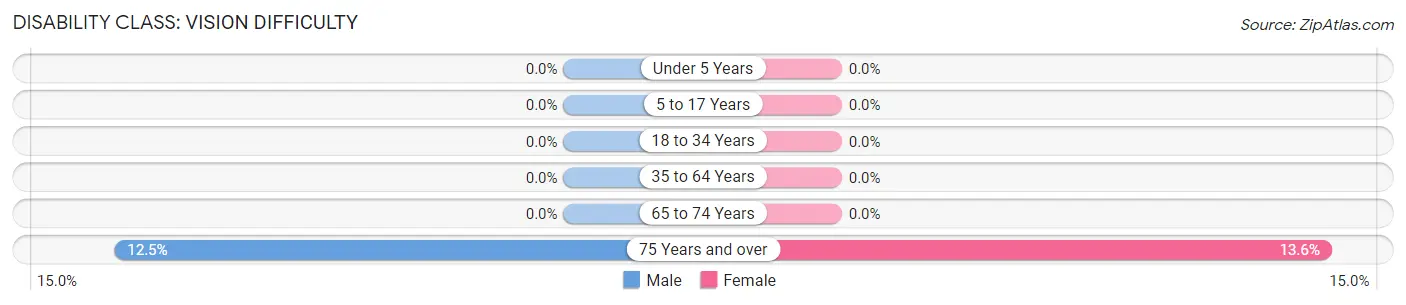
| Age Bracket | Male | Female |
| Under 5 Years | 0 (0.0%) | 0 (0.0%) |
| 5 to 17 Years | 0 (0.0%) | 0 (0.0%) |
| 18 to 34 Years | 0 (0.0%) | 0 (0.0%) |
| 35 to 64 Years | 0 (0.0%) | 0 (0.0%) |
| 65 to 74 Years | 0 (0.0%) | 0 (0.0%) |
| 75 Years and over | 2 (12.5%) | 6 (13.6%) |
Disability Class: Cognitive Difficulty
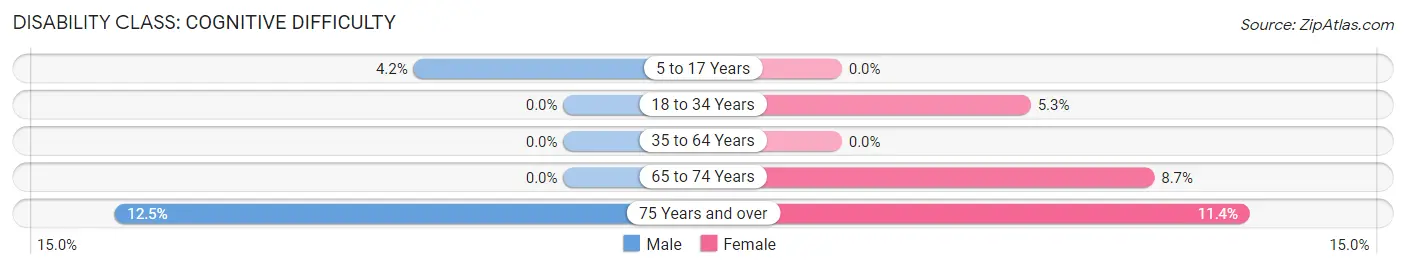
| Age Bracket | Male | Female |
| 5 to 17 Years | 2 (4.2%) | 0 (0.0%) |
| 18 to 34 Years | 0 (0.0%) | 2 (5.3%) |
| 35 to 64 Years | 0 (0.0%) | 0 (0.0%) |
| 65 to 74 Years | 0 (0.0%) | 2 (8.7%) |
| 75 Years and over | 2 (12.5%) | 5 (11.4%) |
Disability Class: Ambulatory Difficulty
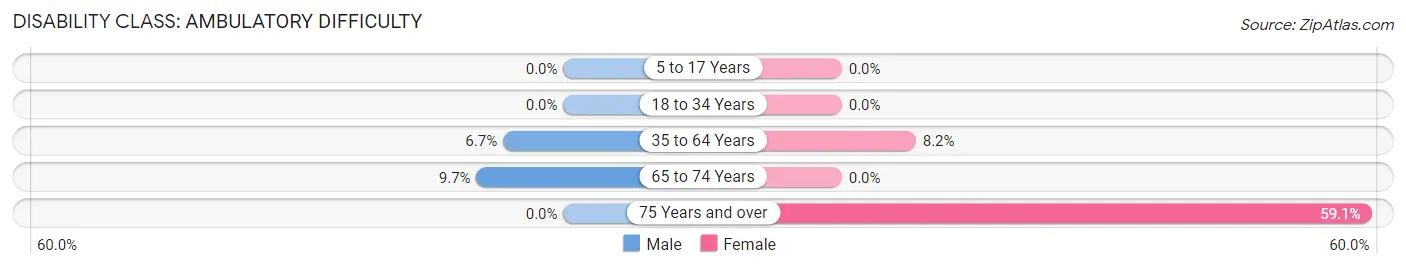
| Age Bracket | Male | Female |
| 5 to 17 Years | 0 (0.0%) | 0 (0.0%) |
| 18 to 34 Years | 0 (0.0%) | 0 (0.0%) |
| 35 to 64 Years | 8 (6.7%) | 7 (8.2%) |
| 65 to 74 Years | 3 (9.7%) | 0 (0.0%) |
| 75 Years and over | 0 (0.0%) | 26 (59.1%) |
Disability Class: Self-Care Difficulty
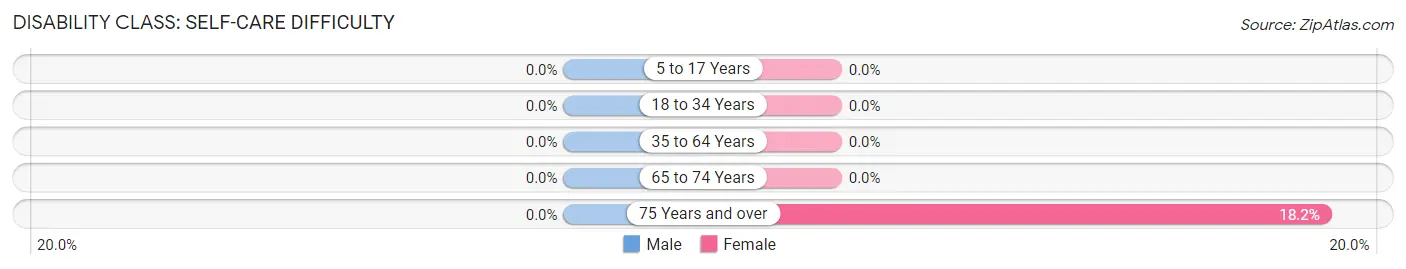
| Age Bracket | Male | Female |
| 5 to 17 Years | 0 (0.0%) | 0 (0.0%) |
| 18 to 34 Years | 0 (0.0%) | 0 (0.0%) |
| 35 to 64 Years | 0 (0.0%) | 0 (0.0%) |
| 65 to 74 Years | 0 (0.0%) | 0 (0.0%) |
| 75 Years and over | 0 (0.0%) | 8 (18.2%) |
Technology Access in Whittemore
Computing Device Access in Whittemore
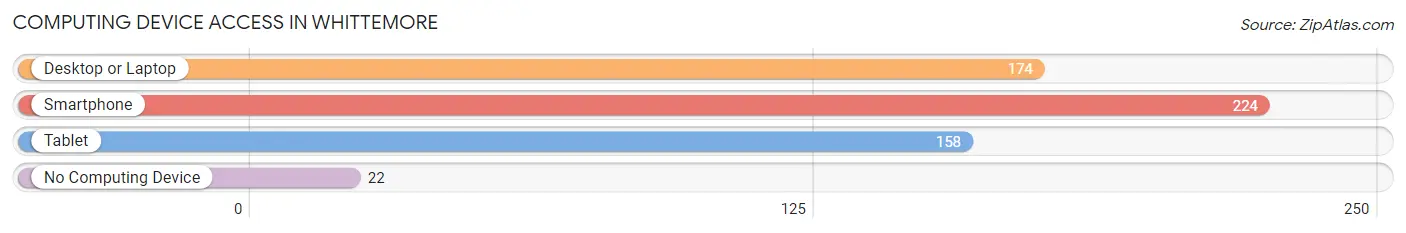
| Device Type | # Households | % Households |
| Desktop or Laptop | 174 | 68.5% |
| Smartphone | 224 | 88.2% |
| Tablet | 158 | 62.2% |
| No Computing Device | 22 | 8.7% |
| Total | 254 | 100.0% |
Internet Access in Whittemore
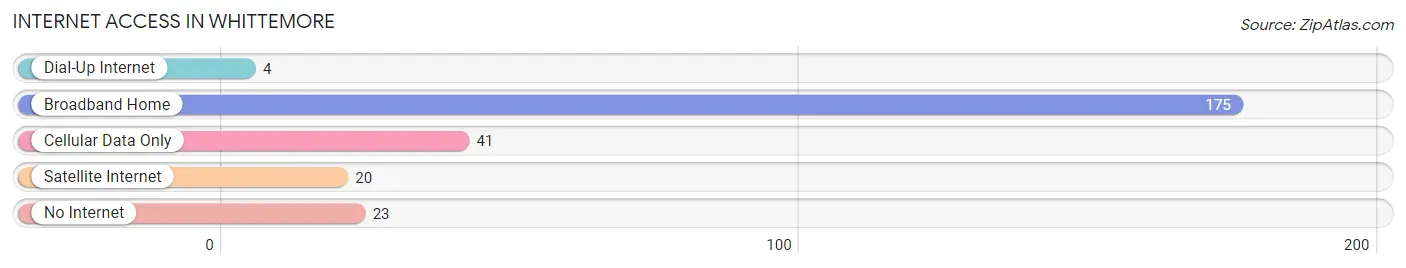
| Internet Type | # Households | % Households |
| Dial-Up Internet | 4 | 1.6% |
| Broadband Home | 175 | 68.9% |
| Cellular Data Only | 41 | 16.1% |
| Satellite Internet | 20 | 7.9% |
| No Internet | 23 | 9.1% |
| Total | 254 | 100.0% |
Whittemore Summary
Whittemore is a small city located in Kossuth County, Iowa. It is situated in the north-central part of the state, about 30 miles east of Fort Dodge. The city has a population of approximately 1,000 people and is part of the Algona Micropolitan Statistical Area.
History
Whittemore was founded in 1881 by a group of settlers from Wisconsin. The city was named after one of the settlers, William Whittemore. The city was incorporated in 1883 and has remained a small, rural community ever since.
The city was originally a farming community, but in the early 1900s, the economy shifted to focus on manufacturing. The first factory in Whittemore was a creamery, which opened in 1902. This was followed by a furniture factory in 1906 and a canning factory in 1908. These factories provided employment for many of the city’s residents and helped to spur economic growth.
In the 1950s, the economy shifted again, this time to focus on agriculture. The city is now home to several large farms, which produce corn, soybeans, and other crops.
Geography
Whittemore is located in north-central Iowa, about 30 miles east of Fort Dodge. The city is situated in the rolling hills of Kossuth County, which is part of the Iowa Great Lakes region. The city is located on the banks of the East Fork of the Des Moines River.
The city has a total area of 1.2 square miles, all of which is land. The climate is humid continental, with hot summers and cold winters. The average annual temperature is 48°F, and the average annual precipitation is 30 inches.
Economy
The economy of Whittemore is largely based on agriculture. The city is home to several large farms, which produce corn, soybeans, and other crops. The city also has a few small businesses, including a grocery store, a hardware store, and a few restaurants.
The city is also home to a few manufacturing companies, including a furniture factory and a canning factory. These factories provide employment for many of the city’s residents.
Demographics
As of the 2010 census, the population of Whittemore was 1,000. The racial makeup of the city was 97.2% White, 0.7% African American, 0.2% Native American, 0.2% Asian, 0.2% from other races, and 1.7% from two or more races. Hispanic or Latino of any race were 1.2% of the population.
The median household income in Whittemore was $41,250, and the median family income was $48,750. The per capita income was $19,945. About 8.2% of families and 10.2% of the population were below the poverty line, including 13.2% of those under age 18 and 8.2% of those age 65 or over.
Common Questions
What is Per Capita Income in Whittemore?
Per Capita income in Whittemore is $36,642.
What is the Median Family Income in Whittemore?
Median Family Income in Whittemore is $86,563.
What is the Median Household income in Whittemore?
Median Household Income in Whittemore is $74,231.
What is Income or Wage Gap in Whittemore?
Income or Wage Gap in Whittemore is 23.7%.
Women in Whittemore earn 76.3 cents for every dollar earned by a man.
What is Inequality or Gini Index in Whittemore?
Inequality or Gini Index in Whittemore is 0.30.
What is the Total Population of Whittemore?
Total Population of Whittemore is 537.
What is the Total Male Population of Whittemore?
Total Male Population of Whittemore is 272.
What is the Total Female Population of Whittemore?
Total Female Population of Whittemore is 265.
What is the Ratio of Males per 100 Females in Whittemore?
There are 102.64 Males per 100 Females in Whittemore.
What is the Ratio of Females per 100 Males in Whittemore?
There are 97.43 Females per 100 Males in Whittemore.
What is the Median Population Age in Whittemore?
Median Population Age in Whittemore is 43.9 Years.
What is the Average Family Size in Whittemore
Average Family Size in Whittemore is 2.9 People.
What is the Average Household Size in Whittemore
Average Household Size in Whittemore is 2.1 People.
How Large is the Labor Force in Whittemore?
There are 305 People in the Labor Forcein in Whittemore.
What is the Percentage of People in the Labor Force in Whittemore?
71.6% of People are in the Labor Force in Whittemore.