Nashua, IA Map & Demographics
Nashua Map
Nashua Overview
$31,857
PER CAPITA INCOME
$83,250
AVG FAMILY INCOME
$60,000
AVG HOUSEHOLD INCOME
27.6%
WAGE / INCOME GAP [ % ]
72.4¢/ $1
WAGE / INCOME GAP [ $ ]
0.38
INEQUALITY / GINI INDEX
1,472
TOTAL POPULATION
778
MALE POPULATION
694
FEMALE POPULATION
112.10
MALES / 100 FEMALES
89.20
FEMALES / 100 MALES
35.9
MEDIAN AGE
2.9
AVG FAMILY SIZE
2.3
AVG HOUSEHOLD SIZE
848
LABOR FORCE [ PEOPLE ]
75.3%
PERCENT IN LABOR FORCE
1.2%
UNEMPLOYMENT RATE
Nashua Zip Codes
Nashua Area Codes
Income in Nashua
Income Overview in Nashua
Per Capita Income in Nashua is $31,857, while median incomes of families and households are $83,250 and $60,000 respectively.
| Characteristic | Number | Measure |
| Per Capita Income | 1,472 | $31,857 |
| Median Family Income | 391 | $83,250 |
| Mean Family Income | 391 | $88,804 |
| Median Household Income | 646 | $60,000 |
| Mean Household Income | 646 | $71,603 |
| Income Deficit | 391 | $0 |
| Wage / Income Gap (%) | 1,472 | 27.57% |
| Wage / Income Gap ($) | 1,472 | 72.43¢ per $1 |
| Gini / Inequality Index | 1,472 | 0.38 |
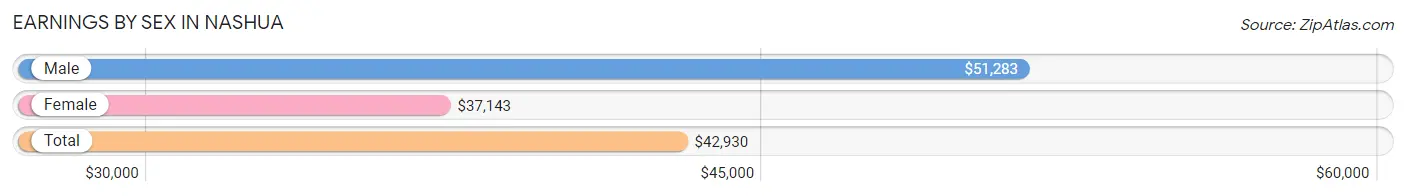
Earnings by Sex in Nashua
Average Earnings in Nashua are $42,930, $51,283 for men and $37,143 for women, a difference of 27.6%.
| Sex | Number | Average Earnings |
| Male | 473 (53.6%) | $51,283 |
| Female | 410 (46.4%) | $37,143 |
| Total | 883 (100.0%) | $42,930 |
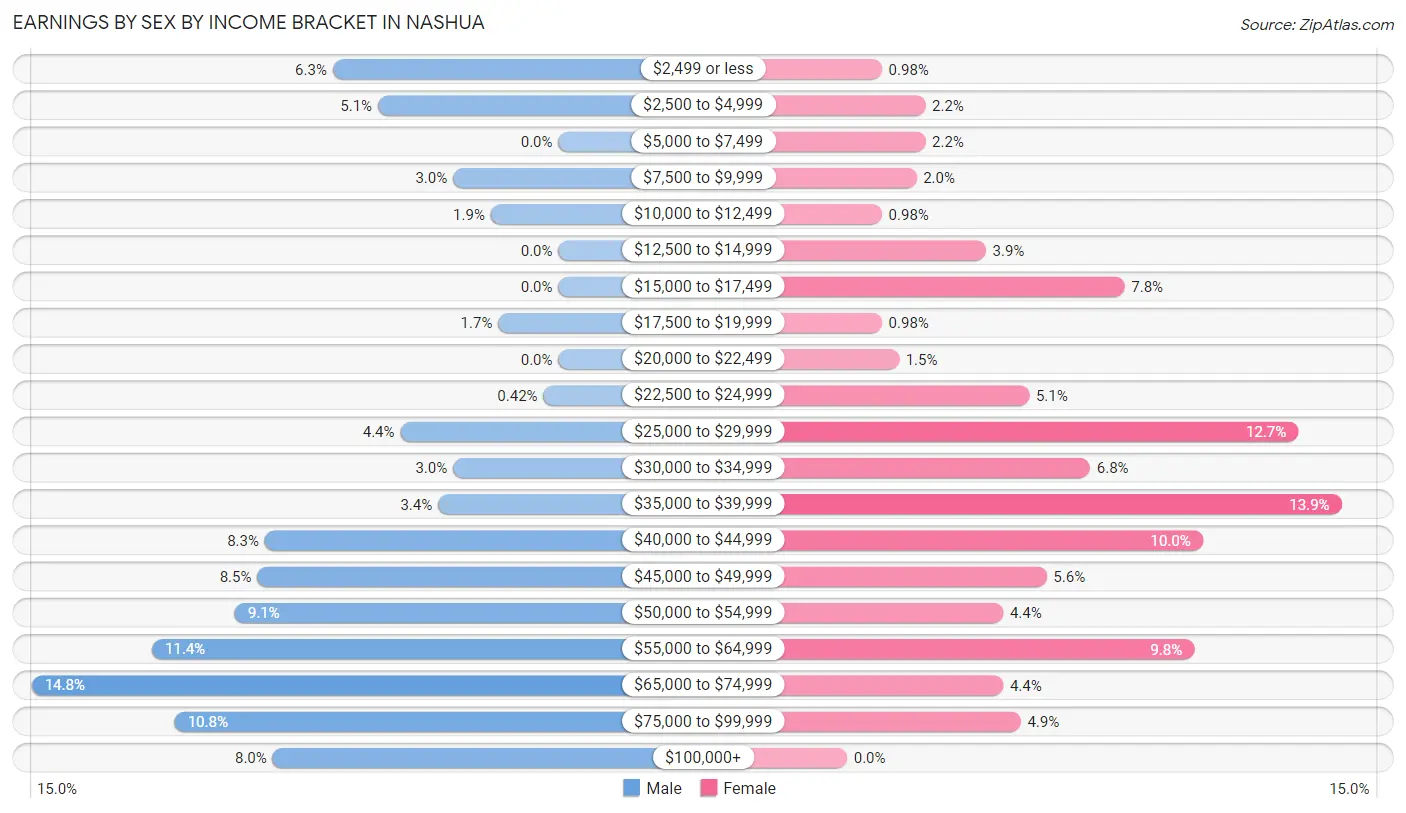
Earnings by Sex by Income Bracket in Nashua
The most common earnings brackets in Nashua are $65,000 to $74,999 for men (70 | 14.8%) and $35,000 to $39,999 for women (57 | 13.9%).
| Income | Male | Female |
| $2,499 or less | 30 (6.3%) | 4 (1.0%) |
| $2,500 to $4,999 | 24 (5.1%) | 9 (2.2%) |
| $5,000 to $7,499 | 0 (0.0%) | 9 (2.2%) |
| $7,500 to $9,999 | 14 (3.0%) | 8 (1.9%) |
| $10,000 to $12,499 | 9 (1.9%) | 4 (1.0%) |
| $12,500 to $14,999 | 0 (0.0%) | 16 (3.9%) |
| $15,000 to $17,499 | 0 (0.0%) | 32 (7.8%) |
| $17,500 to $19,999 | 8 (1.7%) | 4 (1.0%) |
| $20,000 to $22,499 | 0 (0.0%) | 6 (1.5%) |
| $22,500 to $24,999 | 2 (0.4%) | 21 (5.1%) |
| $25,000 to $29,999 | 21 (4.4%) | 52 (12.7%) |
| $30,000 to $34,999 | 14 (3.0%) | 28 (6.8%) |
| $35,000 to $39,999 | 16 (3.4%) | 57 (13.9%) |
| $40,000 to $44,999 | 39 (8.3%) | 41 (10.0%) |
| $45,000 to $49,999 | 40 (8.5%) | 23 (5.6%) |
| $50,000 to $54,999 | 43 (9.1%) | 18 (4.4%) |
| $55,000 to $64,999 | 54 (11.4%) | 40 (9.8%) |
| $65,000 to $74,999 | 70 (14.8%) | 18 (4.4%) |
| $75,000 to $99,999 | 51 (10.8%) | 20 (4.9%) |
| $100,000+ | 38 (8.0%) | 0 (0.0%) |
| Total | 473 (100.0%) | 410 (100.0%) |
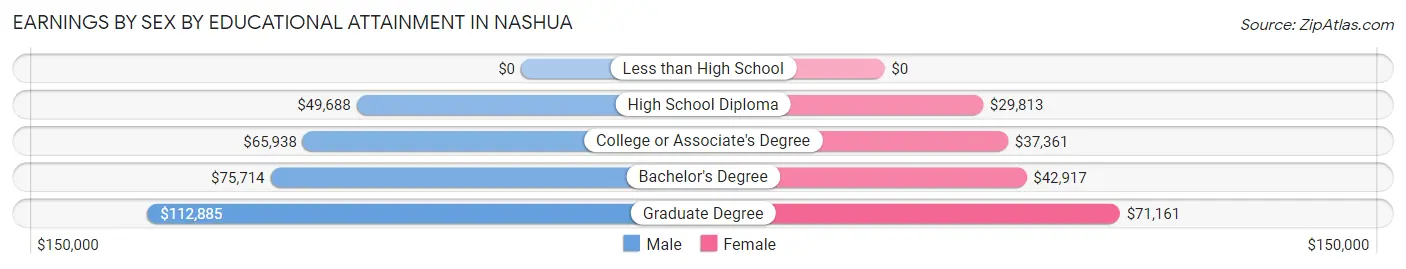
Earnings by Sex by Educational Attainment in Nashua
Average earnings in Nashua are $55,855 for men and $37,820 for women, a difference of 32.3%. Men with an educational attainment of graduate degree enjoy the highest average annual earnings of $112,885, while those with high school diploma education earn the least with $49,688. Women with an educational attainment of graduate degree earn the most with the average annual earnings of $71,161, while those with high school diploma education have the smallest earnings of $29,813.
| Educational Attainment | Male Income | Female Income |
| Less than High School | - | - |
| High School Diploma | $49,688 | $29,813 |
| College or Associate's Degree | $65,938 | $37,361 |
| Bachelor's Degree | $75,714 | $42,917 |
| Graduate Degree | $112,885 | $71,161 |
| Total | $55,855 | $37,820 |
Family Income in Nashua
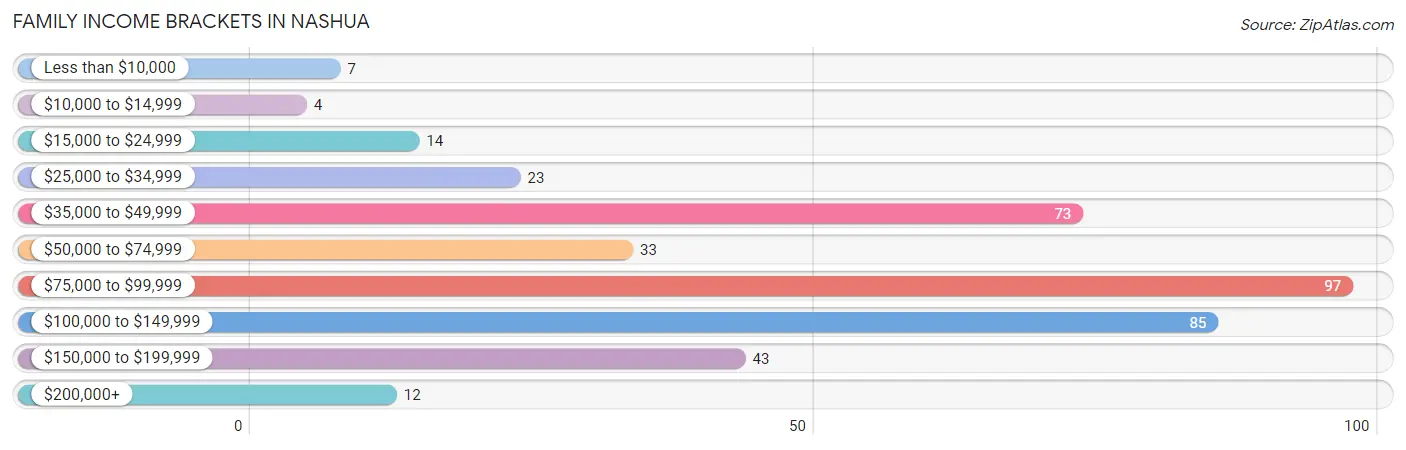
Family Income Brackets in Nashua
According to the Nashua family income data, there are 97 families falling into the $75,000 to $99,999 income range, which is the most common income bracket and makes up 24.8% of all families. Conversely, the $10,000 to $14,999 income bracket is the least frequent group with only 4 families (1.0%) belonging to this category.
| Income Bracket | # Families | % Families |
| Less than $10,000 | 7 | 1.8% |
| $10,000 to $14,999 | 4 | 1.0% |
| $15,000 to $24,999 | 14 | 3.6% |
| $25,000 to $34,999 | 23 | 5.9% |
| $35,000 to $49,999 | 73 | 18.7% |
| $50,000 to $74,999 | 33 | 8.4% |
| $75,000 to $99,999 | 97 | 24.8% |
| $100,000 to $149,999 | 85 | 21.7% |
| $150,000 to $199,999 | 43 | 11.0% |
| $200,000+ | 12 | 3.1% |
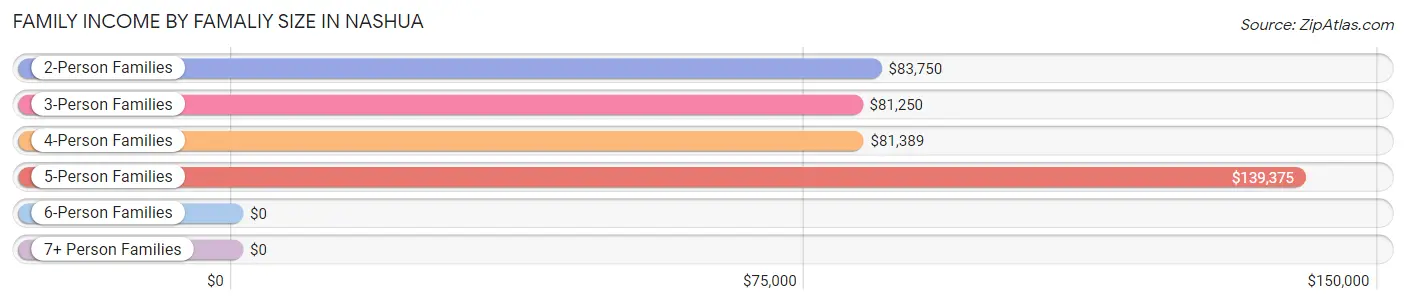
Family Income by Famaliy Size in Nashua
5-person families (28 | 7.2%) account for the highest median family income in Nashua with $139,375 per family, while 2-person families (208 | 53.2%) have the highest median income of $41,875 per family member.
| Income Bracket | # Families | Median Income |
| 2-Person Families | 208 (53.2%) | $83,750 |
| 3-Person Families | 60 (15.3%) | $81,250 |
| 4-Person Families | 90 (23.0%) | $81,389 |
| 5-Person Families | 28 (7.2%) | $139,375 |
| 6-Person Families | 2 (0.5%) | $0 |
| 7+ Person Families | 3 (0.8%) | $0 |
| Total | 391 (100.0%) | $83,250 |
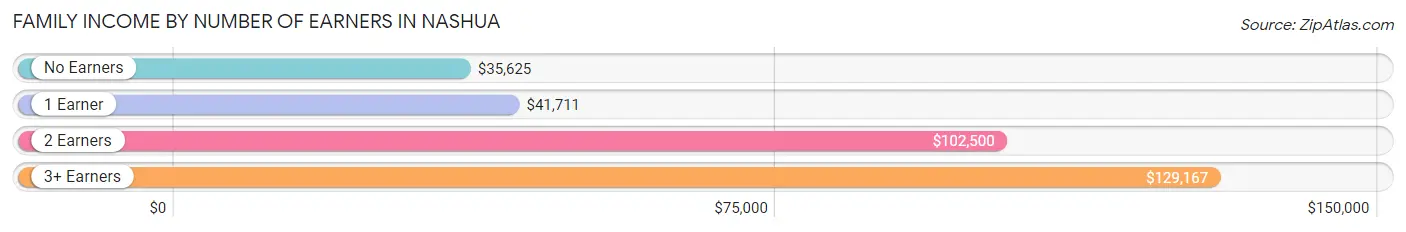
Family Income by Number of Earners in Nashua
The median family income in Nashua is $83,250, with families comprising 3+ earners (22) having the highest median family income of $129,167, while families with no earners (45) have the lowest median family income of $35,625, accounting for 5.6% and 11.5% of families, respectively.
| Number of Earners | # Families | Median Income |
| No Earners | 45 (11.5%) | $35,625 |
| 1 Earner | 122 (31.2%) | $41,711 |
| 2 Earners | 202 (51.7%) | $102,500 |
| 3+ Earners | 22 (5.6%) | $129,167 |
| Total | 391 (100.0%) | $83,250 |
Household Income in Nashua
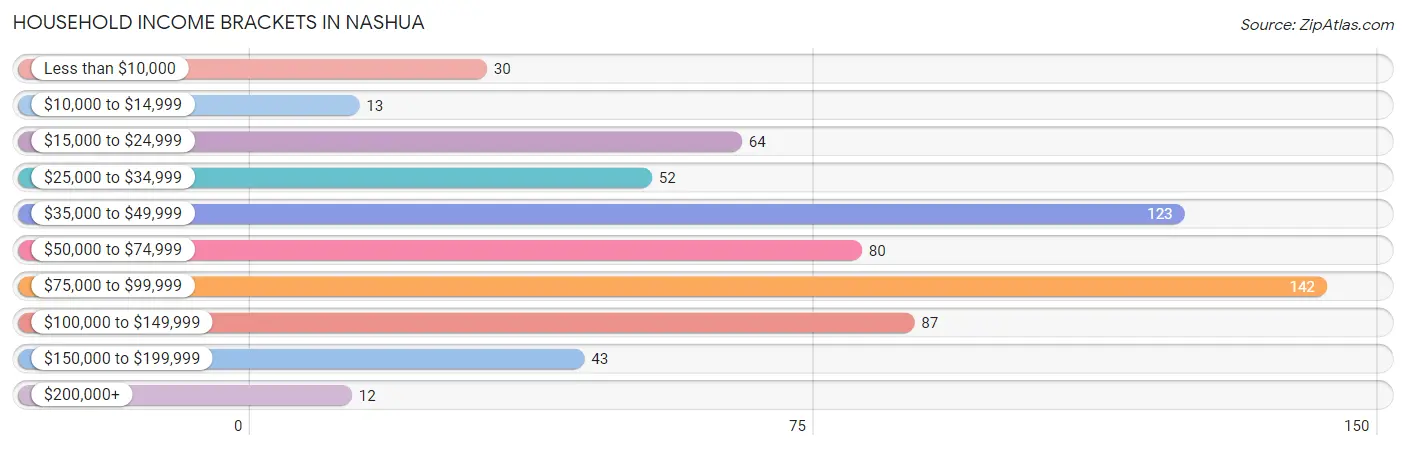
Household Income Brackets in Nashua
With 142 households falling in the category, the $75,000 to $99,999 income range is the most frequent in Nashua, accounting for 22.0% of all households. In contrast, only 12 households (1.9%) fall into the $200,000+ income bracket, making it the least populous group.
| Income Bracket | # Households | % Households |
| Less than $10,000 | 30 | 4.6% |
| $10,000 to $14,999 | 13 | 2.0% |
| $15,000 to $24,999 | 64 | 9.9% |
| $25,000 to $34,999 | 52 | 8.0% |
| $35,000 to $49,999 | 123 | 19.0% |
| $50,000 to $74,999 | 80 | 12.4% |
| $75,000 to $99,999 | 142 | 22.0% |
| $100,000 to $149,999 | 87 | 13.5% |
| $150,000 to $199,999 | 43 | 6.7% |
| $200,000+ | 12 | 1.9% |
Household Income by Householder Age in Nashua
The median household income in Nashua is $60,000, with the highest median household income of $82,569 found in the 25 to 44 years age bracket for the primary householder. A total of 239 households (37.0%) fall into this category. Meanwhile, the 65+ years age bracket for the primary householder has the lowest median household income of $35,469, with 164 households (25.4%) in this group.
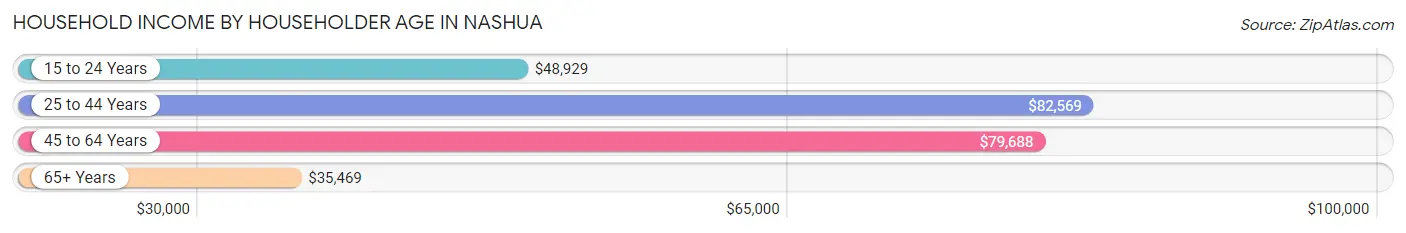
| Income Bracket | # Households | Median Income |
| 15 to 24 Years | 72 (11.2%) | $48,929 |
| 25 to 44 Years | 239 (37.0%) | $82,569 |
| 45 to 64 Years | 171 (26.5%) | $79,688 |
| 65+ Years | 164 (25.4%) | $35,469 |
| Total | 646 (100.0%) | $60,000 |
Poverty in Nashua
Income Below Poverty by Sex and Age in Nashua
With 7.1% poverty level for males and 6.9% for females among the residents of Nashua, 6 to 11 year old males and 5 year old females are the most vulnerable to poverty, with 12 males (19.7%) and 3 females (42.9%) in their respective age groups living below the poverty level.
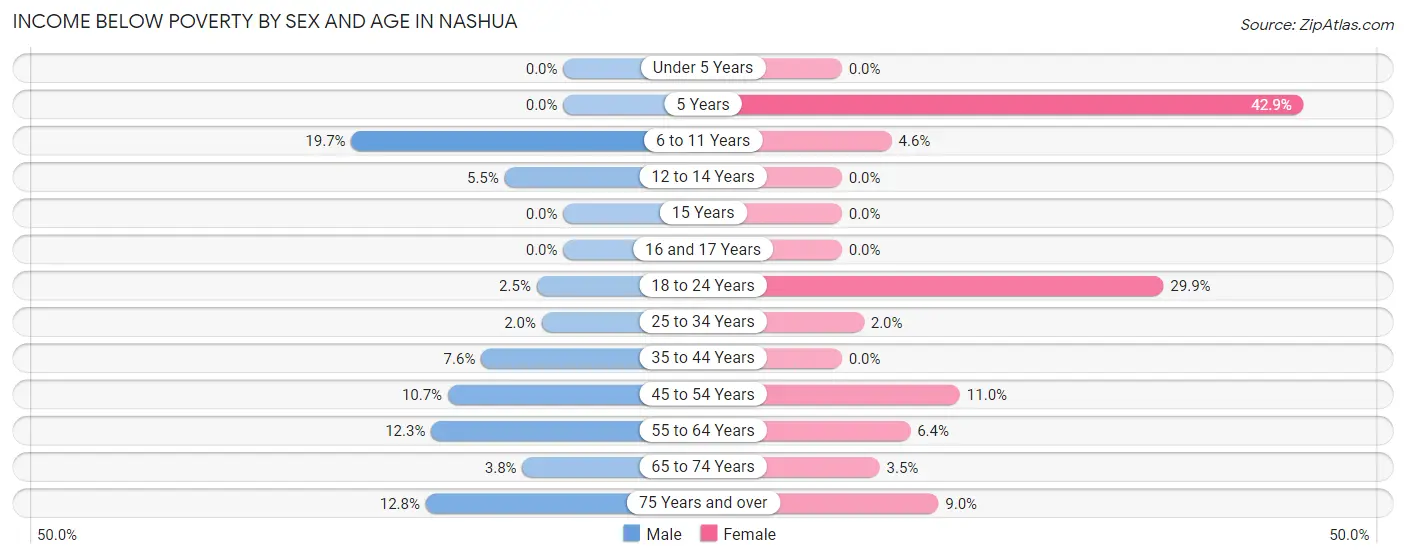
| Age Bracket | Male | Female |
| Under 5 Years | 0 (0.0%) | 0 (0.0%) |
| 5 Years | 0 (0.0%) | 3 (42.9%) |
| 6 to 11 Years | 12 (19.7%) | 3 (4.6%) |
| 12 to 14 Years | 3 (5.4%) | 0 (0.0%) |
| 15 Years | 0 (0.0%) | 0 (0.0%) |
| 16 and 17 Years | 0 (0.0%) | 0 (0.0%) |
| 18 to 24 Years | 2 (2.5%) | 20 (29.8%) |
| 25 to 34 Years | 2 (2.0%) | 2 (2.0%) |
| 35 to 44 Years | 8 (7.6%) | 0 (0.0%) |
| 45 to 54 Years | 6 (10.7%) | 8 (11.0%) |
| 55 to 64 Years | 13 (12.3%) | 4 (6.4%) |
| 65 to 74 Years | 3 (3.8%) | 2 (3.5%) |
| 75 Years and over | 6 (12.8%) | 6 (9.0%) |
| Total | 55 (7.1%) | 48 (6.9%) |
Income Above Poverty by Sex and Age in Nashua
According to the poverty statistics in Nashua, males aged under 5 years and females aged under 5 years are the age groups that are most secure financially, with 100.0% of males and 100.0% of females in these age groups living above the poverty line.

| Age Bracket | Male | Female |
| Under 5 Years | 38 (100.0%) | 34 (100.0%) |
| 5 Years | 11 (100.0%) | 4 (57.1%) |
| 6 to 11 Years | 49 (80.3%) | 62 (95.4%) |
| 12 to 14 Years | 52 (94.6%) | 48 (100.0%) |
| 15 Years | 24 (100.0%) | 3 (100.0%) |
| 16 and 17 Years | 15 (100.0%) | 4 (100.0%) |
| 18 to 24 Years | 79 (97.5%) | 47 (70.2%) |
| 25 to 34 Years | 98 (98.0%) | 96 (98.0%) |
| 35 to 44 Years | 97 (92.4%) | 108 (100.0%) |
| 45 to 54 Years | 50 (89.3%) | 65 (89.0%) |
| 55 to 64 Years | 93 (87.7%) | 59 (93.6%) |
| 65 to 74 Years | 76 (96.2%) | 55 (96.5%) |
| 75 Years and over | 41 (87.2%) | 61 (91.0%) |
| Total | 723 (92.9%) | 646 (93.1%) |
Income Below Poverty Among Married-Couple Families in Nashua
The poverty statistics for married-couple families in Nashua show that 2.9% or 9 of the total 305 families live below the poverty line. Families with no children have the highest poverty rate of 4.7%, comprising of 9 families. On the other hand, families with 1 or 2 children have the lowest poverty rate of 0.0%, which includes 0 families.
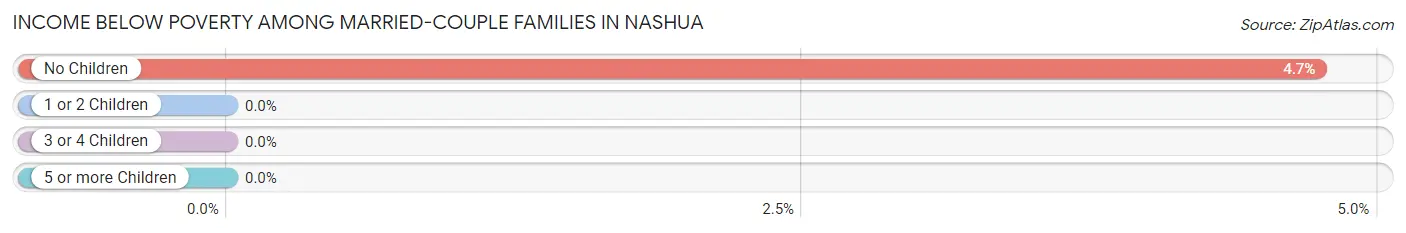
| Children | Above Poverty | Below Poverty |
| No Children | 181 (95.3%) | 9 (4.7%) |
| 1 or 2 Children | 86 (100.0%) | 0 (0.0%) |
| 3 or 4 Children | 26 (100.0%) | 0 (0.0%) |
| 5 or more Children | 3 (100.0%) | 0 (0.0%) |
| Total | 296 (97.1%) | 9 (2.9%) |
Income Below Poverty Among Single-Parent Households in Nashua
According to the poverty data in Nashua, 46.2% or 12 single-father households and 6.7% or 4 single-mother households are living below the poverty line. Among single-father households, those with 3 or 4 children have the highest poverty rate, with 8 households (100.0%) experiencing poverty. Likewise, among single-mother households, those with no children have the highest poverty rate, with 2 households (28.6%) falling below the poverty line.
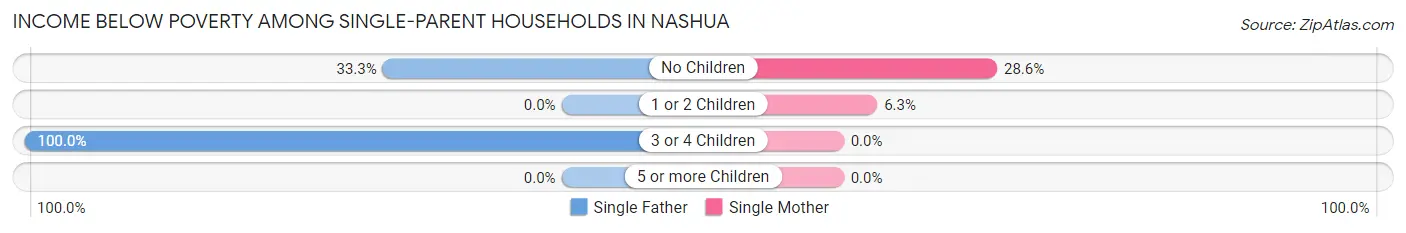
| Children | Single Father | Single Mother |
| No Children | 4 (33.3%) | 2 (28.6%) |
| 1 or 2 Children | 0 (0.0%) | 2 (6.2%) |
| 3 or 4 Children | 8 (100.0%) | 0 (0.0%) |
| 5 or more Children | 0 (0.0%) | 0 (0.0%) |
| Total | 12 (46.2%) | 4 (6.7%) |
Income Below Poverty Among Married-Couple vs Single-Parent Households in Nashua
The poverty data for Nashua shows that 9 of the married-couple family households (2.9%) and 16 of the single-parent households (18.6%) are living below the poverty level. Within the married-couple family households, those with no children have the highest poverty rate, with 9 households (4.7%) falling below the poverty line. Among the single-parent households, those with no children have the highest poverty rate, with 6 household (31.6%) living below poverty.
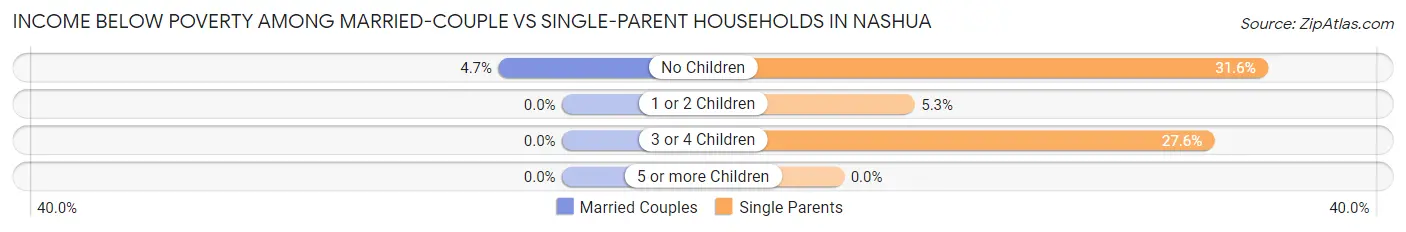
| Children | Married-Couple Families | Single-Parent Households |
| No Children | 9 (4.7%) | 6 (31.6%) |
| 1 or 2 Children | 0 (0.0%) | 2 (5.3%) |
| 3 or 4 Children | 0 (0.0%) | 8 (27.6%) |
| 5 or more Children | 0 (0.0%) | 0 (0.0%) |
| Total | 9 (2.9%) | 16 (18.6%) |
Race in Nashua
The most populous races in Nashua are White / Caucasian (1,407 | 95.6%), Two or more Races (46 | 3.1%), and Hispanic or Latino (13 | 0.9%).
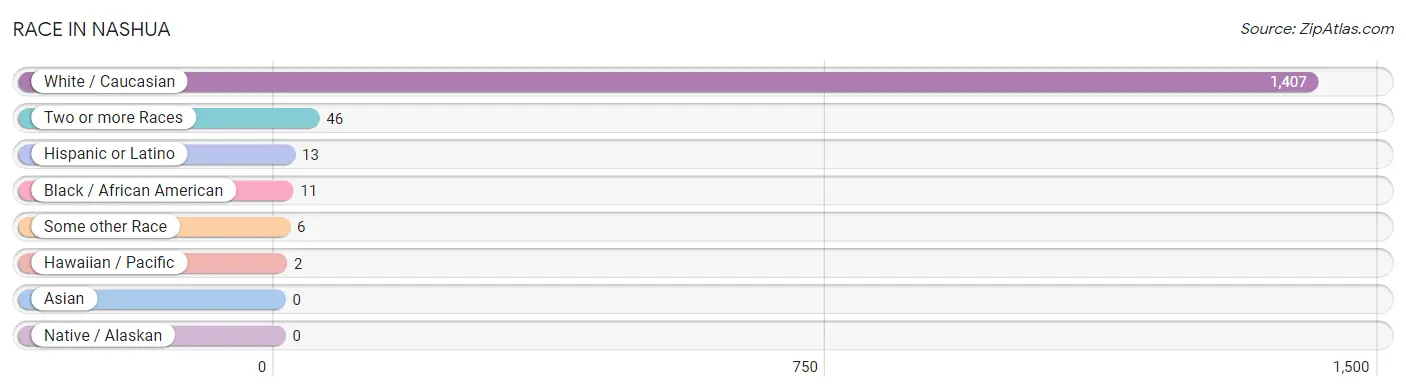
| Race | # Population | % Population |
| Asian | 0 | 0.0% |
| Black / African American | 11 | 0.7% |
| Hawaiian / Pacific | 2 | 0.1% |
| Hispanic or Latino | 13 | 0.9% |
| Native / Alaskan | 0 | 0.0% |
| White / Caucasian | 1,407 | 95.6% |
| Two or more Races | 46 | 3.1% |
| Some other Race | 6 | 0.4% |
| Total | 1,472 | 100.0% |
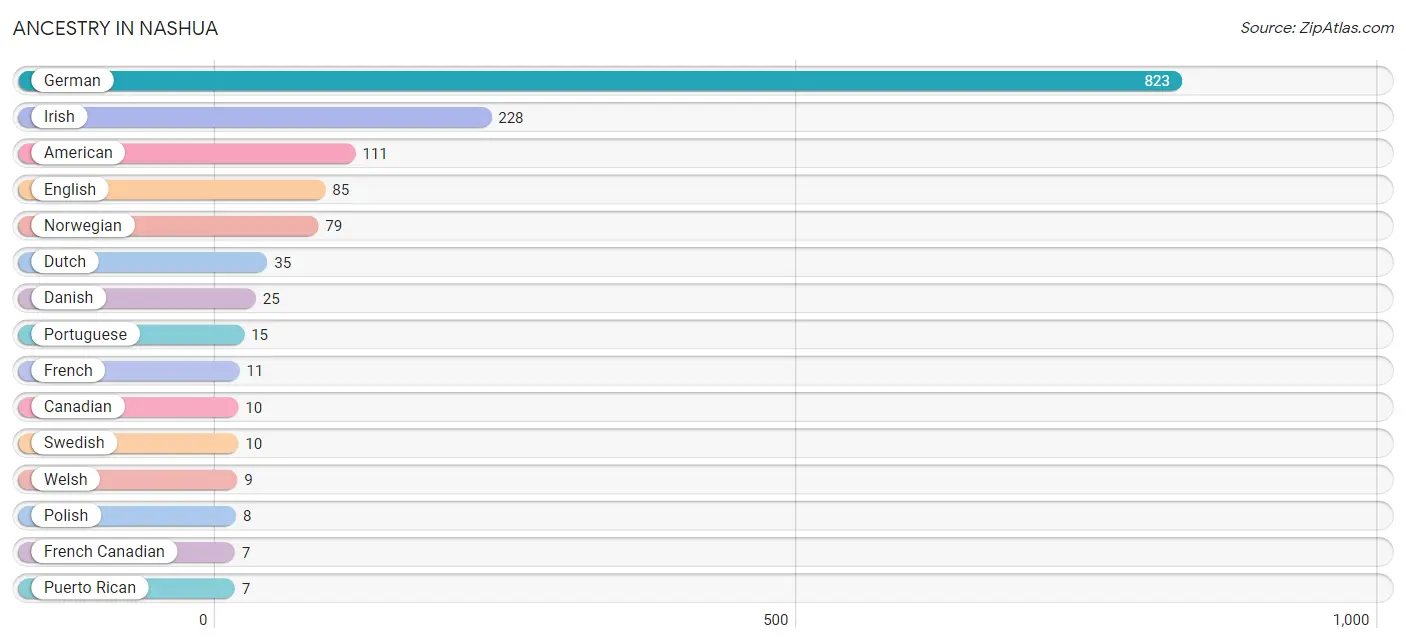
Ancestry in Nashua
The most populous ancestries reported in Nashua are German (823 | 55.9%), Irish (228 | 15.5%), American (111 | 7.5%), English (85 | 5.8%), and Norwegian (79 | 5.4%), together accounting for 90.1% of all Nashua residents.
| Ancestry | # Population | % Population |
| American | 111 | 7.5% |
| British | 6 | 0.4% |
| Canadian | 10 | 0.7% |
| Czechoslovakian | 2 | 0.1% |
| Danish | 25 | 1.7% |
| Dutch | 35 | 2.4% |
| Eastern European | 2 | 0.1% |
| English | 85 | 5.8% |
| European | 5 | 0.3% |
| French | 11 | 0.7% |
| French Canadian | 7 | 0.5% |
| German | 823 | 55.9% |
| Irish | 228 | 15.5% |
| Italian | 6 | 0.4% |
| Mexican | 2 | 0.1% |
| Norwegian | 79 | 5.4% |
| Polish | 8 | 0.5% |
| Portuguese | 15 | 1.0% |
| Puerto Rican | 7 | 0.5% |
| Scandinavian | 1 | 0.1% |
| Scotch-Irish | 3 | 0.2% |
| Scottish | 6 | 0.4% |
| Spaniard | 4 | 0.3% |
| Swedish | 10 | 0.7% |
| Welsh | 9 | 0.6% | View All 25 Rows |
Immigrants in Nashua

| Immigration Origin | # Population | % Population | View All 0 Rows |
Sex and Age in Nashua
Sex and Age in Nashua
The most populous age groups in Nashua are 10 to 14 Years (84 | 10.8%) for men and 10 to 14 Years (86 | 12.4%) for women.
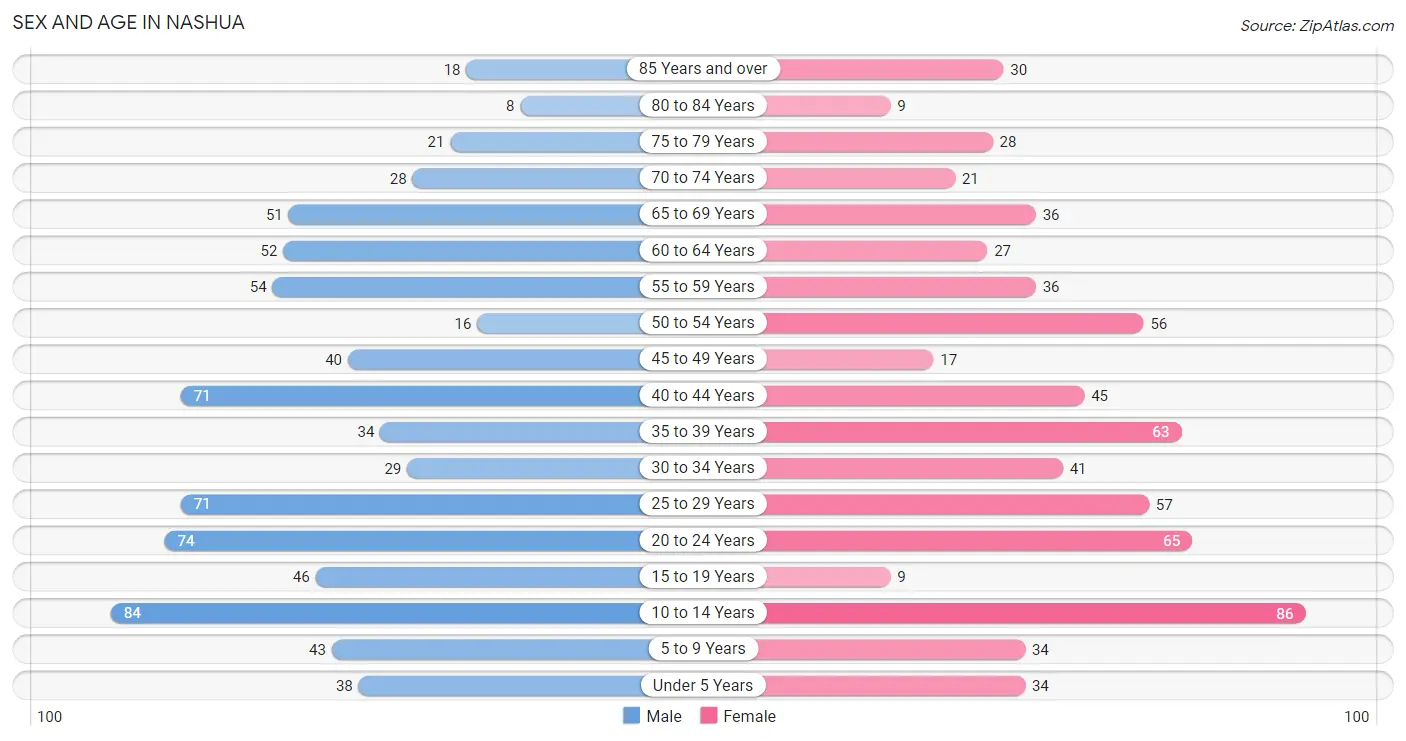
| Age Bracket | Male | Female |
| Under 5 Years | 38 (4.9%) | 34 (4.9%) |
| 5 to 9 Years | 43 (5.5%) | 34 (4.9%) |
| 10 to 14 Years | 84 (10.8%) | 86 (12.4%) |
| 15 to 19 Years | 46 (5.9%) | 9 (1.3%) |
| 20 to 24 Years | 74 (9.5%) | 65 (9.4%) |
| 25 to 29 Years | 71 (9.1%) | 57 (8.2%) |
| 30 to 34 Years | 29 (3.7%) | 41 (5.9%) |
| 35 to 39 Years | 34 (4.4%) | 63 (9.1%) |
| 40 to 44 Years | 71 (9.1%) | 45 (6.5%) |
| 45 to 49 Years | 40 (5.1%) | 17 (2.5%) |
| 50 to 54 Years | 16 (2.1%) | 56 (8.1%) |
| 55 to 59 Years | 54 (6.9%) | 36 (5.2%) |
| 60 to 64 Years | 52 (6.7%) | 27 (3.9%) |
| 65 to 69 Years | 51 (6.6%) | 36 (5.2%) |
| 70 to 74 Years | 28 (3.6%) | 21 (3.0%) |
| 75 to 79 Years | 21 (2.7%) | 28 (4.0%) |
| 80 to 84 Years | 8 (1.0%) | 9 (1.3%) |
| 85 Years and over | 18 (2.3%) | 30 (4.3%) |
| Total | 778 (100.0%) | 694 (100.0%) |
Families and Households in Nashua
Median Family Size in Nashua
The median family size in Nashua is 2.89 persons per family, with single female/mother families (60 | 15.3%) accounting for the largest median family size of 3.22 persons per family. On the other hand, single male/father families (26 | 6.7%) represent the smallest median family size with 2.65 persons per family.
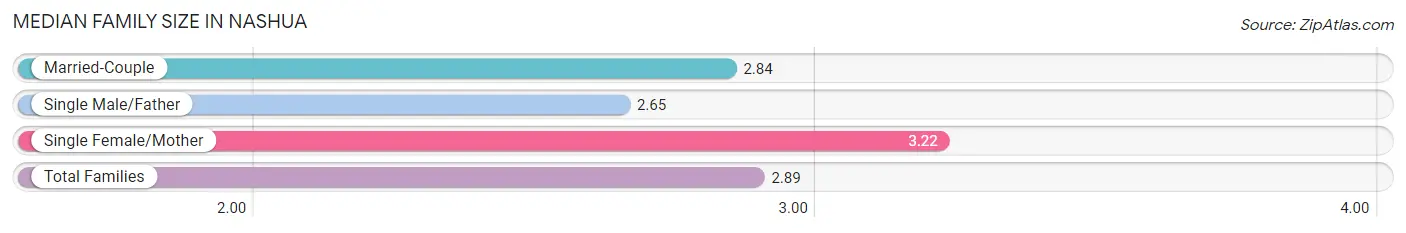
| Family Type | # Families | Family Size |
| Married-Couple | 305 (78.0%) | 2.84 |
| Single Male/Father | 26 (6.7%) | 2.65 |
| Single Female/Mother | 60 (15.3%) | 3.22 |
| Total Families | 391 (100.0%) | 2.89 |
Median Household Size in Nashua
The median household size in Nashua is 2.28 persons per household, with single female/mother households (60 | 9.3%) accounting for the largest median household size of 3.48 persons per household. non-family households (255 | 39.5%) represent the smallest median household size with 1.22 persons per household.
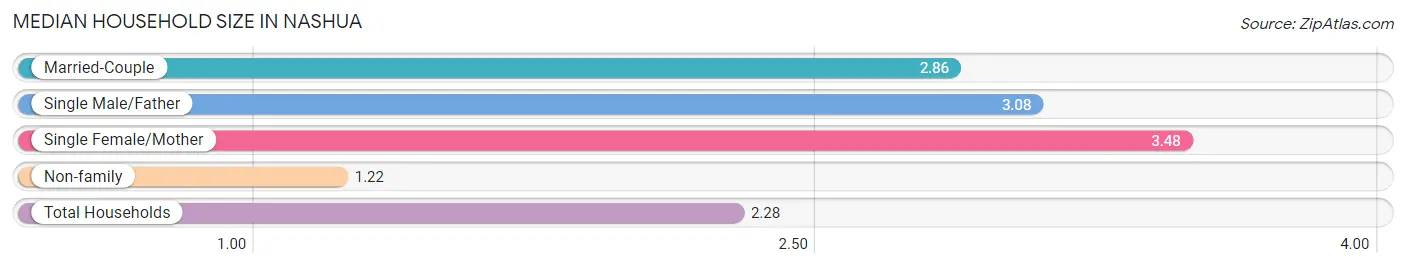
| Household Type | # Households | Household Size |
| Married-Couple | 305 (47.2%) | 2.86 |
| Single Male/Father | 26 (4.0%) | 3.08 |
| Single Female/Mother | 60 (9.3%) | 3.48 |
| Non-family | 255 (39.5%) | 1.22 |
| Total Households | 646 (100.0%) | 2.28 |
Household Size by Marriage Status in Nashua
Out of a total of 646 households in Nashua, 391 (60.5%) are family households, while 255 (39.5%) are nonfamily households. The most numerous type of family households are 2-person households, comprising 208, and the most common type of nonfamily households are 1-person households, comprising 207.
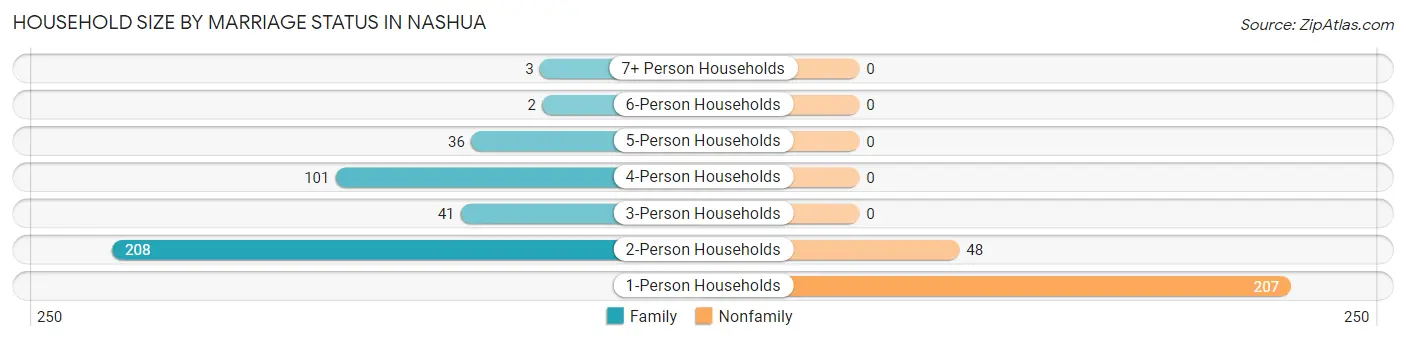
| Household Size | Family Households | Nonfamily Households |
| 1-Person Households | - | 207 (32.0%) |
| 2-Person Households | 208 (32.2%) | 48 (7.4%) |
| 3-Person Households | 41 (6.4%) | 0 (0.0%) |
| 4-Person Households | 101 (15.6%) | 0 (0.0%) |
| 5-Person Households | 36 (5.6%) | 0 (0.0%) |
| 6-Person Households | 2 (0.3%) | 0 (0.0%) |
| 7+ Person Households | 3 (0.5%) | 0 (0.0%) |
| Total | 391 (60.5%) | 255 (39.5%) |
Female Fertility in Nashua
Fertility by Age in Nashua
Average fertility rate in Nashua is 78.0 births per 1,000 women. Women in the age bracket of 20 to 34 years have the highest fertility rate with 123.0 births per 1,000 women. Women in the age bracket of 20 to 34 years acount for 80.0% of all women with births.
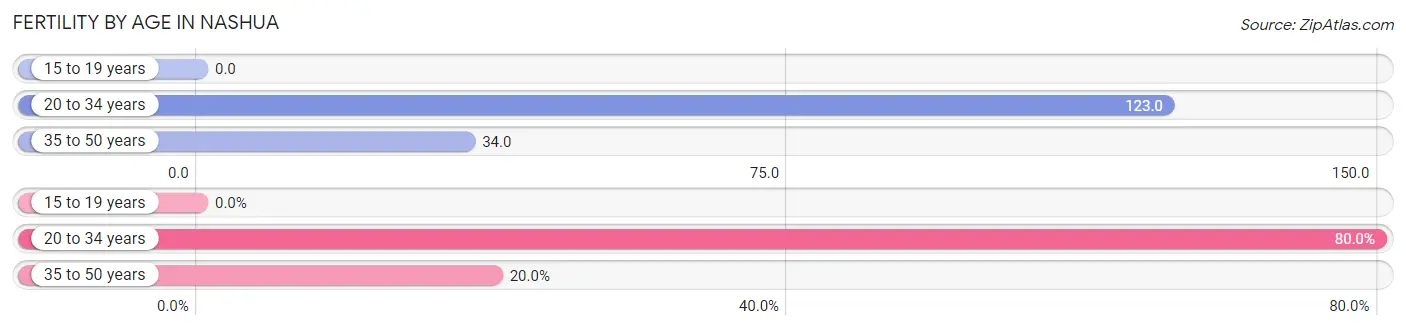
| Age Bracket | Women with Births | Births / 1,000 Women |
| 15 to 19 years | 0 (0.0%) | 0.0 |
| 20 to 34 years | 20 (80.0%) | 123.0 |
| 35 to 50 years | 5 (20.0%) | 34.0 |
| Total | 25 (100.0%) | 78.0 |
Fertility by Age by Marriage Status in Nashua
92.0% of women with births (25) in Nashua are married. The highest percentage of unmarried women with births falls into 20 to 34 years age bracket with 10.0% of them unmarried at the time of birth, while the lowest percentage of unmarried women with births belong to 35 to 50 years age bracket with 0.0% of them unmarried.
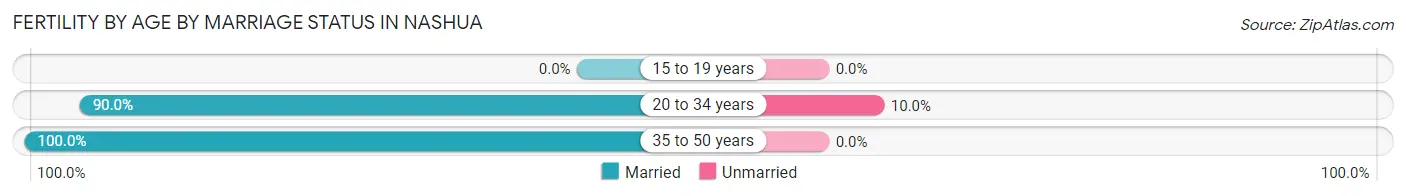
| Age Bracket | Married | Unmarried |
| 15 to 19 years | 0 (0.0%) | 0 (0.0%) |
| 20 to 34 years | 18 (90.0%) | 2 (10.0%) |
| 35 to 50 years | 5 (100.0%) | 0 (0.0%) |
| Total | 23 (92.0%) | 2 (8.0%) |
Fertility by Education in Nashua
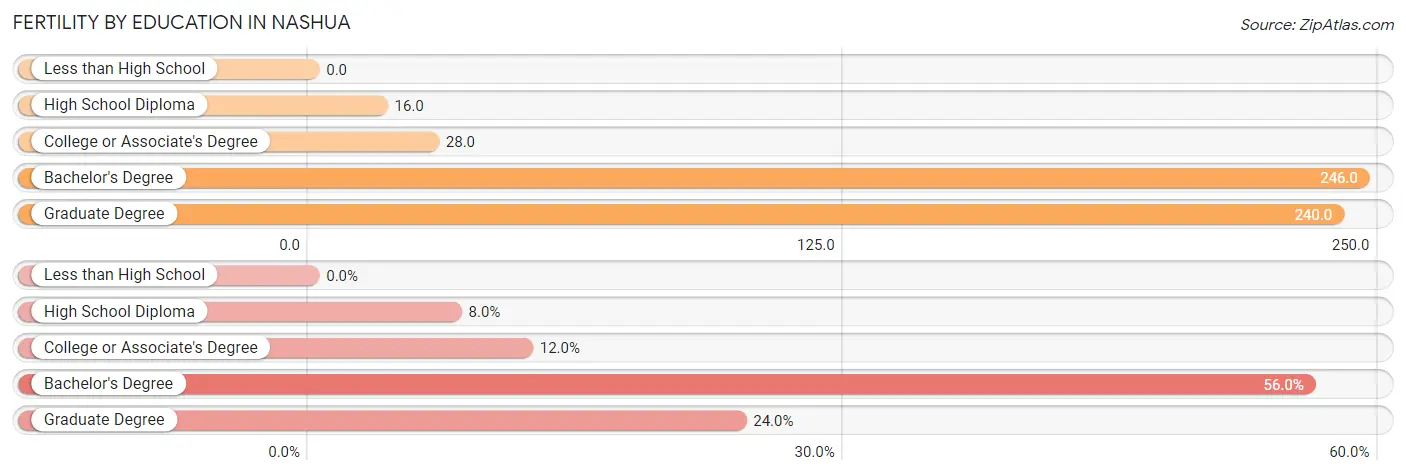
| Educational Attainment | Women with Births | Births / 1,000 Women |
| Less than High School | 0 (0.0%) | 0.0 |
| High School Diploma | 2 (8.0%) | 16.0 |
| College or Associate's Degree | 3 (12.0%) | 28.0 |
| Bachelor's Degree | 14 (56.0%) | 246.0 |
| Graduate Degree | 6 (24.0%) | 240.0 |
| Total | 25 (100.0%) | 78.0 |
Fertility by Education by Marriage Status in Nashua
8.0% of women with births in Nashua are unmarried. Women with the educational attainment of college or associate's degree are most likely to be married with 100.0% of them married at childbirth, while women with the educational attainment of high school diploma are least likely to be married with 100.0% of them unmarried at childbirth.
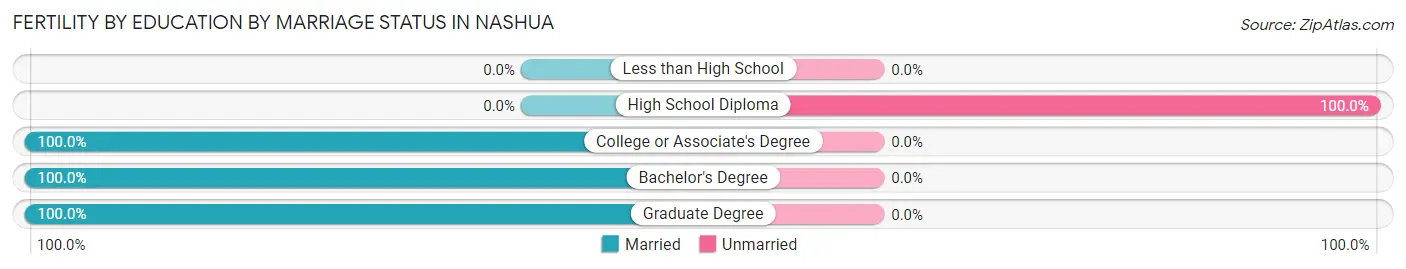
| Educational Attainment | Married | Unmarried |
| Less than High School | 0 (0.0%) | 0 (0.0%) |
| High School Diploma | 0 (0.0%) | 2 (100.0%) |
| College or Associate's Degree | 3 (100.0%) | 0 (0.0%) |
| Bachelor's Degree | 14 (100.0%) | 0 (0.0%) |
| Graduate Degree | 6 (100.0%) | 0 (0.0%) |
| Total | 23 (92.0%) | 2 (8.0%) |
Employment Characteristics in Nashua
Employment by Class of Employer in Nashua
Among the 829 employed individuals in Nashua, private company employees (554 | 66.8%), local government employees (102 | 12.3%), and self-employed (not incorporated) (84 | 10.1%) make up the most common classes of employment.
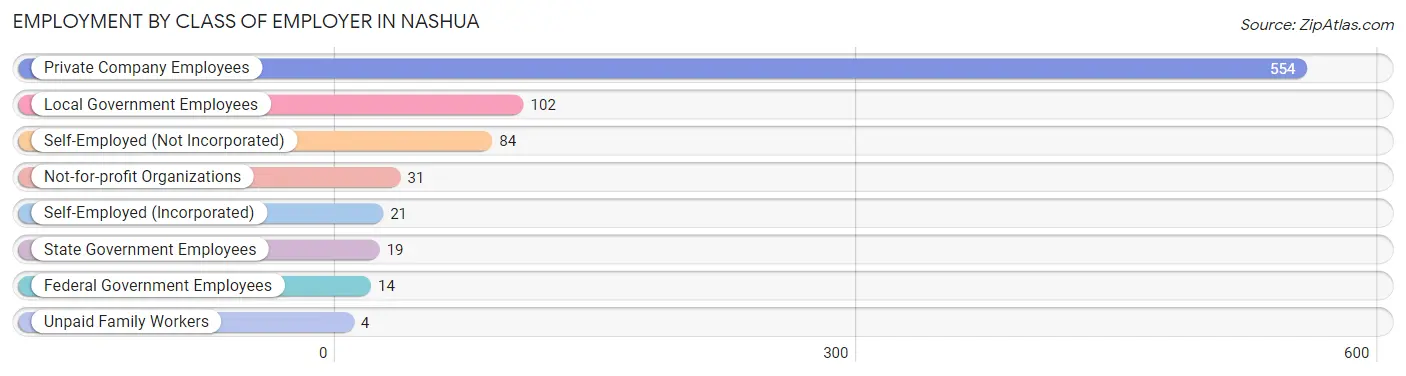
| Employer Class | # Employees | % Employees |
| Private Company Employees | 554 | 66.8% |
| Self-Employed (Incorporated) | 21 | 2.5% |
| Self-Employed (Not Incorporated) | 84 | 10.1% |
| Not-for-profit Organizations | 31 | 3.7% |
| Local Government Employees | 102 | 12.3% |
| State Government Employees | 19 | 2.3% |
| Federal Government Employees | 14 | 1.7% |
| Unpaid Family Workers | 4 | 0.5% |
| Total | 829 | 100.0% |
Employment Status by Age in Nashua
According to the labor force statistics for Nashua, out of the total population over 16 years of age (1,126), 75.3% or 848 individuals are in the labor force, with 1.2% or 10 of them unemployed. The age group with the highest labor force participation rate is 20 to 24 years, with 100.0% or 139 individuals in the labor force. Within the labor force, the 45 to 54 years age range has the highest percentage of unemployed individuals, with 3.4% or 4 of them being unemployed.
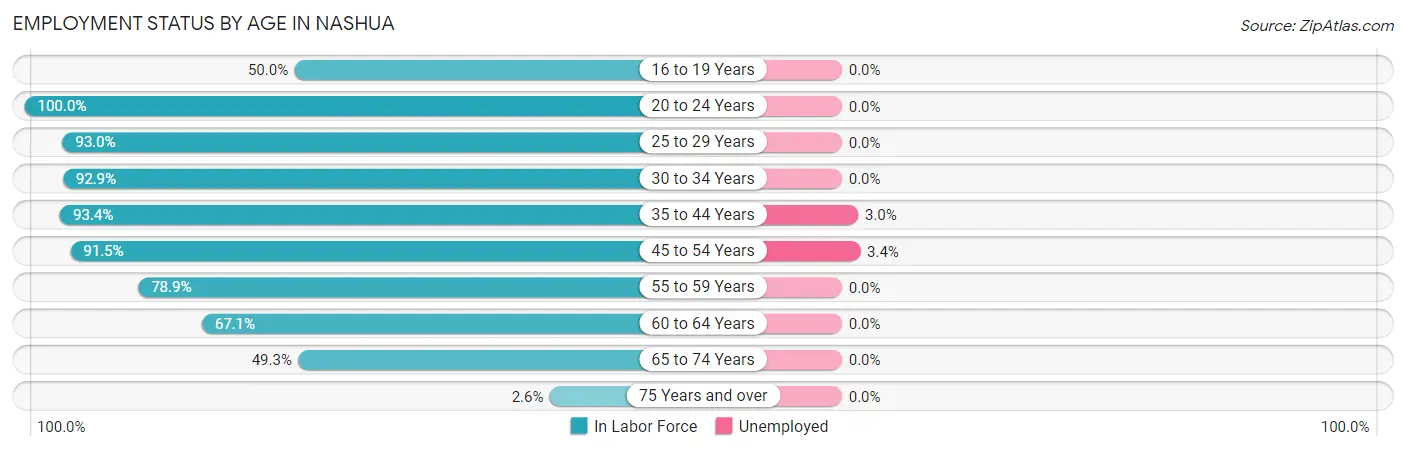
| Age Bracket | In Labor Force | Unemployed |
| 16 to 19 Years | 14 (50.0%) | 0 (0.0%) |
| 20 to 24 Years | 139 (100.0%) | 0 (0.0%) |
| 25 to 29 Years | 119 (93.0%) | 0 (0.0%) |
| 30 to 34 Years | 65 (92.9%) | 0 (0.0%) |
| 35 to 44 Years | 199 (93.4%) | 6 (3.0%) |
| 45 to 54 Years | 118 (91.5%) | 4 (3.4%) |
| 55 to 59 Years | 71 (78.9%) | 0 (0.0%) |
| 60 to 64 Years | 53 (67.1%) | 0 (0.0%) |
| 65 to 74 Years | 67 (49.3%) | 0 (0.0%) |
| 75 Years and over | 3 (2.6%) | 0 (0.0%) |
| Total | 848 (75.3%) | 10 (1.2%) |
Employment Status by Educational Attainment in Nashua
According to labor force statistics for Nashua, 88.2% of individuals (625) out of the total population between 25 and 64 years of age (709) are in the labor force, with 1.6% or 10 of them being unemployed. The group with the highest labor force participation rate are those with the educational attainment of bachelor's degree or higher, with 96.4% or 135 individuals in the labor force. Within the labor force, individuals with less than high school education have the highest percentage of unemployment, with 44.4% or 4 of them being unemployed.
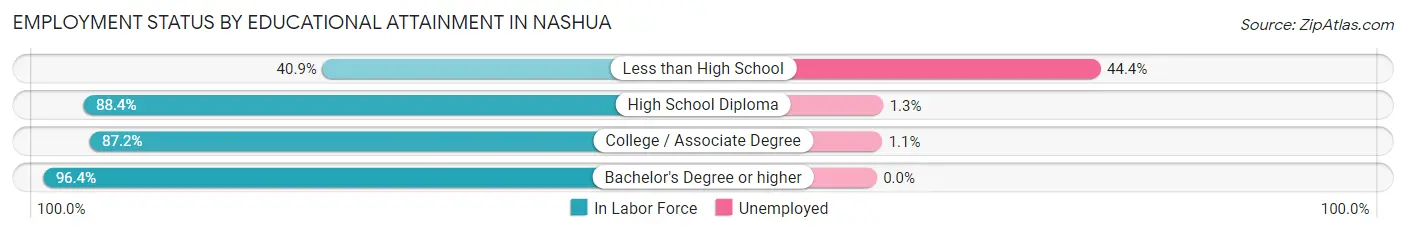
| Educational Attainment | In Labor Force | Unemployed |
| Less than High School | 9 (40.9%) | 10 (44.4%) |
| High School Diploma | 304 (88.4%) | 4 (1.3%) |
| College / Associate Degree | 177 (87.2%) | 2 (1.1%) |
| Bachelor's Degree or higher | 135 (96.4%) | 0 (0.0%) |
| Total | 625 (88.2%) | 11 (1.6%) |
Employment Occupations by Sex in Nashua
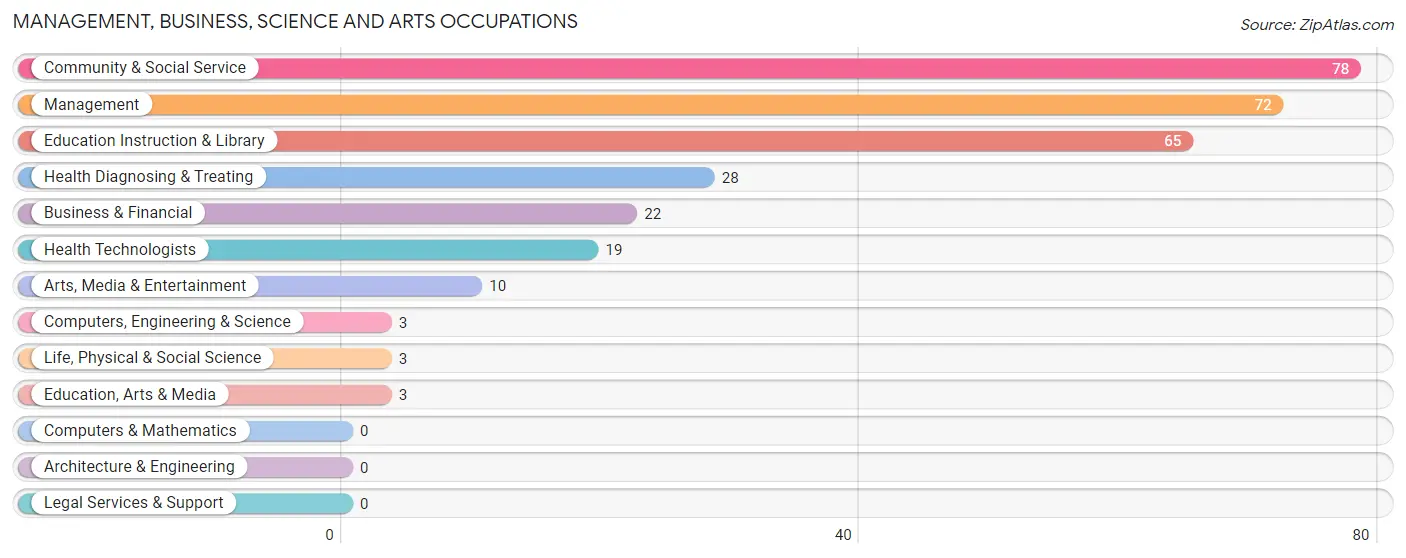
Management, Business, Science and Arts Occupations
The most common Management, Business, Science and Arts occupations in Nashua are Community & Social Service (78 | 9.3%), Management (72 | 8.6%), Education Instruction & Library (65 | 7.8%), Health Diagnosing & Treating (28 | 3.3%), and Business & Financial (22 | 2.6%).
Management, Business, Science and Arts Occupations by Sex
Within the Management, Business, Science and Arts occupations in Nashua, the most male-oriented occupations are Business & Financial (77.3%), Management (63.9%), and Arts, Media & Entertainment (60.0%), while the most female-oriented occupations are Computers, Engineering & Science (100.0%), Life, Physical & Social Science (100.0%), and Education, Arts & Media (100.0%).
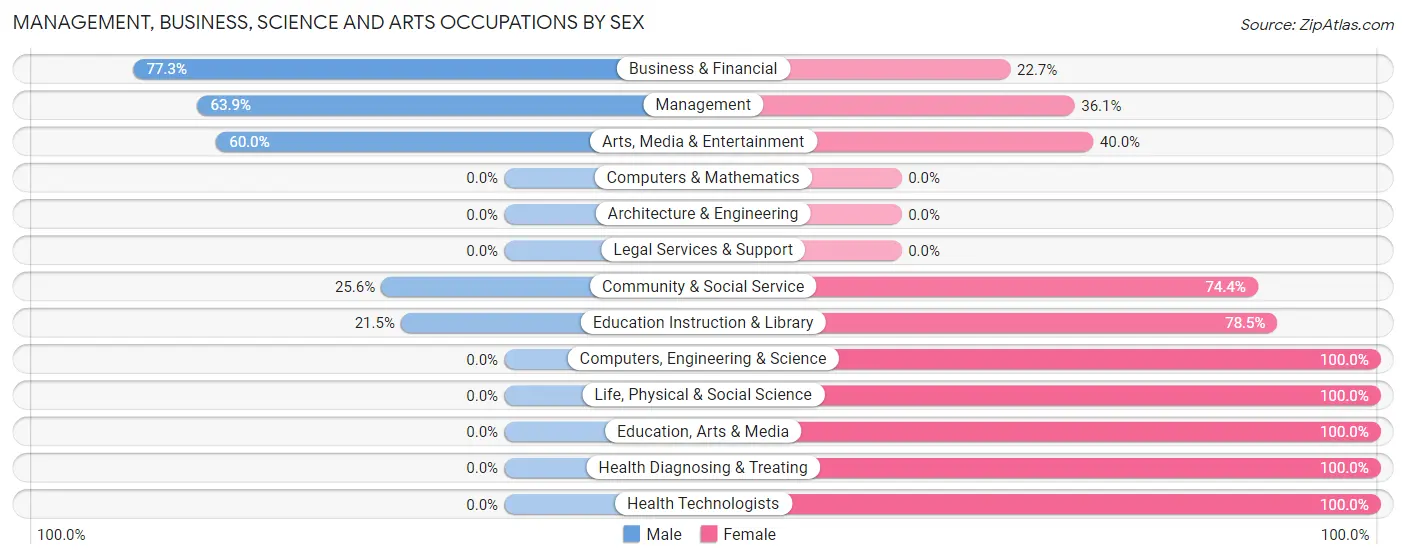
| Occupation | Male | Female |
| Management | 46 (63.9%) | 26 (36.1%) |
| Business & Financial | 17 (77.3%) | 5 (22.7%) |
| Computers, Engineering & Science | 0 (0.0%) | 3 (100.0%) |
| Computers & Mathematics | 0 (0.0%) | 0 (0.0%) |
| Architecture & Engineering | 0 (0.0%) | 0 (0.0%) |
| Life, Physical & Social Science | 0 (0.0%) | 3 (100.0%) |
| Community & Social Service | 20 (25.6%) | 58 (74.4%) |
| Education, Arts & Media | 0 (0.0%) | 3 (100.0%) |
| Legal Services & Support | 0 (0.0%) | 0 (0.0%) |
| Education Instruction & Library | 14 (21.5%) | 51 (78.5%) |
| Arts, Media & Entertainment | 6 (60.0%) | 4 (40.0%) |
| Health Diagnosing & Treating | 0 (0.0%) | 28 (100.0%) |
| Health Technologists | 0 (0.0%) | 19 (100.0%) |
| Total (Category) | 83 (40.9%) | 120 (59.1%) |
| Total (Overall) | 446 (53.2%) | 392 (46.8%) |
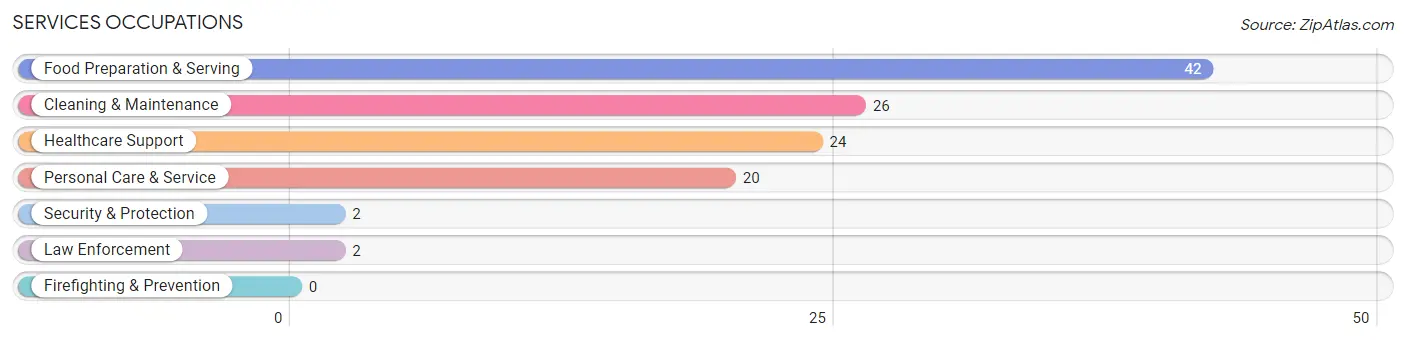
Services Occupations
The most common Services occupations in Nashua are Food Preparation & Serving (42 | 5.0%), Cleaning & Maintenance (26 | 3.1%), Healthcare Support (24 | 2.9%), Personal Care & Service (20 | 2.4%), and Security & Protection (2 | 0.2%).
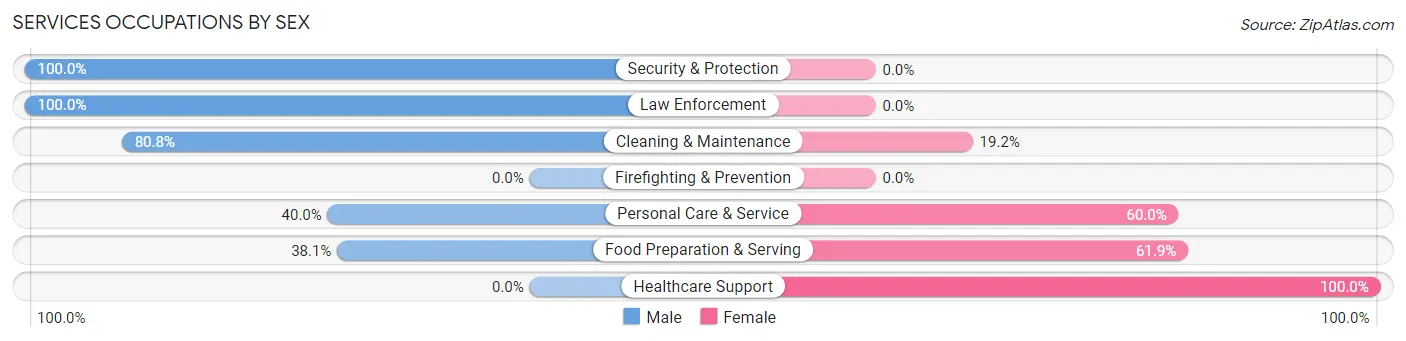
Services Occupations by Sex
Within the Services occupations in Nashua, the most male-oriented occupations are Security & Protection (100.0%), Law Enforcement (100.0%), and Cleaning & Maintenance (80.8%), while the most female-oriented occupations are Healthcare Support (100.0%), Food Preparation & Serving (61.9%), and Personal Care & Service (60.0%).
| Occupation | Male | Female |
| Healthcare Support | 0 (0.0%) | 24 (100.0%) |
| Security & Protection | 2 (100.0%) | 0 (0.0%) |
| Firefighting & Prevention | 0 (0.0%) | 0 (0.0%) |
| Law Enforcement | 2 (100.0%) | 0 (0.0%) |
| Food Preparation & Serving | 16 (38.1%) | 26 (61.9%) |
| Cleaning & Maintenance | 21 (80.8%) | 5 (19.2%) |
| Personal Care & Service | 8 (40.0%) | 12 (60.0%) |
| Total (Category) | 47 (41.2%) | 67 (58.8%) |
| Total (Overall) | 446 (53.2%) | 392 (46.8%) |
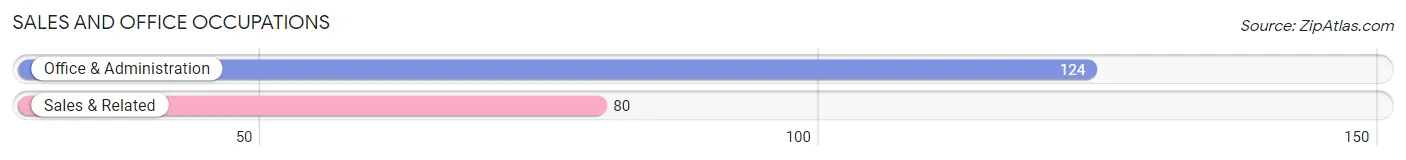
Sales and Office Occupations
The most common Sales and Office occupations in Nashua are Office & Administration (124 | 14.8%), and Sales & Related (80 | 9.6%).
Sales and Office Occupations by Sex

| Occupation | Male | Female |
| Sales & Related | 32 (40.0%) | 48 (60.0%) |
| Office & Administration | 24 (19.4%) | 100 (80.6%) |
| Total (Category) | 56 (27.5%) | 148 (72.6%) |
| Total (Overall) | 446 (53.2%) | 392 (46.8%) |
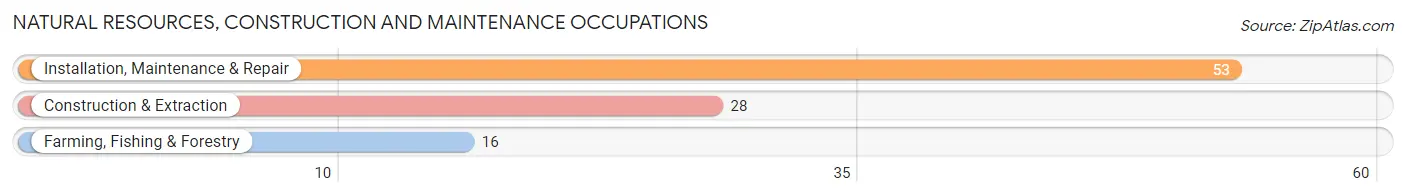
Natural Resources, Construction and Maintenance Occupations
The most common Natural Resources, Construction and Maintenance occupations in Nashua are Installation, Maintenance & Repair (53 | 6.3%), Construction & Extraction (28 | 3.3%), and Farming, Fishing & Forestry (16 | 1.9%).
Natural Resources, Construction and Maintenance Occupations by Sex
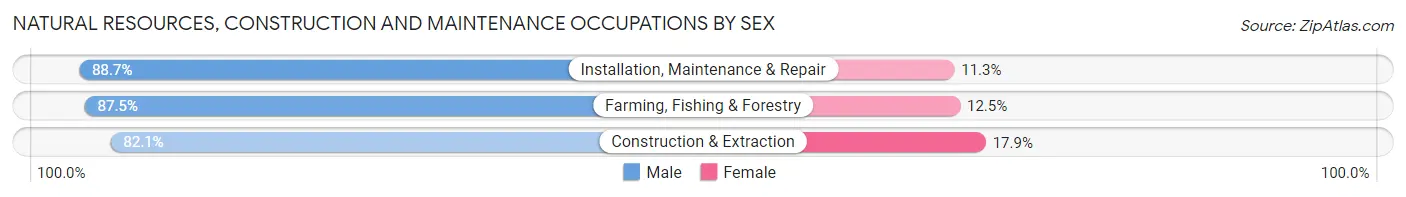
| Occupation | Male | Female |
| Farming, Fishing & Forestry | 14 (87.5%) | 2 (12.5%) |
| Construction & Extraction | 23 (82.1%) | 5 (17.9%) |
| Installation, Maintenance & Repair | 47 (88.7%) | 6 (11.3%) |
| Total (Category) | 84 (86.6%) | 13 (13.4%) |
| Total (Overall) | 446 (53.2%) | 392 (46.8%) |
Production, Transportation and Moving Occupations
The most common Production, Transportation and Moving occupations in Nashua are Production (138 | 16.5%), Transportation (55 | 6.6%), and Material Moving (27 | 3.2%).
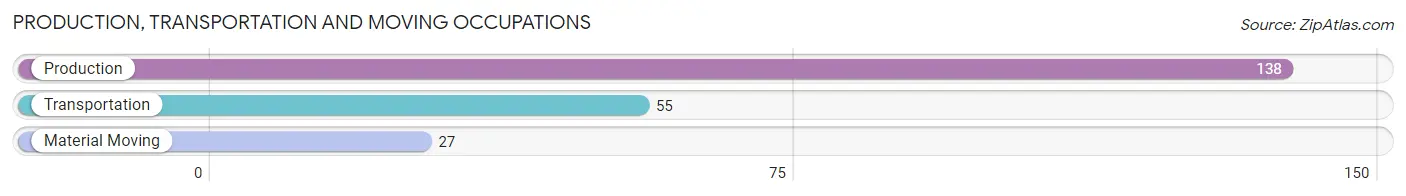
Production, Transportation and Moving Occupations by Sex
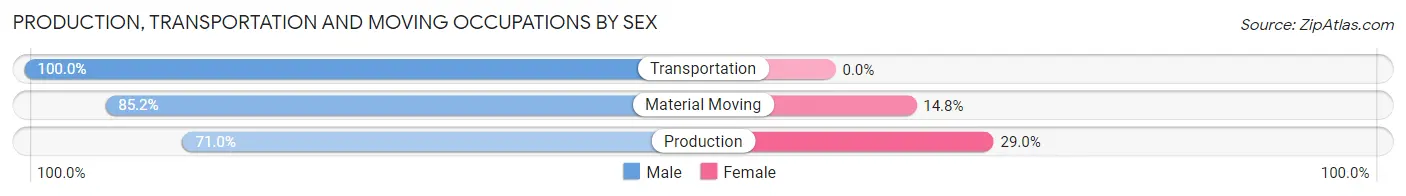
| Occupation | Male | Female |
| Production | 98 (71.0%) | 40 (29.0%) |
| Transportation | 55 (100.0%) | 0 (0.0%) |
| Material Moving | 23 (85.2%) | 4 (14.8%) |
| Total (Category) | 176 (80.0%) | 44 (20.0%) |
| Total (Overall) | 446 (53.2%) | 392 (46.8%) |
Employment Industries by Sex in Nashua
Employment Industries in Nashua
The major employment industries in Nashua include Manufacturing (242 | 28.9%), Educational Services (92 | 11.0%), Retail Trade (69 | 8.2%), Health Care & Social Assistance (58 | 6.9%), and Finance & Insurance (46 | 5.5%).
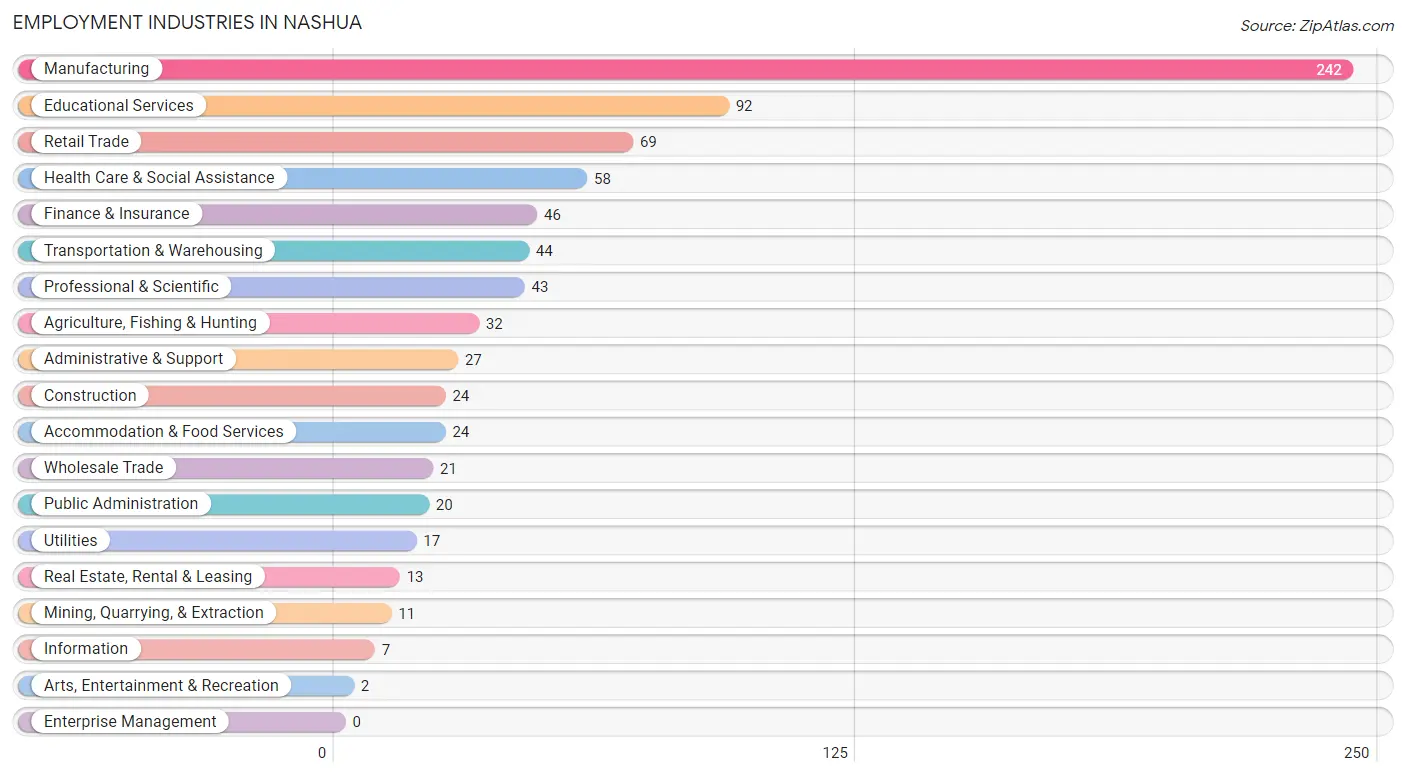
Employment Industries by Sex in Nashua
The Nashua industries that see more men than women are Mining, Quarrying, & Extraction (100.0%), Utilities (100.0%), and Information (100.0%), whereas the industries that tend to have a higher number of women are Accommodation & Food Services (100.0%), Health Care & Social Assistance (93.1%), and Public Administration (85.0%).
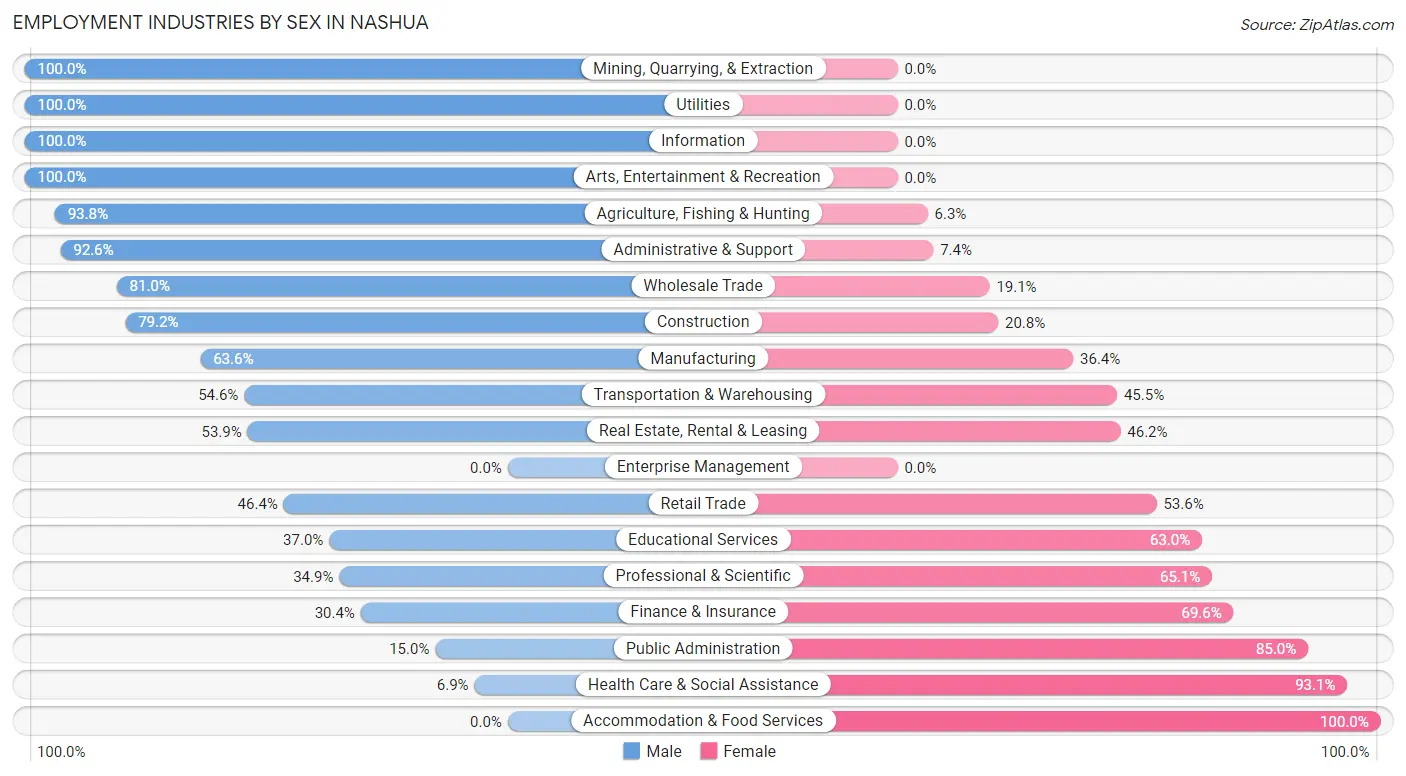
| Industry | Male | Female |
| Agriculture, Fishing & Hunting | 30 (93.8%) | 2 (6.2%) |
| Mining, Quarrying, & Extraction | 11 (100.0%) | 0 (0.0%) |
| Construction | 19 (79.2%) | 5 (20.8%) |
| Manufacturing | 154 (63.6%) | 88 (36.4%) |
| Wholesale Trade | 17 (80.9%) | 4 (19.1%) |
| Retail Trade | 32 (46.4%) | 37 (53.6%) |
| Transportation & Warehousing | 24 (54.5%) | 20 (45.5%) |
| Utilities | 17 (100.0%) | 0 (0.0%) |
| Information | 7 (100.0%) | 0 (0.0%) |
| Finance & Insurance | 14 (30.4%) | 32 (69.6%) |
| Real Estate, Rental & Leasing | 7 (53.8%) | 6 (46.2%) |
| Professional & Scientific | 15 (34.9%) | 28 (65.1%) |
| Enterprise Management | 0 (0.0%) | 0 (0.0%) |
| Administrative & Support | 25 (92.6%) | 2 (7.4%) |
| Educational Services | 34 (37.0%) | 58 (63.0%) |
| Health Care & Social Assistance | 4 (6.9%) | 54 (93.1%) |
| Arts, Entertainment & Recreation | 2 (100.0%) | 0 (0.0%) |
| Accommodation & Food Services | 0 (0.0%) | 24 (100.0%) |
| Public Administration | 3 (15.0%) | 17 (85.0%) |
| Total | 446 (53.2%) | 392 (46.8%) |
Education in Nashua
School Enrollment in Nashua
The most common levels of schooling among the 362 students in Nashua are middle school (98 | 27.1%), elementary school (91 | 25.1%), and high school (77 | 21.3%).
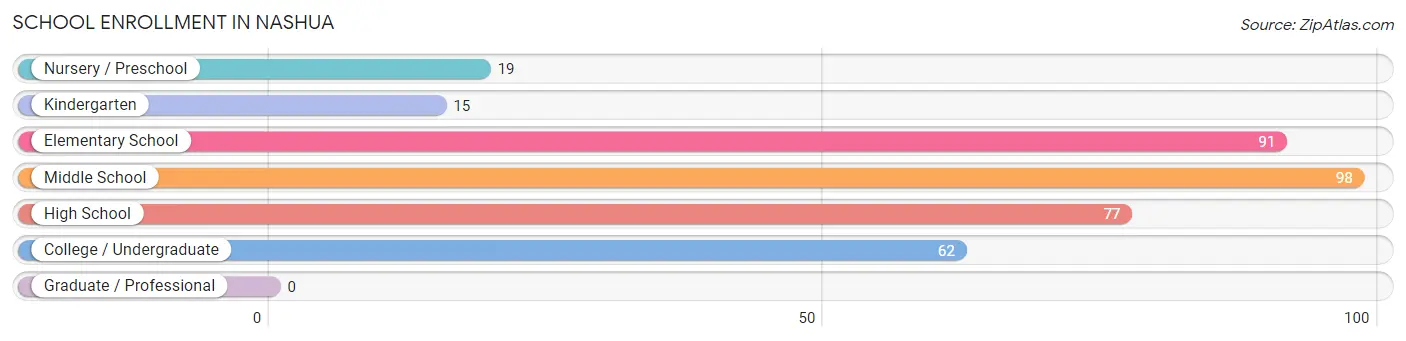
| School Level | # Students | % Students |
| Nursery / Preschool | 19 | 5.2% |
| Kindergarten | 15 | 4.1% |
| Elementary School | 91 | 25.1% |
| Middle School | 98 | 27.1% |
| High School | 77 | 21.3% |
| College / Undergraduate | 62 | 17.1% |
| Graduate / Professional | 0 | 0.0% |
| Total | 362 | 100.0% |
School Enrollment by Age by Funding Source in Nashua
Out of a total of 362 students who are enrolled in schools in Nashua, 23 (6.4%) attend a private institution, while the remaining 339 (93.6%) are enrolled in public schools. The age group of 25 to 34 year olds has the highest likelihood of being enrolled in private schools, with 7 (50.0% in the age bracket) enrolled. Conversely, the age group of 15 to 17 year olds has the lowest likelihood of being enrolled in a private school, with 43 (100.0% in the age bracket) attending a public institution.
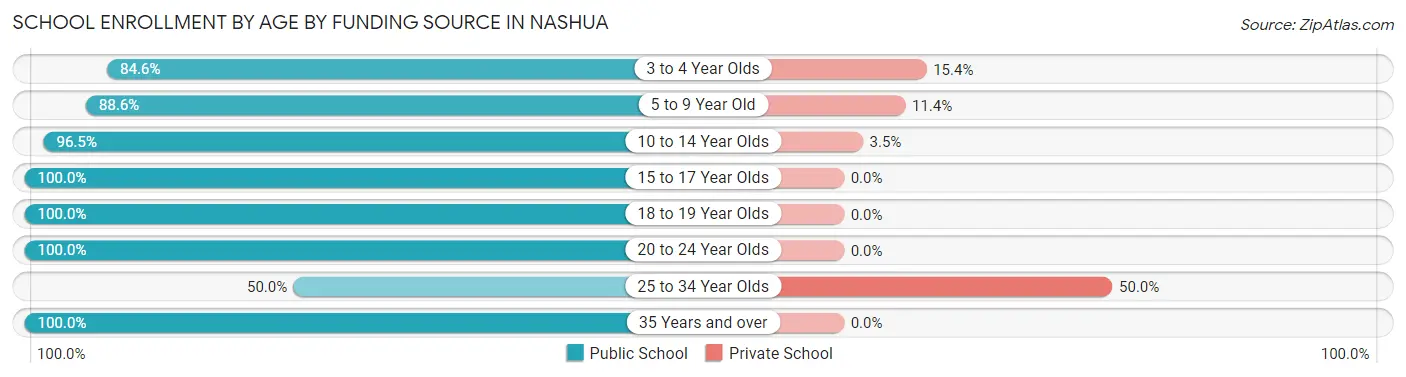
| Age Bracket | Public School | Private School |
| 3 to 4 Year Olds | 11 (84.6%) | 2 (15.4%) |
| 5 to 9 Year Old | 62 (88.6%) | 8 (11.4%) |
| 10 to 14 Year Olds | 164 (96.5%) | 6 (3.5%) |
| 15 to 17 Year Olds | 43 (100.0%) | 0 (0.0%) |
| 18 to 19 Year Olds | 4 (100.0%) | 0 (0.0%) |
| 20 to 24 Year Olds | 45 (100.0%) | 0 (0.0%) |
| 25 to 34 Year Olds | 7 (50.0%) | 7 (50.0%) |
| 35 Years and over | 3 (100.0%) | 0 (0.0%) |
| Total | 339 (93.6%) | 23 (6.4%) |
Educational Attainment by Field of Study in Nashua
Education (65 | 38.0%), business (30 | 17.5%), science & technology (26 | 15.2%), bio, nature & agricultural (21 | 12.3%), and liberal arts & history (10 | 5.9%) are the most common fields of study among 171 individuals in Nashua who have obtained a bachelor's degree or higher.
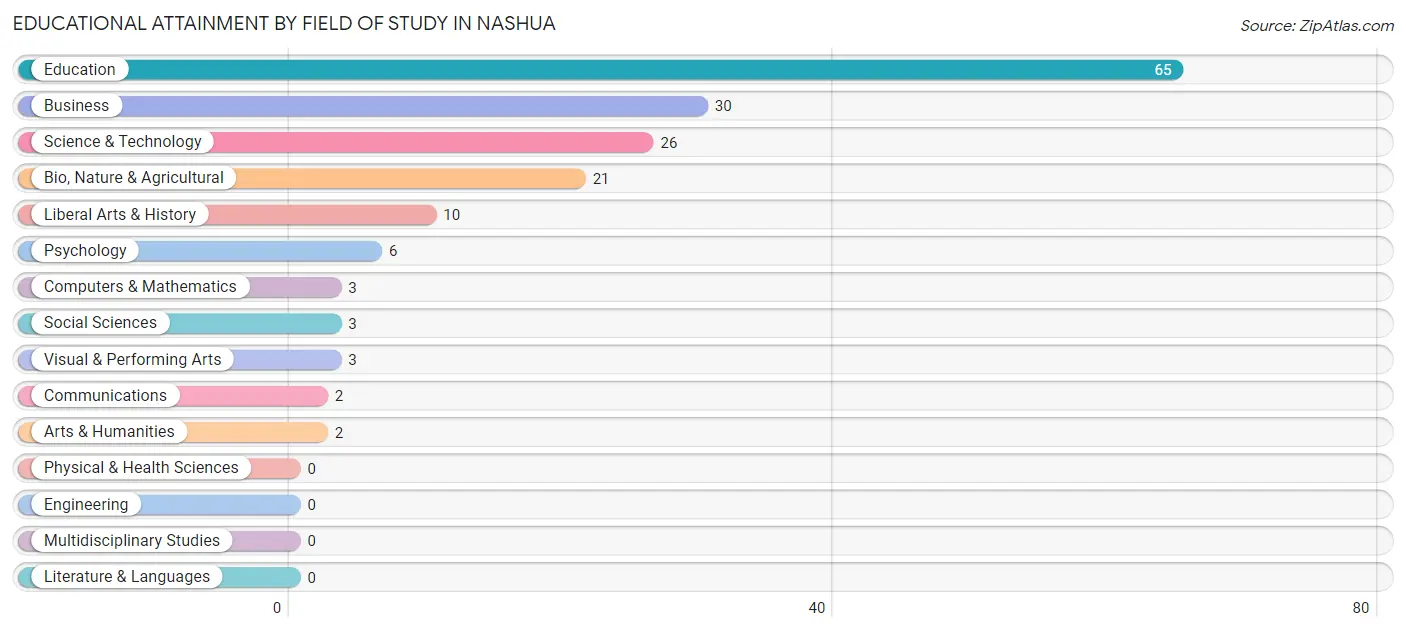
| Field of Study | # Graduates | % Graduates |
| Computers & Mathematics | 3 | 1.8% |
| Bio, Nature & Agricultural | 21 | 12.3% |
| Physical & Health Sciences | 0 | 0.0% |
| Psychology | 6 | 3.5% |
| Social Sciences | 3 | 1.8% |
| Engineering | 0 | 0.0% |
| Multidisciplinary Studies | 0 | 0.0% |
| Science & Technology | 26 | 15.2% |
| Business | 30 | 17.5% |
| Education | 65 | 38.0% |
| Literature & Languages | 0 | 0.0% |
| Liberal Arts & History | 10 | 5.9% |
| Visual & Performing Arts | 3 | 1.8% |
| Communications | 2 | 1.2% |
| Arts & Humanities | 2 | 1.2% |
| Total | 171 | 100.0% |
Transportation & Commute in Nashua
Vehicle Availability by Sex in Nashua
The most prevalent vehicle ownership categories in Nashua are males with 2 vehicles (236, accounting for 53.3%) and females with 2 vehicles (193, making up 61.1%).
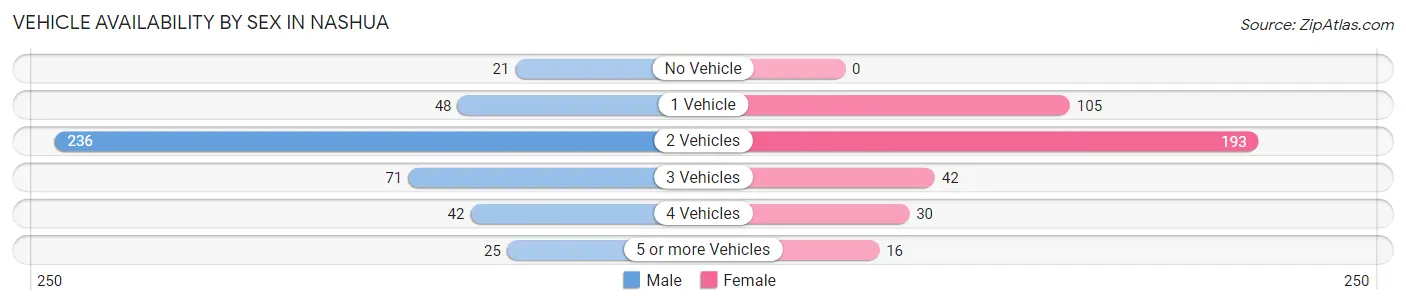
| Vehicles Available | Male | Female |
| No Vehicle | 21 (4.7%) | 0 (0.0%) |
| 1 Vehicle | 48 (10.8%) | 105 (27.2%) |
| 2 Vehicles | 236 (53.3%) | 193 (50.0%) |
| 3 Vehicles | 71 (16.0%) | 42 (10.9%) |
| 4 Vehicles | 42 (9.5%) | 30 (7.8%) |
| 5 or more Vehicles | 25 (5.6%) | 16 (4.2%) |
| Total | 443 (100.0%) | 386 (100.0%) |
Commute Time in Nashua
The most frequently occuring commute durations in Nashua are 30 to 34 minutes (138 commuters, 17.8%), 20 to 24 minutes (121 commuters, 15.6%), and 5 to 9 minutes (107 commuters, 13.8%).
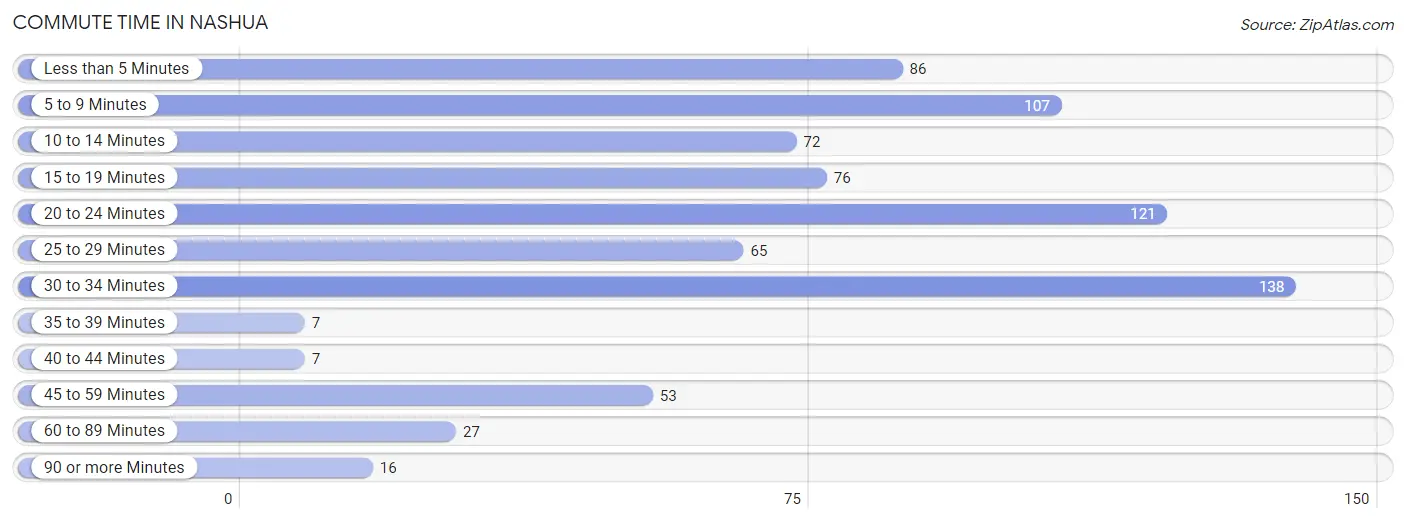
| Commute Time | # Commuters | % Commuters |
| Less than 5 Minutes | 86 | 11.1% |
| 5 to 9 Minutes | 107 | 13.8% |
| 10 to 14 Minutes | 72 | 9.3% |
| 15 to 19 Minutes | 76 | 9.8% |
| 20 to 24 Minutes | 121 | 15.6% |
| 25 to 29 Minutes | 65 | 8.4% |
| 30 to 34 Minutes | 138 | 17.8% |
| 35 to 39 Minutes | 7 | 0.9% |
| 40 to 44 Minutes | 7 | 0.9% |
| 45 to 59 Minutes | 53 | 6.8% |
| 60 to 89 Minutes | 27 | 3.5% |
| 90 or more Minutes | 16 | 2.1% |
Commute Time by Sex in Nashua
The most common commute times in Nashua are 5 to 9 minutes (83 commuters, 20.2%) for males and 30 to 34 minutes (85 commuters, 23.3%) for females.
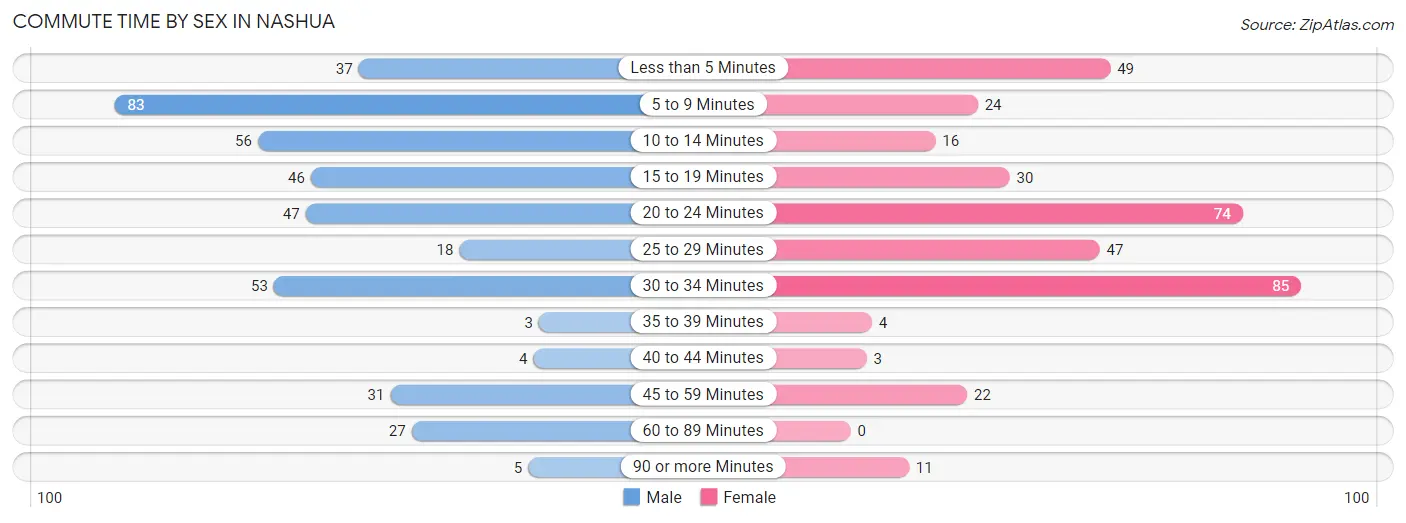
| Commute Time | Male | Female |
| Less than 5 Minutes | 37 (9.0%) | 49 (13.4%) |
| 5 to 9 Minutes | 83 (20.2%) | 24 (6.6%) |
| 10 to 14 Minutes | 56 (13.7%) | 16 (4.4%) |
| 15 to 19 Minutes | 46 (11.2%) | 30 (8.2%) |
| 20 to 24 Minutes | 47 (11.5%) | 74 (20.3%) |
| 25 to 29 Minutes | 18 (4.4%) | 47 (12.9%) |
| 30 to 34 Minutes | 53 (12.9%) | 85 (23.3%) |
| 35 to 39 Minutes | 3 (0.7%) | 4 (1.1%) |
| 40 to 44 Minutes | 4 (1.0%) | 3 (0.8%) |
| 45 to 59 Minutes | 31 (7.6%) | 22 (6.0%) |
| 60 to 89 Minutes | 27 (6.6%) | 0 (0.0%) |
| 90 or more Minutes | 5 (1.2%) | 11 (3.0%) |
Time of Departure to Work by Sex in Nashua
The most frequent times of departure to work in Nashua are 7:30 AM to 7:59 AM (65, 15.9%) for males and 7:00 AM to 7:29 AM (73, 20.0%) for females.
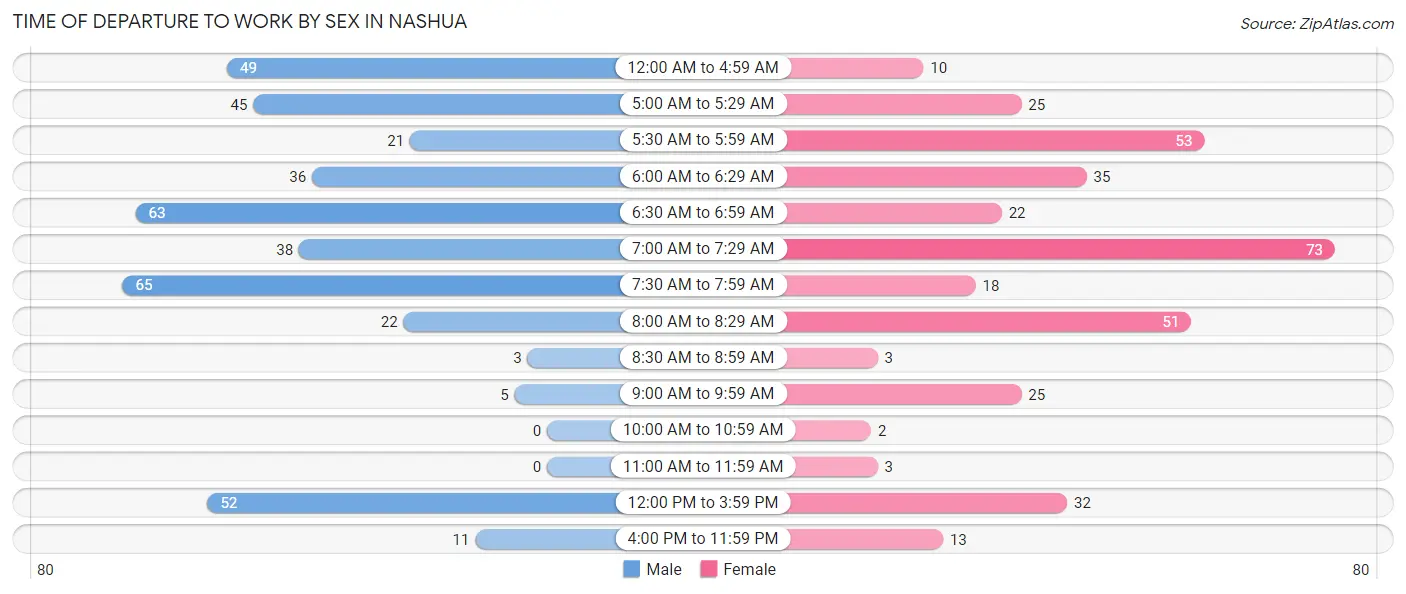
| Time of Departure | Male | Female |
| 12:00 AM to 4:59 AM | 49 (11.9%) | 10 (2.7%) |
| 5:00 AM to 5:29 AM | 45 (11.0%) | 25 (6.9%) |
| 5:30 AM to 5:59 AM | 21 (5.1%) | 53 (14.5%) |
| 6:00 AM to 6:29 AM | 36 (8.8%) | 35 (9.6%) |
| 6:30 AM to 6:59 AM | 63 (15.4%) | 22 (6.0%) |
| 7:00 AM to 7:29 AM | 38 (9.3%) | 73 (20.0%) |
| 7:30 AM to 7:59 AM | 65 (15.9%) | 18 (4.9%) |
| 8:00 AM to 8:29 AM | 22 (5.4%) | 51 (14.0%) |
| 8:30 AM to 8:59 AM | 3 (0.7%) | 3 (0.8%) |
| 9:00 AM to 9:59 AM | 5 (1.2%) | 25 (6.9%) |
| 10:00 AM to 10:59 AM | 0 (0.0%) | 2 (0.5%) |
| 11:00 AM to 11:59 AM | 0 (0.0%) | 3 (0.8%) |
| 12:00 PM to 3:59 PM | 52 (12.7%) | 32 (8.8%) |
| 4:00 PM to 11:59 PM | 11 (2.7%) | 13 (3.6%) |
| Total | 410 (100.0%) | 365 (100.0%) |
Housing Occupancy in Nashua
Occupancy by Ownership in Nashua
Of the total 646 dwellings in Nashua, owner-occupied units account for 516 (79.9%), while renter-occupied units make up 130 (20.1%).
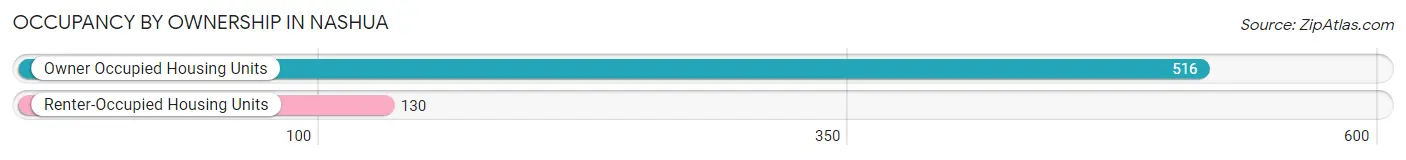
| Occupancy | # Housing Units | % Housing Units |
| Owner Occupied Housing Units | 516 | 79.9% |
| Renter-Occupied Housing Units | 130 | 20.1% |
| Total Occupied Housing Units | 646 | 100.0% |
Occupancy by Household Size in Nashua
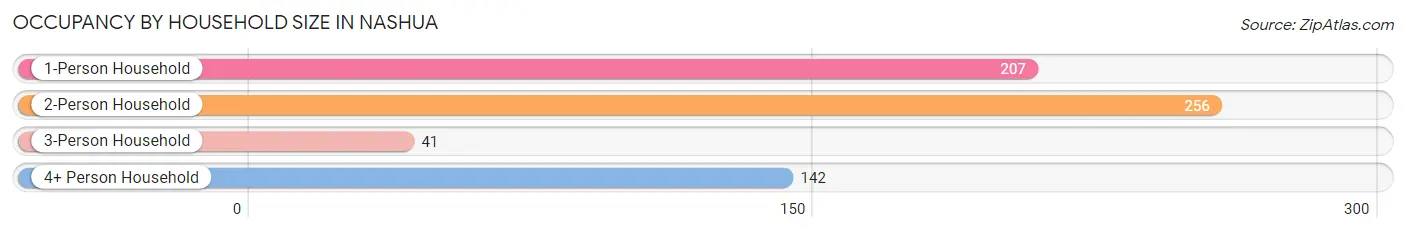
| Household Size | # Housing Units | % Housing Units |
| 1-Person Household | 207 | 32.0% |
| 2-Person Household | 256 | 39.6% |
| 3-Person Household | 41 | 6.4% |
| 4+ Person Household | 142 | 22.0% |
| Total Housing Units | 646 | 100.0% |
Occupancy by Ownership by Household Size in Nashua
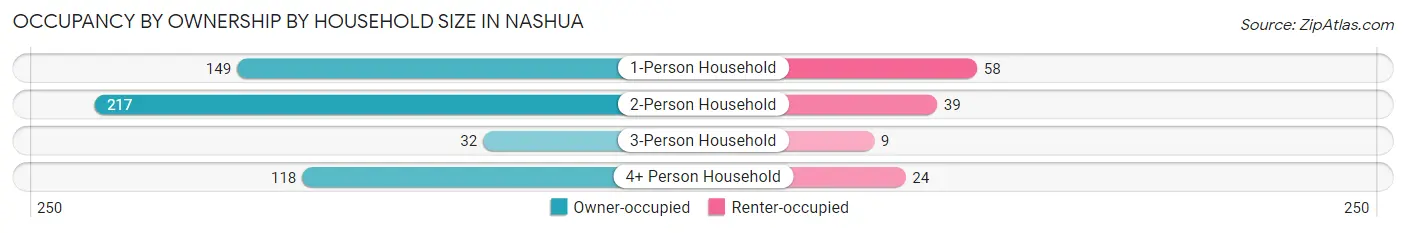
| Household Size | Owner-occupied | Renter-occupied |
| 1-Person Household | 149 (72.0%) | 58 (28.0%) |
| 2-Person Household | 217 (84.8%) | 39 (15.2%) |
| 3-Person Household | 32 (78.0%) | 9 (22.0%) |
| 4+ Person Household | 118 (83.1%) | 24 (16.9%) |
| Total Housing Units | 516 (79.9%) | 130 (20.1%) |
Occupancy by Educational Attainment in Nashua
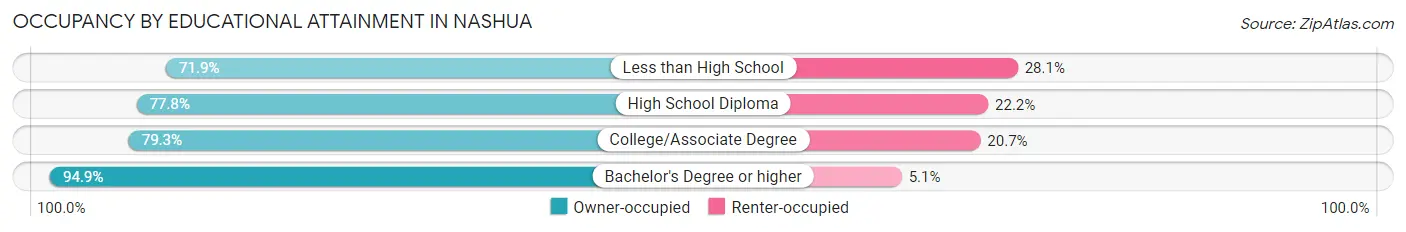
| Household Size | Owner-occupied | Renter-occupied |
| Less than High School | 41 (71.9%) | 16 (28.1%) |
| High School Diploma | 235 (77.8%) | 67 (22.2%) |
| College/Associate Degree | 165 (79.3%) | 43 (20.7%) |
| Bachelor's Degree or higher | 75 (94.9%) | 4 (5.1%) |
Occupancy by Age of Householder in Nashua
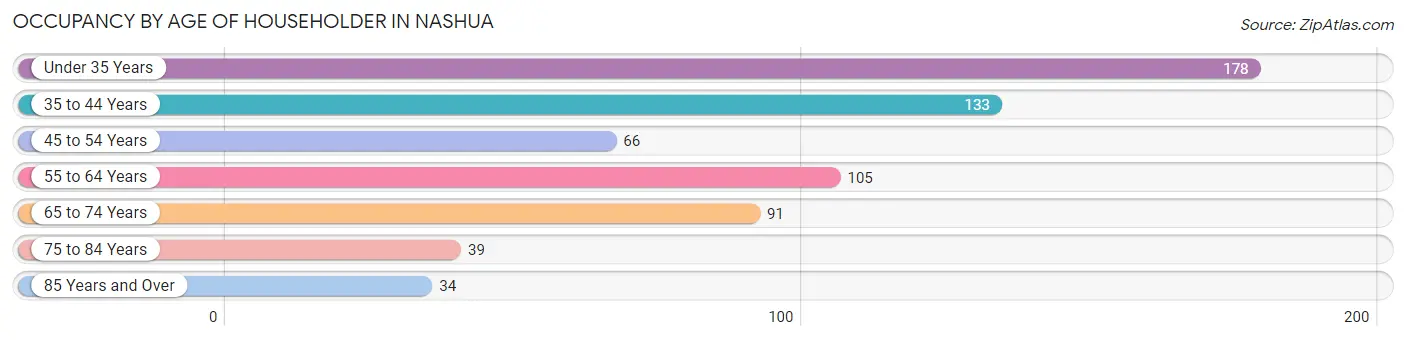
| Age Bracket | # Households | % Households |
| Under 35 Years | 178 | 27.6% |
| 35 to 44 Years | 133 | 20.6% |
| 45 to 54 Years | 66 | 10.2% |
| 55 to 64 Years | 105 | 16.3% |
| 65 to 74 Years | 91 | 14.1% |
| 75 to 84 Years | 39 | 6.0% |
| 85 Years and Over | 34 | 5.3% |
| Total | 646 | 100.0% |
Housing Finances in Nashua
Median Income by Occupancy in Nashua
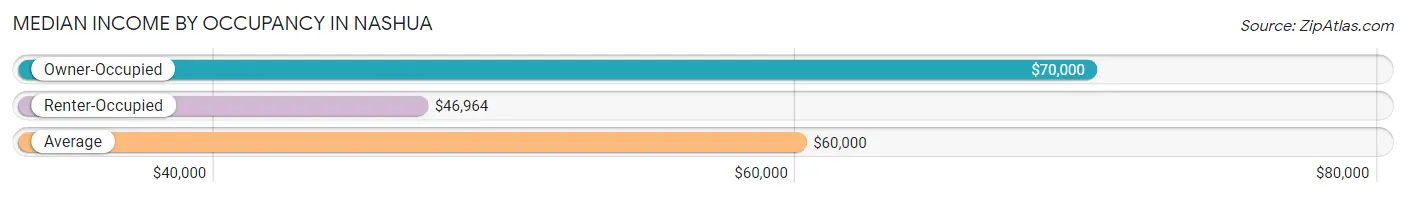
| Occupancy Type | # Households | Median Income |
| Owner-Occupied | 516 (79.9%) | $70,000 |
| Renter-Occupied | 130 (20.1%) | $46,964 |
| Average | 646 (100.0%) | $60,000 |
Occupancy by Householder Income Bracket in Nashua

| Income Bracket | Owner-occupied | Renter-occupied |
| Less than $5,000 | 14 (2.7%) | 5 (3.8%) |
| $5,000 to $9,999 | 2 (0.4%) | 9 (6.9%) |
| $10,000 to $14,999 | 13 (2.5%) | 0 (0.0%) |
| $15,000 to $19,999 | 40 (7.7%) | 15 (11.5%) |
| $20,000 to $24,999 | 9 (1.7%) | 0 (0.0%) |
| $25,000 to $34,999 | 46 (8.9%) | 6 (4.6%) |
| $35,000 to $49,999 | 87 (16.9%) | 36 (27.7%) |
| $50,000 to $74,999 | 56 (10.8%) | 24 (18.5%) |
| $75,000 to $99,999 | 122 (23.6%) | 20 (15.4%) |
| $100,000 to $149,999 | 72 (14.0%) | 15 (11.5%) |
| $150,000 or more | 55 (10.7%) | 0 (0.0%) |
| Total | 516 (100.0%) | 130 (100.0%) |
Monthly Housing Cost Tiers in Nashua
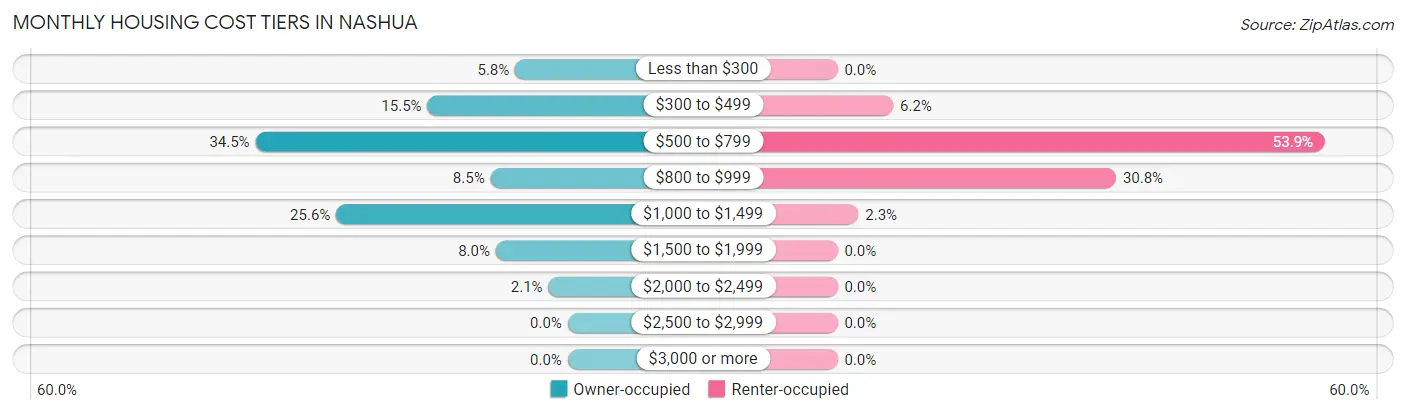
| Monthly Cost | Owner-occupied | Renter-occupied |
| Less than $300 | 30 (5.8%) | 0 (0.0%) |
| $300 to $499 | 80 (15.5%) | 8 (6.1%) |
| $500 to $799 | 178 (34.5%) | 70 (53.8%) |
| $800 to $999 | 44 (8.5%) | 40 (30.8%) |
| $1,000 to $1,499 | 132 (25.6%) | 3 (2.3%) |
| $1,500 to $1,999 | 41 (8.0%) | 0 (0.0%) |
| $2,000 to $2,499 | 11 (2.1%) | 0 (0.0%) |
| $2,500 to $2,999 | 0 (0.0%) | 0 (0.0%) |
| $3,000 or more | 0 (0.0%) | 0 (0.0%) |
| Total | 516 (100.0%) | 130 (100.0%) |
Physical Housing Characteristics in Nashua
Housing Structures in Nashua
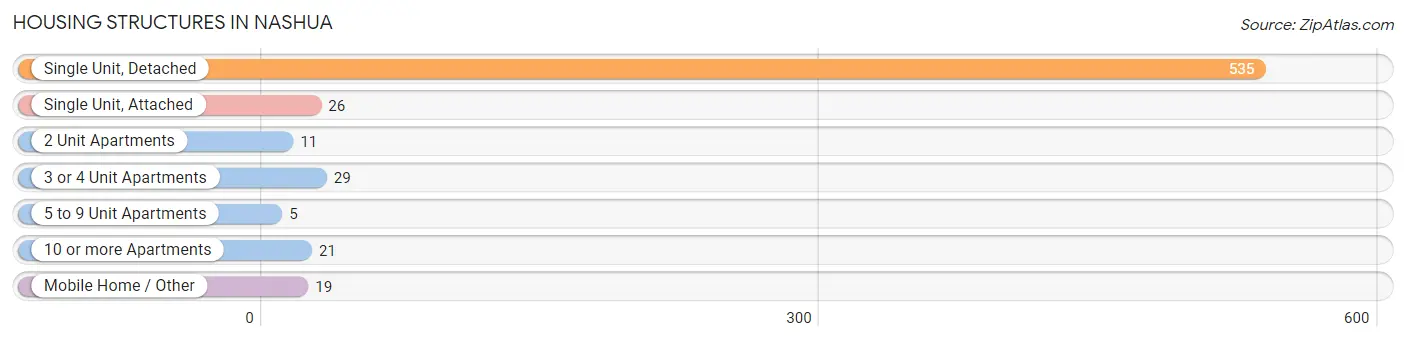
| Structure Type | # Housing Units | % Housing Units |
| Single Unit, Detached | 535 | 82.8% |
| Single Unit, Attached | 26 | 4.0% |
| 2 Unit Apartments | 11 | 1.7% |
| 3 or 4 Unit Apartments | 29 | 4.5% |
| 5 to 9 Unit Apartments | 5 | 0.8% |
| 10 or more Apartments | 21 | 3.3% |
| Mobile Home / Other | 19 | 2.9% |
| Total | 646 | 100.0% |
Housing Structures by Occupancy in Nashua
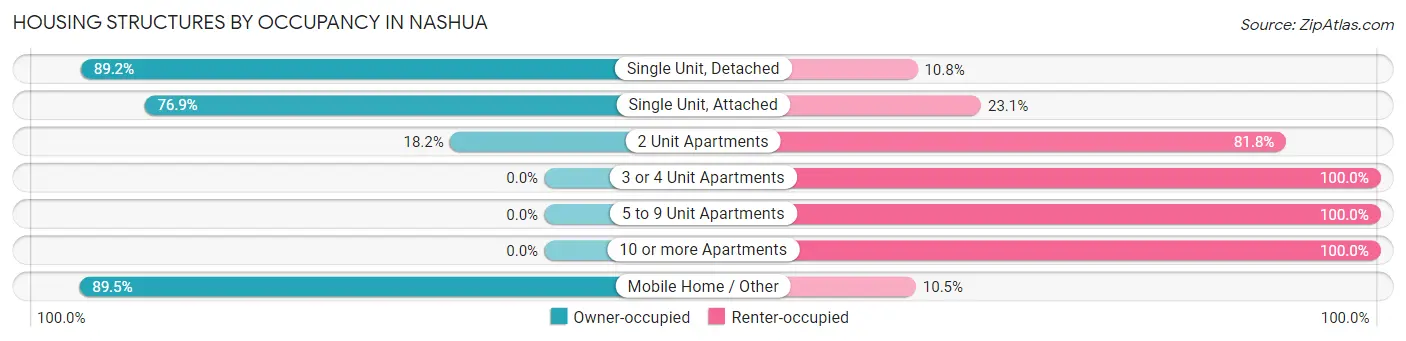
| Structure Type | Owner-occupied | Renter-occupied |
| Single Unit, Detached | 477 (89.2%) | 58 (10.8%) |
| Single Unit, Attached | 20 (76.9%) | 6 (23.1%) |
| 2 Unit Apartments | 2 (18.2%) | 9 (81.8%) |
| 3 or 4 Unit Apartments | 0 (0.0%) | 29 (100.0%) |
| 5 to 9 Unit Apartments | 0 (0.0%) | 5 (100.0%) |
| 10 or more Apartments | 0 (0.0%) | 21 (100.0%) |
| Mobile Home / Other | 17 (89.5%) | 2 (10.5%) |
| Total | 516 (79.9%) | 130 (20.1%) |
Housing Structures by Number of Rooms in Nashua
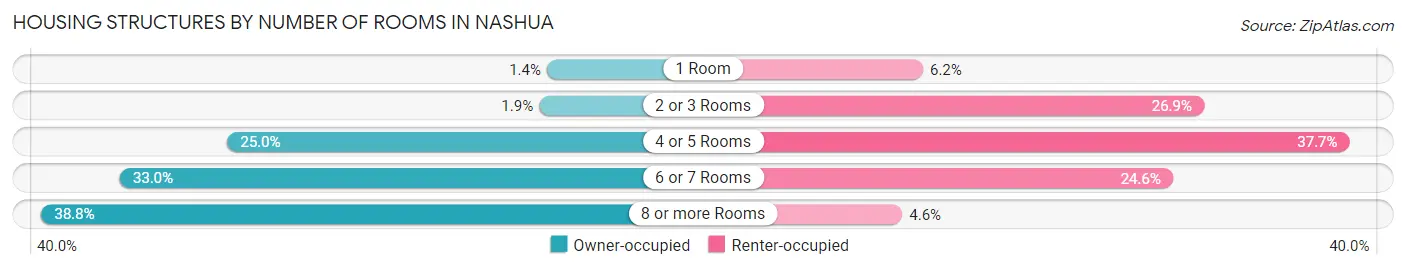
| Number of Rooms | Owner-occupied | Renter-occupied |
| 1 Room | 7 (1.4%) | 8 (6.1%) |
| 2 or 3 Rooms | 10 (1.9%) | 35 (26.9%) |
| 4 or 5 Rooms | 129 (25.0%) | 49 (37.7%) |
| 6 or 7 Rooms | 170 (33.0%) | 32 (24.6%) |
| 8 or more Rooms | 200 (38.8%) | 6 (4.6%) |
| Total | 516 (100.0%) | 130 (100.0%) |
Housing Structure by Heating Type in Nashua
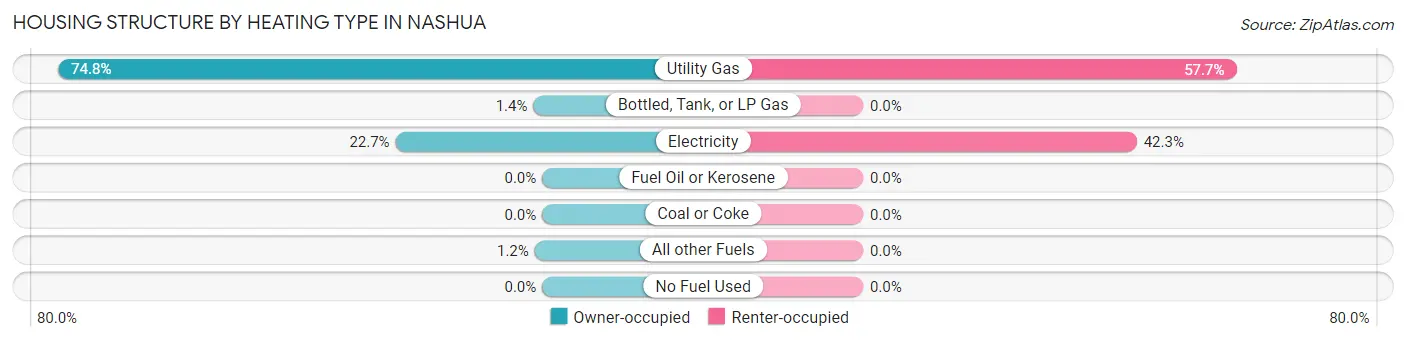
| Heating Type | Owner-occupied | Renter-occupied |
| Utility Gas | 386 (74.8%) | 75 (57.7%) |
| Bottled, Tank, or LP Gas | 7 (1.4%) | 0 (0.0%) |
| Electricity | 117 (22.7%) | 55 (42.3%) |
| Fuel Oil or Kerosene | 0 (0.0%) | 0 (0.0%) |
| Coal or Coke | 0 (0.0%) | 0 (0.0%) |
| All other Fuels | 6 (1.2%) | 0 (0.0%) |
| No Fuel Used | 0 (0.0%) | 0 (0.0%) |
| Total | 516 (100.0%) | 130 (100.0%) |
Household Vehicle Usage in Nashua
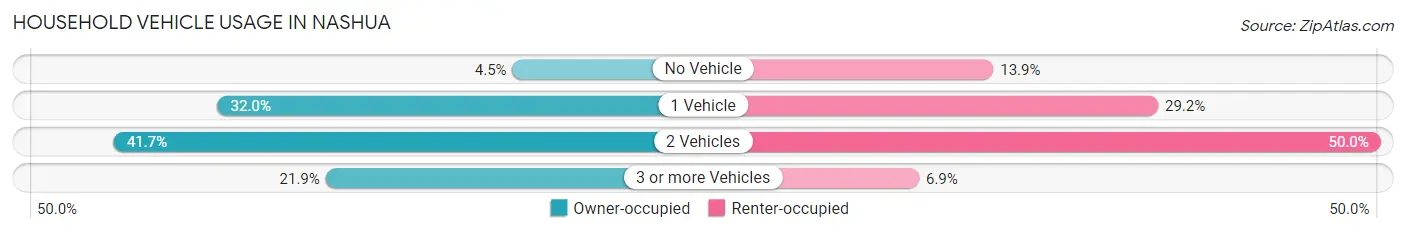
| Vehicles per Household | Owner-occupied | Renter-occupied |
| No Vehicle | 23 (4.5%) | 18 (13.9%) |
| 1 Vehicle | 165 (32.0%) | 38 (29.2%) |
| 2 Vehicles | 215 (41.7%) | 65 (50.0%) |
| 3 or more Vehicles | 113 (21.9%) | 9 (6.9%) |
| Total | 516 (100.0%) | 130 (100.0%) |
Real Estate & Mortgages in Nashua
Real Estate and Mortgage Overview in Nashua
| Characteristic | Without Mortgage | With Mortgage |
| Housing Units | 211 | 305 |
| Median Property Value | $89,600 | $115,800 |
| Median Household Income | $44,107 | $43 |
| Monthly Housing Costs | $502 | $0 |
| Real Estate Taxes | $1,130 | $4 |
Property Value by Mortgage Status in Nashua
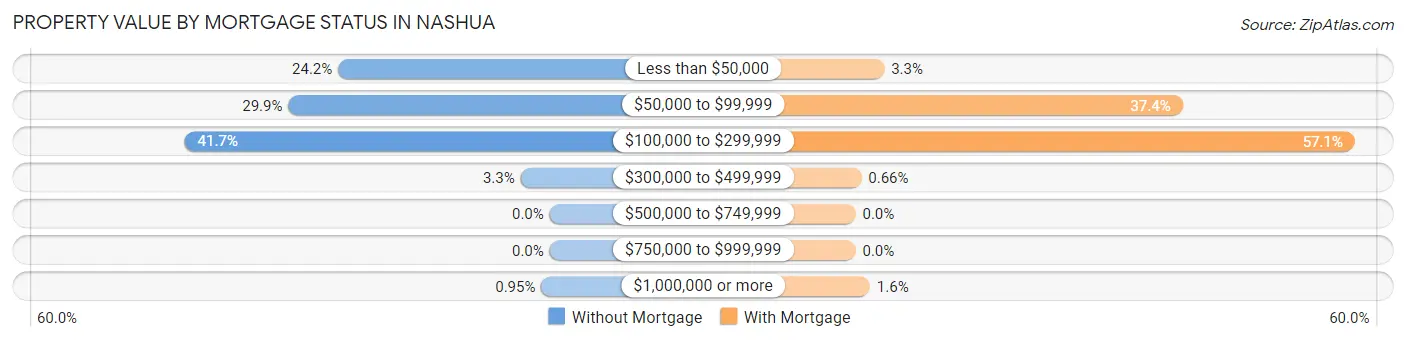
| Property Value | Without Mortgage | With Mortgage |
| Less than $50,000 | 51 (24.2%) | 10 (3.3%) |
| $50,000 to $99,999 | 63 (29.9%) | 114 (37.4%) |
| $100,000 to $299,999 | 88 (41.7%) | 174 (57.1%) |
| $300,000 to $499,999 | 7 (3.3%) | 2 (0.7%) |
| $500,000 to $749,999 | 0 (0.0%) | 0 (0.0%) |
| $750,000 to $999,999 | 0 (0.0%) | 0 (0.0%) |
| $1,000,000 or more | 2 (0.9%) | 5 (1.6%) |
| Total | 211 (100.0%) | 305 (100.0%) |
Household Income by Mortgage Status in Nashua
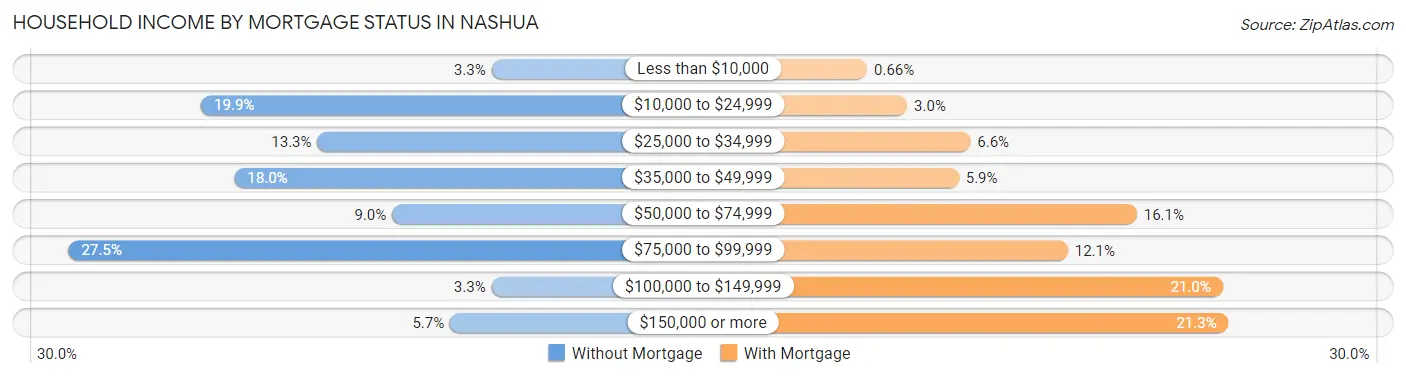
| Household Income | Without Mortgage | With Mortgage |
| Less than $10,000 | 7 (3.3%) | 2 (0.7%) |
| $10,000 to $24,999 | 42 (19.9%) | 9 (2.9%) |
| $25,000 to $34,999 | 28 (13.3%) | 20 (6.6%) |
| $35,000 to $49,999 | 38 (18.0%) | 18 (5.9%) |
| $50,000 to $74,999 | 19 (9.0%) | 49 (16.1%) |
| $75,000 to $99,999 | 58 (27.5%) | 37 (12.1%) |
| $100,000 to $149,999 | 7 (3.3%) | 64 (21.0%) |
| $150,000 or more | 12 (5.7%) | 65 (21.3%) |
| Total | 211 (100.0%) | 305 (100.0%) |
Property Value to Household Income Ratio in Nashua
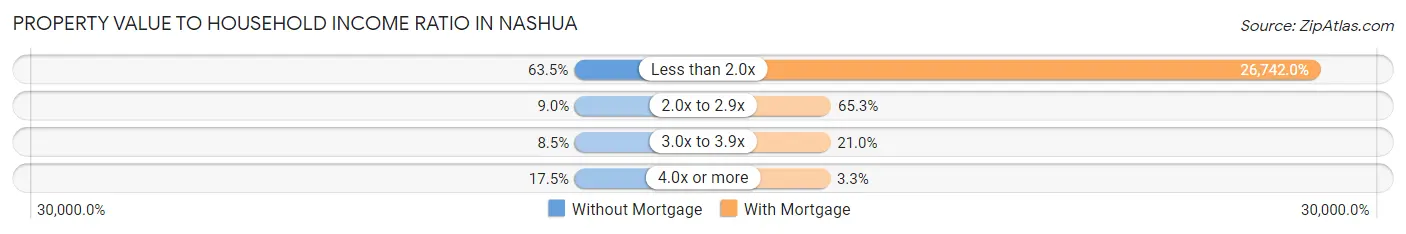
| Value-to-Income Ratio | Without Mortgage | With Mortgage |
| Less than 2.0x | 134 (63.5%) | 81,563 (26,742.0%) |
| 2.0x to 2.9x | 19 (9.0%) | 199 (65.2%) |
| 3.0x to 3.9x | 18 (8.5%) | 64 (21.0%) |
| 4.0x or more | 37 (17.5%) | 10 (3.3%) |
| Total | 211 (100.0%) | 305 (100.0%) |
Real Estate Taxes by Mortgage Status in Nashua
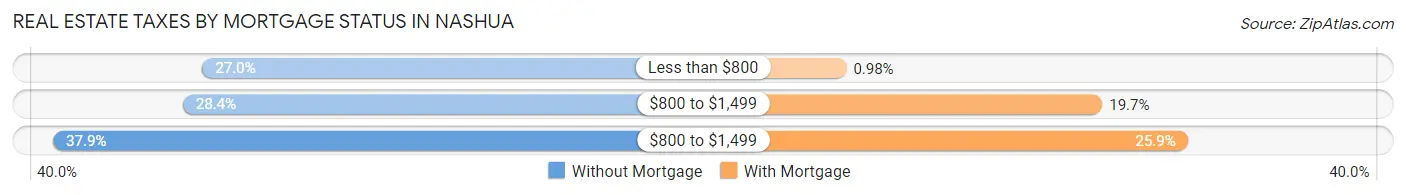
| Property Taxes | Without Mortgage | With Mortgage |
| Less than $800 | 57 (27.0%) | 3 (1.0%) |
| $800 to $1,499 | 60 (28.4%) | 60 (19.7%) |
| $800 to $1,499 | 80 (37.9%) | 79 (25.9%) |
| Total | 211 (100.0%) | 305 (100.0%) |
Health & Disability in Nashua
Health Insurance Coverage by Age in Nashua
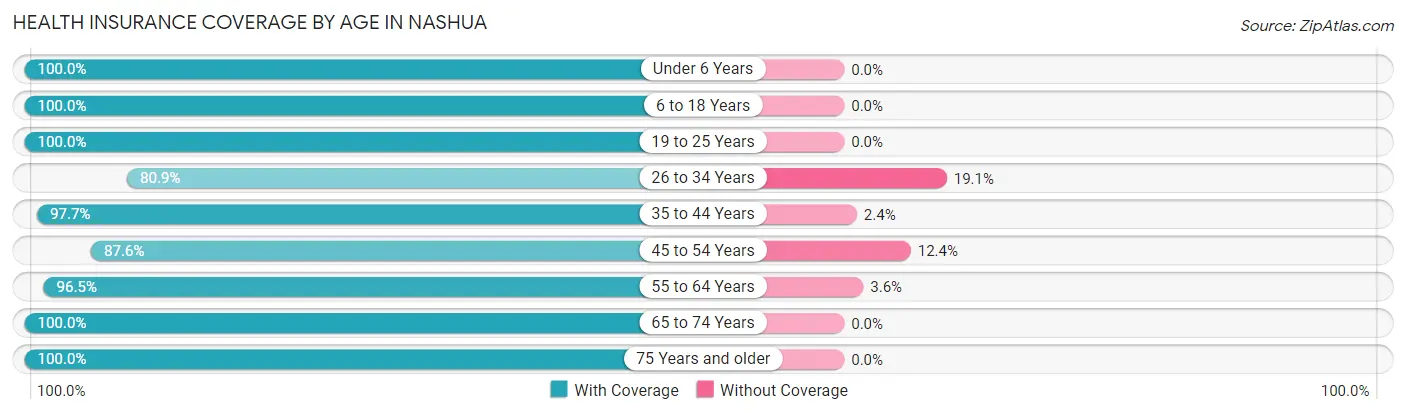
| Age Bracket | With Coverage | Without Coverage |
| Under 6 Years | 90 (100.0%) | 0 (0.0%) |
| 6 to 18 Years | 279 (100.0%) | 0 (0.0%) |
| 19 to 25 Years | 206 (100.0%) | 0 (0.0%) |
| 26 to 34 Years | 110 (80.9%) | 26 (19.1%) |
| 35 to 44 Years | 208 (97.7%) | 5 (2.4%) |
| 45 to 54 Years | 113 (87.6%) | 16 (12.4%) |
| 55 to 64 Years | 163 (96.5%) | 6 (3.5%) |
| 65 to 74 Years | 136 (100.0%) | 0 (0.0%) |
| 75 Years and older | 114 (100.0%) | 0 (0.0%) |
| Total | 1,419 (96.4%) | 53 (3.6%) |
Health Insurance Coverage by Citizenship Status in Nashua
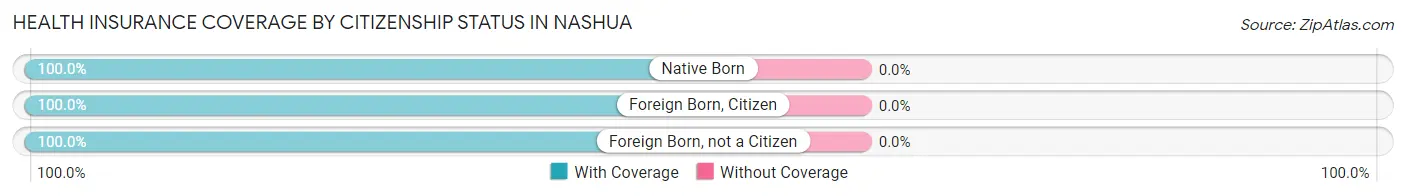
| Citizenship Status | With Coverage | Without Coverage |
| Native Born | 90 (100.0%) | 0 (0.0%) |
| Foreign Born, Citizen | 279 (100.0%) | 0 (0.0%) |
| Foreign Born, not a Citizen | 206 (100.0%) | 0 (0.0%) |
Health Insurance Coverage by Household Income in Nashua
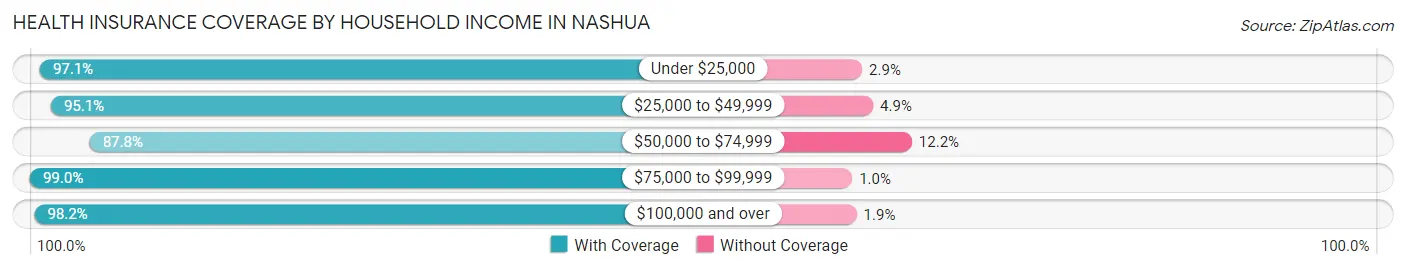
| Household Income | With Coverage | Without Coverage |
| Under $25,000 | 135 (97.1%) | 4 (2.9%) |
| $25,000 to $49,999 | 327 (95.1%) | 17 (4.9%) |
| $50,000 to $74,999 | 144 (87.8%) | 20 (12.2%) |
| $75,000 to $99,999 | 389 (99.0%) | 4 (1.0%) |
| $100,000 and over | 424 (98.2%) | 8 (1.8%) |
Public vs Private Health Insurance Coverage by Age in Nashua
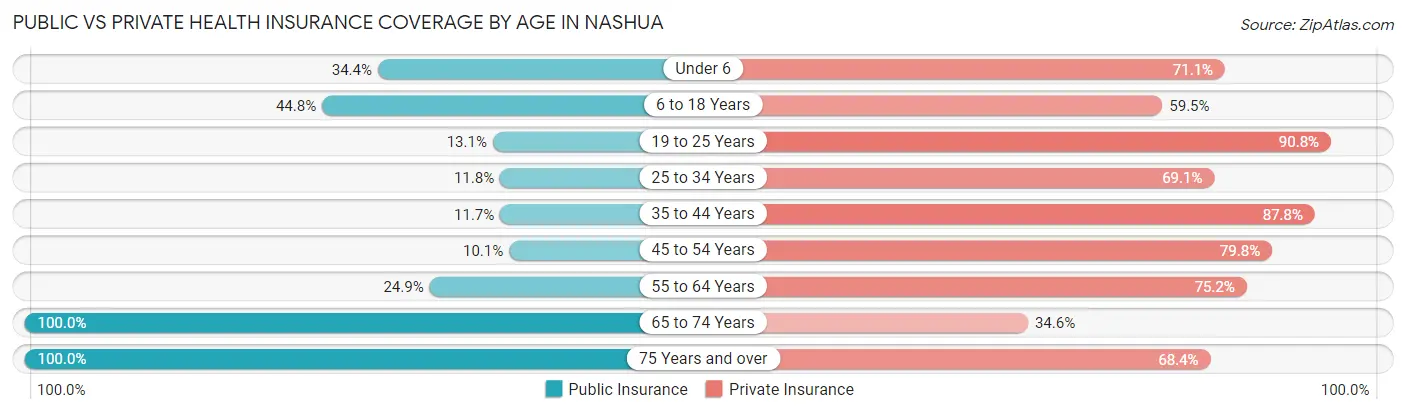
| Age Bracket | Public Insurance | Private Insurance |
| Under 6 | 31 (34.4%) | 64 (71.1%) |
| 6 to 18 Years | 125 (44.8%) | 166 (59.5%) |
| 19 to 25 Years | 27 (13.1%) | 187 (90.8%) |
| 25 to 34 Years | 16 (11.8%) | 94 (69.1%) |
| 35 to 44 Years | 25 (11.7%) | 187 (87.8%) |
| 45 to 54 Years | 13 (10.1%) | 103 (79.8%) |
| 55 to 64 Years | 42 (24.8%) | 127 (75.1%) |
| 65 to 74 Years | 136 (100.0%) | 47 (34.6%) |
| 75 Years and over | 114 (100.0%) | 78 (68.4%) |
| Total | 529 (35.9%) | 1,053 (71.5%) |
Disability Status by Sex by Age in Nashua
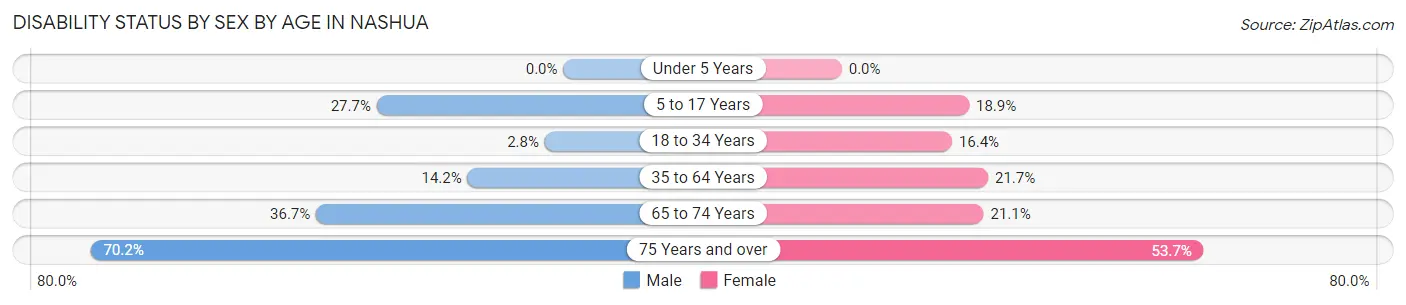
| Age Bracket | Male | Female |
| Under 5 Years | 0 (0.0%) | 0 (0.0%) |
| 5 to 17 Years | 46 (27.7%) | 24 (18.9%) |
| 18 to 34 Years | 5 (2.8%) | 27 (16.4%) |
| 35 to 64 Years | 38 (14.2%) | 53 (21.7%) |
| 65 to 74 Years | 29 (36.7%) | 12 (21.0%) |
| 75 Years and over | 33 (70.2%) | 36 (53.7%) |
Disability Class by Sex by Age in Nashua
Disability Class: Hearing Difficulty
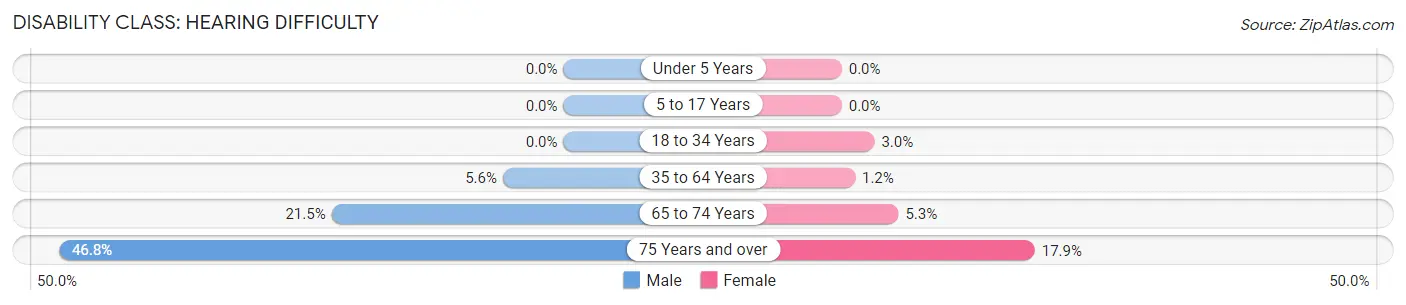
| Age Bracket | Male | Female |
| Under 5 Years | 0 (0.0%) | 0 (0.0%) |
| 5 to 17 Years | 0 (0.0%) | 0 (0.0%) |
| 18 to 34 Years | 0 (0.0%) | 5 (3.0%) |
| 35 to 64 Years | 15 (5.6%) | 3 (1.2%) |
| 65 to 74 Years | 17 (21.5%) | 3 (5.3%) |
| 75 Years and over | 22 (46.8%) | 12 (17.9%) |
Disability Class: Vision Difficulty
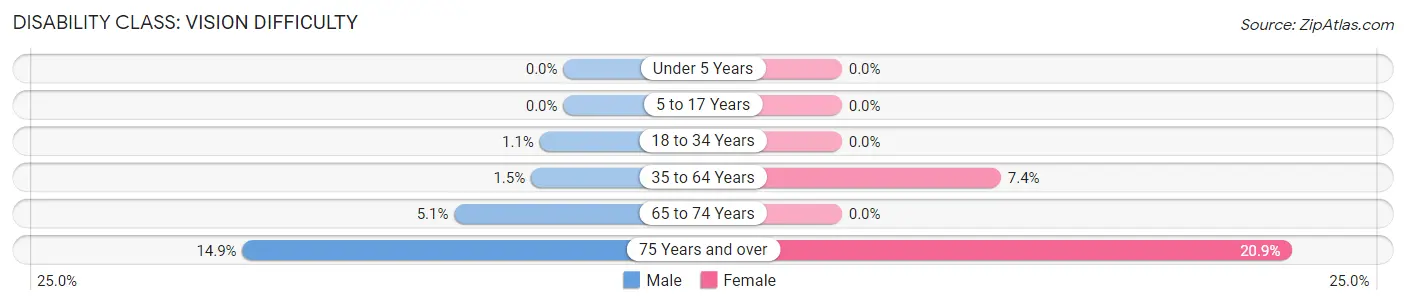
| Age Bracket | Male | Female |
| Under 5 Years | 0 (0.0%) | 0 (0.0%) |
| 5 to 17 Years | 0 (0.0%) | 0 (0.0%) |
| 18 to 34 Years | 2 (1.1%) | 0 (0.0%) |
| 35 to 64 Years | 4 (1.5%) | 18 (7.4%) |
| 65 to 74 Years | 4 (5.1%) | 0 (0.0%) |
| 75 Years and over | 7 (14.9%) | 14 (20.9%) |
Disability Class: Cognitive Difficulty
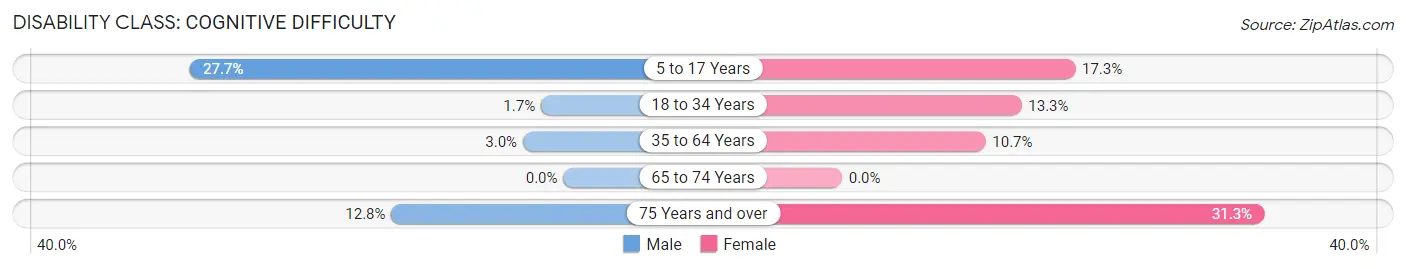
| Age Bracket | Male | Female |
| 5 to 17 Years | 46 (27.7%) | 22 (17.3%) |
| 18 to 34 Years | 3 (1.7%) | 22 (13.3%) |
| 35 to 64 Years | 8 (3.0%) | 26 (10.7%) |
| 65 to 74 Years | 0 (0.0%) | 0 (0.0%) |
| 75 Years and over | 6 (12.8%) | 21 (31.3%) |
Disability Class: Ambulatory Difficulty
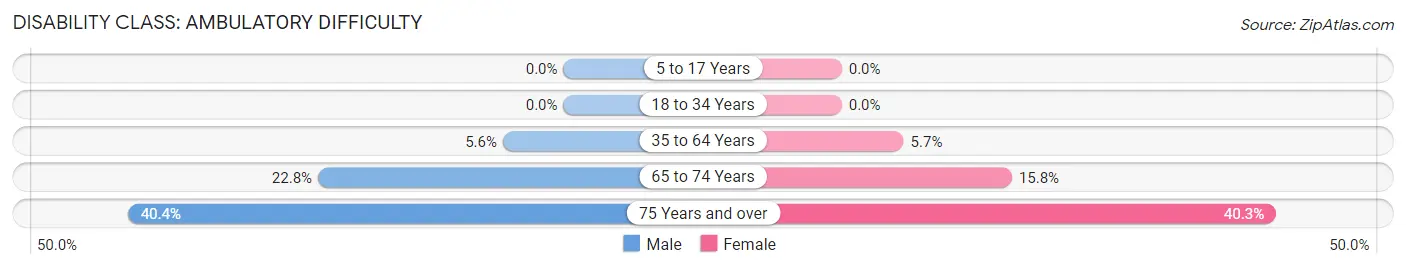
| Age Bracket | Male | Female |
| 5 to 17 Years | 0 (0.0%) | 0 (0.0%) |
| 18 to 34 Years | 0 (0.0%) | 0 (0.0%) |
| 35 to 64 Years | 15 (5.6%) | 14 (5.7%) |
| 65 to 74 Years | 18 (22.8%) | 9 (15.8%) |
| 75 Years and over | 19 (40.4%) | 27 (40.3%) |
Disability Class: Self-Care Difficulty
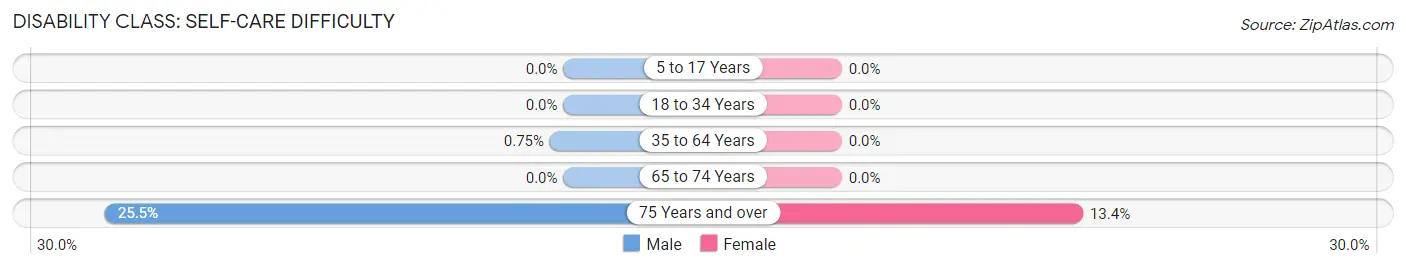
| Age Bracket | Male | Female |
| 5 to 17 Years | 0 (0.0%) | 0 (0.0%) |
| 18 to 34 Years | 0 (0.0%) | 0 (0.0%) |
| 35 to 64 Years | 2 (0.7%) | 0 (0.0%) |
| 65 to 74 Years | 0 (0.0%) | 0 (0.0%) |
| 75 Years and over | 12 (25.5%) | 9 (13.4%) |
Technology Access in Nashua
Computing Device Access in Nashua
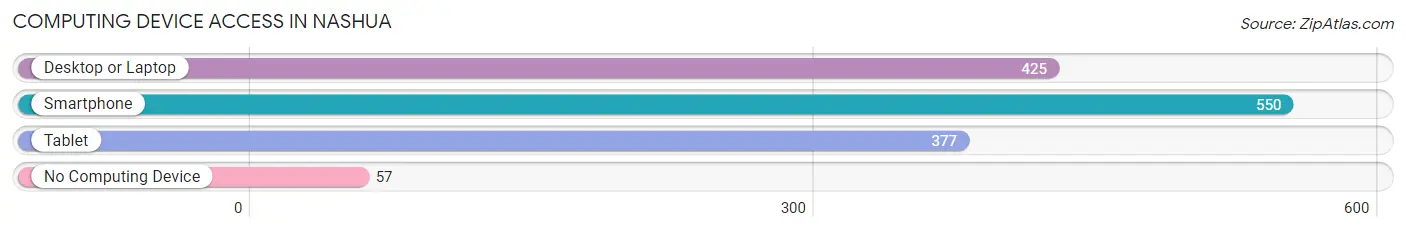
| Device Type | # Households | % Households |
| Desktop or Laptop | 425 | 65.8% |
| Smartphone | 550 | 85.1% |
| Tablet | 377 | 58.4% |
| No Computing Device | 57 | 8.8% |
| Total | 646 | 100.0% |
Internet Access in Nashua
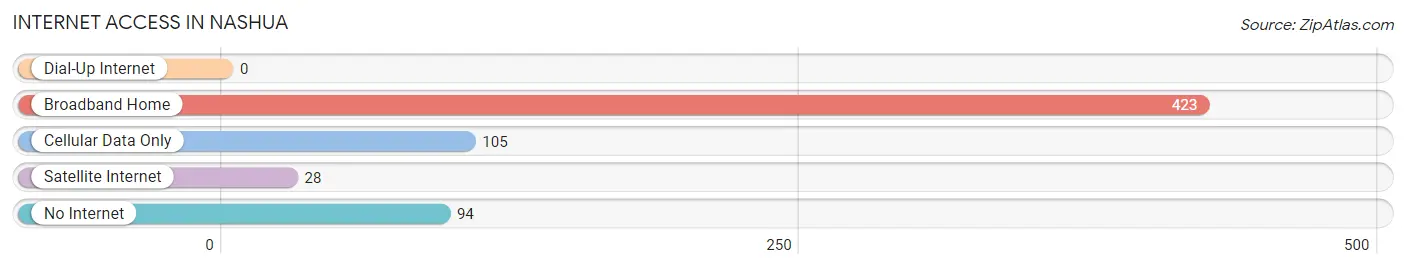
| Internet Type | # Households | % Households |
| Dial-Up Internet | 0 | 0.0% |
| Broadband Home | 423 | 65.5% |
| Cellular Data Only | 105 | 16.3% |
| Satellite Internet | 28 | 4.3% |
| No Internet | 94 | 14.5% |
| Total | 646 | 100.0% |
Nashua Summary
Nashua, Iowa is a small city located in Chickasaw County, Iowa. It is situated on the Cedar River, and is part of the Waterloo-Cedar Falls Metropolitan Statistical Area. The city has a population of approximately 3,000 people, and is the county seat of Chickasaw County.
History
Nashua was founded in 1854 by a group of settlers from New Hampshire. The city was named after the city of Nashua, New Hampshire, and was originally known as “New Nashua”. The city was incorporated in 1858, and the first post office was established in 1859.
In the late 19th century, Nashua was a thriving agricultural community. The city was home to several grain elevators, a creamery, a flour mill, and a lumber yard. The city also had a number of churches, schools, and businesses.
In the early 20th century, Nashua experienced a period of growth and prosperity. The city was home to several manufacturing companies, including a furniture factory, a canning factory, and a brickyard. The city also had a number of banks, a movie theater, and a number of other businesses.
Geography
Nashua is located in the northeast corner of Iowa, in Chickasaw County. The city is situated on the Cedar River, and is part of the Waterloo-Cedar Falls Metropolitan Statistical Area. The city has a total area of 2.2 square miles, all of which is land.
The city is located in a predominantly rural area, and is surrounded by farmland. The nearest major city is Waterloo, which is located approximately 25 miles to the south.
Economy
Nashua’s economy is largely based on agriculture and manufacturing. The city is home to several grain elevators, a creamery, a flour mill, and a lumber yard. The city also has a number of banks, a movie theater, and a number of other businesses.
The city is also home to several manufacturing companies, including a furniture factory, a canning factory, and a brickyard. The city also has a number of churches, schools, and other businesses.
Demographics
As of the 2010 census, Nashua had a population of 3,000 people. The racial makeup of the city was 97.3% White, 0.7% African American, 0.3% Native American, 0.3% Asian, 0.3% from other races, and 1.3% from two or more races. Hispanic or Latino of any race were 1.3% of the population.
The median income for a household in the city was $41,250, and the median income for a family was $50,000. The per capita income for the city was $19,845. About 8.3% of families and 10.3% of the population were below the poverty line, including 14.3% of those under age 18 and 8.3% of those age 65 or over.
Common Questions
What is Per Capita Income in Nashua?
Per Capita income in Nashua is $31,857.
What is the Median Family Income in Nashua?
Median Family Income in Nashua is $83,250.
What is the Median Household income in Nashua?
Median Household Income in Nashua is $60,000.
What is Income or Wage Gap in Nashua?
Income or Wage Gap in Nashua is 27.6%.
Women in Nashua earn 72.4 cents for every dollar earned by a man.
What is Inequality or Gini Index in Nashua?
Inequality or Gini Index in Nashua is 0.38.
What is the Total Population of Nashua?
Total Population of Nashua is 1,472.
What is the Total Male Population of Nashua?
Total Male Population of Nashua is 778.
What is the Total Female Population of Nashua?
Total Female Population of Nashua is 694.
What is the Ratio of Males per 100 Females in Nashua?
There are 112.10 Males per 100 Females in Nashua.
What is the Ratio of Females per 100 Males in Nashua?
There are 89.20 Females per 100 Males in Nashua.
What is the Median Population Age in Nashua?
Median Population Age in Nashua is 35.9 Years.
What is the Average Family Size in Nashua
Average Family Size in Nashua is 2.9 People.
What is the Average Household Size in Nashua
Average Household Size in Nashua is 2.3 People.
How Large is the Labor Force in Nashua?
There are 848 People in the Labor Forcein in Nashua.
What is the Percentage of People in the Labor Force in Nashua?
75.3% of People are in the Labor Force in Nashua.
What is the Unemployment Rate in Nashua?
Unemployment Rate in Nashua is 1.2%.