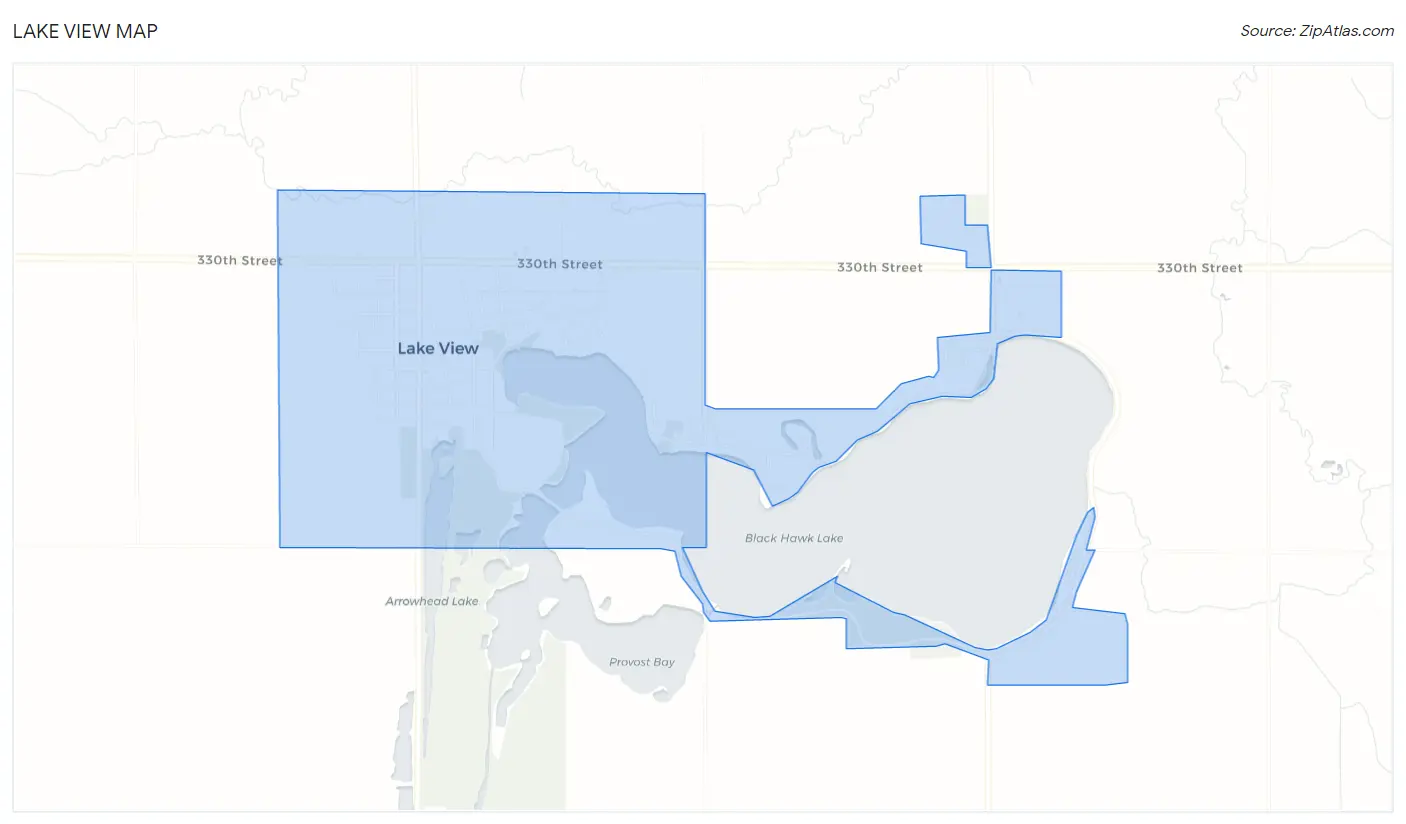
Lake View, IA Map & Demographics
Lake View Map
Lake View Overview
$45,253
PER CAPITA INCOME
$86,250
AVG FAMILY INCOME
$63,472
AVG HOUSEHOLD INCOME
21.8%
WAGE / INCOME GAP [ % ]
78.2¢/ $1
WAGE / INCOME GAP [ $ ]
0.49
INEQUALITY / GINI INDEX
920
TOTAL POPULATION
424
MALE POPULATION
496
FEMALE POPULATION
85.48
MALES / 100 FEMALES
116.98
FEMALES / 100 MALES
57.8
MEDIAN AGE
2.3
AVG FAMILY SIZE
1.9
AVG HOUSEHOLD SIZE
453
LABOR FORCE [ PEOPLE ]
55.8%
PERCENT IN LABOR FORCE
1.5%
UNEMPLOYMENT RATE
Lake View Zip Codes
Lake View Area Codes
Income in Lake View
Income Overview in Lake View
Per Capita Income in Lake View is $45,253, while median incomes of families and households are $86,250 and $63,472 respectively.
| Characteristic | Number | Measure |
| Per Capita Income | 920 | $45,253 |
| Median Family Income | 292 | $86,250 |
| Mean Family Income | 292 | $99,914 |
| Median Household Income | 461 | $63,472 |
| Mean Household Income | 461 | $86,141 |
| Income Deficit | 292 | $0 |
| Wage / Income Gap (%) | 920 | 21.81% |
| Wage / Income Gap ($) | 920 | 78.19¢ per $1 |
| Gini / Inequality Index | 920 | 0.49 |
Earnings by Sex in Lake View
Average Earnings in Lake View are $43,125, $49,028 for men and $38,333 for women, a difference of 21.8%.
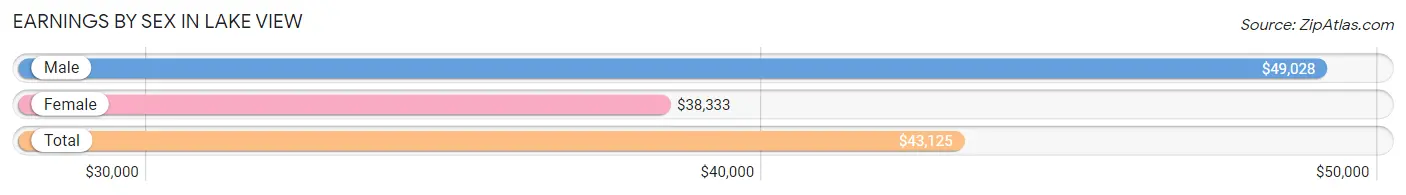
| Sex | Number | Average Earnings |
| Male | 249 (51.1%) | $49,028 |
| Female | 238 (48.9%) | $38,333 |
| Total | 487 (100.0%) | $43,125 |
Earnings by Sex by Income Bracket in Lake View
The most common earnings brackets in Lake View are $75,000 to $99,999 for men (37 | 14.9%) and $75,000 to $99,999 for women (31 | 13.0%).
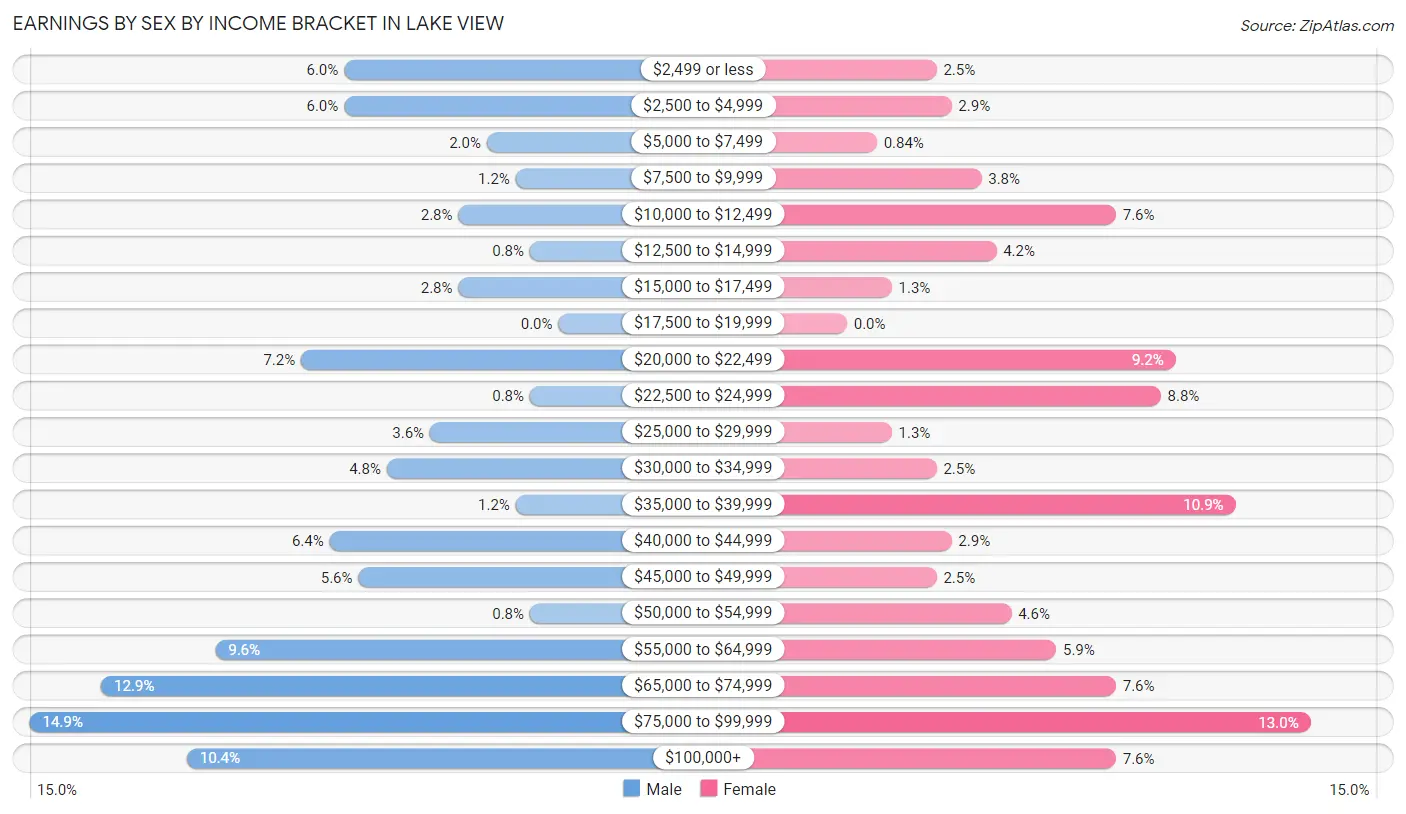
| Income | Male | Female |
| $2,499 or less | 15 (6.0%) | 6 (2.5%) |
| $2,500 to $4,999 | 15 (6.0%) | 7 (2.9%) |
| $5,000 to $7,499 | 5 (2.0%) | 2 (0.8%) |
| $7,500 to $9,999 | 3 (1.2%) | 9 (3.8%) |
| $10,000 to $12,499 | 7 (2.8%) | 18 (7.6%) |
| $12,500 to $14,999 | 2 (0.8%) | 10 (4.2%) |
| $15,000 to $17,499 | 7 (2.8%) | 3 (1.3%) |
| $17,500 to $19,999 | 0 (0.0%) | 0 (0.0%) |
| $20,000 to $22,499 | 18 (7.2%) | 22 (9.2%) |
| $22,500 to $24,999 | 2 (0.8%) | 21 (8.8%) |
| $25,000 to $29,999 | 9 (3.6%) | 3 (1.3%) |
| $30,000 to $34,999 | 12 (4.8%) | 6 (2.5%) |
| $35,000 to $39,999 | 3 (1.2%) | 26 (10.9%) |
| $40,000 to $44,999 | 16 (6.4%) | 7 (2.9%) |
| $45,000 to $49,999 | 14 (5.6%) | 6 (2.5%) |
| $50,000 to $54,999 | 2 (0.8%) | 11 (4.6%) |
| $55,000 to $64,999 | 24 (9.6%) | 14 (5.9%) |
| $65,000 to $74,999 | 32 (12.9%) | 18 (7.6%) |
| $75,000 to $99,999 | 37 (14.9%) | 31 (13.0%) |
| $100,000+ | 26 (10.4%) | 18 (7.6%) |
| Total | 249 (100.0%) | 238 (100.0%) |
Earnings by Sex by Educational Attainment in Lake View
Average earnings in Lake View are $55,417 for men and $42,500 for women, a difference of 23.3%. Men with an educational attainment of graduate degree enjoy the highest average annual earnings of $112,604, while those with college or associate's degree education earn the least with $40,208. Women with an educational attainment of graduate degree earn the most with the average annual earnings of $76,250, while those with high school diploma education have the smallest earnings of $30,000.
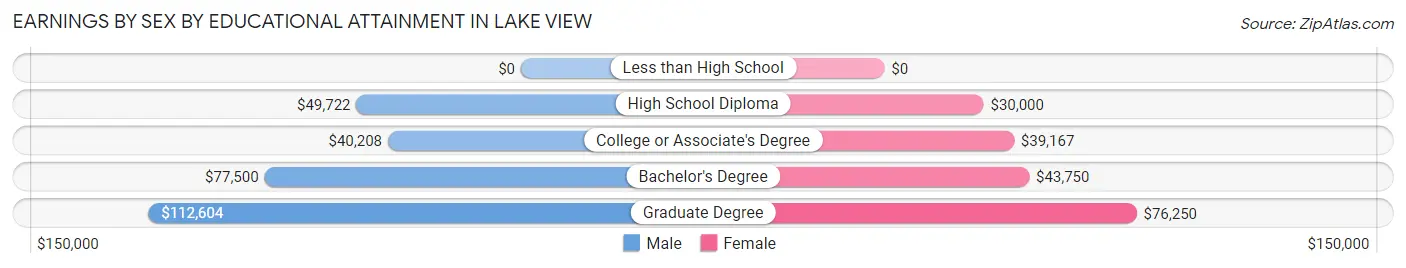
| Educational Attainment | Male Income | Female Income |
| Less than High School | - | - |
| High School Diploma | $49,722 | $30,000 |
| College or Associate's Degree | $40,208 | $39,167 |
| Bachelor's Degree | $77,500 | $43,750 |
| Graduate Degree | $112,604 | $76,250 |
| Total | $55,417 | $42,500 |
Family Income in Lake View
Family Income Brackets in Lake View
According to the Lake View family income data, there are 85 families falling into the $100,000 to $149,999 income range, which is the most common income bracket and makes up 29.1% of all families.
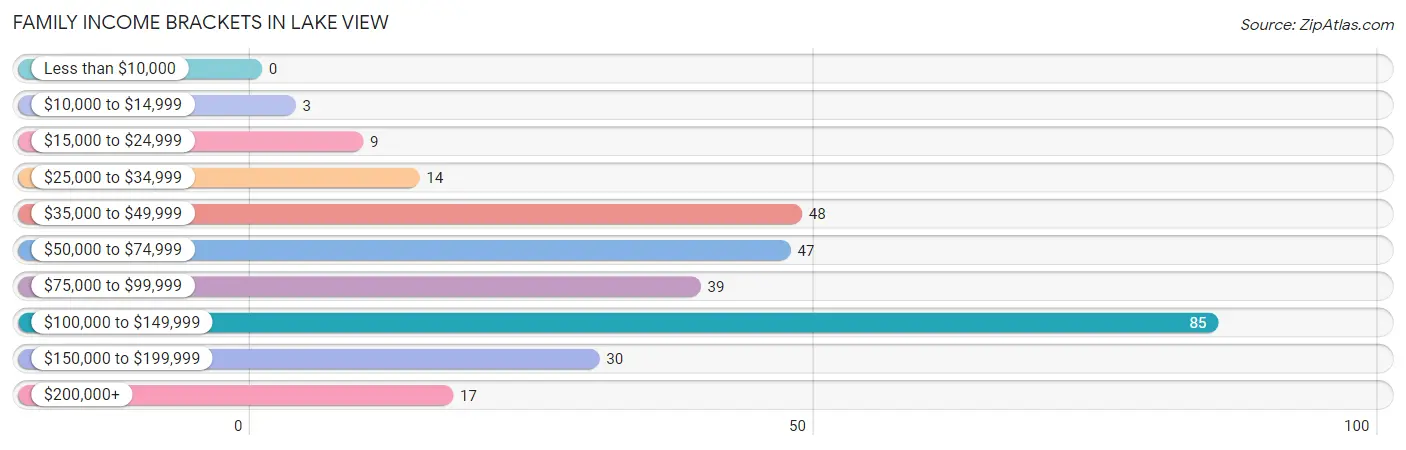
| Income Bracket | # Families | % Families |
| Less than $10,000 | 0 | 0.0% |
| $10,000 to $14,999 | 3 | 1.0% |
| $15,000 to $24,999 | 9 | 3.1% |
| $25,000 to $34,999 | 14 | 4.8% |
| $35,000 to $49,999 | 48 | 16.4% |
| $50,000 to $74,999 | 47 | 16.1% |
| $75,000 to $99,999 | 39 | 13.4% |
| $100,000 to $149,999 | 85 | 29.1% |
| $150,000 to $199,999 | 30 | 10.3% |
| $200,000+ | 17 | 5.8% |
Family Income by Famaliy Size in Lake View
4-person families (26 | 8.9%) account for the highest median family income in Lake View with $134,167 per family, while 2-person families (231 | 79.1%) have the highest median income of $39,653 per family member.
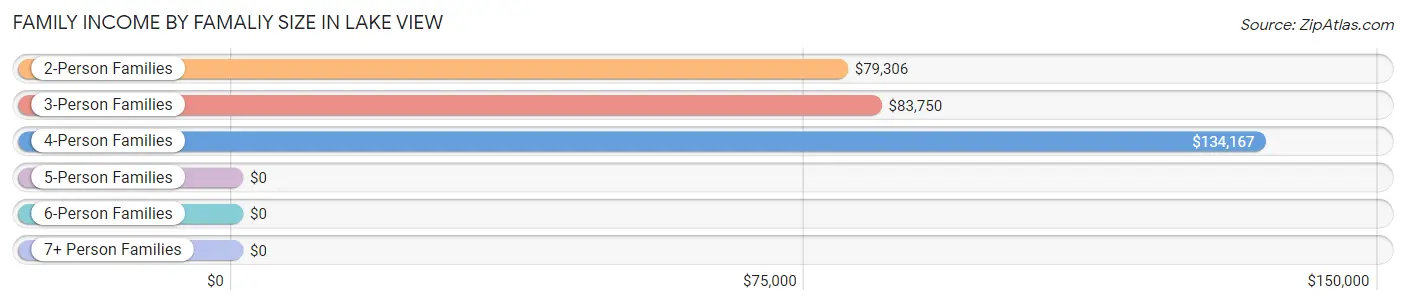
| Income Bracket | # Families | Median Income |
| 2-Person Families | 231 (79.1%) | $79,306 |
| 3-Person Families | 32 (11.0%) | $83,750 |
| 4-Person Families | 26 (8.9%) | $134,167 |
| 5-Person Families | 0 (0.0%) | $0 |
| 6-Person Families | 3 (1.0%) | $0 |
| 7+ Person Families | 0 (0.0%) | $0 |
| Total | 292 (100.0%) | $86,250 |
Family Income by Number of Earners in Lake View
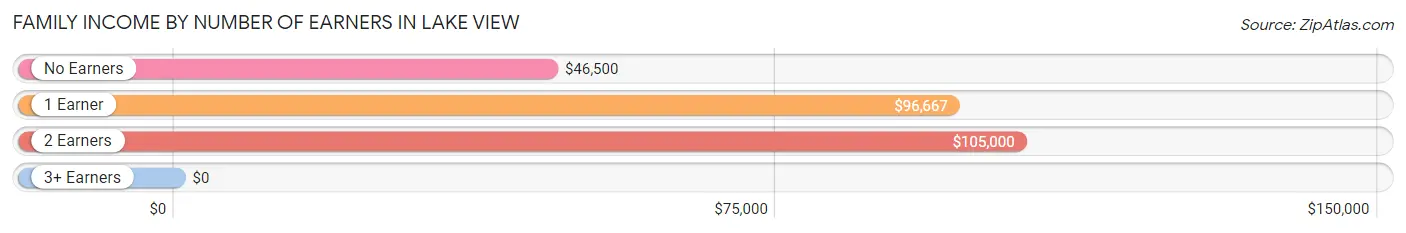
| Number of Earners | # Families | Median Income |
| No Earners | 66 (22.6%) | $46,500 |
| 1 Earner | 56 (19.2%) | $96,667 |
| 2 Earners | 166 (56.9%) | $105,000 |
| 3+ Earners | 4 (1.4%) | $0 |
| Total | 292 (100.0%) | $86,250 |
Household Income in Lake View
Household Income Brackets in Lake View
With 101 households falling in the category, the $100,000 to $149,999 income range is the most frequent in Lake View, accounting for 21.9% of all households. In contrast, only 14 households (3.0%) fall into the less than $10,000 income bracket, making it the least populous group.
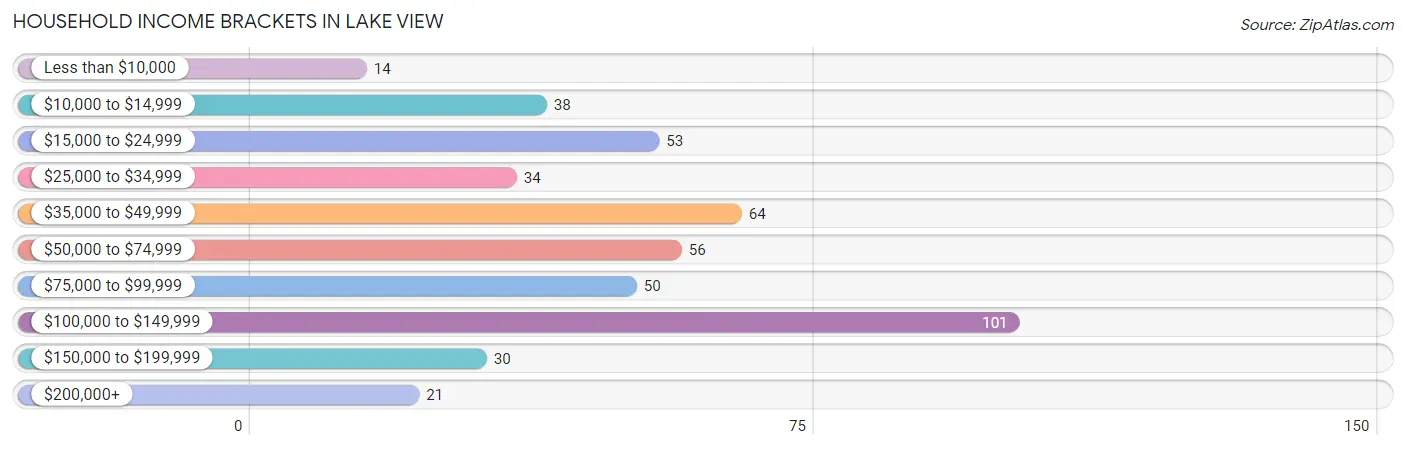
| Income Bracket | # Households | % Households |
| Less than $10,000 | 14 | 3.0% |
| $10,000 to $14,999 | 38 | 8.2% |
| $15,000 to $24,999 | 53 | 11.5% |
| $25,000 to $34,999 | 34 | 7.4% |
| $35,000 to $49,999 | 64 | 13.9% |
| $50,000 to $74,999 | 56 | 12.1% |
| $75,000 to $99,999 | 50 | 10.8% |
| $100,000 to $149,999 | 101 | 21.9% |
| $150,000 to $199,999 | 30 | 6.5% |
| $200,000+ | 21 | 4.6% |
Household Income by Householder Age in Lake View
The median household income in Lake View is $63,472, with the highest median household income of $108,571 found in the 25 to 44 years age bracket for the primary householder. A total of 80 households (17.3%) fall into this category. Meanwhile, the 15 to 24 years age bracket for the primary householder has the lowest median household income of $28,250, with 17 households (3.7%) in this group.
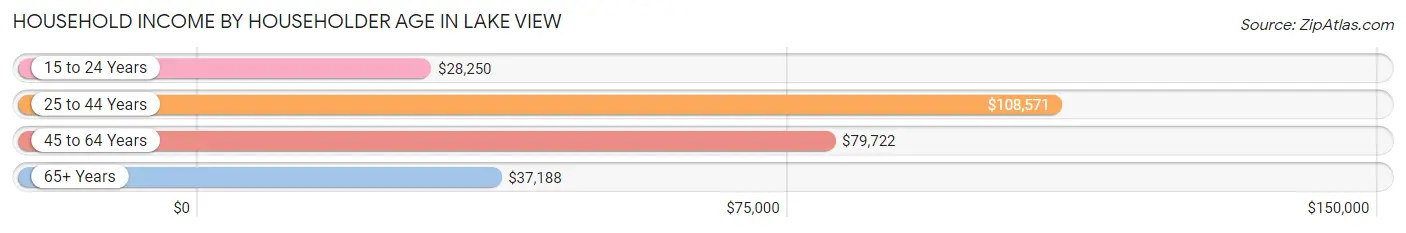
| Income Bracket | # Households | Median Income |
| 15 to 24 Years | 17 (3.7%) | $28,250 |
| 25 to 44 Years | 80 (17.3%) | $108,571 |
| 45 to 64 Years | 142 (30.8%) | $79,722 |
| 65+ Years | 222 (48.2%) | $37,188 |
| Total | 461 (100.0%) | $63,472 |
Poverty in Lake View
Income Below Poverty by Sex and Age in Lake View
With 1.2% poverty level for males and 14.6% for females among the residents of Lake View, 55 to 64 year old males and 12 to 14 year old females are the most vulnerable to poverty, with 3 males (4.5%) and 3 females (33.3%) in their respective age groups living below the poverty level.
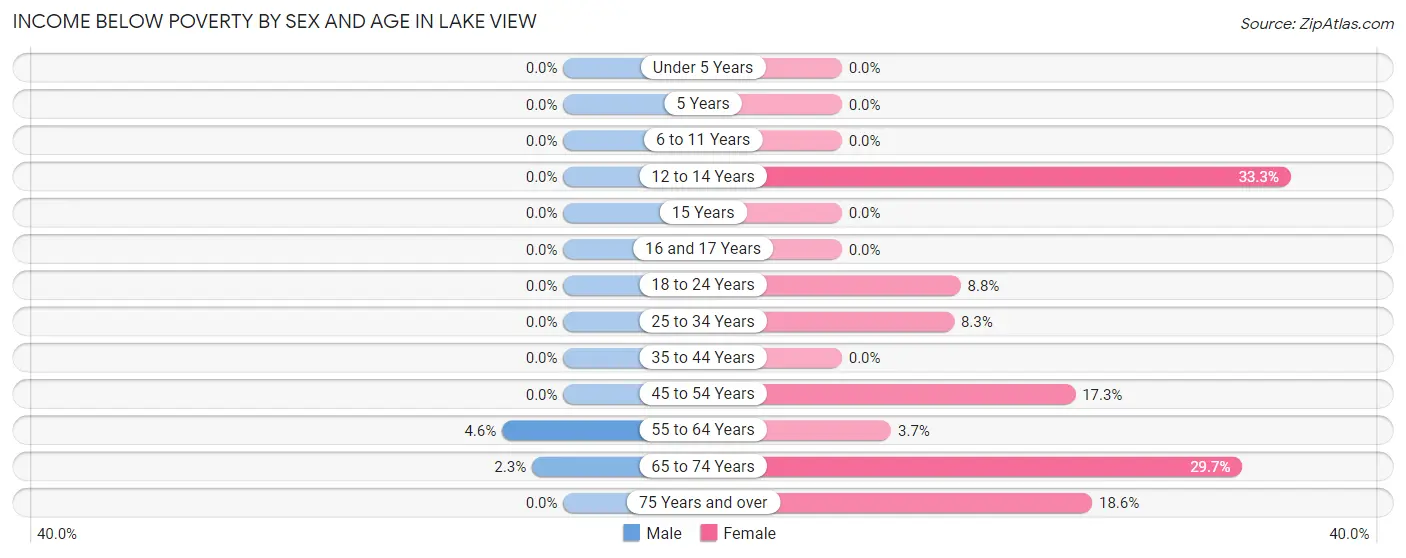
| Age Bracket | Male | Female |
| Under 5 Years | 0 (0.0%) | 0 (0.0%) |
| 5 Years | 0 (0.0%) | 0 (0.0%) |
| 6 to 11 Years | 0 (0.0%) | 0 (0.0%) |
| 12 to 14 Years | 0 (0.0%) | 3 (33.3%) |
| 15 Years | 0 (0.0%) | 0 (0.0%) |
| 16 and 17 Years | 0 (0.0%) | 0 (0.0%) |
| 18 to 24 Years | 0 (0.0%) | 3 (8.8%) |
| 25 to 34 Years | 0 (0.0%) | 3 (8.3%) |
| 35 to 44 Years | 0 (0.0%) | 0 (0.0%) |
| 45 to 54 Years | 0 (0.0%) | 13 (17.3%) |
| 55 to 64 Years | 3 (4.5%) | 3 (3.7%) |
| 65 to 74 Years | 2 (2.3%) | 22 (29.7%) |
| 75 Years and over | 0 (0.0%) | 21 (18.6%) |
| Total | 5 (1.2%) | 68 (14.6%) |
Income Above Poverty by Sex and Age in Lake View
According to the poverty statistics in Lake View, males aged under 5 years and females aged under 5 years are the age groups that are most secure financially, with 100.0% of males and 100.0% of females in these age groups living above the poverty line.
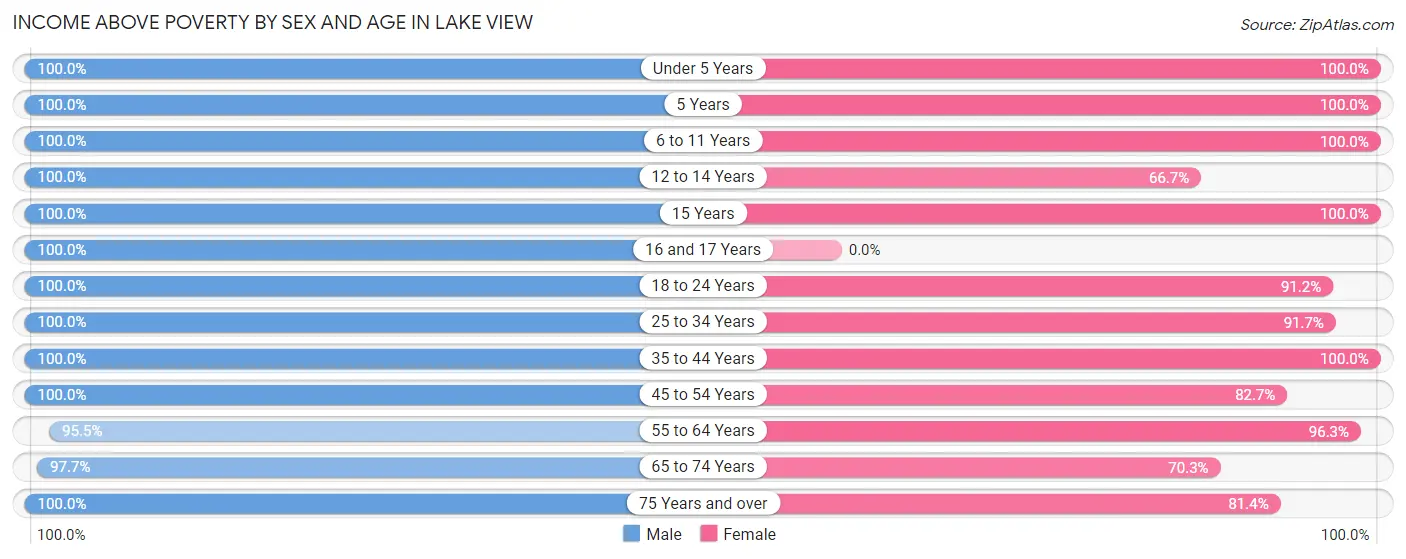
| Age Bracket | Male | Female |
| Under 5 Years | 13 (100.0%) | 10 (100.0%) |
| 5 Years | 21 (100.0%) | 2 (100.0%) |
| 6 to 11 Years | 19 (100.0%) | 3 (100.0%) |
| 12 to 14 Years | 8 (100.0%) | 6 (66.7%) |
| 15 Years | 14 (100.0%) | 5 (100.0%) |
| 16 and 17 Years | 7 (100.0%) | 0 (0.0%) |
| 18 to 24 Years | 10 (100.0%) | 31 (91.2%) |
| 25 to 34 Years | 41 (100.0%) | 33 (91.7%) |
| 35 to 44 Years | 37 (100.0%) | 24 (100.0%) |
| 45 to 54 Years | 43 (100.0%) | 62 (82.7%) |
| 55 to 64 Years | 63 (95.5%) | 79 (96.3%) |
| 65 to 74 Years | 84 (97.7%) | 52 (70.3%) |
| 75 Years and over | 48 (100.0%) | 92 (81.4%) |
| Total | 408 (98.8%) | 399 (85.4%) |
Income Below Poverty Among Married-Couple Families in Lake View
The poverty statistics for married-couple families in Lake View show that 0.8% or 2 of the total 254 families live below the poverty line. Families with no children have the highest poverty rate of 1.0%, comprising of 2 families. On the other hand, families with 1 or 2 children have the lowest poverty rate of 0.0%, which includes 0 families.
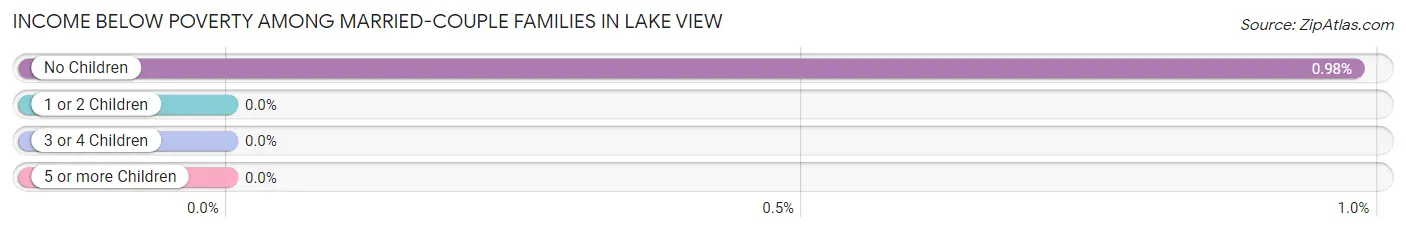
| Children | Above Poverty | Below Poverty |
| No Children | 203 (99.0%) | 2 (1.0%) |
| 1 or 2 Children | 46 (100.0%) | 0 (0.0%) |
| 3 or 4 Children | 3 (100.0%) | 0 (0.0%) |
| 5 or more Children | 0 (0.0%) | 0 (0.0%) |
| Total | 252 (99.2%) | 2 (0.8%) |
Income Below Poverty Among Single-Parent Households in Lake View
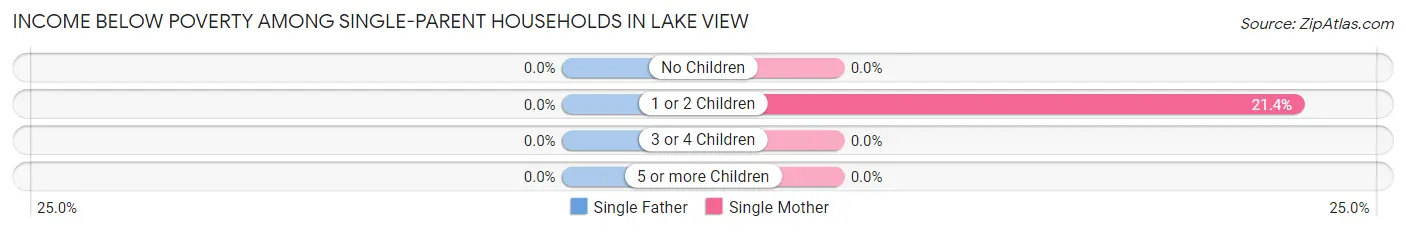
| Children | Single Father | Single Mother |
| No Children | 0 (0.0%) | 0 (0.0%) |
| 1 or 2 Children | 0 (0.0%) | 3 (21.4%) |
| 3 or 4 Children | 0 (0.0%) | 0 (0.0%) |
| 5 or more Children | 0 (0.0%) | 0 (0.0%) |
| Total | 0 (0.0%) | 3 (12.0%) |
Income Below Poverty Among Married-Couple vs Single-Parent Households in Lake View
The poverty data for Lake View shows that 2 of the married-couple family households (0.8%) and 3 of the single-parent households (7.9%) are living below the poverty level. Within the married-couple family households, those with no children have the highest poverty rate, with 2 households (1.0%) falling below the poverty line. Among the single-parent households, those with 1 or 2 children have the highest poverty rate, with 3 household (17.6%) living below poverty.
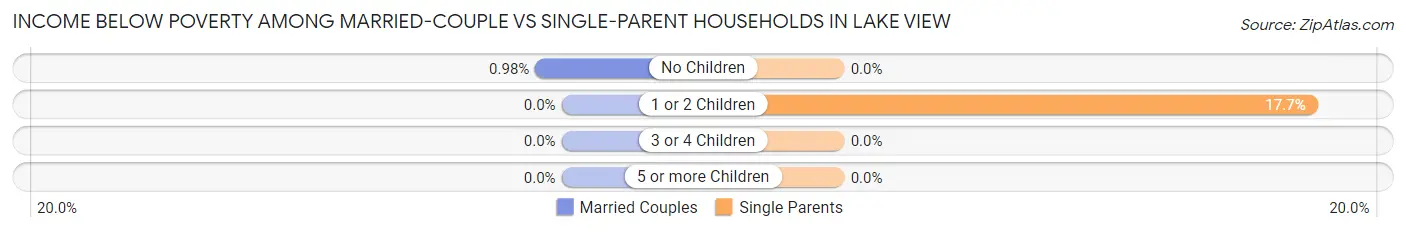
| Children | Married-Couple Families | Single-Parent Households |
| No Children | 2 (1.0%) | 0 (0.0%) |
| 1 or 2 Children | 0 (0.0%) | 3 (17.6%) |
| 3 or 4 Children | 0 (0.0%) | 0 (0.0%) |
| 5 or more Children | 0 (0.0%) | 0 (0.0%) |
| Total | 2 (0.8%) | 3 (7.9%) |
Race in Lake View
The most populous races in Lake View are White / Caucasian (905 | 98.4%), and Two or more Races (15 | 1.6%).
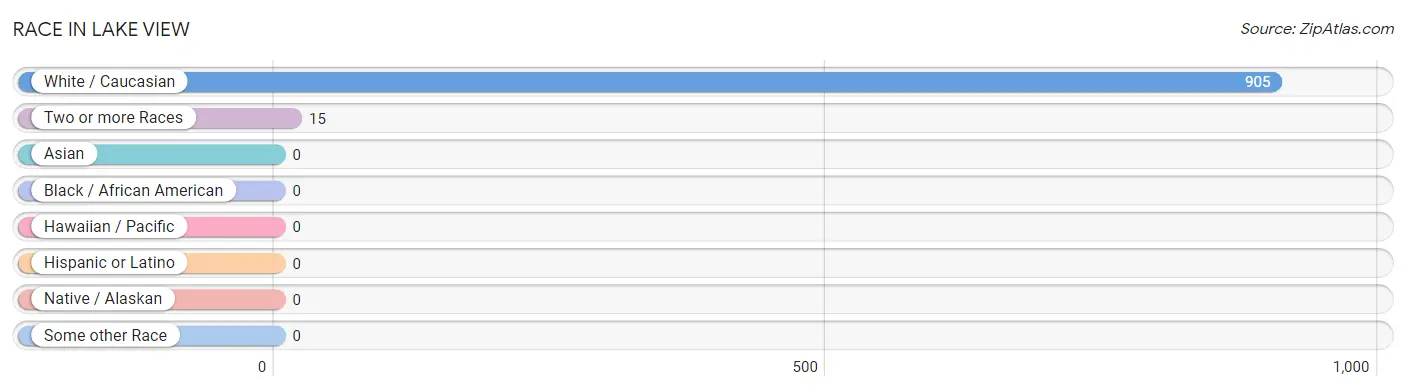
| Race | # Population | % Population |
| Asian | 0 | 0.0% |
| Black / African American | 0 | 0.0% |
| Hawaiian / Pacific | 0 | 0.0% |
| Hispanic or Latino | 0 | 0.0% |
| Native / Alaskan | 0 | 0.0% |
| White / Caucasian | 905 | 98.4% |
| Two or more Races | 15 | 1.6% |
| Some other Race | 0 | 0.0% |
| Total | 920 | 100.0% |
Ancestry in Lake View
The most populous ancestries reported in Lake View are German (535 | 58.2%), Irish (123 | 13.4%), English (93 | 10.1%), Swedish (40 | 4.3%), and American (28 | 3.0%), together accounting for 89.0% of all Lake View residents.
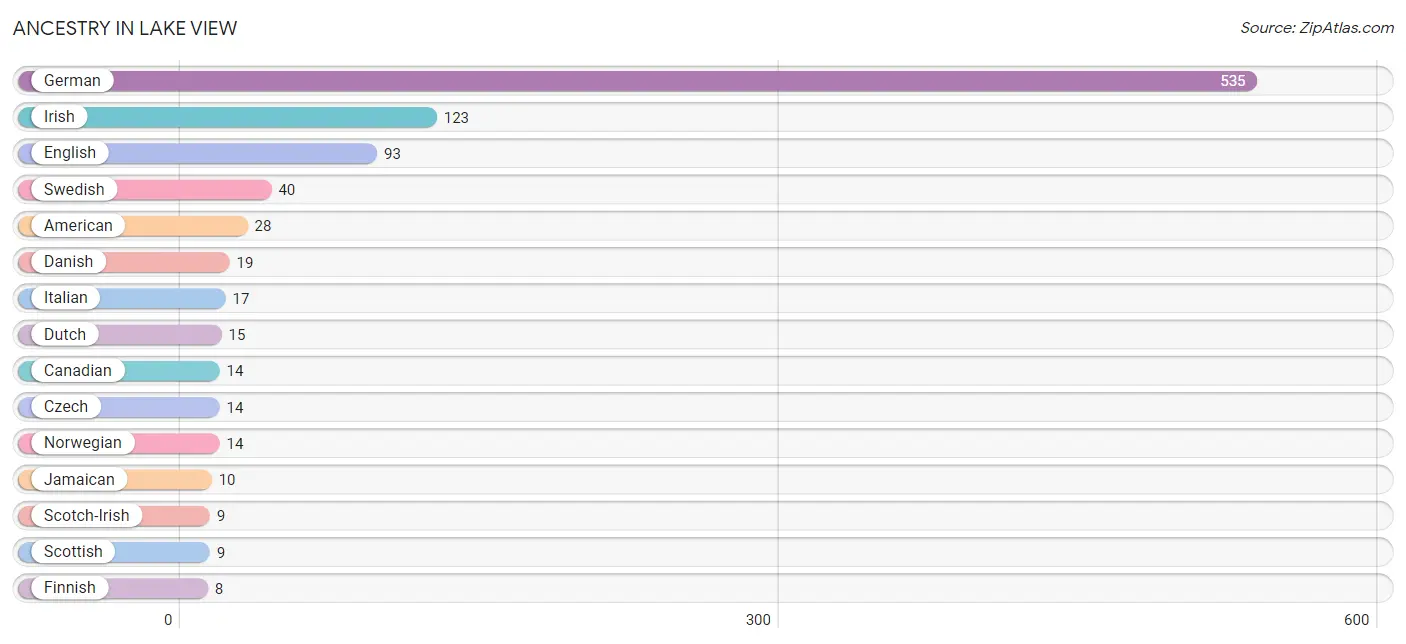
| Ancestry | # Population | % Population |
| American | 28 | 3.0% |
| Canadian | 14 | 1.5% |
| Czech | 14 | 1.5% |
| Czechoslovakian | 3 | 0.3% |
| Danish | 19 | 2.1% |
| Dutch | 15 | 1.6% |
| English | 93 | 10.1% |
| European | 5 | 0.5% |
| Finnish | 8 | 0.9% |
| French | 3 | 0.3% |
| French Canadian | 2 | 0.2% |
| German | 535 | 58.2% |
| Irish | 123 | 13.4% |
| Italian | 17 | 1.8% |
| Jamaican | 10 | 1.1% |
| Luxembourger | 1 | 0.1% |
| Norwegian | 14 | 1.5% |
| Scandinavian | 8 | 0.9% |
| Scotch-Irish | 9 | 1.0% |
| Scottish | 9 | 1.0% |
| Swedish | 40 | 4.3% |
| Welsh | 3 | 0.3% | View All 22 Rows |
Immigrants in Lake View
The most numerous immigrant groups reported in Lake View came from Europe (3 | 0.3%), Netherlands (3 | 0.3%), and Western Europe (3 | 0.3%), together accounting for 1.0% of all Lake View residents.
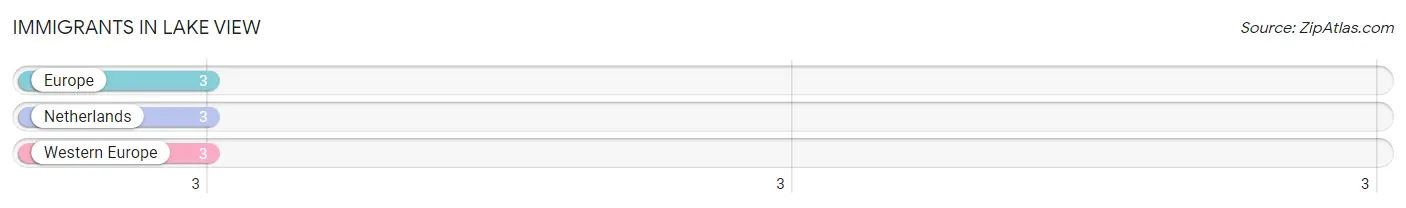
| Immigration Origin | # Population | % Population |
| Europe | 3 | 0.3% |
| Netherlands | 3 | 0.3% |
| Western Europe | 3 | 0.3% | View All 3 Rows |
Sex and Age in Lake View
Sex and Age in Lake View
The most populous age groups in Lake View are 65 to 69 Years (48 | 11.3%) for men and 85 Years and over (68 | 13.7%) for women.
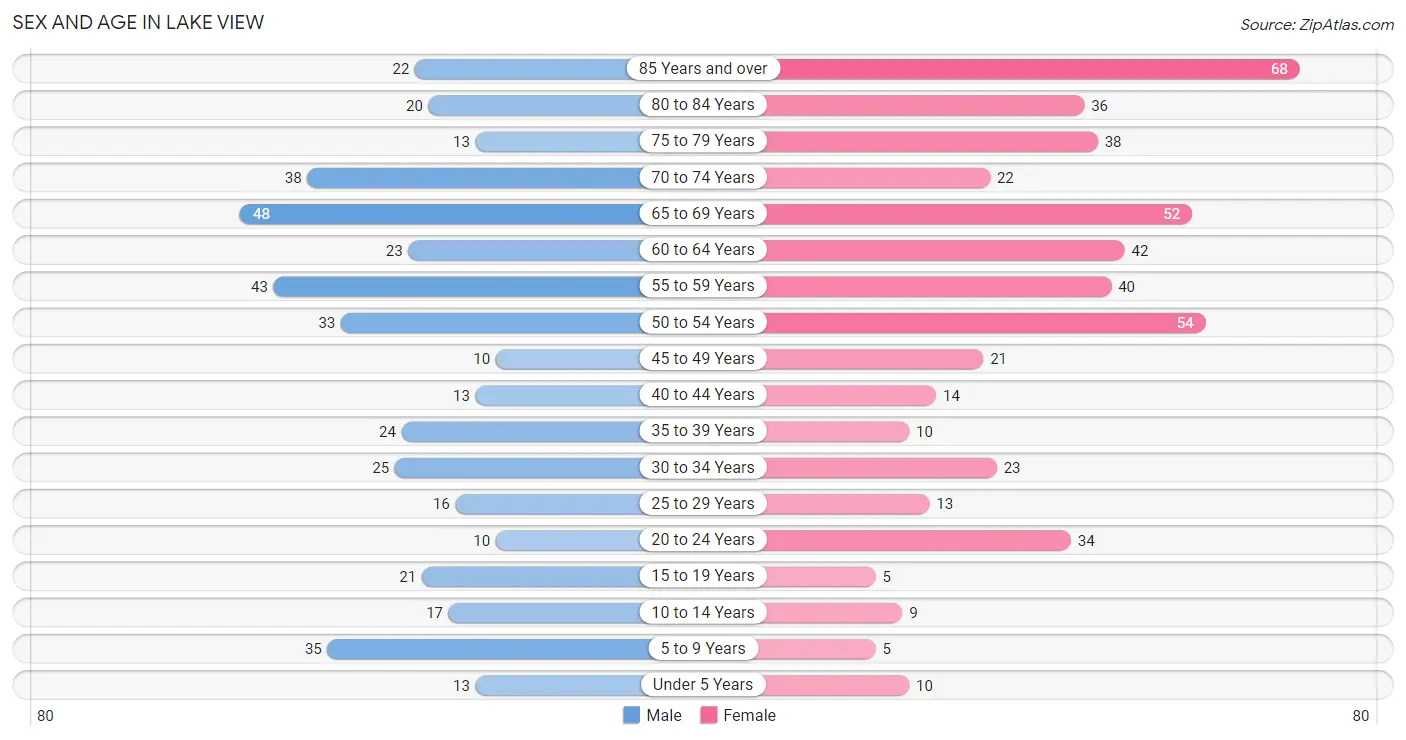
| Age Bracket | Male | Female |
| Under 5 Years | 13 (3.1%) | 10 (2.0%) |
| 5 to 9 Years | 35 (8.3%) | 5 (1.0%) |
| 10 to 14 Years | 17 (4.0%) | 9 (1.8%) |
| 15 to 19 Years | 21 (5.0%) | 5 (1.0%) |
| 20 to 24 Years | 10 (2.4%) | 34 (6.9%) |
| 25 to 29 Years | 16 (3.8%) | 13 (2.6%) |
| 30 to 34 Years | 25 (5.9%) | 23 (4.6%) |
| 35 to 39 Years | 24 (5.7%) | 10 (2.0%) |
| 40 to 44 Years | 13 (3.1%) | 14 (2.8%) |
| 45 to 49 Years | 10 (2.4%) | 21 (4.2%) |
| 50 to 54 Years | 33 (7.8%) | 54 (10.9%) |
| 55 to 59 Years | 43 (10.1%) | 40 (8.1%) |
| 60 to 64 Years | 23 (5.4%) | 42 (8.5%) |
| 65 to 69 Years | 48 (11.3%) | 52 (10.5%) |
| 70 to 74 Years | 38 (9.0%) | 22 (4.4%) |
| 75 to 79 Years | 13 (3.1%) | 38 (7.7%) |
| 80 to 84 Years | 20 (4.7%) | 36 (7.3%) |
| 85 Years and over | 22 (5.2%) | 68 (13.7%) |
| Total | 424 (100.0%) | 496 (100.0%) |
Families and Households in Lake View
Median Family Size in Lake View
The median family size in Lake View is 2.33 persons per family, with single female/mother families (25 | 8.6%) accounting for the largest median family size of 2.48 persons per family. On the other hand, single male/father families (13 | 4.4%) represent the smallest median family size with 1.69 persons per family.
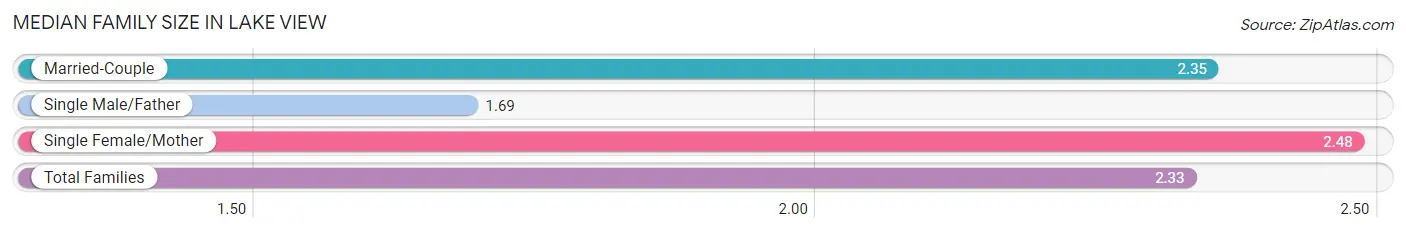
| Family Type | # Families | Family Size |
| Married-Couple | 254 (87.0%) | 2.35 |
| Single Male/Father | 13 (4.4%) | 1.69 |
| Single Female/Mother | 25 (8.6%) | 2.48 |
| Total Families | 292 (100.0%) | 2.33 |
Median Household Size in Lake View
The median household size in Lake View is 1.92 persons per household, with single female/mother households (25 | 5.4%) accounting for the largest median household size of 2.84 persons per household. non-family households (169 | 36.7%) represent the smallest median household size with 1.14 persons per household.
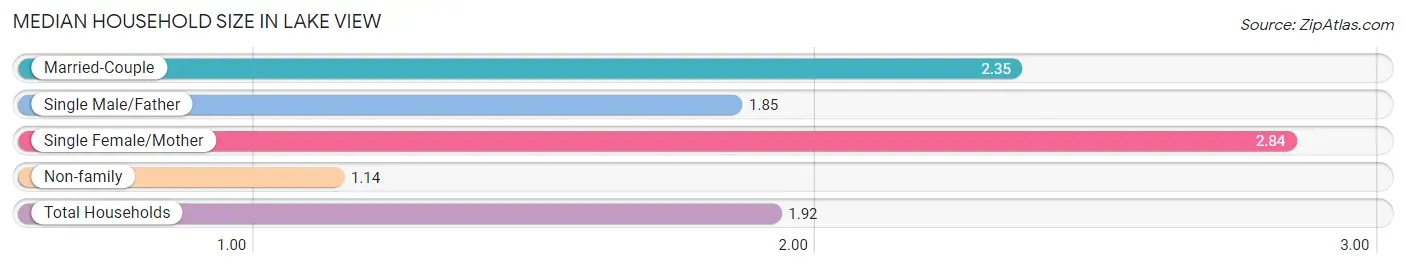
| Household Type | # Households | Household Size |
| Married-Couple | 254 (55.1%) | 2.35 |
| Single Male/Father | 13 (2.8%) | 1.85 |
| Single Female/Mother | 25 (5.4%) | 2.84 |
| Non-family | 169 (36.7%) | 1.14 |
| Total Households | 461 (100.0%) | 1.92 |
Household Size by Marriage Status in Lake View
Out of a total of 461 households in Lake View, 292 (63.3%) are family households, while 169 (36.7%) are nonfamily households. The most numerous type of family households are 2-person households, comprising 228, and the most common type of nonfamily households are 1-person households, comprising 156.
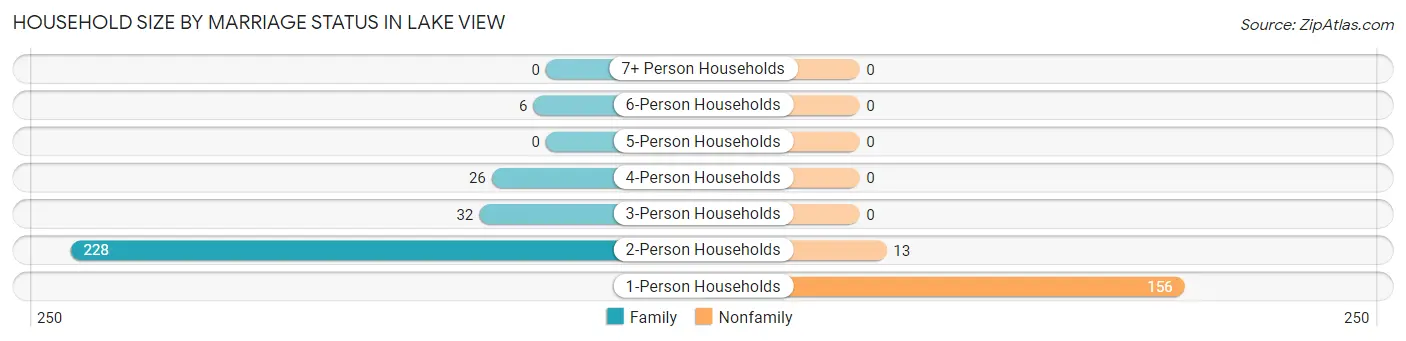
| Household Size | Family Households | Nonfamily Households |
| 1-Person Households | - | 156 (33.8%) |
| 2-Person Households | 228 (49.5%) | 13 (2.8%) |
| 3-Person Households | 32 (6.9%) | 0 (0.0%) |
| 4-Person Households | 26 (5.6%) | 0 (0.0%) |
| 5-Person Households | 0 (0.0%) | 0 (0.0%) |
| 6-Person Households | 6 (1.3%) | 0 (0.0%) |
| 7+ Person Households | 0 (0.0%) | 0 (0.0%) |
| Total | 292 (63.3%) | 169 (36.7%) |
Female Fertility in Lake View
Fertility by Age in Lake View
Average fertility rate in Lake View is 108.0 births per 1,000 women. Women in the age bracket of 20 to 34 years have the highest fertility rate with 200.0 births per 1,000 women. Women in the age bracket of 20 to 34 years acount for 100.0% of all women with births.
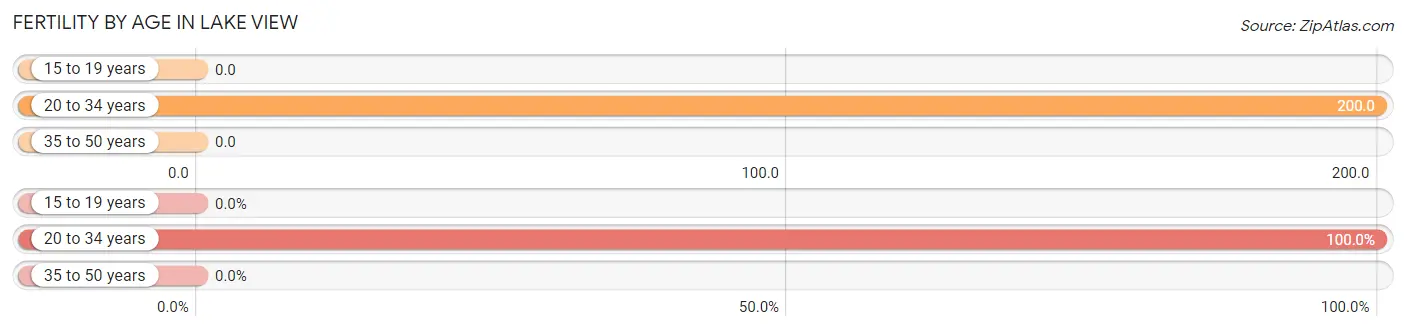
| Age Bracket | Women with Births | Births / 1,000 Women |
| 15 to 19 years | 0 (0.0%) | 0.0 |
| 20 to 34 years | 14 (100.0%) | 200.0 |
| 35 to 50 years | 0 (0.0%) | 0.0 |
| Total | 14 (100.0%) | 108.0 |
Fertility by Age by Marriage Status in Lake View
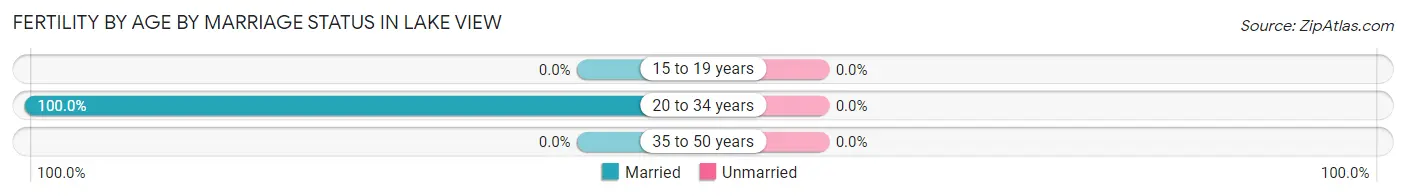
| Age Bracket | Married | Unmarried |
| 15 to 19 years | 0 (0.0%) | 0 (0.0%) |
| 20 to 34 years | 14 (100.0%) | 0 (0.0%) |
| 35 to 50 years | 0 (0.0%) | 0 (0.0%) |
| Total | 14 (100.0%) | 0 (0.0%) |
Fertility by Education in Lake View
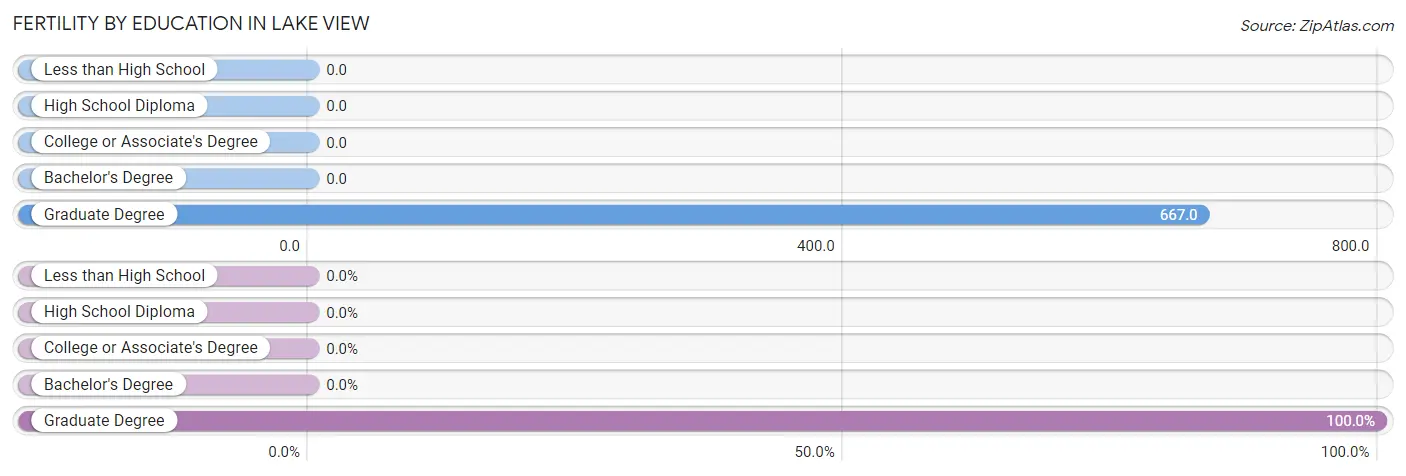
| Educational Attainment | Women with Births | Births / 1,000 Women |
| Less than High School | 0 (0.0%) | 0.0 |
| High School Diploma | 0 (0.0%) | 0.0 |
| College or Associate's Degree | 0 (0.0%) | 0.0 |
| Bachelor's Degree | 0 (0.0%) | 0.0 |
| Graduate Degree | 14 (100.0%) | 667.0 |
| Total | 14 (100.0%) | 108.0 |
Fertility by Education by Marriage Status in Lake View
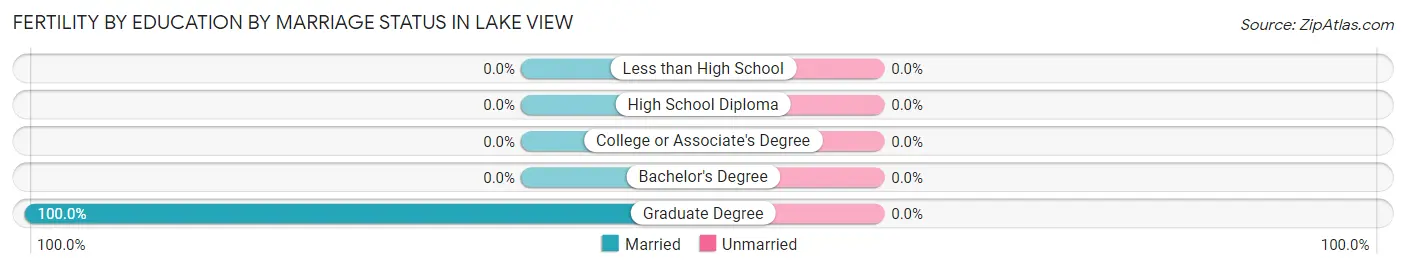
| Educational Attainment | Married | Unmarried |
| Less than High School | 0 (0.0%) | 0 (0.0%) |
| High School Diploma | 0 (0.0%) | 0 (0.0%) |
| College or Associate's Degree | 0 (0.0%) | 0 (0.0%) |
| Bachelor's Degree | 0 (0.0%) | 0 (0.0%) |
| Graduate Degree | 14 (100.0%) | 0 (0.0%) |
| Total | 14 (100.0%) | 0 (0.0%) |
Employment Characteristics in Lake View
Employment by Class of Employer in Lake View
Among the 446 employed individuals in Lake View, private company employees (269 | 60.3%), local government employees (73 | 16.4%), and self-employed (not incorporated) (40 | 9.0%) make up the most common classes of employment.
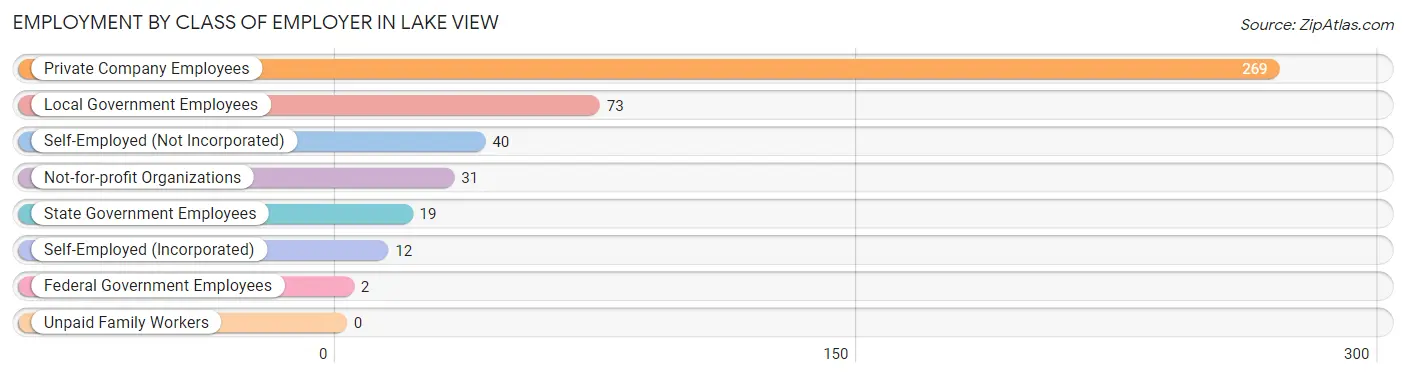
| Employer Class | # Employees | % Employees |
| Private Company Employees | 269 | 60.3% |
| Self-Employed (Incorporated) | 12 | 2.7% |
| Self-Employed (Not Incorporated) | 40 | 9.0% |
| Not-for-profit Organizations | 31 | 7.0% |
| Local Government Employees | 73 | 16.4% |
| State Government Employees | 19 | 4.3% |
| Federal Government Employees | 2 | 0.4% |
| Unpaid Family Workers | 0 | 0.0% |
| Total | 446 | 100.0% |
Employment Status by Age in Lake View
According to the labor force statistics for Lake View, out of the total population over 16 years of age (812), 55.8% or 453 individuals are in the labor force, with 1.5% or 7 of them unemployed. The age group with the highest labor force participation rate is 25 to 29 years, with 100.0% or 29 individuals in the labor force. Within the labor force, the 25 to 29 years age range has the highest percentage of unemployed individuals, with 6.9% or 2 of them being unemployed.
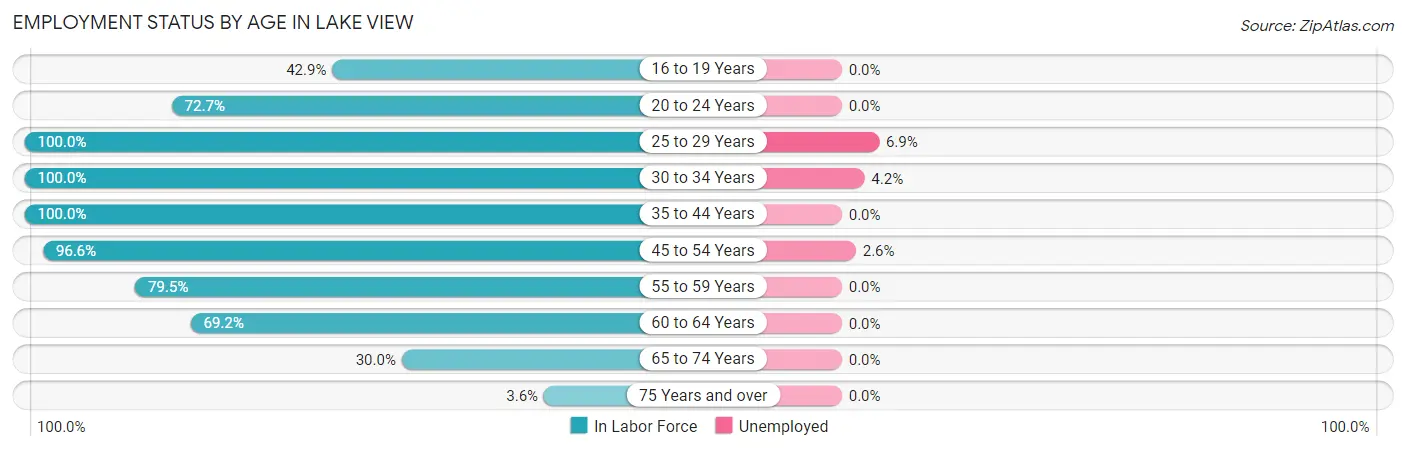
| Age Bracket | In Labor Force | Unemployed |
| 16 to 19 Years | 3 (42.9%) | 0 (0.0%) |
| 20 to 24 Years | 32 (72.7%) | 0 (0.0%) |
| 25 to 29 Years | 29 (100.0%) | 2 (6.9%) |
| 30 to 34 Years | 48 (100.0%) | 2 (4.2%) |
| 35 to 44 Years | 61 (100.0%) | 0 (0.0%) |
| 45 to 54 Years | 114 (96.6%) | 3 (2.6%) |
| 55 to 59 Years | 66 (79.5%) | 0 (0.0%) |
| 60 to 64 Years | 45 (69.2%) | 0 (0.0%) |
| 65 to 74 Years | 48 (30.0%) | 0 (0.0%) |
| 75 Years and over | 7 (3.6%) | 0 (0.0%) |
| Total | 453 (55.8%) | 7 (1.5%) |
Employment Status by Educational Attainment in Lake View
According to labor force statistics for Lake View, 89.9% of individuals (363) out of the total population between 25 and 64 years of age (404) are in the labor force, with 1.9% or 7 of them being unemployed. The group with the highest labor force participation rate are those with the educational attainment of less than high school, with 100.0% or 7 individuals in the labor force. Within the labor force, individuals with college / associate degree education have the highest percentage of unemployment, with 3.6% or 4 of them being unemployed.
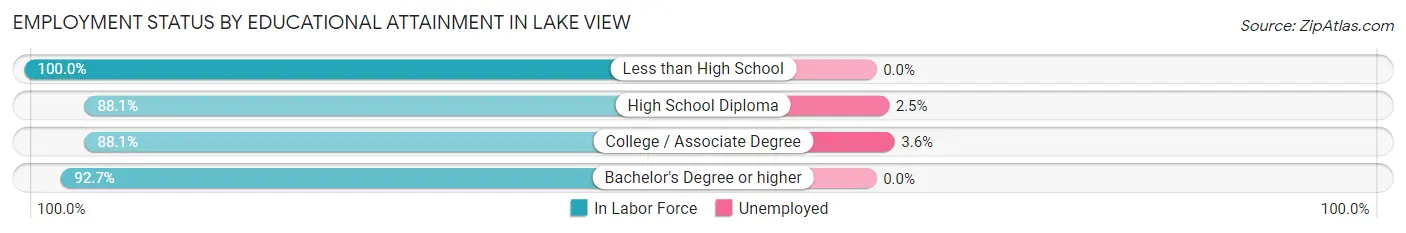
| Educational Attainment | In Labor Force | Unemployed |
| Less than High School | 7 (100.0%) | 0 (0.0%) |
| High School Diploma | 118 (88.1%) | 3 (2.5%) |
| College / Associate Degree | 111 (88.1%) | 5 (3.6%) |
| Bachelor's Degree or higher | 127 (92.7%) | 0 (0.0%) |
| Total | 363 (89.9%) | 8 (1.9%) |
Employment Occupations by Sex in Lake View
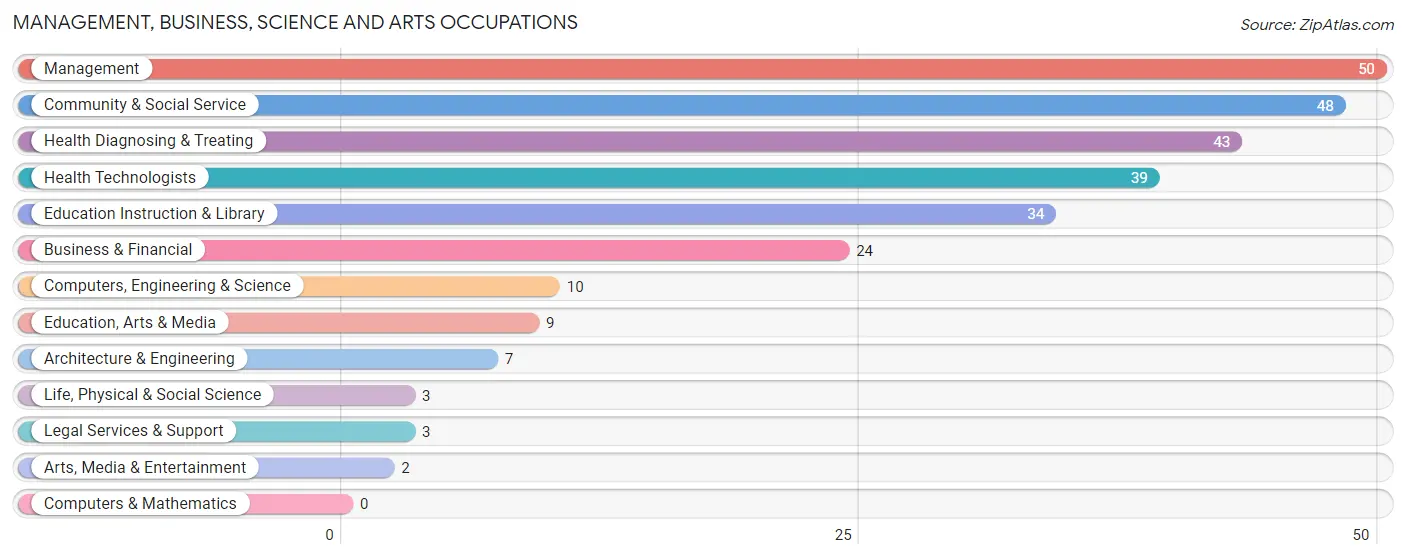
Management, Business, Science and Arts Occupations
The most common Management, Business, Science and Arts occupations in Lake View are Management (50 | 11.2%), Community & Social Service (48 | 10.8%), Health Diagnosing & Treating (43 | 9.6%), Health Technologists (39 | 8.7%), and Education Instruction & Library (34 | 7.6%).
Management, Business, Science and Arts Occupations by Sex
Within the Management, Business, Science and Arts occupations in Lake View, the most male-oriented occupations are Computers, Engineering & Science (100.0%), Architecture & Engineering (100.0%), and Life, Physical & Social Science (100.0%), while the most female-oriented occupations are Health Diagnosing & Treating (100.0%), Health Technologists (100.0%), and Education Instruction & Library (67.6%).
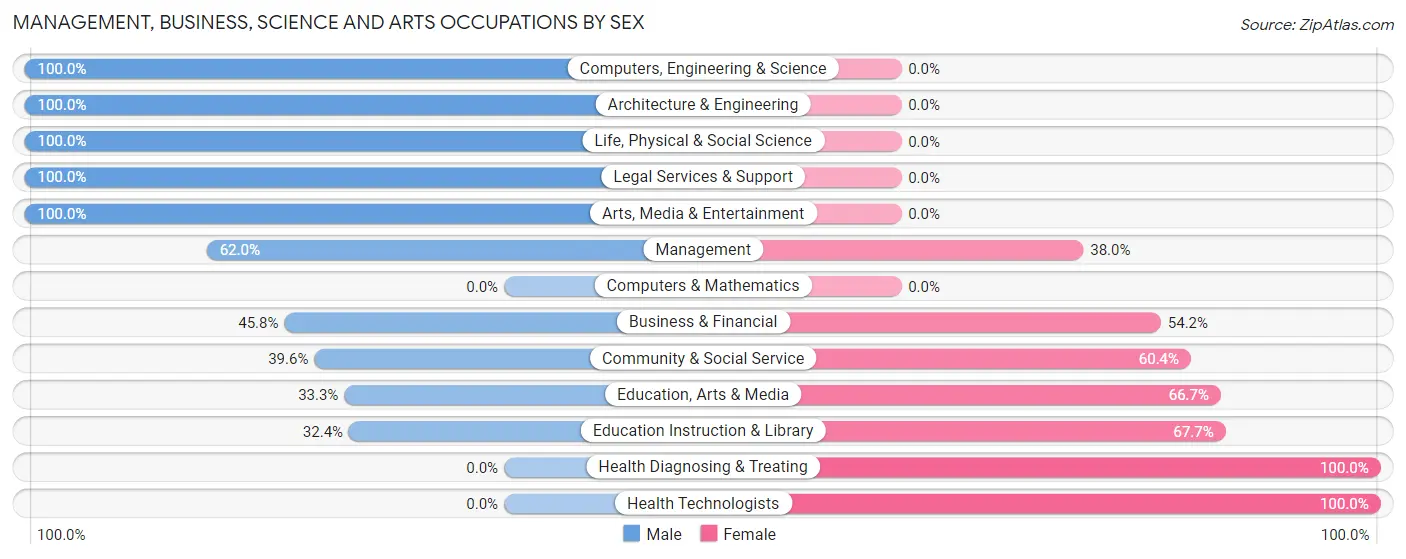
| Occupation | Male | Female |
| Management | 31 (62.0%) | 19 (38.0%) |
| Business & Financial | 11 (45.8%) | 13 (54.2%) |
| Computers, Engineering & Science | 10 (100.0%) | 0 (0.0%) |
| Computers & Mathematics | 0 (0.0%) | 0 (0.0%) |
| Architecture & Engineering | 7 (100.0%) | 0 (0.0%) |
| Life, Physical & Social Science | 3 (100.0%) | 0 (0.0%) |
| Community & Social Service | 19 (39.6%) | 29 (60.4%) |
| Education, Arts & Media | 3 (33.3%) | 6 (66.7%) |
| Legal Services & Support | 3 (100.0%) | 0 (0.0%) |
| Education Instruction & Library | 11 (32.4%) | 23 (67.6%) |
| Arts, Media & Entertainment | 2 (100.0%) | 0 (0.0%) |
| Health Diagnosing & Treating | 0 (0.0%) | 43 (100.0%) |
| Health Technologists | 0 (0.0%) | 39 (100.0%) |
| Total (Category) | 71 (40.6%) | 104 (59.4%) |
| Total (Overall) | 221 (49.5%) | 225 (50.4%) |
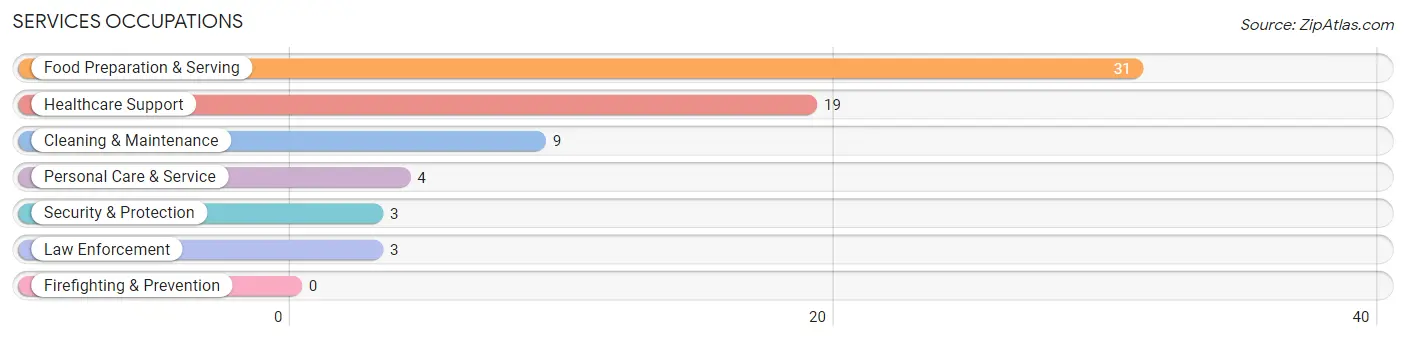
Services Occupations
The most common Services occupations in Lake View are Food Preparation & Serving (31 | 7.0%), Healthcare Support (19 | 4.3%), Cleaning & Maintenance (9 | 2.0%), Personal Care & Service (4 | 0.9%), and Security & Protection (3 | 0.7%).
Services Occupations by Sex
Within the Services occupations in Lake View, the most male-oriented occupations are Cleaning & Maintenance (44.4%), and Food Preparation & Serving (29.0%), while the most female-oriented occupations are Healthcare Support (100.0%), Security & Protection (100.0%), and Law Enforcement (100.0%).
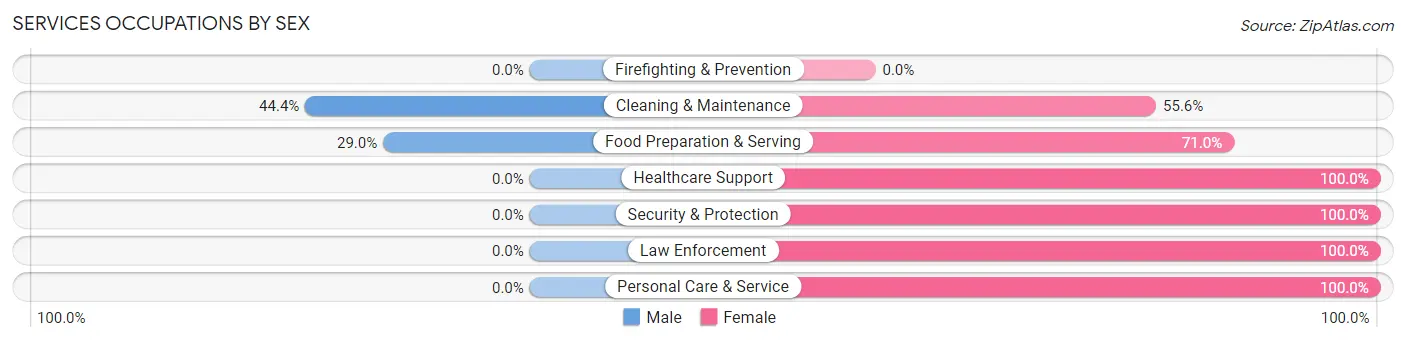
| Occupation | Male | Female |
| Healthcare Support | 0 (0.0%) | 19 (100.0%) |
| Security & Protection | 0 (0.0%) | 3 (100.0%) |
| Firefighting & Prevention | 0 (0.0%) | 0 (0.0%) |
| Law Enforcement | 0 (0.0%) | 3 (100.0%) |
| Food Preparation & Serving | 9 (29.0%) | 22 (71.0%) |
| Cleaning & Maintenance | 4 (44.4%) | 5 (55.6%) |
| Personal Care & Service | 0 (0.0%) | 4 (100.0%) |
| Total (Category) | 13 (19.7%) | 53 (80.3%) |
| Total (Overall) | 221 (49.5%) | 225 (50.4%) |
Sales and Office Occupations
The most common Sales and Office occupations in Lake View are Sales & Related (38 | 8.5%), and Office & Administration (32 | 7.2%).
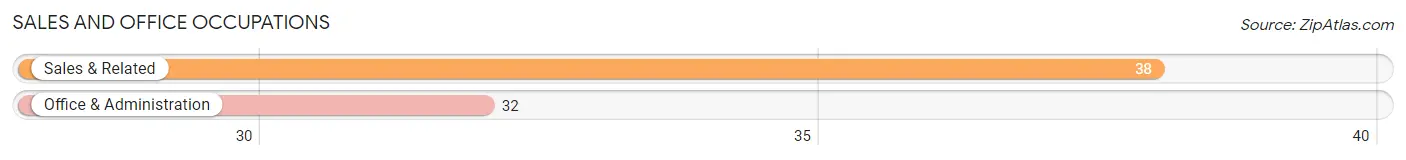
Sales and Office Occupations by Sex

| Occupation | Male | Female |
| Sales & Related | 18 (47.4%) | 20 (52.6%) |
| Office & Administration | 3 (9.4%) | 29 (90.6%) |
| Total (Category) | 21 (30.0%) | 49 (70.0%) |
| Total (Overall) | 221 (49.5%) | 225 (50.4%) |
Natural Resources, Construction and Maintenance Occupations
The most common Natural Resources, Construction and Maintenance occupations in Lake View are Installation, Maintenance & Repair (39 | 8.7%), Construction & Extraction (30 | 6.7%), and Farming, Fishing & Forestry (14 | 3.1%).
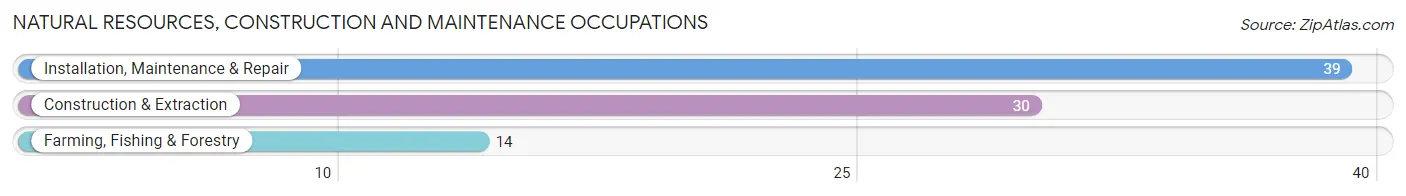
Natural Resources, Construction and Maintenance Occupations by Sex
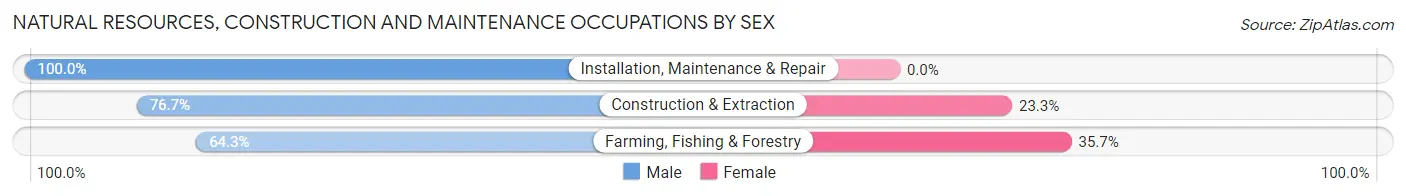
| Occupation | Male | Female |
| Farming, Fishing & Forestry | 9 (64.3%) | 5 (35.7%) |
| Construction & Extraction | 23 (76.7%) | 7 (23.3%) |
| Installation, Maintenance & Repair | 39 (100.0%) | 0 (0.0%) |
| Total (Category) | 71 (85.5%) | 12 (14.5%) |
| Total (Overall) | 221 (49.5%) | 225 (50.4%) |
Production, Transportation and Moving Occupations
The most common Production, Transportation and Moving occupations in Lake View are Material Moving (23 | 5.2%), Transportation (22 | 4.9%), and Production (7 | 1.6%).
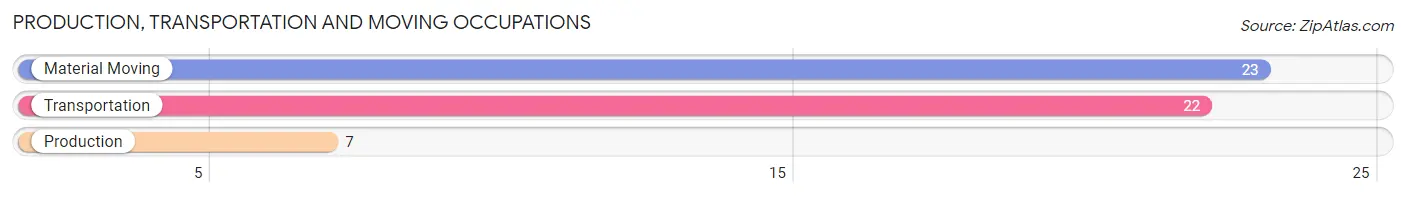
Production, Transportation and Moving Occupations by Sex
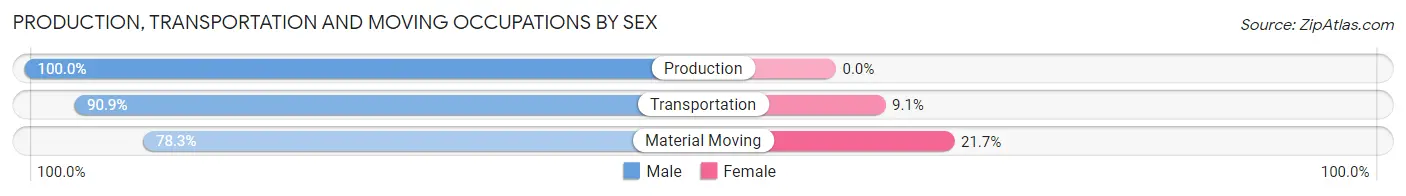
| Occupation | Male | Female |
| Production | 7 (100.0%) | 0 (0.0%) |
| Transportation | 20 (90.9%) | 2 (9.1%) |
| Material Moving | 18 (78.3%) | 5 (21.7%) |
| Total (Category) | 45 (86.5%) | 7 (13.5%) |
| Total (Overall) | 221 (49.5%) | 225 (50.4%) |
Employment Industries by Sex in Lake View
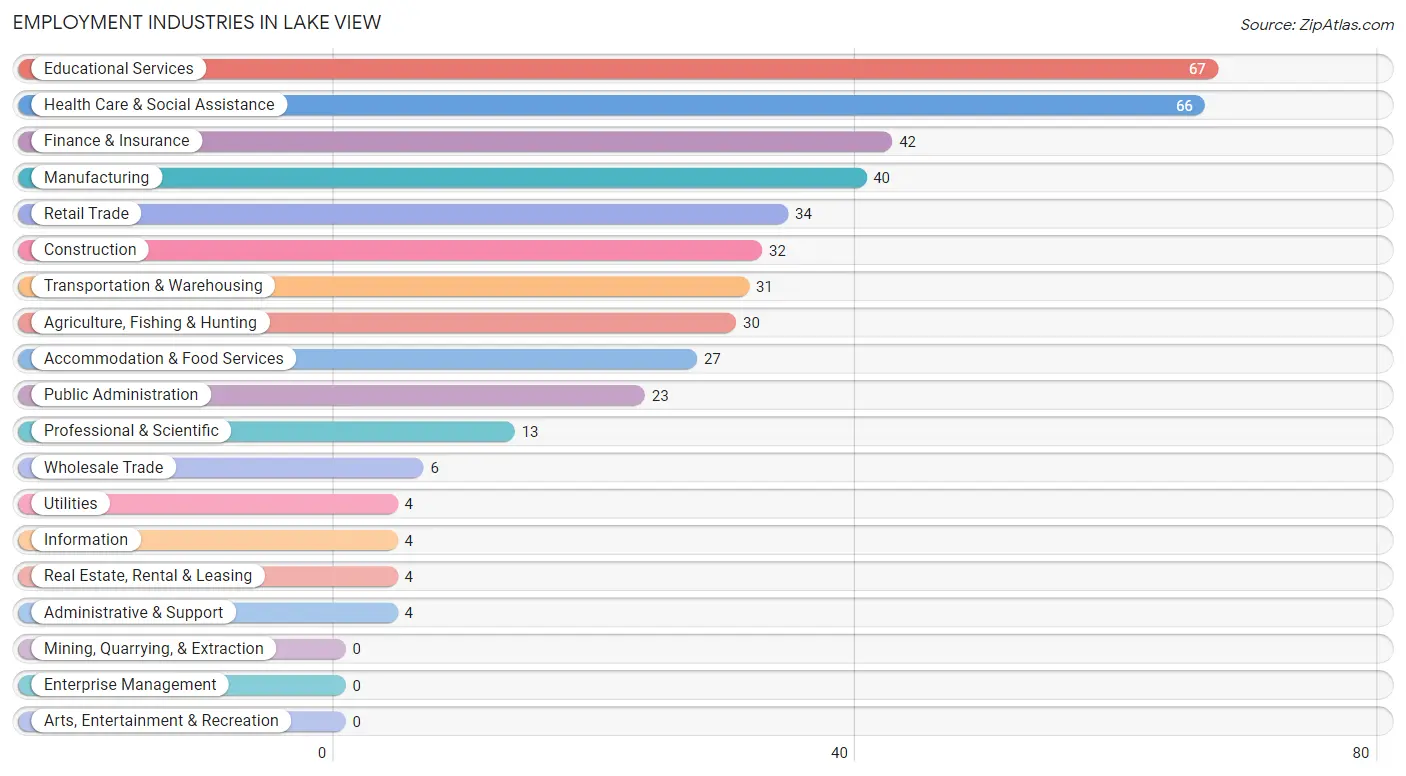
Employment Industries in Lake View
The major employment industries in Lake View include Educational Services (67 | 15.0%), Health Care & Social Assistance (66 | 14.8%), Finance & Insurance (42 | 9.4%), Manufacturing (40 | 9.0%), and Retail Trade (34 | 7.6%).
Employment Industries by Sex in Lake View
The Lake View industries that see more men than women are Administrative & Support (100.0%), Transportation & Warehousing (93.5%), and Agriculture, Fishing & Hunting (90.0%), whereas the industries that tend to have a higher number of women are Wholesale Trade (100.0%), Utilities (100.0%), and Information (100.0%).
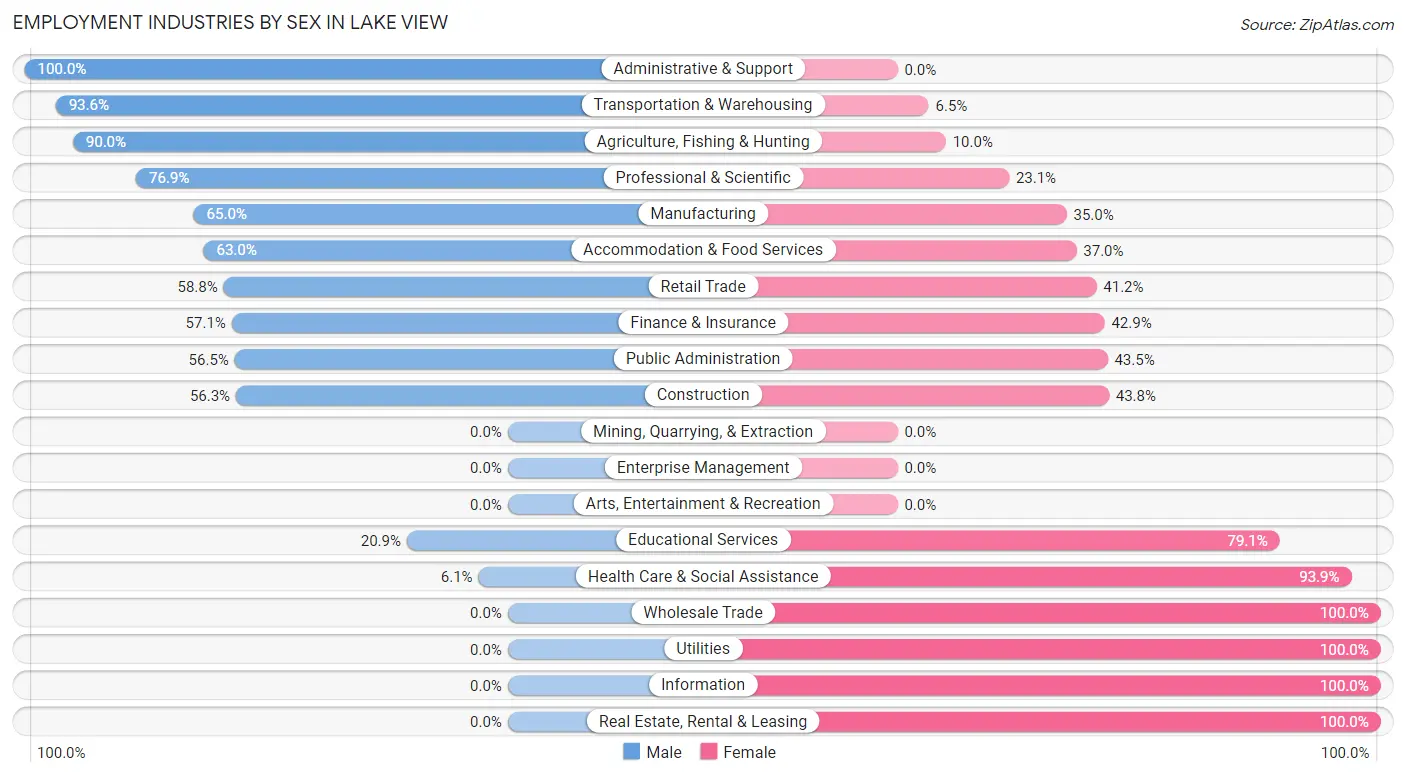
| Industry | Male | Female |
| Agriculture, Fishing & Hunting | 27 (90.0%) | 3 (10.0%) |
| Mining, Quarrying, & Extraction | 0 (0.0%) | 0 (0.0%) |
| Construction | 18 (56.2%) | 14 (43.8%) |
| Manufacturing | 26 (65.0%) | 14 (35.0%) |
| Wholesale Trade | 0 (0.0%) | 6 (100.0%) |
| Retail Trade | 20 (58.8%) | 14 (41.2%) |
| Transportation & Warehousing | 29 (93.5%) | 2 (6.5%) |
| Utilities | 0 (0.0%) | 4 (100.0%) |
| Information | 0 (0.0%) | 4 (100.0%) |
| Finance & Insurance | 24 (57.1%) | 18 (42.9%) |
| Real Estate, Rental & Leasing | 0 (0.0%) | 4 (100.0%) |
| Professional & Scientific | 10 (76.9%) | 3 (23.1%) |
| Enterprise Management | 0 (0.0%) | 0 (0.0%) |
| Administrative & Support | 4 (100.0%) | 0 (0.0%) |
| Educational Services | 14 (20.9%) | 53 (79.1%) |
| Health Care & Social Assistance | 4 (6.1%) | 62 (93.9%) |
| Arts, Entertainment & Recreation | 0 (0.0%) | 0 (0.0%) |
| Accommodation & Food Services | 17 (63.0%) | 10 (37.0%) |
| Public Administration | 13 (56.5%) | 10 (43.5%) |
| Total | 221 (49.5%) | 225 (50.4%) |
Education in Lake View
School Enrollment in Lake View
The most common levels of schooling among the 106 students in Lake View are middle school (23 | 21.7%), elementary school (22 | 20.7%), and high school (20 | 18.9%).
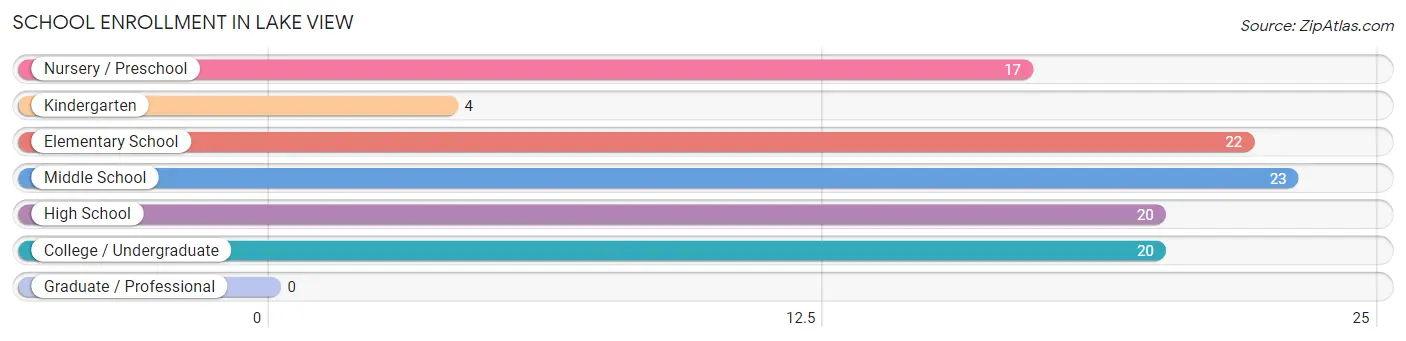
| School Level | # Students | % Students |
| Nursery / Preschool | 17 | 16.0% |
| Kindergarten | 4 | 3.8% |
| Elementary School | 22 | 20.7% |
| Middle School | 23 | 21.7% |
| High School | 20 | 18.9% |
| College / Undergraduate | 20 | 18.9% |
| Graduate / Professional | 0 | 0.0% |
| Total | 106 | 100.0% |
School Enrollment by Age by Funding Source in Lake View
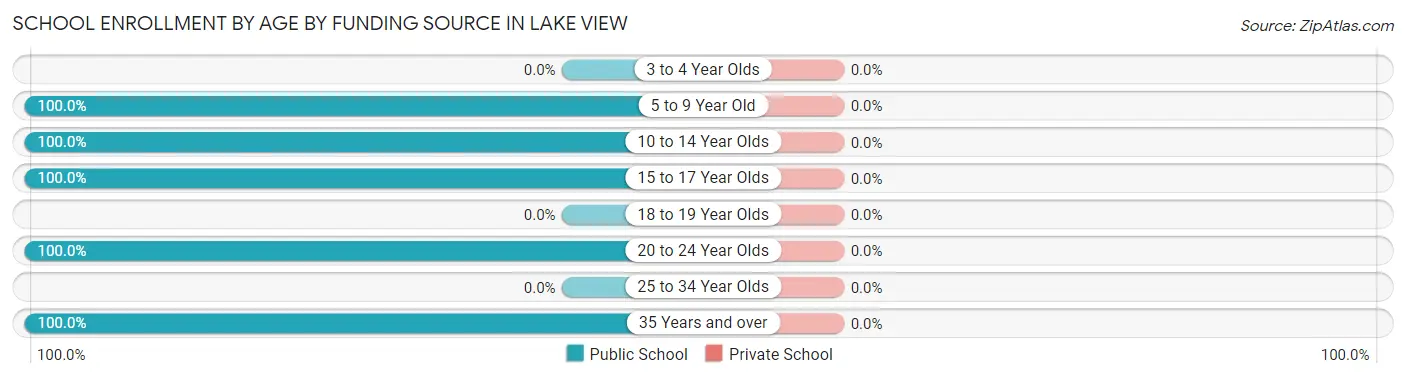
| Age Bracket | Public School | Private School |
| 3 to 4 Year Olds | 0 (0.0%) | 0 (0.0%) |
| 5 to 9 Year Old | 38 (100.0%) | 0 (0.0%) |
| 10 to 14 Year Olds | 26 (100.0%) | 0 (0.0%) |
| 15 to 17 Year Olds | 22 (100.0%) | 0 (0.0%) |
| 18 to 19 Year Olds | 0 (0.0%) | 0 (0.0%) |
| 20 to 24 Year Olds | 17 (100.0%) | 0 (0.0%) |
| 25 to 34 Year Olds | 0 (0.0%) | 0 (0.0%) |
| 35 Years and over | 3 (100.0%) | 0 (0.0%) |
| Total | 106 (100.0%) | 0 (0.0%) |
Educational Attainment by Field of Study in Lake View
Education (70 | 31.2%), business (41 | 18.3%), science & technology (37 | 16.5%), bio, nature & agricultural (22 | 9.8%), and liberal arts & history (10 | 4.5%) are the most common fields of study among 224 individuals in Lake View who have obtained a bachelor's degree or higher.
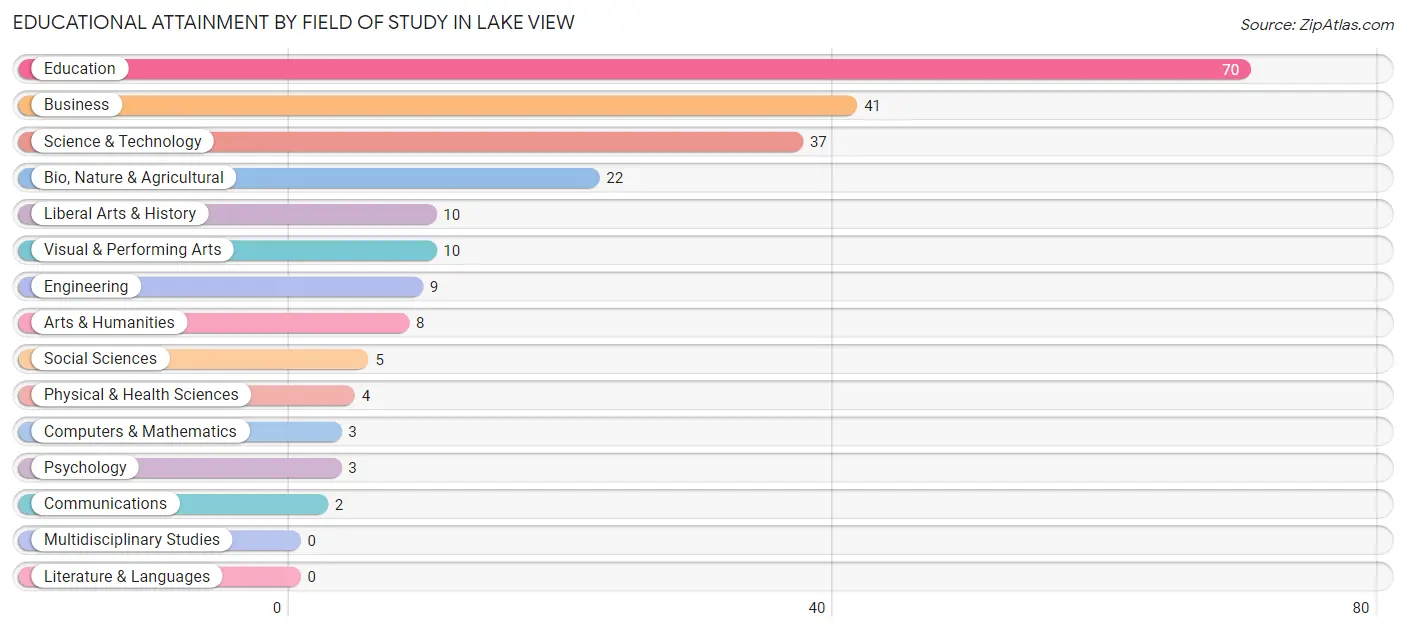
| Field of Study | # Graduates | % Graduates |
| Computers & Mathematics | 3 | 1.3% |
| Bio, Nature & Agricultural | 22 | 9.8% |
| Physical & Health Sciences | 4 | 1.8% |
| Psychology | 3 | 1.3% |
| Social Sciences | 5 | 2.2% |
| Engineering | 9 | 4.0% |
| Multidisciplinary Studies | 0 | 0.0% |
| Science & Technology | 37 | 16.5% |
| Business | 41 | 18.3% |
| Education | 70 | 31.2% |
| Literature & Languages | 0 | 0.0% |
| Liberal Arts & History | 10 | 4.5% |
| Visual & Performing Arts | 10 | 4.5% |
| Communications | 2 | 0.9% |
| Arts & Humanities | 8 | 3.6% |
| Total | 224 | 100.0% |
Transportation & Commute in Lake View
Vehicle Availability by Sex in Lake View
The most prevalent vehicle ownership categories in Lake View are males with 2 vehicles (106, accounting for 48.0%) and females with 2 vehicles (96, making up 47.1%).
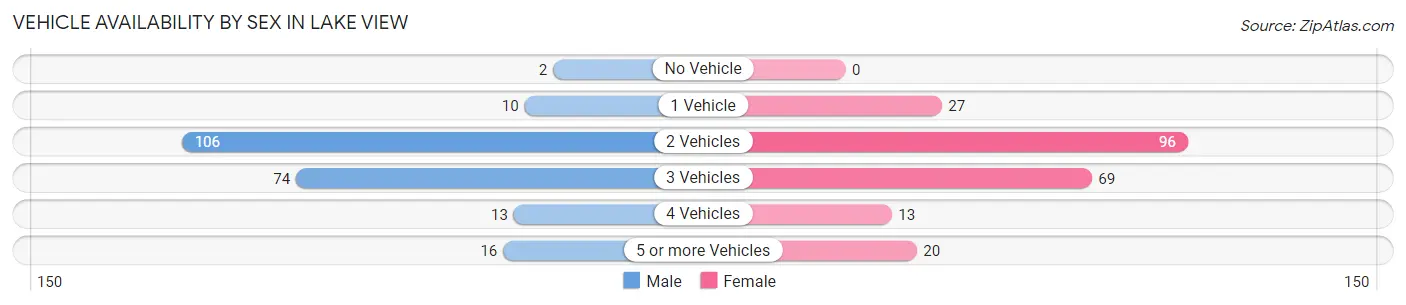
| Vehicles Available | Male | Female |
| No Vehicle | 2 (0.9%) | 0 (0.0%) |
| 1 Vehicle | 10 (4.5%) | 27 (12.0%) |
| 2 Vehicles | 106 (48.0%) | 96 (42.7%) |
| 3 Vehicles | 74 (33.5%) | 69 (30.7%) |
| 4 Vehicles | 13 (5.9%) | 13 (5.8%) |
| 5 or more Vehicles | 16 (7.2%) | 20 (8.9%) |
| Total | 221 (100.0%) | 225 (100.0%) |
Commute Time in Lake View
The most frequently occuring commute durations in Lake View are 5 to 9 minutes (88 commuters, 20.2%), less than 5 minutes (79 commuters, 18.2%), and 30 to 34 minutes (59 commuters, 13.6%).
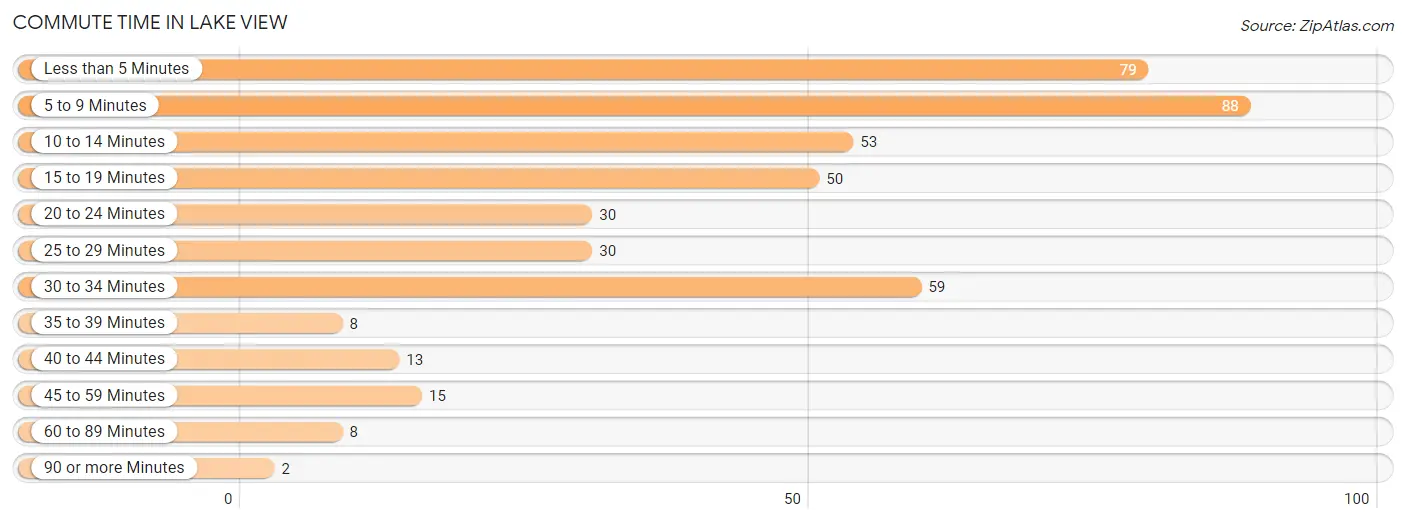
| Commute Time | # Commuters | % Commuters |
| Less than 5 Minutes | 79 | 18.2% |
| 5 to 9 Minutes | 88 | 20.2% |
| 10 to 14 Minutes | 53 | 12.2% |
| 15 to 19 Minutes | 50 | 11.5% |
| 20 to 24 Minutes | 30 | 6.9% |
| 25 to 29 Minutes | 30 | 6.9% |
| 30 to 34 Minutes | 59 | 13.6% |
| 35 to 39 Minutes | 8 | 1.8% |
| 40 to 44 Minutes | 13 | 3.0% |
| 45 to 59 Minutes | 15 | 3.5% |
| 60 to 89 Minutes | 8 | 1.8% |
| 90 or more Minutes | 2 | 0.5% |
Commute Time by Sex in Lake View
The most common commute times in Lake View are 5 to 9 minutes (48 commuters, 22.2%) for males and less than 5 minutes (48 commuters, 21.9%) for females.
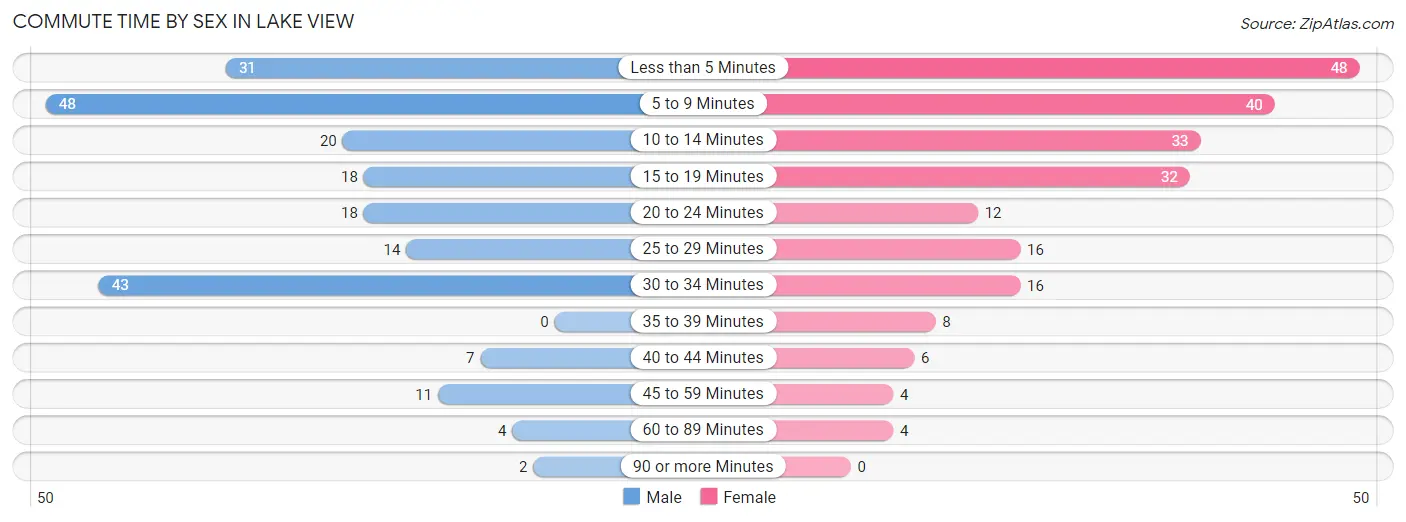
| Commute Time | Male | Female |
| Less than 5 Minutes | 31 (14.3%) | 48 (21.9%) |
| 5 to 9 Minutes | 48 (22.2%) | 40 (18.3%) |
| 10 to 14 Minutes | 20 (9.3%) | 33 (15.1%) |
| 15 to 19 Minutes | 18 (8.3%) | 32 (14.6%) |
| 20 to 24 Minutes | 18 (8.3%) | 12 (5.5%) |
| 25 to 29 Minutes | 14 (6.5%) | 16 (7.3%) |
| 30 to 34 Minutes | 43 (19.9%) | 16 (7.3%) |
| 35 to 39 Minutes | 0 (0.0%) | 8 (3.6%) |
| 40 to 44 Minutes | 7 (3.2%) | 6 (2.7%) |
| 45 to 59 Minutes | 11 (5.1%) | 4 (1.8%) |
| 60 to 89 Minutes | 4 (1.8%) | 4 (1.8%) |
| 90 or more Minutes | 2 (0.9%) | 0 (0.0%) |
Time of Departure to Work by Sex in Lake View
The most frequent times of departure to work in Lake View are 7:00 AM to 7:29 AM (38, 17.6%) for males and 7:30 AM to 7:59 AM (55, 25.1%) for females.
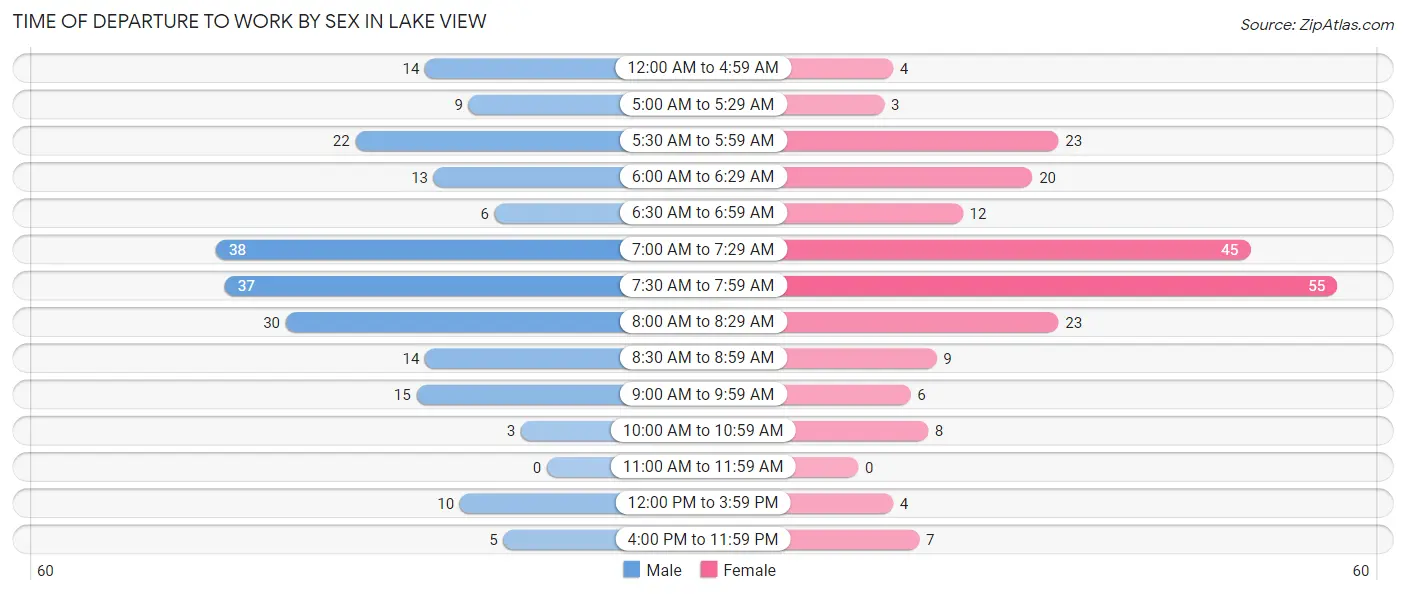
| Time of Departure | Male | Female |
| 12:00 AM to 4:59 AM | 14 (6.5%) | 4 (1.8%) |
| 5:00 AM to 5:29 AM | 9 (4.2%) | 3 (1.4%) |
| 5:30 AM to 5:59 AM | 22 (10.2%) | 23 (10.5%) |
| 6:00 AM to 6:29 AM | 13 (6.0%) | 20 (9.1%) |
| 6:30 AM to 6:59 AM | 6 (2.8%) | 12 (5.5%) |
| 7:00 AM to 7:29 AM | 38 (17.6%) | 45 (20.5%) |
| 7:30 AM to 7:59 AM | 37 (17.1%) | 55 (25.1%) |
| 8:00 AM to 8:29 AM | 30 (13.9%) | 23 (10.5%) |
| 8:30 AM to 8:59 AM | 14 (6.5%) | 9 (4.1%) |
| 9:00 AM to 9:59 AM | 15 (6.9%) | 6 (2.7%) |
| 10:00 AM to 10:59 AM | 3 (1.4%) | 8 (3.6%) |
| 11:00 AM to 11:59 AM | 0 (0.0%) | 0 (0.0%) |
| 12:00 PM to 3:59 PM | 10 (4.6%) | 4 (1.8%) |
| 4:00 PM to 11:59 PM | 5 (2.3%) | 7 (3.2%) |
| Total | 216 (100.0%) | 219 (100.0%) |
Housing Occupancy in Lake View
Occupancy by Ownership in Lake View
Of the total 461 dwellings in Lake View, owner-occupied units account for 386 (83.7%), while renter-occupied units make up 75 (16.3%).
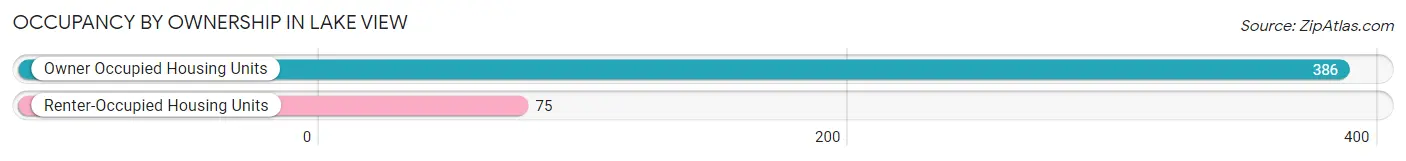
| Occupancy | # Housing Units | % Housing Units |
| Owner Occupied Housing Units | 386 | 83.7% |
| Renter-Occupied Housing Units | 75 | 16.3% |
| Total Occupied Housing Units | 461 | 100.0% |
Occupancy by Household Size in Lake View
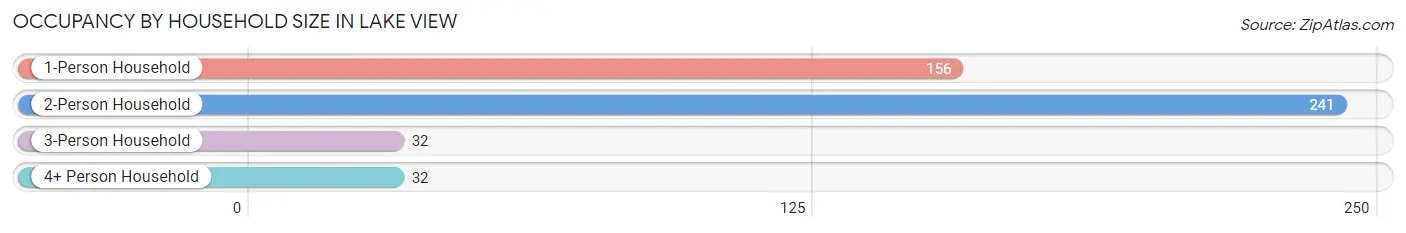
| Household Size | # Housing Units | % Housing Units |
| 1-Person Household | 156 | 33.8% |
| 2-Person Household | 241 | 52.3% |
| 3-Person Household | 32 | 6.9% |
| 4+ Person Household | 32 | 6.9% |
| Total Housing Units | 461 | 100.0% |
Occupancy by Ownership by Household Size in Lake View
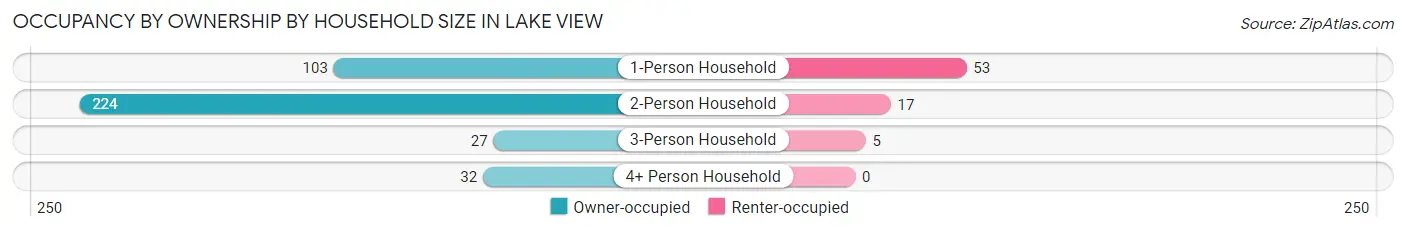
| Household Size | Owner-occupied | Renter-occupied |
| 1-Person Household | 103 (66.0%) | 53 (34.0%) |
| 2-Person Household | 224 (92.9%) | 17 (7.0%) |
| 3-Person Household | 27 (84.4%) | 5 (15.6%) |
| 4+ Person Household | 32 (100.0%) | 0 (0.0%) |
| Total Housing Units | 386 (83.7%) | 75 (16.3%) |
Occupancy by Educational Attainment in Lake View
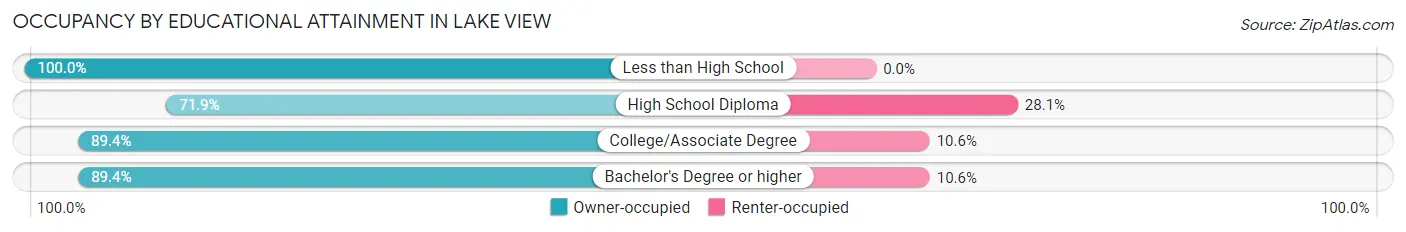
| Household Size | Owner-occupied | Renter-occupied |
| Less than High School | 7 (100.0%) | 0 (0.0%) |
| High School Diploma | 110 (71.9%) | 43 (28.1%) |
| College/Associate Degree | 143 (89.4%) | 17 (10.6%) |
| Bachelor's Degree or higher | 126 (89.4%) | 15 (10.6%) |
Occupancy by Age of Householder in Lake View
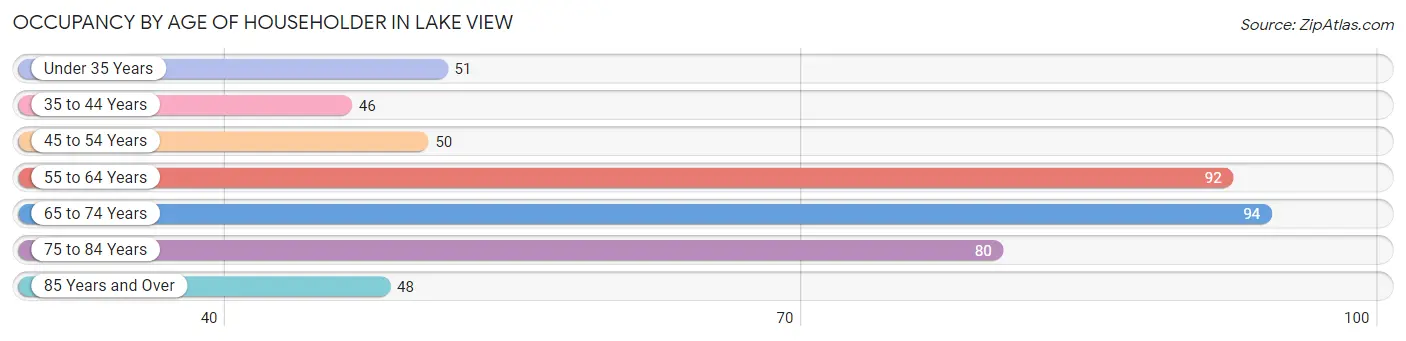
| Age Bracket | # Households | % Households |
| Under 35 Years | 51 | 11.1% |
| 35 to 44 Years | 46 | 10.0% |
| 45 to 54 Years | 50 | 10.8% |
| 55 to 64 Years | 92 | 20.0% |
| 65 to 74 Years | 94 | 20.4% |
| 75 to 84 Years | 80 | 17.3% |
| 85 Years and Over | 48 | 10.4% |
| Total | 461 | 100.0% |
Housing Finances in Lake View
Median Income by Occupancy in Lake View
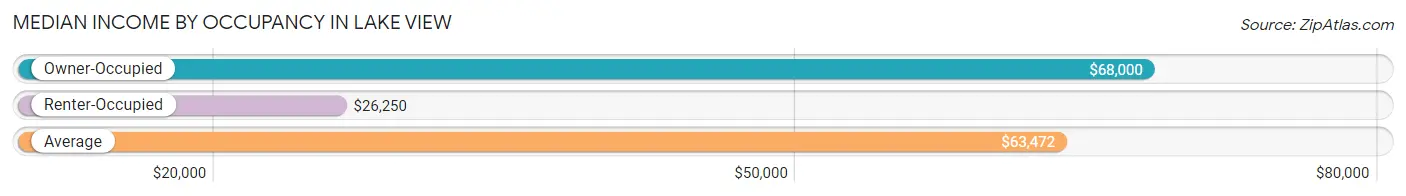
| Occupancy Type | # Households | Median Income |
| Owner-Occupied | 386 (83.7%) | $68,000 |
| Renter-Occupied | 75 (16.3%) | $26,250 |
| Average | 461 (100.0%) | $63,472 |
Occupancy by Householder Income Bracket in Lake View
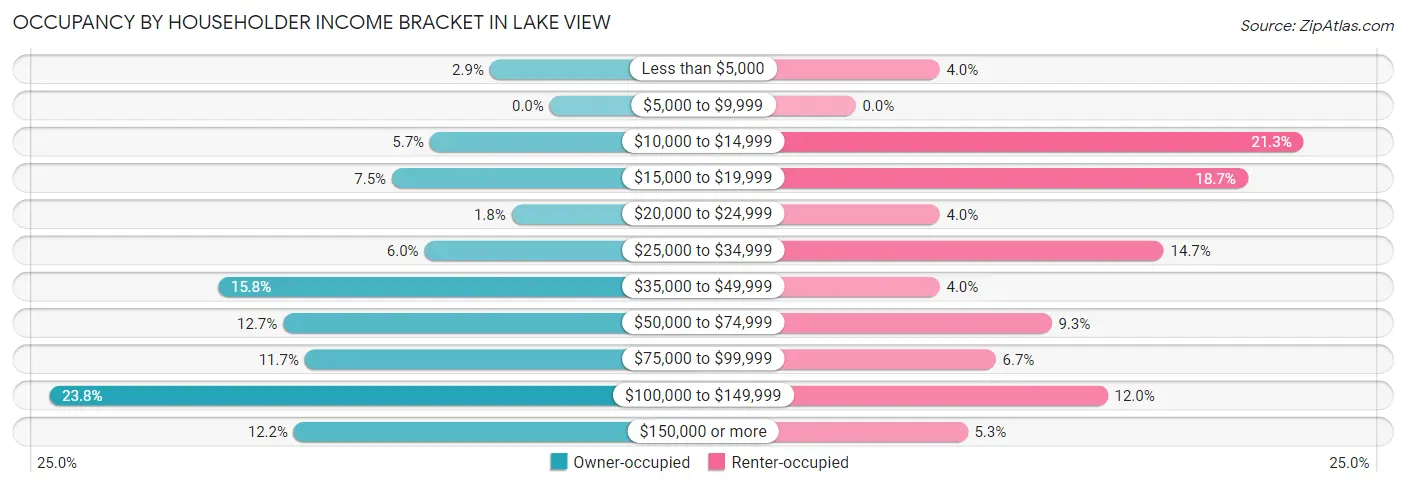
| Income Bracket | Owner-occupied | Renter-occupied |
| Less than $5,000 | 11 (2.9%) | 3 (4.0%) |
| $5,000 to $9,999 | 0 (0.0%) | 0 (0.0%) |
| $10,000 to $14,999 | 22 (5.7%) | 16 (21.3%) |
| $15,000 to $19,999 | 29 (7.5%) | 14 (18.7%) |
| $20,000 to $24,999 | 7 (1.8%) | 3 (4.0%) |
| $25,000 to $34,999 | 23 (6.0%) | 11 (14.7%) |
| $35,000 to $49,999 | 61 (15.8%) | 3 (4.0%) |
| $50,000 to $74,999 | 49 (12.7%) | 7 (9.3%) |
| $75,000 to $99,999 | 45 (11.7%) | 5 (6.7%) |
| $100,000 to $149,999 | 92 (23.8%) | 9 (12.0%) |
| $150,000 or more | 47 (12.2%) | 4 (5.3%) |
| Total | 386 (100.0%) | 75 (100.0%) |
Monthly Housing Cost Tiers in Lake View
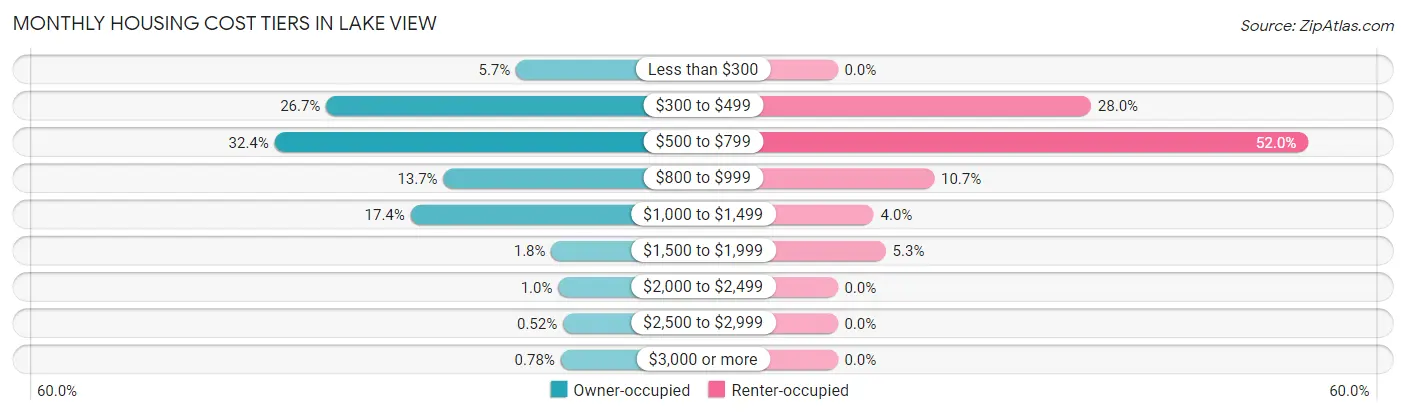
| Monthly Cost | Owner-occupied | Renter-occupied |
| Less than $300 | 22 (5.7%) | 0 (0.0%) |
| $300 to $499 | 103 (26.7%) | 21 (28.0%) |
| $500 to $799 | 125 (32.4%) | 39 (52.0%) |
| $800 to $999 | 53 (13.7%) | 8 (10.7%) |
| $1,000 to $1,499 | 67 (17.4%) | 3 (4.0%) |
| $1,500 to $1,999 | 7 (1.8%) | 4 (5.3%) |
| $2,000 to $2,499 | 4 (1.0%) | 0 (0.0%) |
| $2,500 to $2,999 | 2 (0.5%) | 0 (0.0%) |
| $3,000 or more | 3 (0.8%) | 0 (0.0%) |
| Total | 386 (100.0%) | 75 (100.0%) |
Physical Housing Characteristics in Lake View
Housing Structures in Lake View
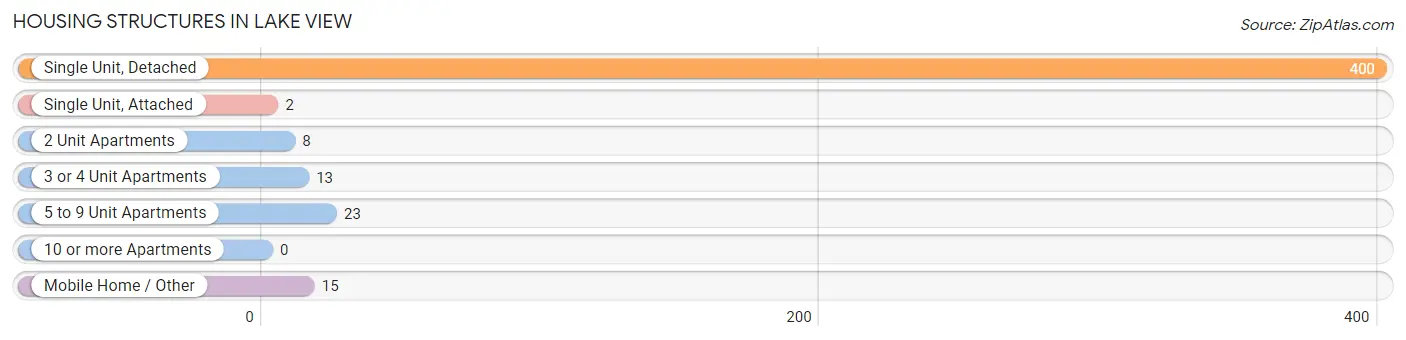
| Structure Type | # Housing Units | % Housing Units |
| Single Unit, Detached | 400 | 86.8% |
| Single Unit, Attached | 2 | 0.4% |
| 2 Unit Apartments | 8 | 1.7% |
| 3 or 4 Unit Apartments | 13 | 2.8% |
| 5 to 9 Unit Apartments | 23 | 5.0% |
| 10 or more Apartments | 0 | 0.0% |
| Mobile Home / Other | 15 | 3.3% |
| Total | 461 | 100.0% |
Housing Structures by Occupancy in Lake View
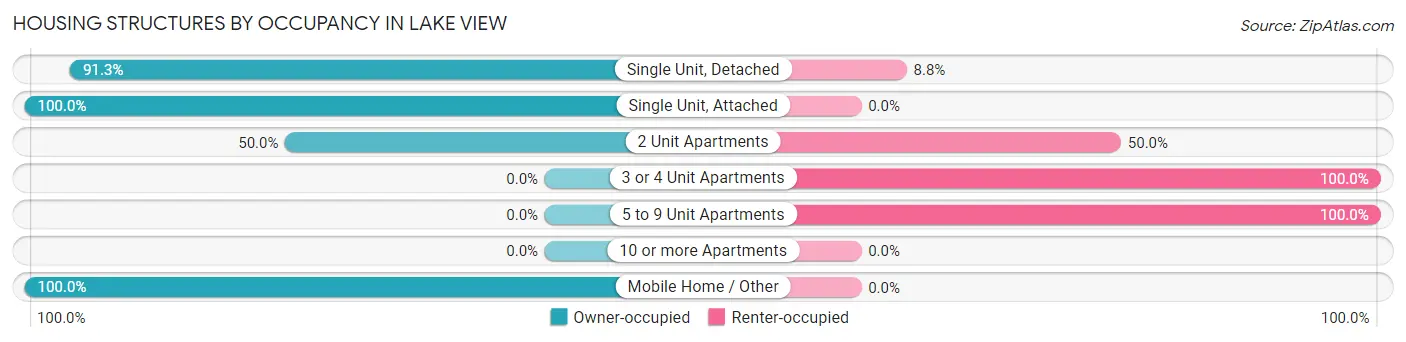
| Structure Type | Owner-occupied | Renter-occupied |
| Single Unit, Detached | 365 (91.2%) | 35 (8.7%) |
| Single Unit, Attached | 2 (100.0%) | 0 (0.0%) |
| 2 Unit Apartments | 4 (50.0%) | 4 (50.0%) |
| 3 or 4 Unit Apartments | 0 (0.0%) | 13 (100.0%) |
| 5 to 9 Unit Apartments | 0 (0.0%) | 23 (100.0%) |
| 10 or more Apartments | 0 (0.0%) | 0 (0.0%) |
| Mobile Home / Other | 15 (100.0%) | 0 (0.0%) |
| Total | 386 (83.7%) | 75 (16.3%) |
Housing Structures by Number of Rooms in Lake View
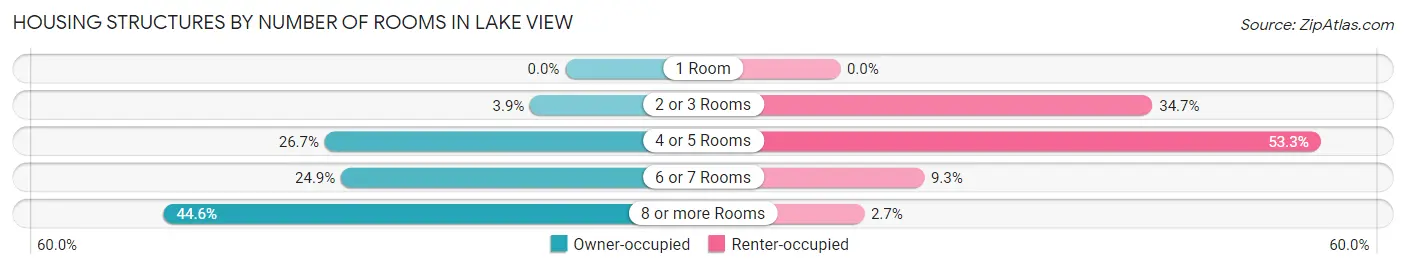
| Number of Rooms | Owner-occupied | Renter-occupied |
| 1 Room | 0 (0.0%) | 0 (0.0%) |
| 2 or 3 Rooms | 15 (3.9%) | 26 (34.7%) |
| 4 or 5 Rooms | 103 (26.7%) | 40 (53.3%) |
| 6 or 7 Rooms | 96 (24.9%) | 7 (9.3%) |
| 8 or more Rooms | 172 (44.6%) | 2 (2.7%) |
| Total | 386 (100.0%) | 75 (100.0%) |
Housing Structure by Heating Type in Lake View
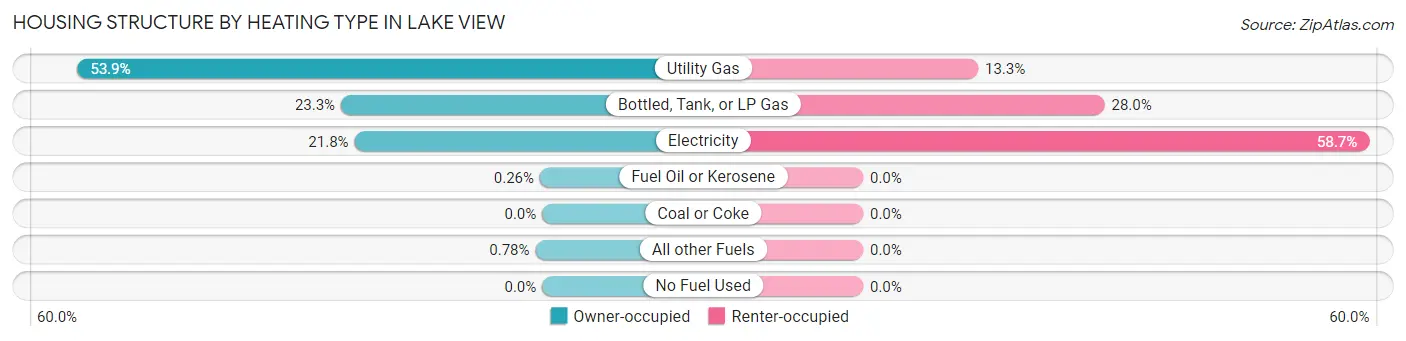
| Heating Type | Owner-occupied | Renter-occupied |
| Utility Gas | 208 (53.9%) | 10 (13.3%) |
| Bottled, Tank, or LP Gas | 90 (23.3%) | 21 (28.0%) |
| Electricity | 84 (21.8%) | 44 (58.7%) |
| Fuel Oil or Kerosene | 1 (0.3%) | 0 (0.0%) |
| Coal or Coke | 0 (0.0%) | 0 (0.0%) |
| All other Fuels | 3 (0.8%) | 0 (0.0%) |
| No Fuel Used | 0 (0.0%) | 0 (0.0%) |
| Total | 386 (100.0%) | 75 (100.0%) |
Household Vehicle Usage in Lake View
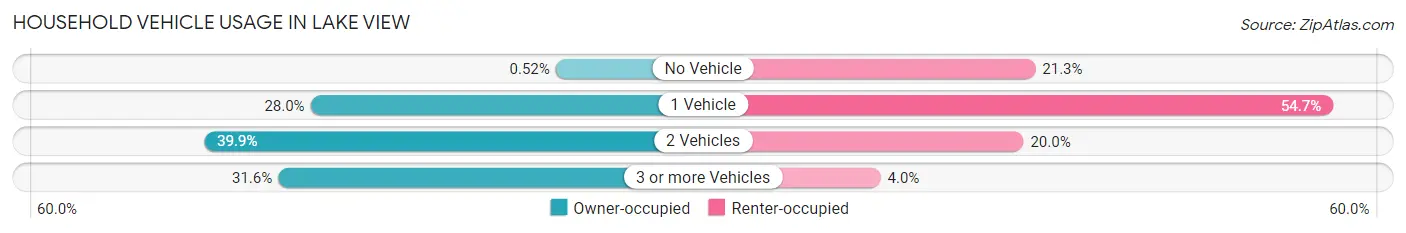
| Vehicles per Household | Owner-occupied | Renter-occupied |
| No Vehicle | 2 (0.5%) | 16 (21.3%) |
| 1 Vehicle | 108 (28.0%) | 41 (54.7%) |
| 2 Vehicles | 154 (39.9%) | 15 (20.0%) |
| 3 or more Vehicles | 122 (31.6%) | 3 (4.0%) |
| Total | 386 (100.0%) | 75 (100.0%) |
Real Estate & Mortgages in Lake View
Real Estate and Mortgage Overview in Lake View
| Characteristic | Without Mortgage | With Mortgage |
| Housing Units | 236 | 150 |
| Median Property Value | $148,800 | $118,400 |
| Median Household Income | $63,611 | $22 |
| Monthly Housing Costs | $500 | $3 |
| Real Estate Taxes | $1,413 | $6 |
Property Value by Mortgage Status in Lake View
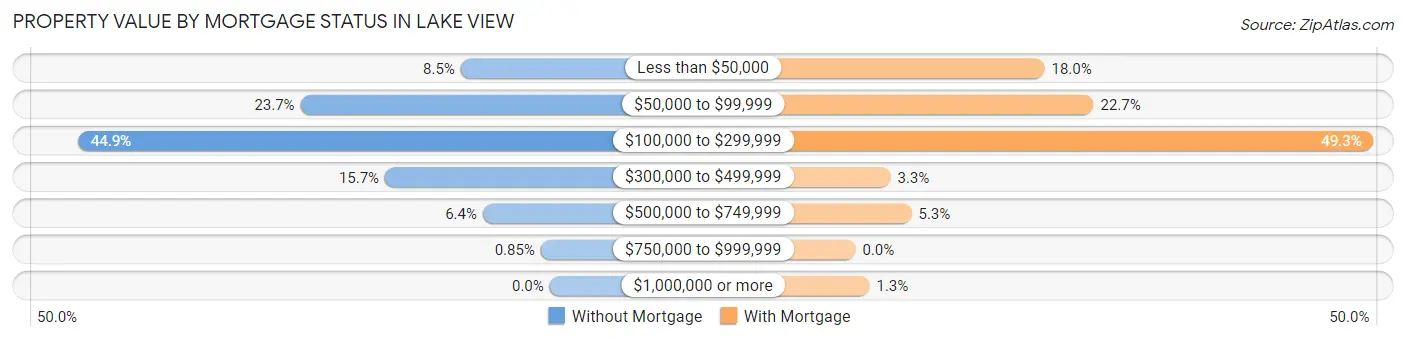
| Property Value | Without Mortgage | With Mortgage |
| Less than $50,000 | 20 (8.5%) | 27 (18.0%) |
| $50,000 to $99,999 | 56 (23.7%) | 34 (22.7%) |
| $100,000 to $299,999 | 106 (44.9%) | 74 (49.3%) |
| $300,000 to $499,999 | 37 (15.7%) | 5 (3.3%) |
| $500,000 to $749,999 | 15 (6.4%) | 8 (5.3%) |
| $750,000 to $999,999 | 2 (0.9%) | 0 (0.0%) |
| $1,000,000 or more | 0 (0.0%) | 2 (1.3%) |
| Total | 236 (100.0%) | 150 (100.0%) |
Household Income by Mortgage Status in Lake View
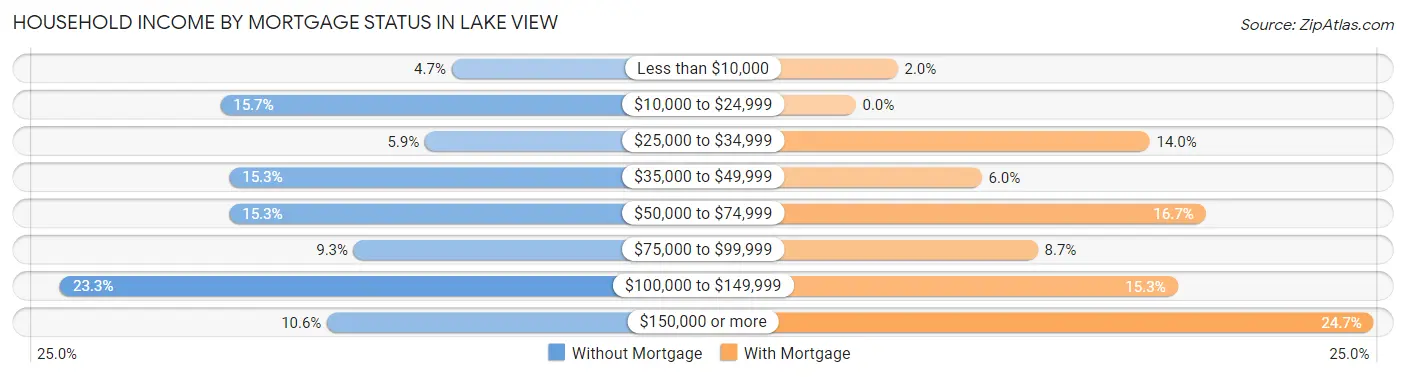
| Household Income | Without Mortgage | With Mortgage |
| Less than $10,000 | 11 (4.7%) | 3 (2.0%) |
| $10,000 to $24,999 | 37 (15.7%) | 0 (0.0%) |
| $25,000 to $34,999 | 14 (5.9%) | 21 (14.0%) |
| $35,000 to $49,999 | 36 (15.2%) | 9 (6.0%) |
| $50,000 to $74,999 | 36 (15.2%) | 25 (16.7%) |
| $75,000 to $99,999 | 22 (9.3%) | 13 (8.7%) |
| $100,000 to $149,999 | 55 (23.3%) | 23 (15.3%) |
| $150,000 or more | 25 (10.6%) | 37 (24.7%) |
| Total | 236 (100.0%) | 150 (100.0%) |
Property Value to Household Income Ratio in Lake View
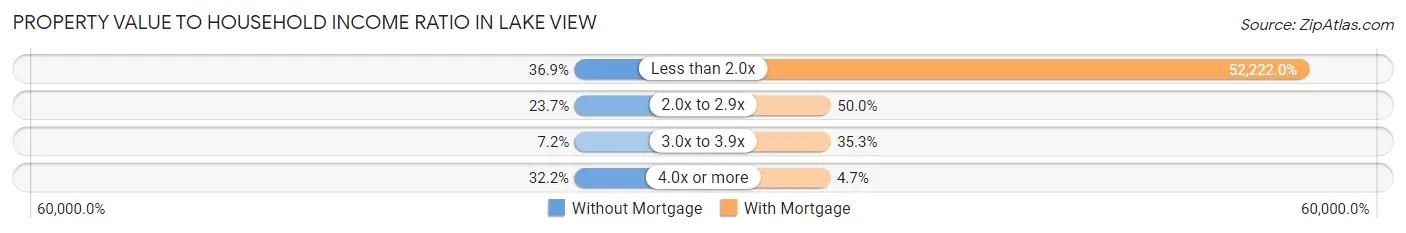
| Value-to-Income Ratio | Without Mortgage | With Mortgage |
| Less than 2.0x | 87 (36.9%) | 78,333 (52,222.0%) |
| 2.0x to 2.9x | 56 (23.7%) | 75 (50.0%) |
| 3.0x to 3.9x | 17 (7.2%) | 53 (35.3%) |
| 4.0x or more | 76 (32.2%) | 7 (4.7%) |
| Total | 236 (100.0%) | 150 (100.0%) |
Real Estate Taxes by Mortgage Status in Lake View
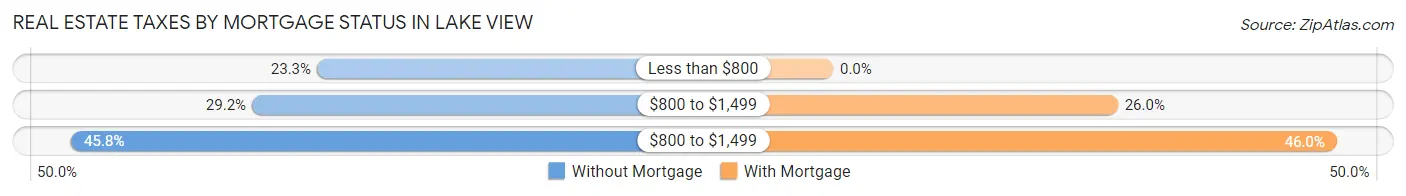
| Property Taxes | Without Mortgage | With Mortgage |
| Less than $800 | 55 (23.3%) | 0 (0.0%) |
| $800 to $1,499 | 69 (29.2%) | 39 (26.0%) |
| $800 to $1,499 | 108 (45.8%) | 69 (46.0%) |
| Total | 236 (100.0%) | 150 (100.0%) |
Health & Disability in Lake View
Health Insurance Coverage by Age in Lake View
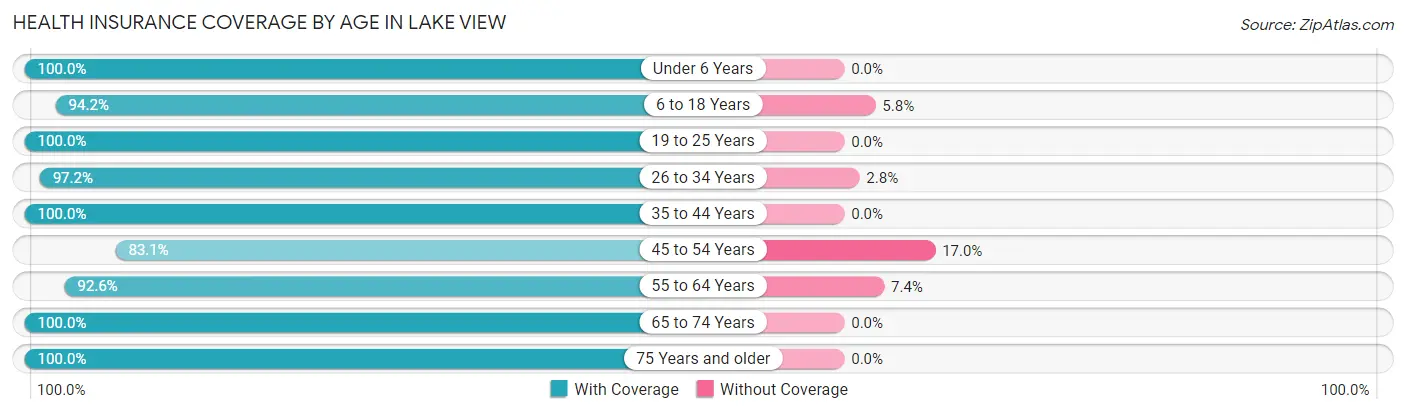
| Age Bracket | With Coverage | Without Coverage |
| Under 6 Years | 46 (100.0%) | 0 (0.0%) |
| 6 to 18 Years | 65 (94.2%) | 4 (5.8%) |
| 19 to 25 Years | 50 (100.0%) | 0 (0.0%) |
| 26 to 34 Years | 69 (97.2%) | 2 (2.8%) |
| 35 to 44 Years | 61 (100.0%) | 0 (0.0%) |
| 45 to 54 Years | 98 (83.1%) | 20 (17.0%) |
| 55 to 64 Years | 137 (92.6%) | 11 (7.4%) |
| 65 to 74 Years | 160 (100.0%) | 0 (0.0%) |
| 75 Years and older | 161 (100.0%) | 0 (0.0%) |
| Total | 847 (95.8%) | 37 (4.2%) |
Health Insurance Coverage by Citizenship Status in Lake View
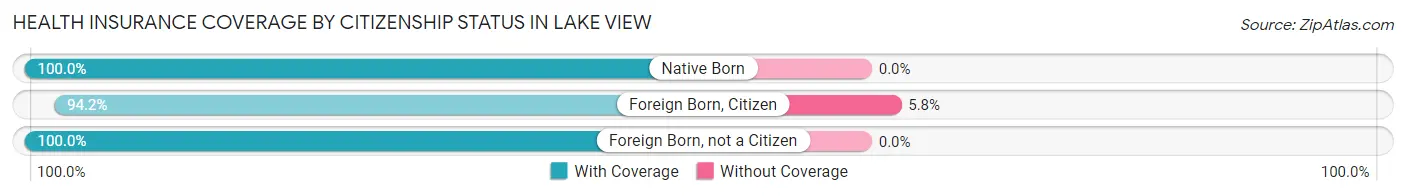
| Citizenship Status | With Coverage | Without Coverage |
| Native Born | 46 (100.0%) | 0 (0.0%) |
| Foreign Born, Citizen | 65 (94.2%) | 4 (5.8%) |
| Foreign Born, not a Citizen | 50 (100.0%) | 0 (0.0%) |
Health Insurance Coverage by Household Income in Lake View
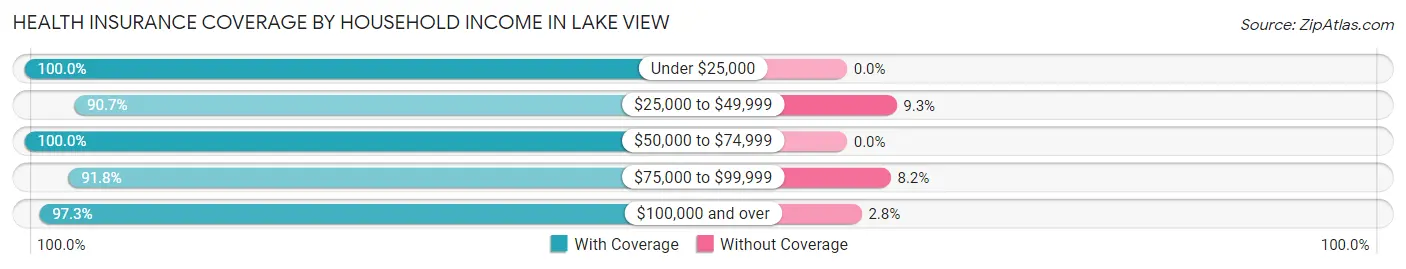
| Household Income | With Coverage | Without Coverage |
| Under $25,000 | 116 (100.0%) | 0 (0.0%) |
| $25,000 to $49,999 | 166 (90.7%) | 17 (9.3%) |
| $50,000 to $74,999 | 99 (100.0%) | 0 (0.0%) |
| $75,000 to $99,999 | 112 (91.8%) | 10 (8.2%) |
| $100,000 and over | 354 (97.3%) | 10 (2.8%) |
Public vs Private Health Insurance Coverage by Age in Lake View
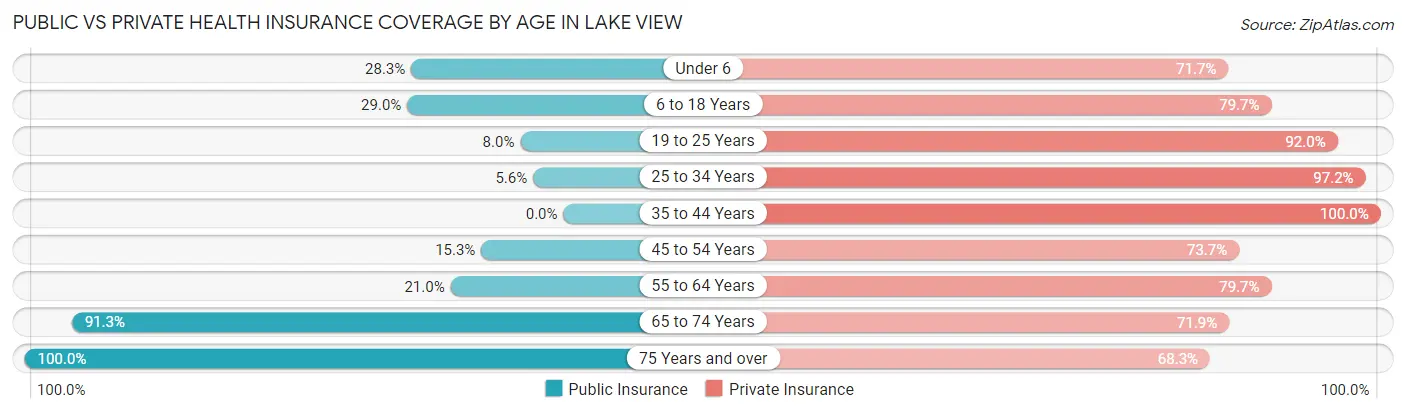
| Age Bracket | Public Insurance | Private Insurance |
| Under 6 | 13 (28.3%) | 33 (71.7%) |
| 6 to 18 Years | 20 (29.0%) | 55 (79.7%) |
| 19 to 25 Years | 4 (8.0%) | 46 (92.0%) |
| 25 to 34 Years | 4 (5.6%) | 69 (97.2%) |
| 35 to 44 Years | 0 (0.0%) | 61 (100.0%) |
| 45 to 54 Years | 18 (15.2%) | 87 (73.7%) |
| 55 to 64 Years | 31 (20.9%) | 118 (79.7%) |
| 65 to 74 Years | 146 (91.2%) | 115 (71.9%) |
| 75 Years and over | 161 (100.0%) | 110 (68.3%) |
| Total | 397 (44.9%) | 694 (78.5%) |
Disability Status by Sex by Age in Lake View
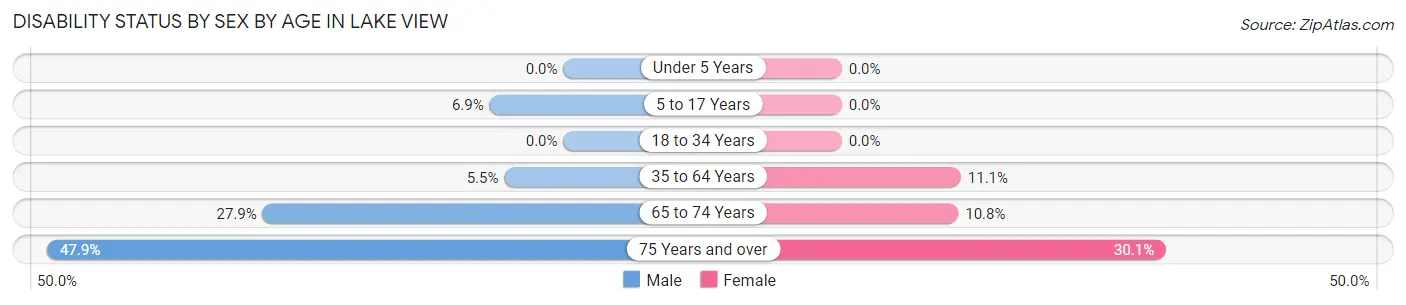
| Age Bracket | Male | Female |
| Under 5 Years | 0 (0.0%) | 0 (0.0%) |
| 5 to 17 Years | 5 (6.9%) | 0 (0.0%) |
| 18 to 34 Years | 0 (0.0%) | 0 (0.0%) |
| 35 to 64 Years | 8 (5.5%) | 20 (11.1%) |
| 65 to 74 Years | 24 (27.9%) | 8 (10.8%) |
| 75 Years and over | 23 (47.9%) | 34 (30.1%) |
Disability Class by Sex by Age in Lake View
Disability Class: Hearing Difficulty
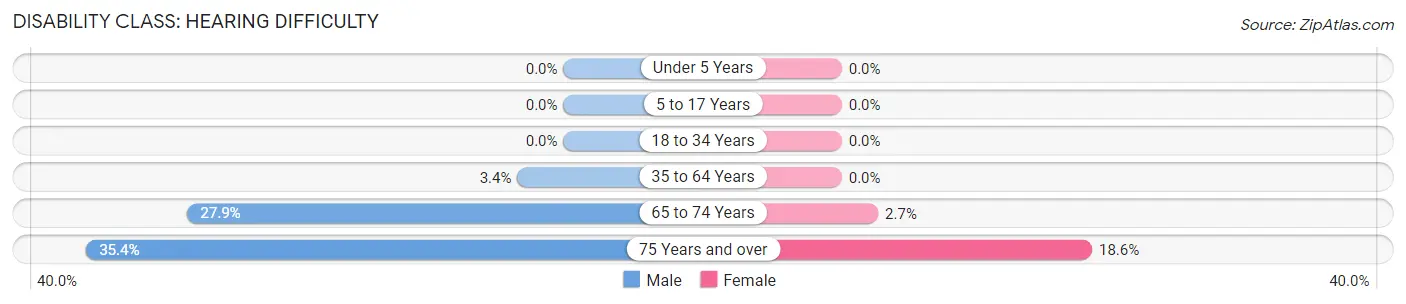
| Age Bracket | Male | Female |
| Under 5 Years | 0 (0.0%) | 0 (0.0%) |
| 5 to 17 Years | 0 (0.0%) | 0 (0.0%) |
| 18 to 34 Years | 0 (0.0%) | 0 (0.0%) |
| 35 to 64 Years | 5 (3.4%) | 0 (0.0%) |
| 65 to 74 Years | 24 (27.9%) | 2 (2.7%) |
| 75 Years and over | 17 (35.4%) | 21 (18.6%) |
Disability Class: Vision Difficulty
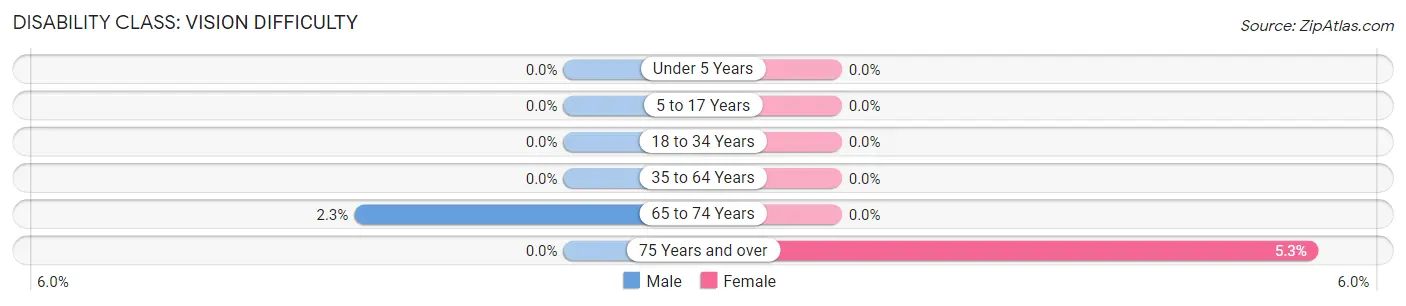
| Age Bracket | Male | Female |
| Under 5 Years | 0 (0.0%) | 0 (0.0%) |
| 5 to 17 Years | 0 (0.0%) | 0 (0.0%) |
| 18 to 34 Years | 0 (0.0%) | 0 (0.0%) |
| 35 to 64 Years | 0 (0.0%) | 0 (0.0%) |
| 65 to 74 Years | 2 (2.3%) | 0 (0.0%) |
| 75 Years and over | 0 (0.0%) | 6 (5.3%) |
Disability Class: Cognitive Difficulty
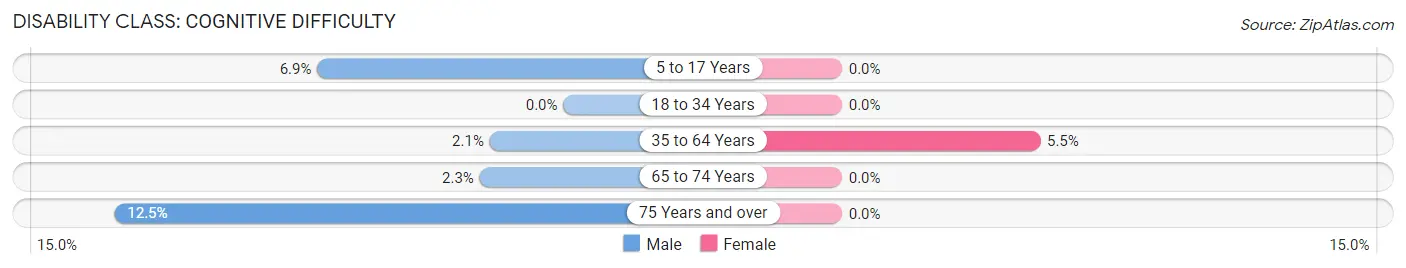
| Age Bracket | Male | Female |
| 5 to 17 Years | 5 (6.9%) | 0 (0.0%) |
| 18 to 34 Years | 0 (0.0%) | 0 (0.0%) |
| 35 to 64 Years | 3 (2.1%) | 10 (5.5%) |
| 65 to 74 Years | 2 (2.3%) | 0 (0.0%) |
| 75 Years and over | 6 (12.5%) | 0 (0.0%) |
Disability Class: Ambulatory Difficulty
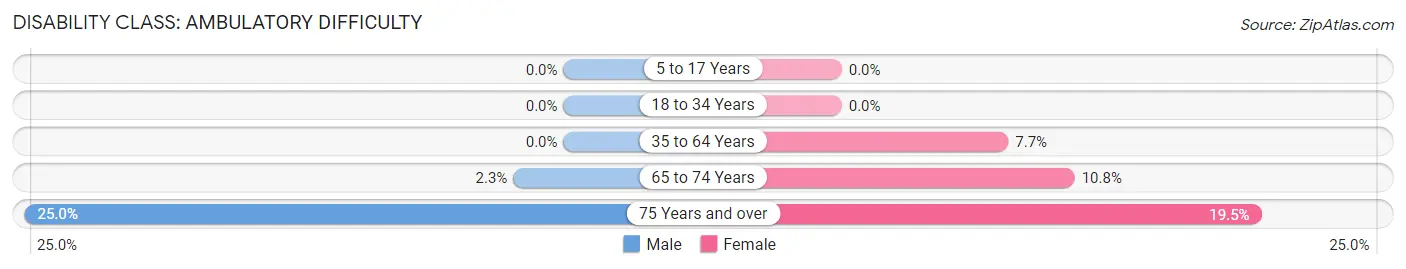
| Age Bracket | Male | Female |
| 5 to 17 Years | 0 (0.0%) | 0 (0.0%) |
| 18 to 34 Years | 0 (0.0%) | 0 (0.0%) |
| 35 to 64 Years | 0 (0.0%) | 14 (7.7%) |
| 65 to 74 Years | 2 (2.3%) | 8 (10.8%) |
| 75 Years and over | 12 (25.0%) | 22 (19.5%) |
Disability Class: Self-Care Difficulty
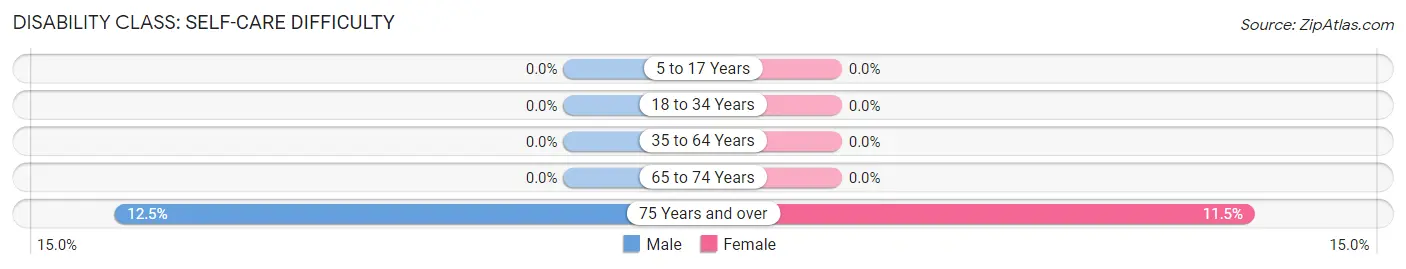
| Age Bracket | Male | Female |
| 5 to 17 Years | 0 (0.0%) | 0 (0.0%) |
| 18 to 34 Years | 0 (0.0%) | 0 (0.0%) |
| 35 to 64 Years | 0 (0.0%) | 0 (0.0%) |
| 65 to 74 Years | 0 (0.0%) | 0 (0.0%) |
| 75 Years and over | 6 (12.5%) | 13 (11.5%) |
Technology Access in Lake View
Computing Device Access in Lake View
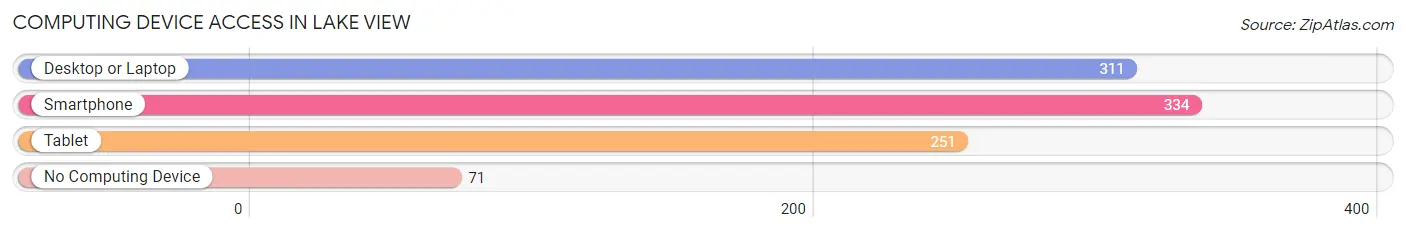
| Device Type | # Households | % Households |
| Desktop or Laptop | 311 | 67.5% |
| Smartphone | 334 | 72.5% |
| Tablet | 251 | 54.4% |
| No Computing Device | 71 | 15.4% |
| Total | 461 | 100.0% |
Internet Access in Lake View
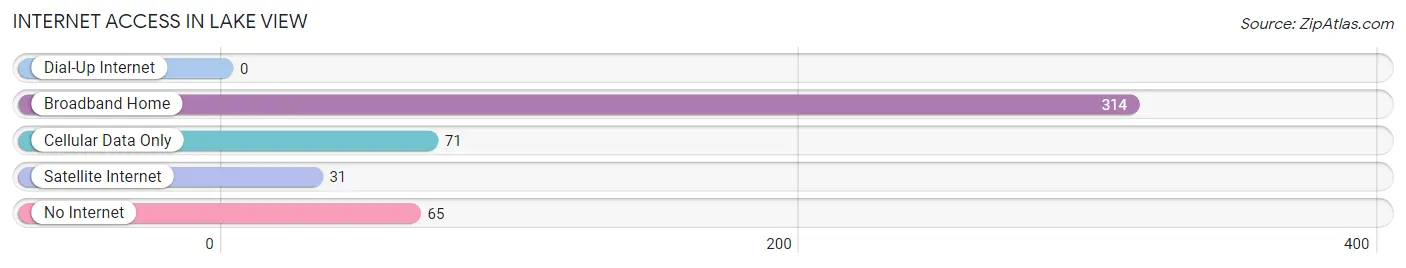
| Internet Type | # Households | % Households |
| Dial-Up Internet | 0 | 0.0% |
| Broadband Home | 314 | 68.1% |
| Cellular Data Only | 71 | 15.4% |
| Satellite Internet | 31 | 6.7% |
| No Internet | 65 | 14.1% |
| Total | 461 | 100.0% |
Lake View Summary
View, Iowa is a small town located in the northwest corner of the state, in the heart of the Midwest. It is situated in the rolling hills of the Loess Hills region, and is surrounded by farmland and small towns. The town was founded in 1856, and has a population of just over 500 people.
Geography
View, Iowa is located in the northwest corner of the state, in the heart of the Midwest. It is situated in the rolling hills of the Loess Hills region, and is surrounded by farmland and small towns. The town is located on the banks of the Little Sioux River, and is surrounded by the Loess Hills State Forest. The town is located at an elevation of 1,068 feet above sea level.
History
View, Iowa was founded in 1856 by a group of settlers from Ohio. The town was originally named “View” because of the beautiful views of the surrounding countryside. The town was incorporated in 1872, and the first post office was established in 1873. The town grew slowly, and by the turn of the century, it had a population of just over 500 people.
The town was a popular destination for tourists in the early 1900s, and the town was known for its beautiful views of the surrounding countryside. The town was also known for its excellent fishing, and the Little Sioux River was a popular spot for anglers.
In the 1950s, the town began to decline, as many of the residents moved away to larger cities. The town was hit hard by the Great Depression, and many of the businesses in town closed. The town was revitalized in the 1970s, when the town was designated as a National Historic District. The town has since become a popular tourist destination, and is known for its beautiful views and excellent fishing.
Economy
View, Iowa is a small town with a population of just over 500 people. The town’s economy is largely based on agriculture, and the town is home to several small farms. The town is also home to a few small businesses, including a grocery store, a hardware store, and a few restaurants. The town is also home to a few small manufacturing companies, and the town is home to a few small industrial parks.
Demographics
View, Iowa has a population of just over 500 people, and the town is predominantly white. The median age of the town is 44.7 years, and the median household income is $45,000. The town has a low unemployment rate, and the town is home to a few small businesses.
Conclusion
View, Iowa is a small town located in the northwest corner of the state, in the heart of the Midwest. The town was founded in 1856, and has a population of just over 500 people. The town is situated in the rolling hills of the Loess Hills region, and is surrounded by farmland and small towns. The town’s economy is largely based on agriculture, and the town is home to several small farms. The town is also home to a few small businesses, and the town is home to a few small industrial parks. The town is predominantly white, and the median age of the town is 44.7 years. View, Iowa is a small town with a rich history and a bright future.
Common Questions
What is Per Capita Income in Lake View?
Per Capita income in Lake View is $45,253.
What is the Median Family Income in Lake View?
Median Family Income in Lake View is $86,250.
What is the Median Household income in Lake View?
Median Household Income in Lake View is $63,472.
What is Income or Wage Gap in Lake View?
Income or Wage Gap in Lake View is 21.8%.
Women in Lake View earn 78.2 cents for every dollar earned by a man.
What is Inequality or Gini Index in Lake View?
Inequality or Gini Index in Lake View is 0.49.
What is the Total Population of Lake View?
Total Population of Lake View is 920.
What is the Total Male Population of Lake View?
Total Male Population of Lake View is 424.
What is the Total Female Population of Lake View?
Total Female Population of Lake View is 496.
What is the Ratio of Males per 100 Females in Lake View?
There are 85.48 Males per 100 Females in Lake View.
What is the Ratio of Females per 100 Males in Lake View?
There are 116.98 Females per 100 Males in Lake View.
What is the Median Population Age in Lake View?
Median Population Age in Lake View is 57.8 Years.
What is the Average Family Size in Lake View
Average Family Size in Lake View is 2.3 People.
What is the Average Household Size in Lake View
Average Household Size in Lake View is 1.9 People.
How Large is the Labor Force in Lake View?
There are 453 People in the Labor Forcein in Lake View.
What is the Percentage of People in the Labor Force in Lake View?
55.8% of People are in the Labor Force in Lake View.
What is the Unemployment Rate in Lake View?
Unemployment Rate in Lake View is 1.5%.