Dyersville, IA Map & Demographics
Dyersville Map
Dyersville Overview
$39,088
PER CAPITA INCOME
$91,094
AVG FAMILY INCOME
$71,571
AVG HOUSEHOLD INCOME
33.4%
WAGE / INCOME GAP [ % ]
66.6¢/ $1
WAGE / INCOME GAP [ $ ]
0.41
INEQUALITY / GINI INDEX
4,318
TOTAL POPULATION
2,171
MALE POPULATION
2,147
FEMALE POPULATION
101.12
MALES / 100 FEMALES
98.89
FEMALES / 100 MALES
42.1
MEDIAN AGE
3.0
AVG FAMILY SIZE
2.4
AVG HOUSEHOLD SIZE
2,392
LABOR FORCE [ PEOPLE ]
70.2%
PERCENT IN LABOR FORCE
3.1%
UNEMPLOYMENT RATE
Dyersville Zip Codes
Dyersville Area Codes
Income in Dyersville
Income Overview in Dyersville
Per Capita Income in Dyersville is $39,088, while median incomes of families and households are $91,094 and $71,571 respectively.
| Characteristic | Number | Measure |
| Per Capita Income | 4,318 | $39,088 |
| Median Family Income | 1,177 | $91,094 |
| Mean Family Income | 1,177 | $104,096 |
| Median Household Income | 1,756 | $71,571 |
| Mean Household Income | 1,756 | $93,621 |
| Income Deficit | 1,177 | $0 |
| Wage / Income Gap (%) | 4,318 | 33.40% |
| Wage / Income Gap ($) | 4,318 | 66.60¢ per $1 |
| Gini / Inequality Index | 4,318 | 0.41 |
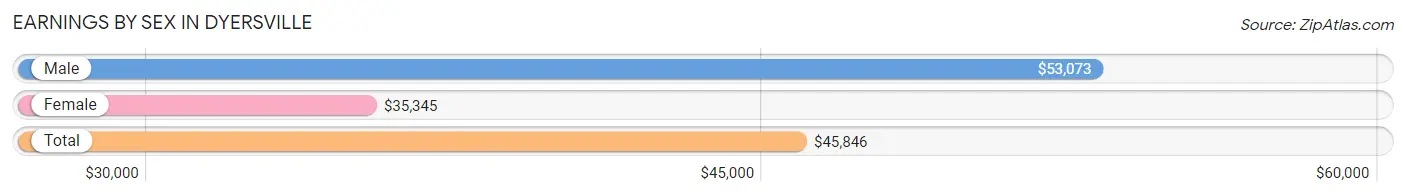
Earnings by Sex in Dyersville
Average Earnings in Dyersville are $45,846, $53,073 for men and $35,345 for women, a difference of 33.4%.
| Sex | Number | Average Earnings |
| Male | 1,272 (51.2%) | $53,073 |
| Female | 1,210 (48.7%) | $35,345 |
| Total | 2,482 (100.0%) | $45,846 |
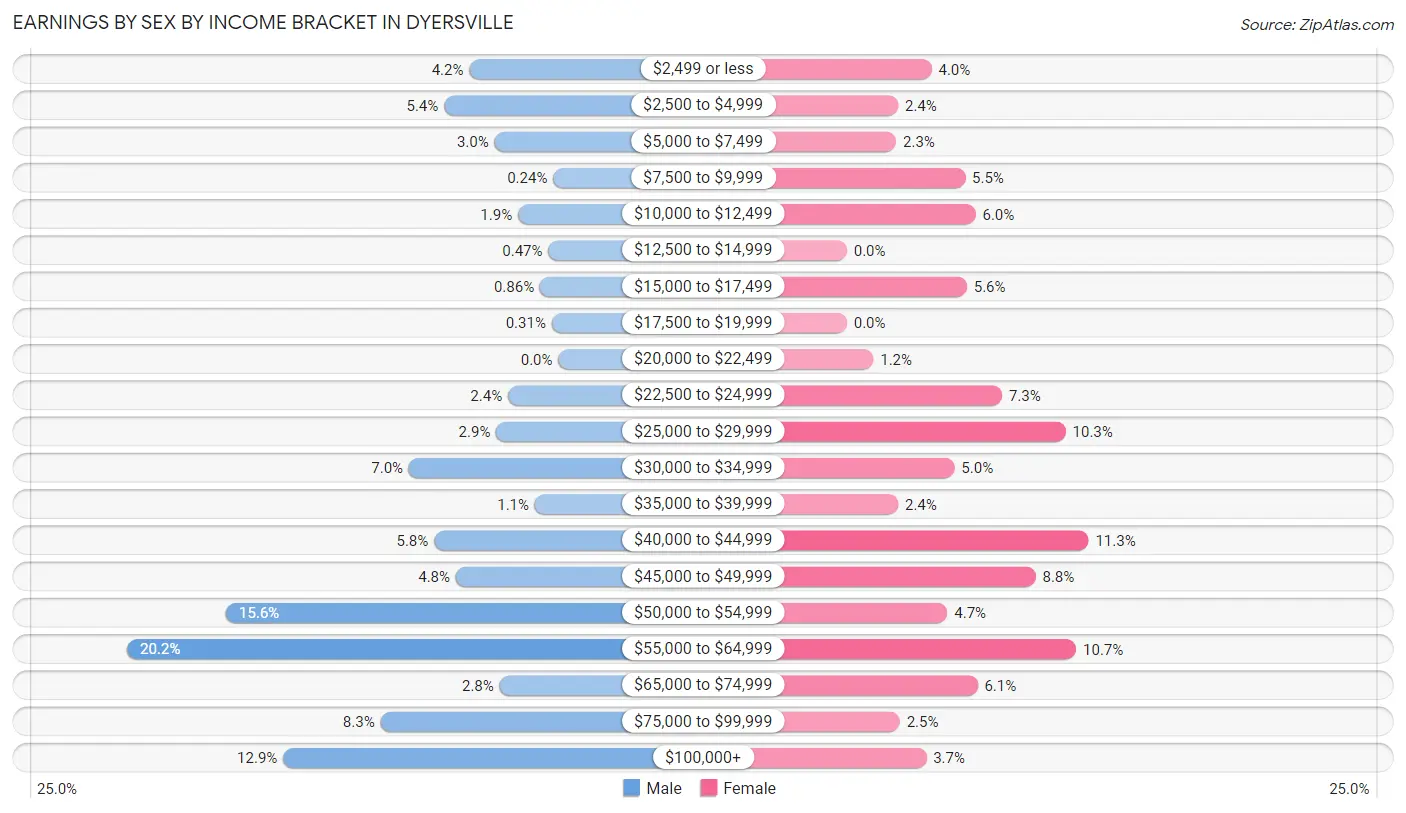
Earnings by Sex by Income Bracket in Dyersville
The most common earnings brackets in Dyersville are $55,000 to $64,999 for men (257 | 20.2%) and $40,000 to $44,999 for women (137 | 11.3%).
| Income | Male | Female |
| $2,499 or less | 53 (4.2%) | 48 (4.0%) |
| $2,500 to $4,999 | 68 (5.3%) | 29 (2.4%) |
| $5,000 to $7,499 | 38 (3.0%) | 28 (2.3%) |
| $7,500 to $9,999 | 3 (0.2%) | 67 (5.5%) |
| $10,000 to $12,499 | 24 (1.9%) | 73 (6.0%) |
| $12,500 to $14,999 | 6 (0.5%) | 0 (0.0%) |
| $15,000 to $17,499 | 11 (0.9%) | 68 (5.6%) |
| $17,500 to $19,999 | 4 (0.3%) | 0 (0.0%) |
| $20,000 to $22,499 | 0 (0.0%) | 15 (1.2%) |
| $22,500 to $24,999 | 30 (2.4%) | 88 (7.3%) |
| $25,000 to $29,999 | 37 (2.9%) | 124 (10.2%) |
| $30,000 to $34,999 | 89 (7.0%) | 61 (5.0%) |
| $35,000 to $39,999 | 14 (1.1%) | 29 (2.4%) |
| $40,000 to $44,999 | 74 (5.8%) | 137 (11.3%) |
| $45,000 to $49,999 | 61 (4.8%) | 107 (8.8%) |
| $50,000 to $54,999 | 198 (15.6%) | 57 (4.7%) |
| $55,000 to $64,999 | 257 (20.2%) | 130 (10.7%) |
| $65,000 to $74,999 | 35 (2.8%) | 74 (6.1%) |
| $75,000 to $99,999 | 106 (8.3%) | 30 (2.5%) |
| $100,000+ | 164 (12.9%) | 45 (3.7%) |
| Total | 1,272 (100.0%) | 1,210 (100.0%) |
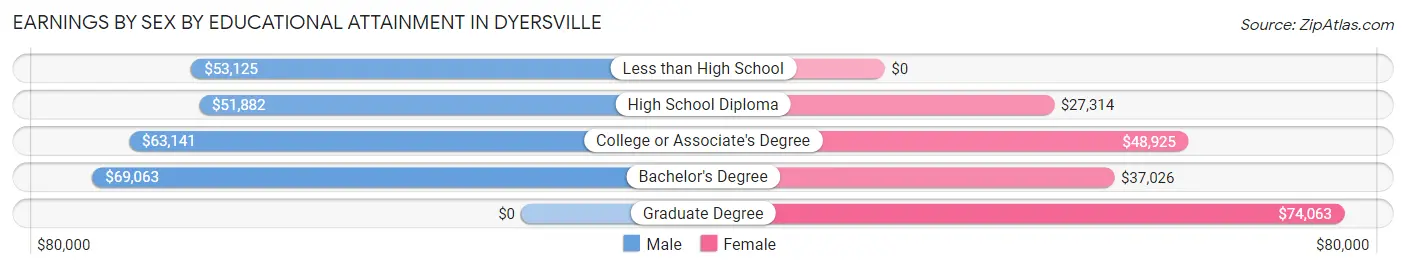
Earnings by Sex by Educational Attainment in Dyersville
Average earnings in Dyersville are $56,141 for men and $41,288 for women, a difference of 26.5%. Men with an educational attainment of bachelor's degree enjoy the highest average annual earnings of $69,063, while those with high school diploma education earn the least with $51,882. Women with an educational attainment of graduate degree earn the most with the average annual earnings of $74,063, while those with high school diploma education have the smallest earnings of $27,314.
| Educational Attainment | Male Income | Female Income |
| Less than High School | $53,125 | $0 |
| High School Diploma | $51,882 | $27,314 |
| College or Associate's Degree | $63,141 | $48,925 |
| Bachelor's Degree | $69,063 | $37,026 |
| Graduate Degree | - | - |
| Total | $56,141 | $41,288 |
Family Income in Dyersville
Family Income Brackets in Dyersville
According to the Dyersville family income data, there are 355 families falling into the $100,000 to $149,999 income range, which is the most common income bracket and makes up 30.2% of all families.
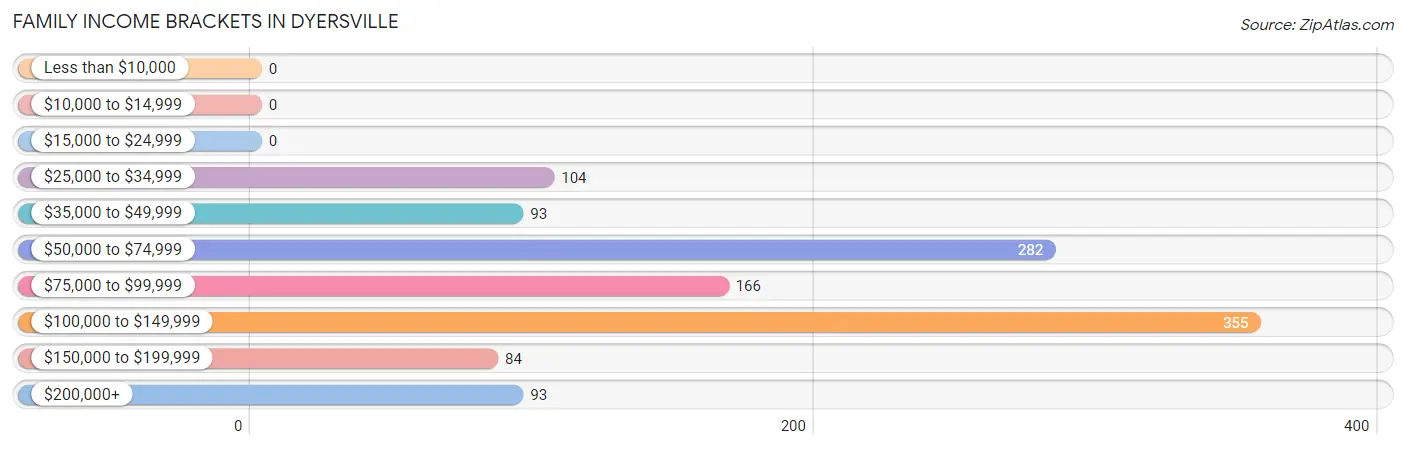
| Income Bracket | # Families | % Families |
| Less than $10,000 | 0 | 0.0% |
| $10,000 to $14,999 | 0 | 0.0% |
| $15,000 to $24,999 | 0 | 0.0% |
| $25,000 to $34,999 | 104 | 8.8% |
| $35,000 to $49,999 | 93 | 7.9% |
| $50,000 to $74,999 | 282 | 24.0% |
| $75,000 to $99,999 | 166 | 14.1% |
| $100,000 to $149,999 | 355 | 30.2% |
| $150,000 to $199,999 | 84 | 7.1% |
| $200,000+ | 93 | 7.9% |
Family Income by Famaliy Size in Dyersville
5-person families (152 | 12.9%) account for the highest median family income in Dyersville with $138,667 per family, while 2-person families (678 | 57.6%) have the highest median income of $42,500 per family member.
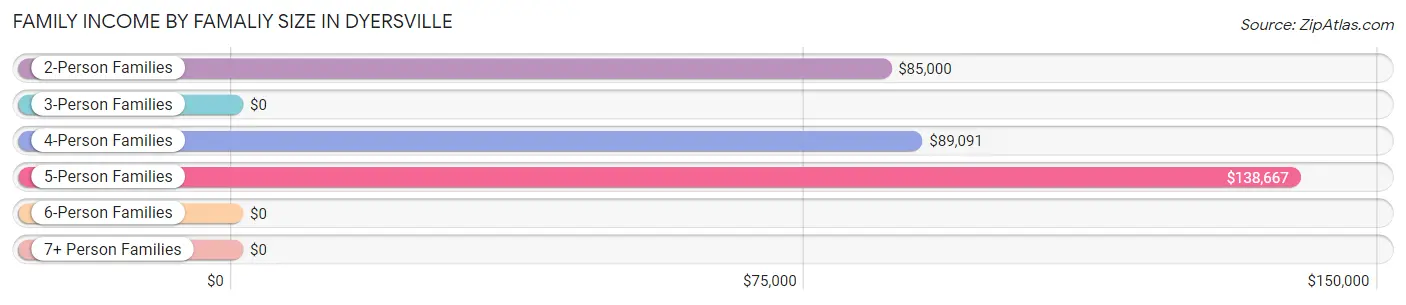
| Income Bracket | # Families | Median Income |
| 2-Person Families | 678 (57.6%) | $85,000 |
| 3-Person Families | 158 (13.4%) | $0 |
| 4-Person Families | 174 (14.8%) | $89,091 |
| 5-Person Families | 152 (12.9%) | $138,667 |
| 6-Person Families | 15 (1.3%) | $0 |
| 7+ Person Families | 0 (0.0%) | $0 |
| Total | 1,177 (100.0%) | $91,094 |
Family Income by Number of Earners in Dyersville
The median family income in Dyersville is $91,094, with families comprising 3+ earners (114) having the highest median family income of $135,000, while families with no earners (96) have the lowest median family income of $50,357, accounting for 9.7% and 8.2% of families, respectively.
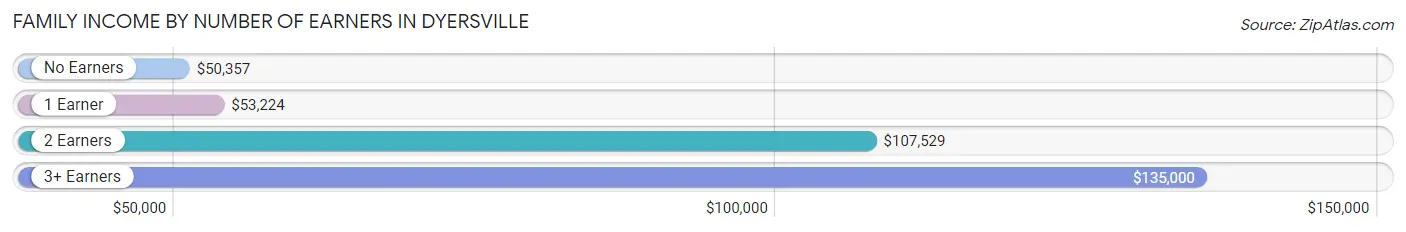
| Number of Earners | # Families | Median Income |
| No Earners | 96 (8.2%) | $50,357 |
| 1 Earner | 248 (21.1%) | $53,224 |
| 2 Earners | 719 (61.1%) | $107,529 |
| 3+ Earners | 114 (9.7%) | $135,000 |
| Total | 1,177 (100.0%) | $91,094 |
Household Income in Dyersville
Household Income Brackets in Dyersville
With 400 households falling in the category, the $50,000 to $74,999 income range is the most frequent in Dyersville, accounting for 22.8% of all households. In contrast, only 23 households (1.3%) fall into the less than $10,000 income bracket, making it the least populous group.
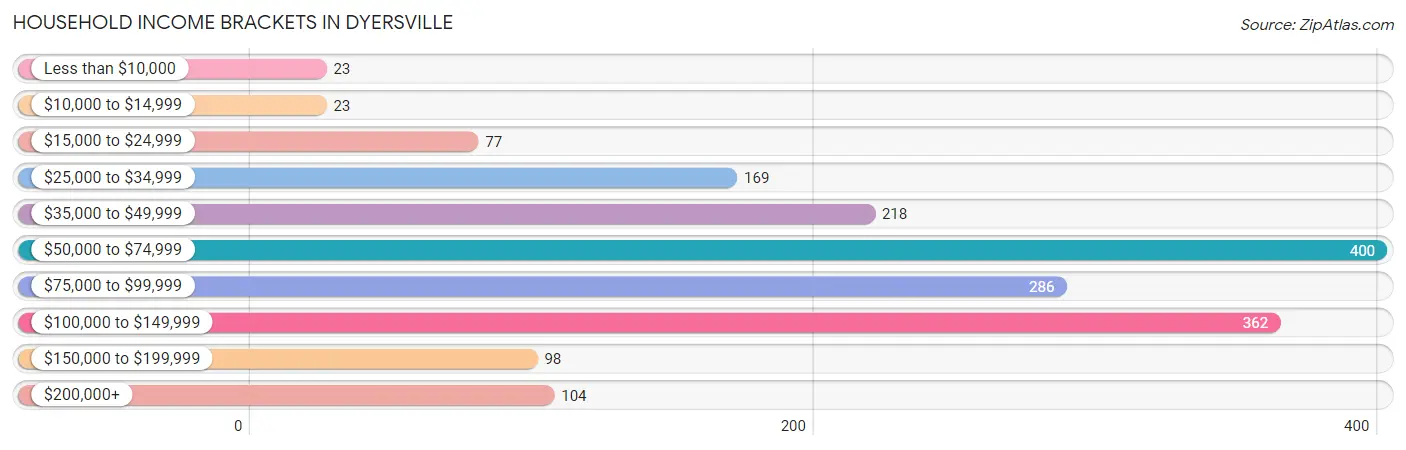
| Income Bracket | # Households | % Households |
| Less than $10,000 | 23 | 1.3% |
| $10,000 to $14,999 | 23 | 1.3% |
| $15,000 to $24,999 | 77 | 4.4% |
| $25,000 to $34,999 | 169 | 9.6% |
| $35,000 to $49,999 | 218 | 12.4% |
| $50,000 to $74,999 | 400 | 22.8% |
| $75,000 to $99,999 | 286 | 16.3% |
| $100,000 to $149,999 | 362 | 20.6% |
| $150,000 to $199,999 | 98 | 5.6% |
| $200,000+ | 104 | 5.9% |
Household Income by Householder Age in Dyersville
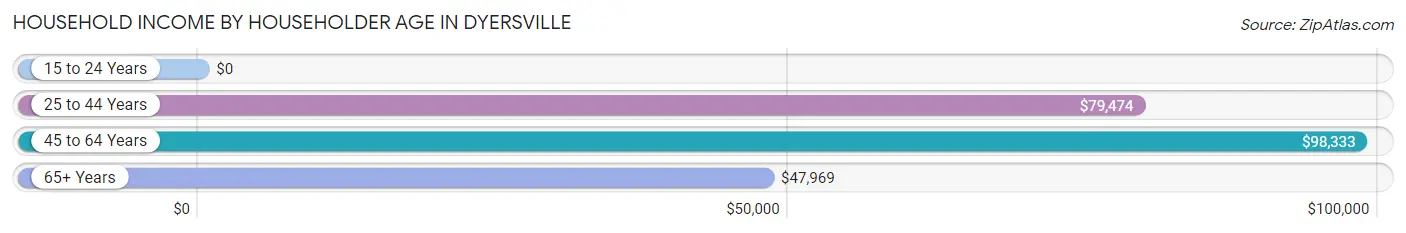
The median household income in Dyersville is $71,571, with the highest median household income of $98,333 found in the 45 to 64 years age bracket for the primary householder. A total of 660 households (37.6%) fall into this category. Meanwhile, the 15 to 24 years age bracket for the primary householder has the lowest median household income of $0, with 79 households (4.5%) in this group.
| Income Bracket | # Households | Median Income |
| 15 to 24 Years | 79 (4.5%) | $0 |
| 25 to 44 Years | 500 (28.5%) | $79,474 |
| 45 to 64 Years | 660 (37.6%) | $98,333 |
| 65+ Years | 517 (29.4%) | $47,969 |
| Total | 1,756 (100.0%) | $71,571 |
Poverty in Dyersville
Income Below Poverty by Sex and Age in Dyersville
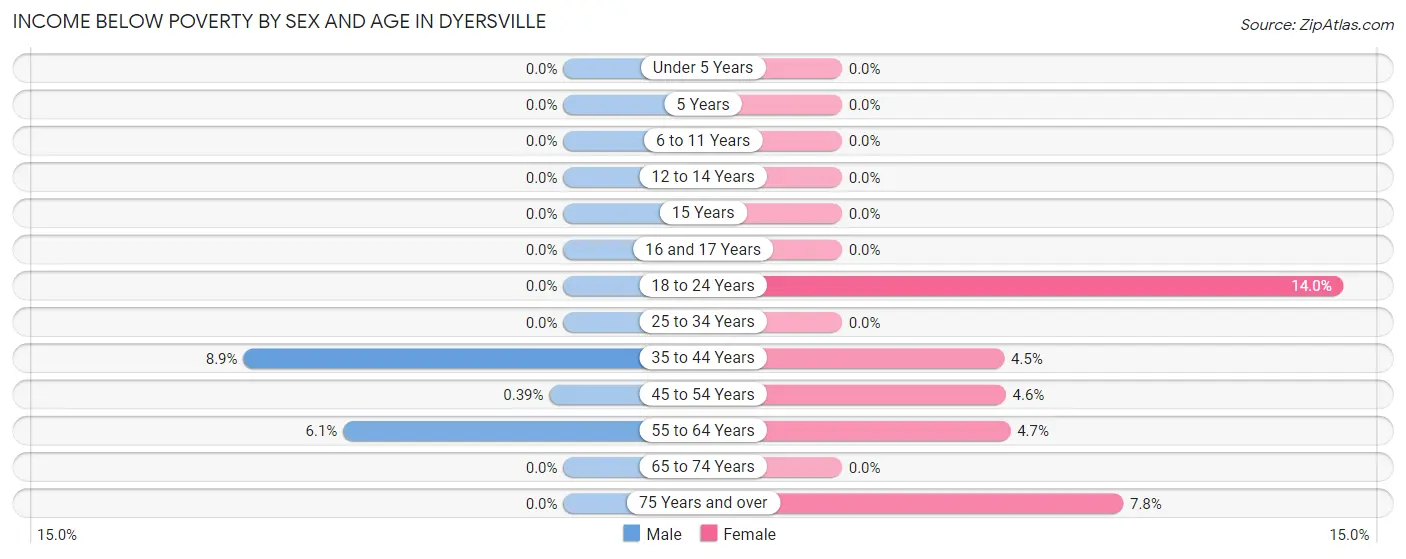
With 2.1% poverty level for males and 4.2% for females among the residents of Dyersville, 35 to 44 year old males and 18 to 24 year old females are the most vulnerable to poverty, with 23 males (8.9%) and 25 females (14.0%) in their respective age groups living below the poverty level.
| Age Bracket | Male | Female |
| Under 5 Years | 0 (0.0%) | 0 (0.0%) |
| 5 Years | 0 (0.0%) | 0 (0.0%) |
| 6 to 11 Years | 0 (0.0%) | 0 (0.0%) |
| 12 to 14 Years | 0 (0.0%) | 0 (0.0%) |
| 15 Years | 0 (0.0%) | 0 (0.0%) |
| 16 and 17 Years | 0 (0.0%) | 0 (0.0%) |
| 18 to 24 Years | 0 (0.0%) | 25 (14.0%) |
| 25 to 34 Years | 0 (0.0%) | 0 (0.0%) |
| 35 to 44 Years | 23 (8.9%) | 10 (4.5%) |
| 45 to 54 Years | 1 (0.4%) | 16 (4.6%) |
| 55 to 64 Years | 22 (6.1%) | 15 (4.7%) |
| 65 to 74 Years | 0 (0.0%) | 0 (0.0%) |
| 75 Years and over | 0 (0.0%) | 22 (7.8%) |
| Total | 46 (2.1%) | 88 (4.2%) |
Income Above Poverty by Sex and Age in Dyersville
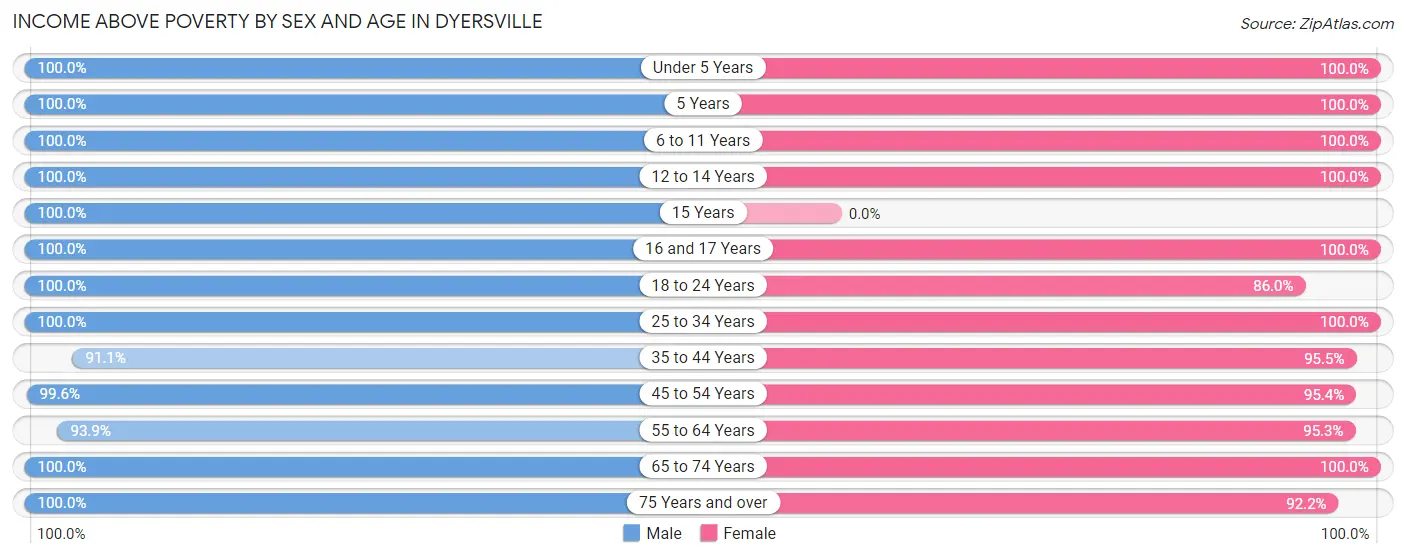
According to the poverty statistics in Dyersville, males aged under 5 years and females aged under 5 years are the age groups that are most secure financially, with 100.0% of males and 100.0% of females in these age groups living above the poverty line.
| Age Bracket | Male | Female |
| Under 5 Years | 164 (100.0%) | 174 (100.0%) |
| 5 Years | 36 (100.0%) | 9 (100.0%) |
| 6 to 11 Years | 215 (100.0%) | 150 (100.0%) |
| 12 to 14 Years | 100 (100.0%) | 45 (100.0%) |
| 15 Years | 17 (100.0%) | 0 (0.0%) |
| 16 and 17 Years | 145 (100.0%) | 12 (100.0%) |
| 18 to 24 Years | 136 (100.0%) | 154 (86.0%) |
| 25 to 34 Years | 209 (100.0%) | 185 (100.0%) |
| 35 to 44 Years | 235 (91.1%) | 211 (95.5%) |
| 45 to 54 Years | 255 (99.6%) | 335 (95.4%) |
| 55 to 64 Years | 337 (93.9%) | 305 (95.3%) |
| 65 to 74 Years | 138 (100.0%) | 175 (100.0%) |
| 75 Years and over | 138 (100.0%) | 259 (92.2%) |
| Total | 2,125 (97.9%) | 2,014 (95.8%) |
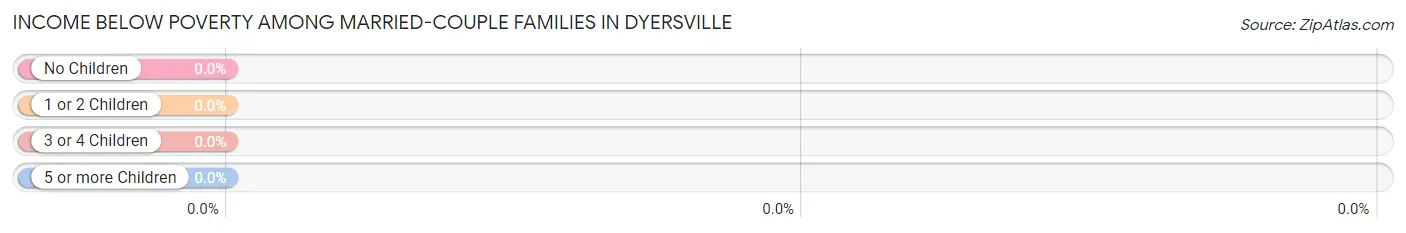
Income Below Poverty Among Married-Couple Families in Dyersville
| Children | Above Poverty | Below Poverty |
| No Children | 602 (100.0%) | 0 (0.0%) |
| 1 or 2 Children | 279 (100.0%) | 0 (0.0%) |
| 3 or 4 Children | 140 (100.0%) | 0 (0.0%) |
| 5 or more Children | 0 (0.0%) | 0 (0.0%) |
| Total | 1,021 (100.0%) | 0 (0.0%) |
Income Below Poverty Among Single-Parent Households in Dyersville
| Children | Single Father | Single Mother |
| No Children | 0 (0.0%) | 0 (0.0%) |
| 1 or 2 Children | 0 (0.0%) | 0 (0.0%) |
| 3 or 4 Children | 0 (0.0%) | 0 (0.0%) |
| 5 or more Children | 0 (0.0%) | 0 (0.0%) |
| Total | 0 (0.0%) | 0 (0.0%) |
Income Below Poverty Among Married-Couple vs Single-Parent Households in Dyersville
| Children | Married-Couple Families | Single-Parent Households |
| No Children | 0 (0.0%) | 0 (0.0%) |
| 1 or 2 Children | 0 (0.0%) | 0 (0.0%) |
| 3 or 4 Children | 0 (0.0%) | 0 (0.0%) |
| 5 or more Children | 0 (0.0%) | 0 (0.0%) |
| Total | 0 (0.0%) | 0 (0.0%) |
Race in Dyersville
The most populous races in Dyersville are White / Caucasian (3,943 | 91.3%), Hispanic or Latino (277 | 6.4%), and Some other Race (197 | 4.6%).
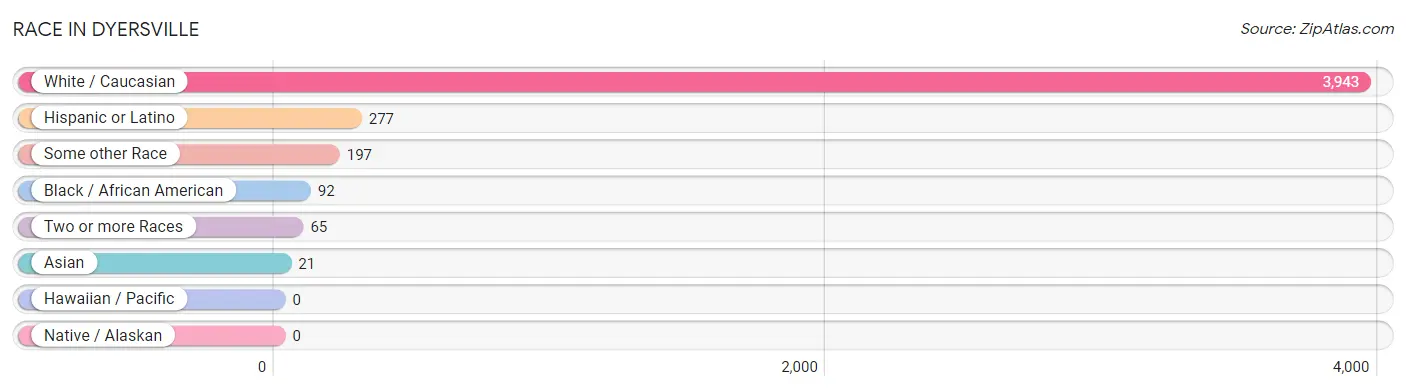
| Race | # Population | % Population |
| Asian | 21 | 0.5% |
| Black / African American | 92 | 2.1% |
| Hawaiian / Pacific | 0 | 0.0% |
| Hispanic or Latino | 277 | 6.4% |
| Native / Alaskan | 0 | 0.0% |
| White / Caucasian | 3,943 | 91.3% |
| Two or more Races | 65 | 1.5% |
| Some other Race | 197 | 4.6% |
| Total | 4,318 | 100.0% |
Ancestry in Dyersville
The most populous ancestries reported in Dyersville are German (2,654 | 61.5%), Irish (414 | 9.6%), American (295 | 6.8%), Mexican (170 | 3.9%), and English (141 | 3.3%), together accounting for 85.1% of all Dyersville residents.
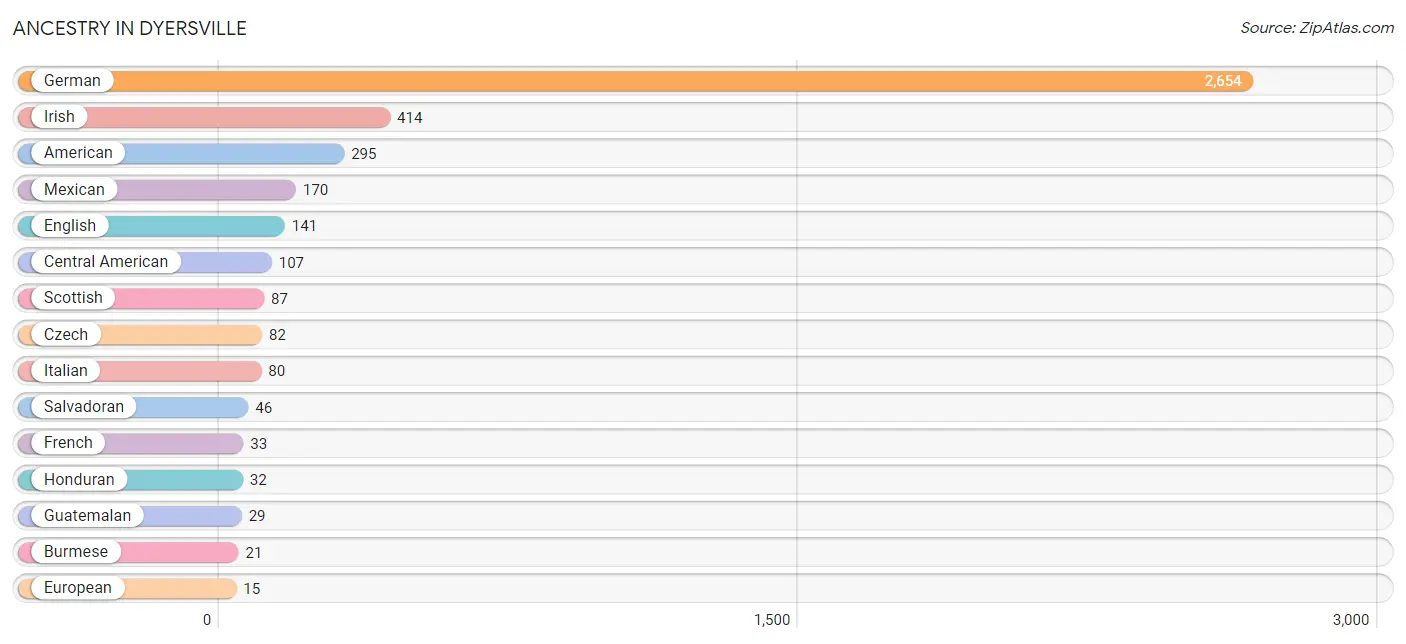
| Ancestry | # Population | % Population |
| American | 295 | 6.8% |
| Blackfeet | 4 | 0.1% |
| British | 11 | 0.3% |
| Burmese | 21 | 0.5% |
| Central American | 107 | 2.5% |
| Czech | 82 | 1.9% |
| Danish | 12 | 0.3% |
| Dutch | 11 | 0.3% |
| English | 141 | 3.3% |
| European | 15 | 0.4% |
| French | 33 | 0.8% |
| German | 2,654 | 61.5% |
| Guatemalan | 29 | 0.7% |
| Honduran | 32 | 0.7% |
| Hungarian | 11 | 0.3% |
| Irish | 414 | 9.6% |
| Italian | 80 | 1.8% |
| Mexican | 170 | 3.9% |
| Norwegian | 9 | 0.2% |
| Polish | 6 | 0.1% |
| Salvadoran | 46 | 1.1% |
| Scottish | 87 | 2.0% |
| Sioux | 4 | 0.1% |
| Swedish | 10 | 0.2% |
| Swiss | 10 | 0.2% | View All 25 Rows |
Immigrants in Dyersville
The most numerous immigrant groups reported in Dyersville came from Central America (126 | 2.9%), Latin America (126 | 2.9%), Mexico (63 | 1.5%), Honduras (32 | 0.7%), and Guatemala (22 | 0.5%), together accounting for 8.5% of all Dyersville residents.
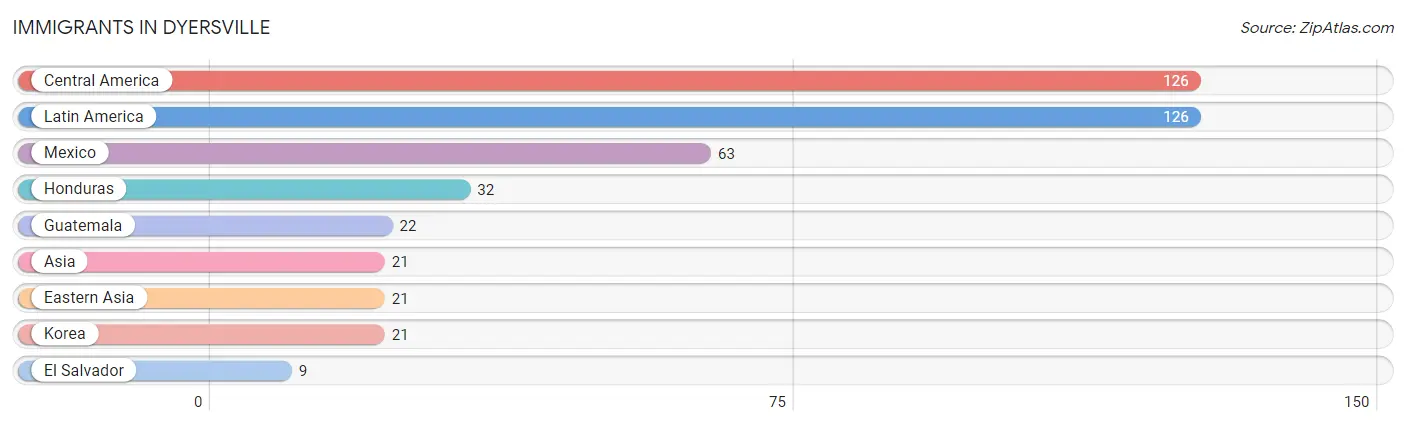
| Immigration Origin | # Population | % Population |
| Asia | 21 | 0.5% |
| Central America | 126 | 2.9% |
| Eastern Asia | 21 | 0.5% |
| El Salvador | 9 | 0.2% |
| Guatemala | 22 | 0.5% |
| Honduras | 32 | 0.7% |
| Korea | 21 | 0.5% |
| Latin America | 126 | 2.9% |
| Mexico | 63 | 1.5% | View All 9 Rows |
Sex and Age in Dyersville
Sex and Age in Dyersville
The most populous age groups in Dyersville are 55 to 59 Years (222 | 10.2%) for men and 60 to 64 Years (213 | 9.9%) for women.
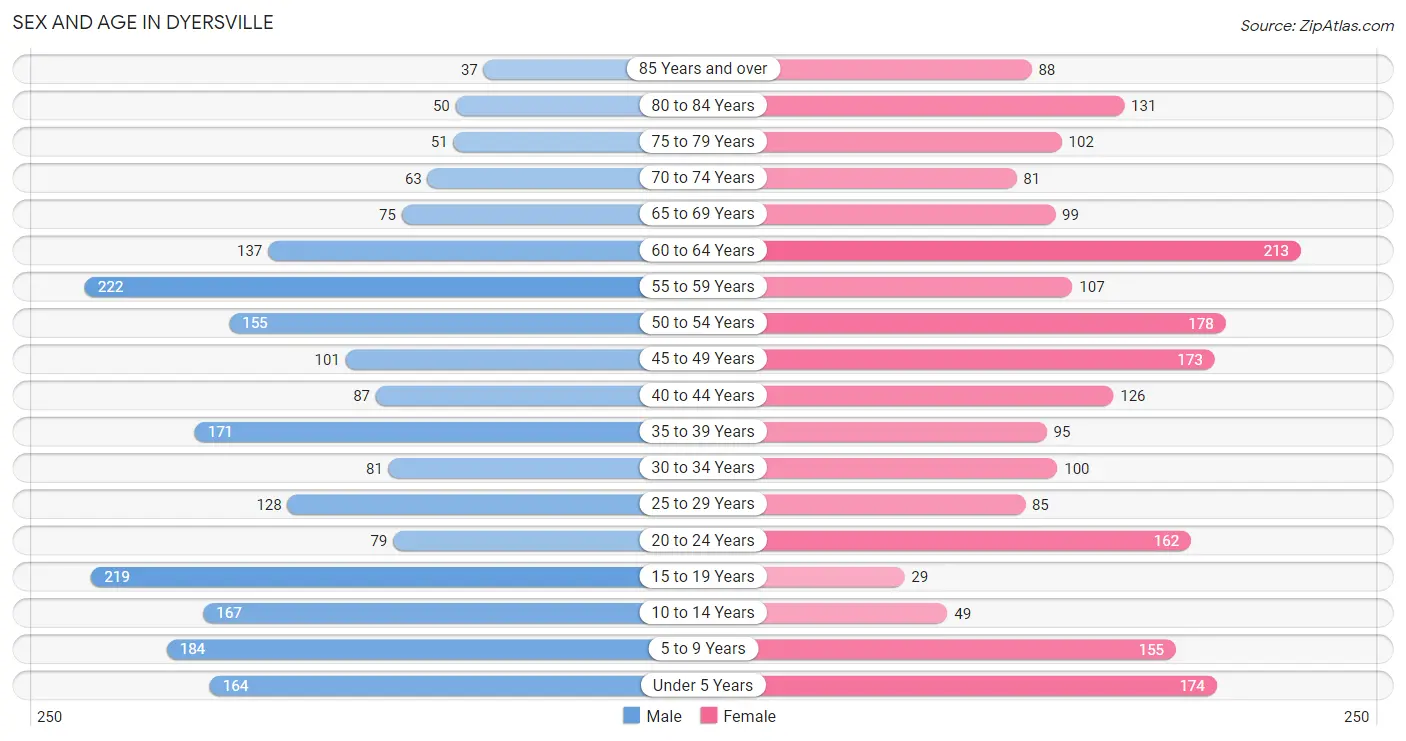
| Age Bracket | Male | Female |
| Under 5 Years | 164 (7.5%) | 174 (8.1%) |
| 5 to 9 Years | 184 (8.5%) | 155 (7.2%) |
| 10 to 14 Years | 167 (7.7%) | 49 (2.3%) |
| 15 to 19 Years | 219 (10.1%) | 29 (1.3%) |
| 20 to 24 Years | 79 (3.6%) | 162 (7.5%) |
| 25 to 29 Years | 128 (5.9%) | 85 (4.0%) |
| 30 to 34 Years | 81 (3.7%) | 100 (4.7%) |
| 35 to 39 Years | 171 (7.9%) | 95 (4.4%) |
| 40 to 44 Years | 87 (4.0%) | 126 (5.9%) |
| 45 to 49 Years | 101 (4.6%) | 173 (8.1%) |
| 50 to 54 Years | 155 (7.1%) | 178 (8.3%) |
| 55 to 59 Years | 222 (10.2%) | 107 (5.0%) |
| 60 to 64 Years | 137 (6.3%) | 213 (9.9%) |
| 65 to 69 Years | 75 (3.5%) | 99 (4.6%) |
| 70 to 74 Years | 63 (2.9%) | 81 (3.8%) |
| 75 to 79 Years | 51 (2.4%) | 102 (4.8%) |
| 80 to 84 Years | 50 (2.3%) | 131 (6.1%) |
| 85 Years and over | 37 (1.7%) | 88 (4.1%) |
| Total | 2,171 (100.0%) | 2,147 (100.0%) |
Families and Households in Dyersville
Median Family Size in Dyersville
The median family size in Dyersville is 2.99 persons per family, with married-couple families (1,021 | 86.8%) accounting for the largest median family size of 3.05 persons per family. On the other hand, single female/mother families (64 | 5.4%) represent the smallest median family size with 2.28 persons per family.
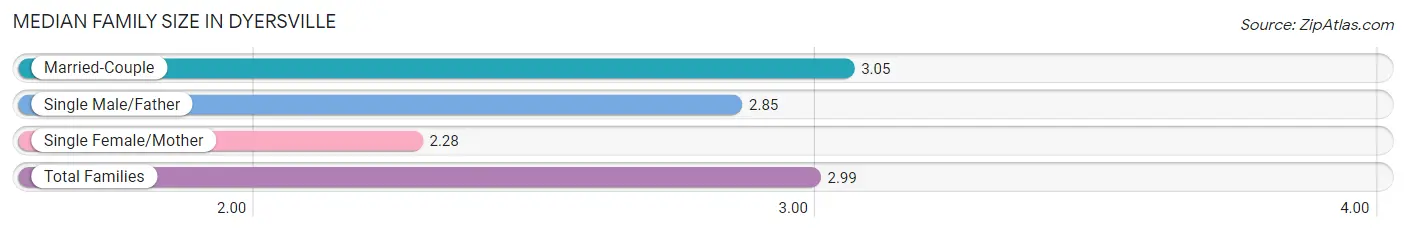
| Family Type | # Families | Family Size |
| Married-Couple | 1,021 (86.8%) | 3.05 |
| Single Male/Father | 92 (7.8%) | 2.85 |
| Single Female/Mother | 64 (5.4%) | 2.28 |
| Total Families | 1,177 (100.0%) | 2.99 |
Median Household Size in Dyersville
The median household size in Dyersville is 2.43 persons per household, with single male/father households (92 | 5.2%) accounting for the largest median household size of 3.87 persons per household. non-family households (579 | 33.0%) represent the smallest median household size with 1.13 persons per household.
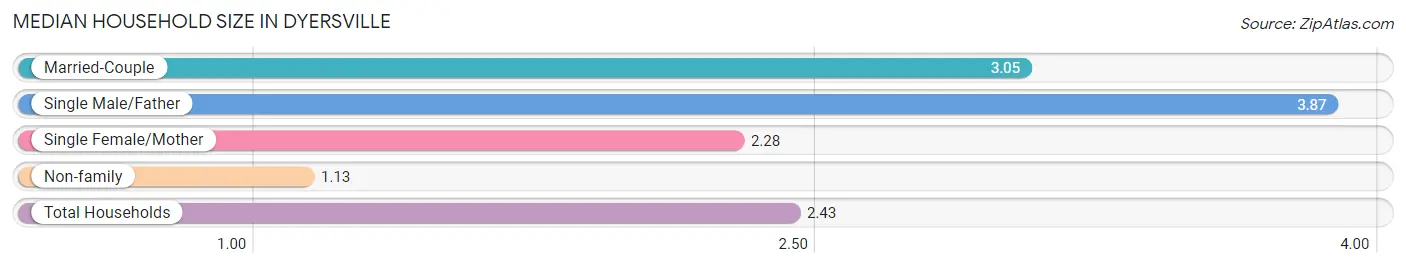
| Household Type | # Households | Household Size |
| Married-Couple | 1,021 (58.1%) | 3.05 |
| Single Male/Father | 92 (5.2%) | 3.87 |
| Single Female/Mother | 64 (3.6%) | 2.28 |
| Non-family | 579 (33.0%) | 1.13 |
| Total Households | 1,756 (100.0%) | 2.43 |
Household Size by Marriage Status in Dyersville
Out of a total of 1,756 households in Dyersville, 1,177 (67.0%) are family households, while 579 (33.0%) are nonfamily households. The most numerous type of family households are 2-person households, comprising 595, and the most common type of nonfamily households are 1-person households, comprising 516.
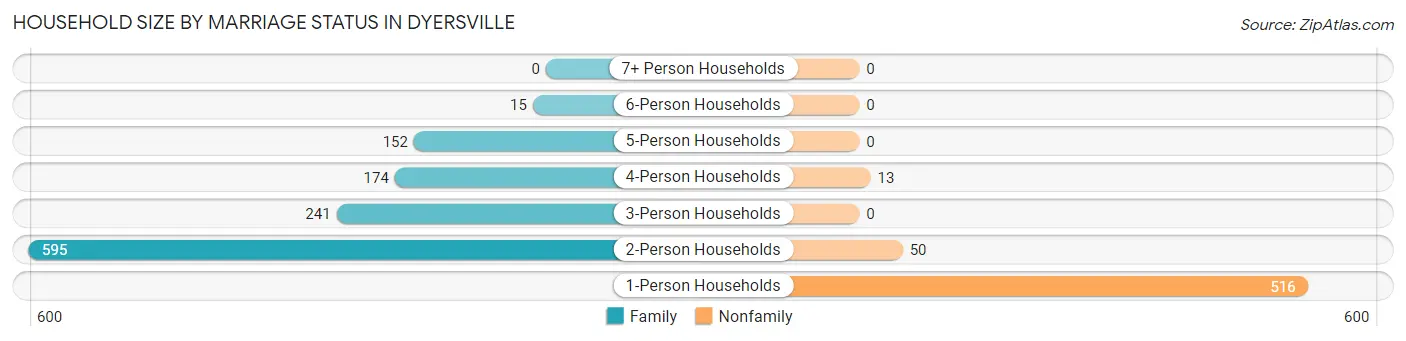
| Household Size | Family Households | Nonfamily Households |
| 1-Person Households | - | 516 (29.4%) |
| 2-Person Households | 595 (33.9%) | 50 (2.9%) |
| 3-Person Households | 241 (13.7%) | 0 (0.0%) |
| 4-Person Households | 174 (9.9%) | 13 (0.7%) |
| 5-Person Households | 152 (8.7%) | 0 (0.0%) |
| 6-Person Households | 15 (0.9%) | 0 (0.0%) |
| 7+ Person Households | 0 (0.0%) | 0 (0.0%) |
| Total | 1,177 (67.0%) | 579 (33.0%) |
Female Fertility in Dyersville
Fertility by Age in Dyersville
Average fertility rate in Dyersville is 92.0 births per 1,000 women. Women in the age bracket of 20 to 34 years have the highest fertility rate with 210.0 births per 1,000 women. Women in the age bracket of 20 to 34 years acount for 100.0% of all women with births.
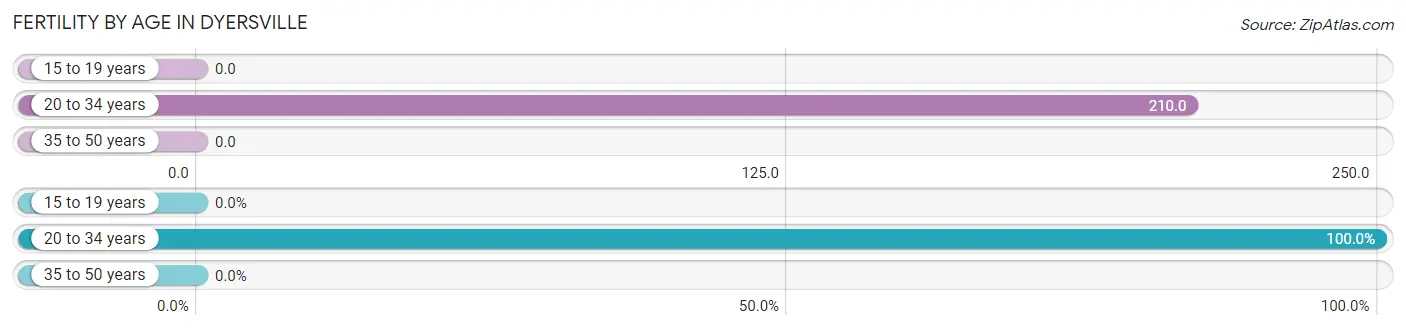
| Age Bracket | Women with Births | Births / 1,000 Women |
| 15 to 19 years | 0 (0.0%) | 0.0 |
| 20 to 34 years | 73 (100.0%) | 210.0 |
| 35 to 50 years | 0 (0.0%) | 0.0 |
| Total | 73 (100.0%) | 92.0 |
Fertility by Age by Marriage Status in Dyersville
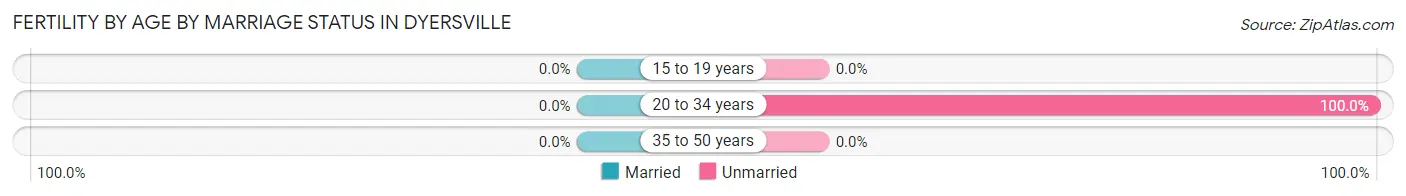
| Age Bracket | Married | Unmarried |
| 15 to 19 years | 0 (0.0%) | 0 (0.0%) |
| 20 to 34 years | 0 (0.0%) | 73 (100.0%) |
| 35 to 50 years | 0 (0.0%) | 0 (0.0%) |
| Total | 0 (0.0%) | 73 (100.0%) |
Fertility by Education in Dyersville
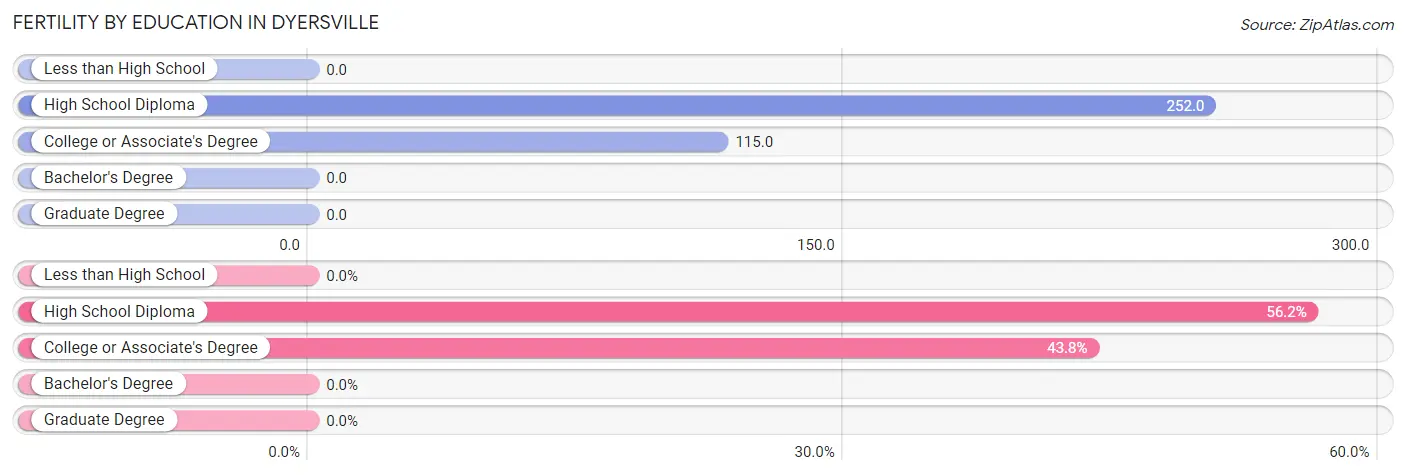
| Educational Attainment | Women with Births | Births / 1,000 Women |
| Less than High School | 0 (0.0%) | 0.0 |
| High School Diploma | 41 (56.2%) | 252.0 |
| College or Associate's Degree | 32 (43.8%) | 115.0 |
| Bachelor's Degree | 0 (0.0%) | 0.0 |
| Graduate Degree | 0 (0.0%) | 0.0 |
| Total | 73 (100.0%) | 92.0 |
Fertility by Education by Marriage Status in Dyersville
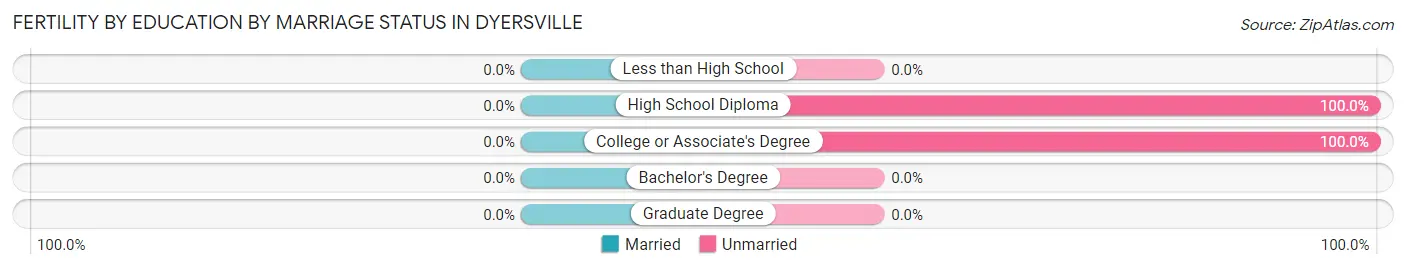
| Educational Attainment | Married | Unmarried |
| Less than High School | 0 (0.0%) | 0 (0.0%) |
| High School Diploma | 0 (0.0%) | 41 (100.0%) |
| College or Associate's Degree | 0 (0.0%) | 32 (100.0%) |
| Bachelor's Degree | 0 (0.0%) | 0 (0.0%) |
| Graduate Degree | 0 (0.0%) | 0 (0.0%) |
| Total | 0 (0.0%) | 73 (100.0%) |
Employment Characteristics in Dyersville
Employment by Class of Employer in Dyersville
Among the 2,319 employed individuals in Dyersville, private company employees (1,721 | 74.2%), not-for-profit organizations (176 | 7.6%), and local government employees (162 | 7.0%) make up the most common classes of employment.
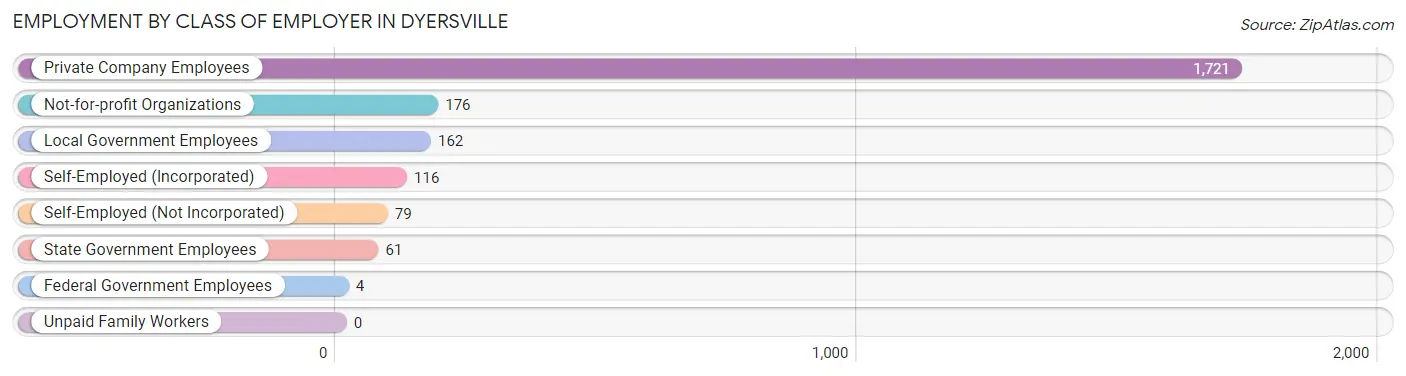
| Employer Class | # Employees | % Employees |
| Private Company Employees | 1,721 | 74.2% |
| Self-Employed (Incorporated) | 116 | 5.0% |
| Self-Employed (Not Incorporated) | 79 | 3.4% |
| Not-for-profit Organizations | 176 | 7.6% |
| Local Government Employees | 162 | 7.0% |
| State Government Employees | 61 | 2.6% |
| Federal Government Employees | 4 | 0.2% |
| Unpaid Family Workers | 0 | 0.0% |
| Total | 2,319 | 100.0% |
Employment Status by Age in Dyersville
According to the labor force statistics for Dyersville, out of the total population over 16 years of age (3,408), 70.2% or 2,392 individuals are in the labor force, with 3.1% or 74 of them unemployed. The age group with the highest labor force participation rate is 30 to 34 years, with 96.7% or 175 individuals in the labor force. Within the labor force, the 16 to 19 years age range has the highest percentage of unemployed individuals, with 35.6% or 64 of them being unemployed.
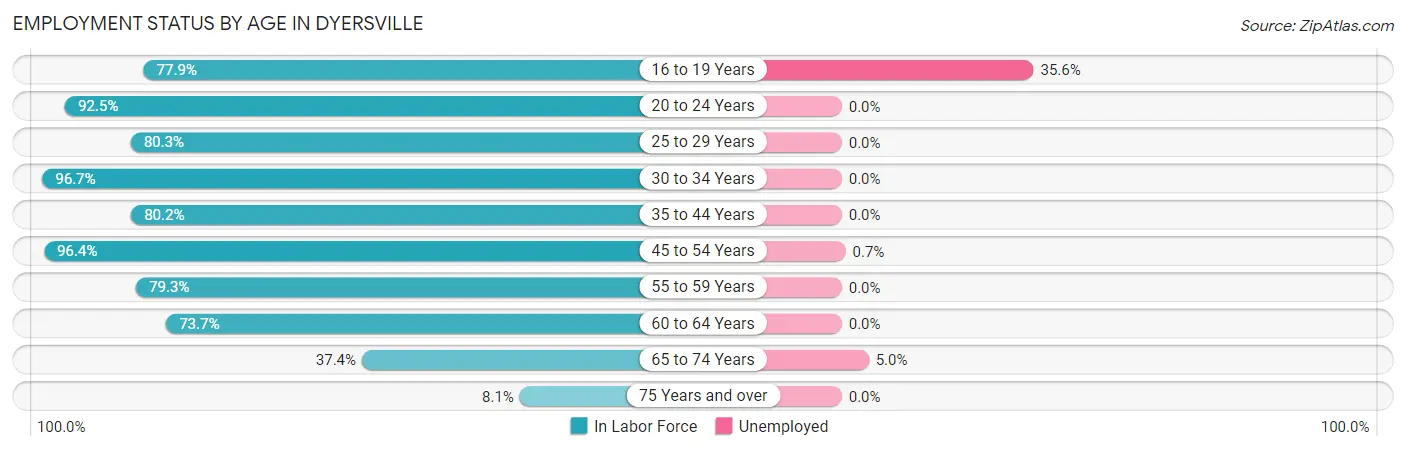
| Age Bracket | In Labor Force | Unemployed |
| 16 to 19 Years | 180 (77.9%) | 64 (35.6%) |
| 20 to 24 Years | 223 (92.5%) | 0 (0.0%) |
| 25 to 29 Years | 171 (80.3%) | 0 (0.0%) |
| 30 to 34 Years | 175 (96.7%) | 0 (0.0%) |
| 35 to 44 Years | 384 (80.2%) | 0 (0.0%) |
| 45 to 54 Years | 585 (96.4%) | 4 (0.7%) |
| 55 to 59 Years | 261 (79.3%) | 0 (0.0%) |
| 60 to 64 Years | 258 (73.7%) | 0 (0.0%) |
| 65 to 74 Years | 119 (37.4%) | 6 (5.0%) |
| 75 Years and over | 37 (8.1%) | 0 (0.0%) |
| Total | 2,392 (70.2%) | 74 (3.1%) |
Employment Status by Educational Attainment in Dyersville
According to labor force statistics for Dyersville, 84.9% of individuals (1,833) out of the total population between 25 and 64 years of age (2,159) are in the labor force, with 0.2% or 4 of them being unemployed. The group with the highest labor force participation rate are those with the educational attainment of bachelor's degree or higher, with 94.6% or 457 individuals in the labor force. Within the labor force, individuals with college / associate degree education have the highest percentage of unemployment, with 0.7% or 4 of them being unemployed.
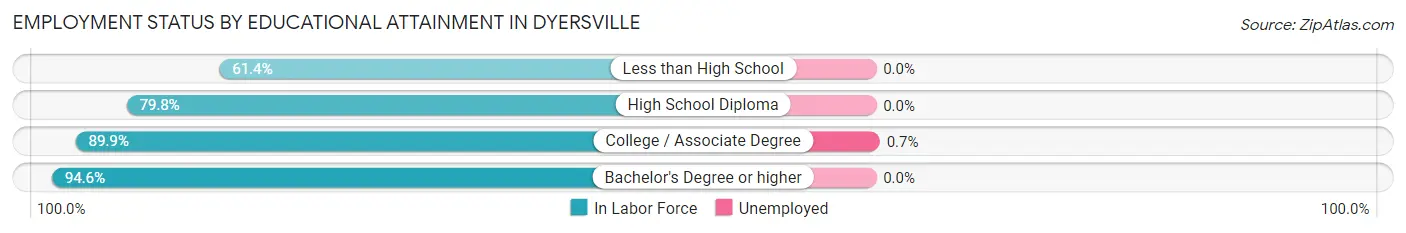
| Educational Attainment | In Labor Force | Unemployed |
| Less than High School | 89 (61.4%) | 0 (0.0%) |
| High School Diploma | 694 (79.8%) | 0 (0.0%) |
| College / Associate Degree | 594 (89.9%) | 5 (0.7%) |
| Bachelor's Degree or higher | 457 (94.6%) | 0 (0.0%) |
| Total | 1,833 (84.9%) | 4 (0.2%) |
Employment Occupations by Sex in Dyersville
Management, Business, Science and Arts Occupations
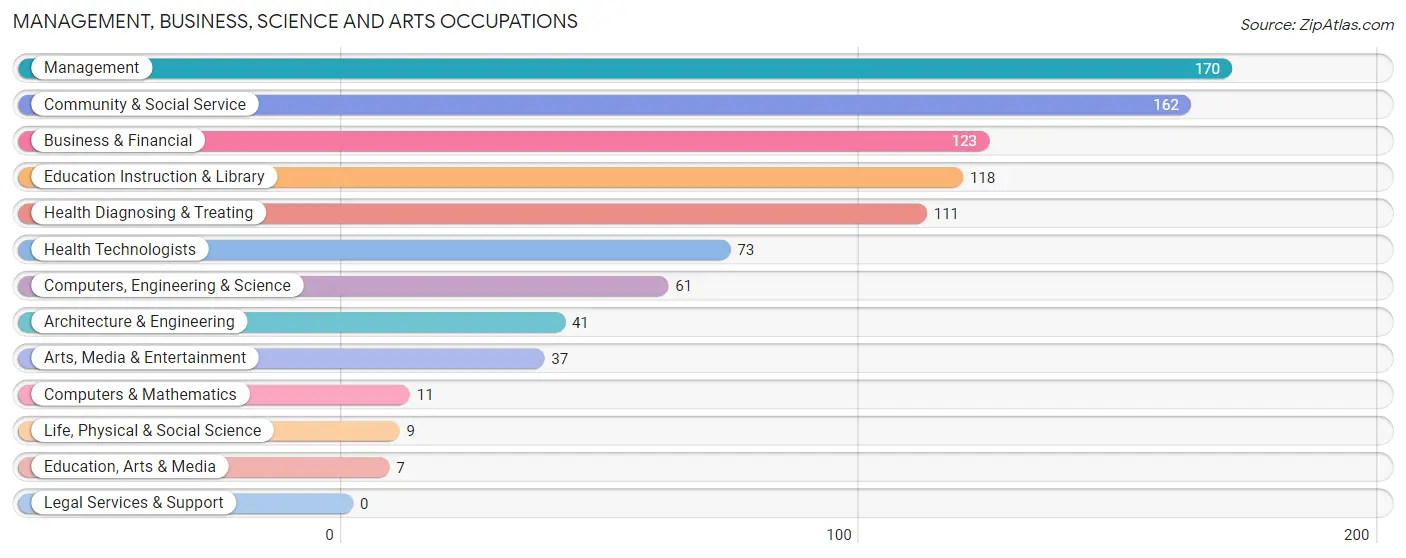
The most common Management, Business, Science and Arts occupations in Dyersville are Management (170 | 7.3%), Community & Social Service (162 | 7.0%), Business & Financial (123 | 5.3%), Education Instruction & Library (118 | 5.1%), and Health Diagnosing & Treating (111 | 4.8%).
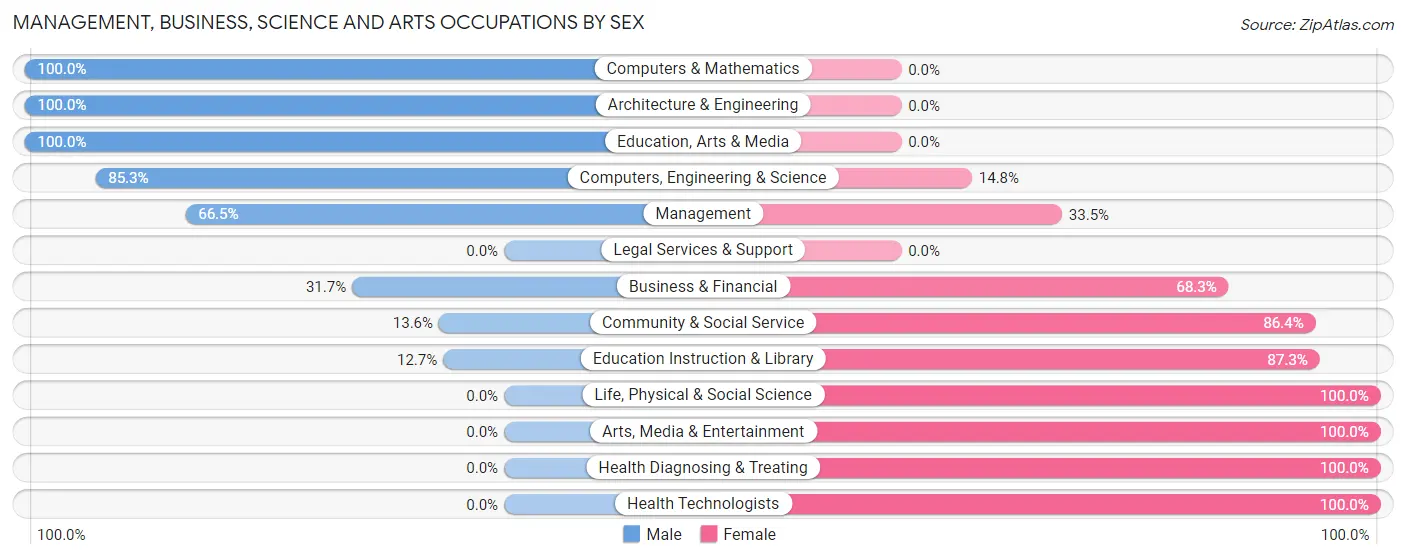
Management, Business, Science and Arts Occupations by Sex
Within the Management, Business, Science and Arts occupations in Dyersville, the most male-oriented occupations are Computers & Mathematics (100.0%), Architecture & Engineering (100.0%), and Education, Arts & Media (100.0%), while the most female-oriented occupations are Life, Physical & Social Science (100.0%), Arts, Media & Entertainment (100.0%), and Health Diagnosing & Treating (100.0%).
| Occupation | Male | Female |
| Management | 113 (66.5%) | 57 (33.5%) |
| Business & Financial | 39 (31.7%) | 84 (68.3%) |
| Computers, Engineering & Science | 52 (85.3%) | 9 (14.7%) |
| Computers & Mathematics | 11 (100.0%) | 0 (0.0%) |
| Architecture & Engineering | 41 (100.0%) | 0 (0.0%) |
| Life, Physical & Social Science | 0 (0.0%) | 9 (100.0%) |
| Community & Social Service | 22 (13.6%) | 140 (86.4%) |
| Education, Arts & Media | 7 (100.0%) | 0 (0.0%) |
| Legal Services & Support | 0 (0.0%) | 0 (0.0%) |
| Education Instruction & Library | 15 (12.7%) | 103 (87.3%) |
| Arts, Media & Entertainment | 0 (0.0%) | 37 (100.0%) |
| Health Diagnosing & Treating | 0 (0.0%) | 111 (100.0%) |
| Health Technologists | 0 (0.0%) | 73 (100.0%) |
| Total (Category) | 226 (36.0%) | 401 (64.0%) |
| Total (Overall) | 1,184 (51.1%) | 1,135 (48.9%) |
Services Occupations
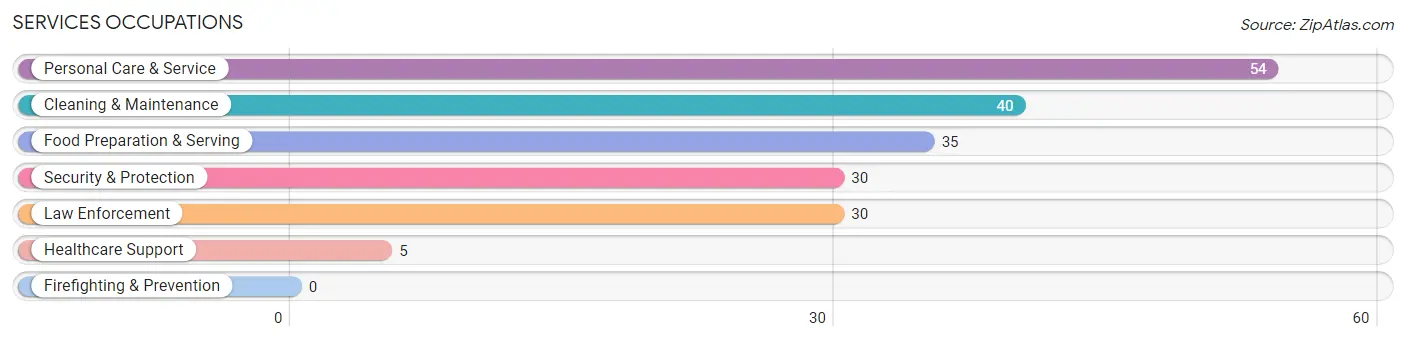
The most common Services occupations in Dyersville are Personal Care & Service (54 | 2.3%), Cleaning & Maintenance (40 | 1.7%), Food Preparation & Serving (35 | 1.5%), Security & Protection (30 | 1.3%), and Law Enforcement (30 | 1.3%).
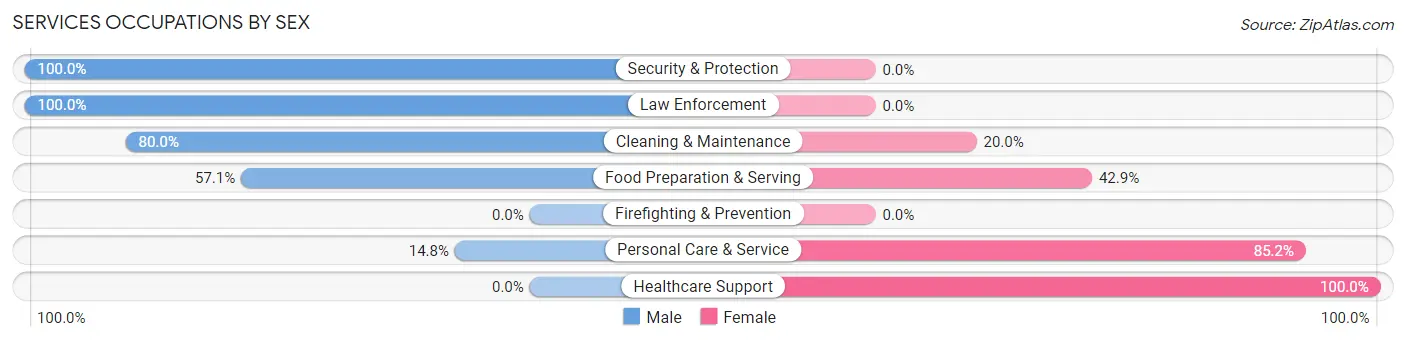
Services Occupations by Sex
Within the Services occupations in Dyersville, the most male-oriented occupations are Security & Protection (100.0%), Law Enforcement (100.0%), and Cleaning & Maintenance (80.0%), while the most female-oriented occupations are Healthcare Support (100.0%), Personal Care & Service (85.2%), and Food Preparation & Serving (42.9%).
| Occupation | Male | Female |
| Healthcare Support | 0 (0.0%) | 5 (100.0%) |
| Security & Protection | 30 (100.0%) | 0 (0.0%) |
| Firefighting & Prevention | 0 (0.0%) | 0 (0.0%) |
| Law Enforcement | 30 (100.0%) | 0 (0.0%) |
| Food Preparation & Serving | 20 (57.1%) | 15 (42.9%) |
| Cleaning & Maintenance | 32 (80.0%) | 8 (20.0%) |
| Personal Care & Service | 8 (14.8%) | 46 (85.2%) |
| Total (Category) | 90 (54.9%) | 74 (45.1%) |
| Total (Overall) | 1,184 (51.1%) | 1,135 (48.9%) |
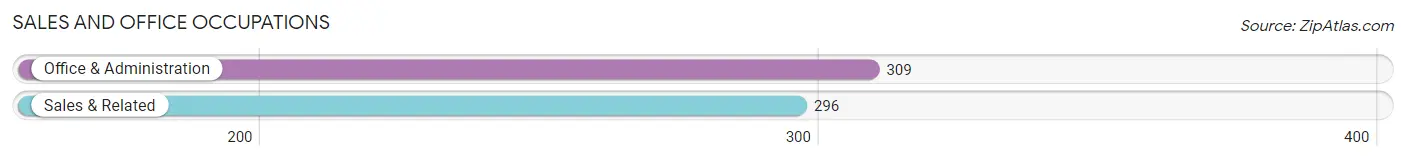
Sales and Office Occupations
The most common Sales and Office occupations in Dyersville are Office & Administration (309 | 13.3%), and Sales & Related (296 | 12.8%).
Sales and Office Occupations by Sex
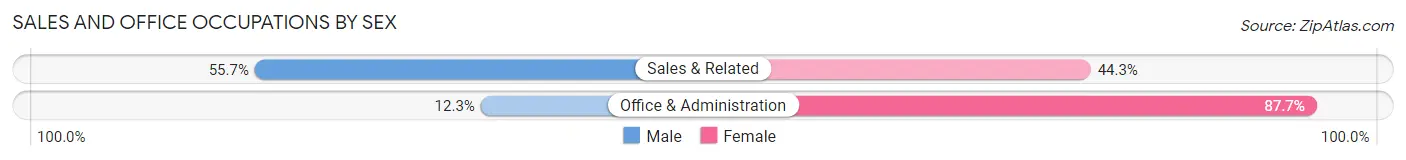
| Occupation | Male | Female |
| Sales & Related | 165 (55.7%) | 131 (44.3%) |
| Office & Administration | 38 (12.3%) | 271 (87.7%) |
| Total (Category) | 203 (33.6%) | 402 (66.4%) |
| Total (Overall) | 1,184 (51.1%) | 1,135 (48.9%) |
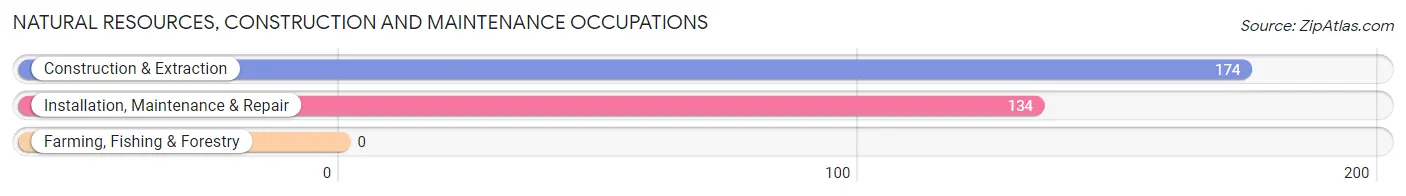
Natural Resources, Construction and Maintenance Occupations
The most common Natural Resources, Construction and Maintenance occupations in Dyersville are Construction & Extraction (174 | 7.5%), and Installation, Maintenance & Repair (134 | 5.8%).
Natural Resources, Construction and Maintenance Occupations by Sex
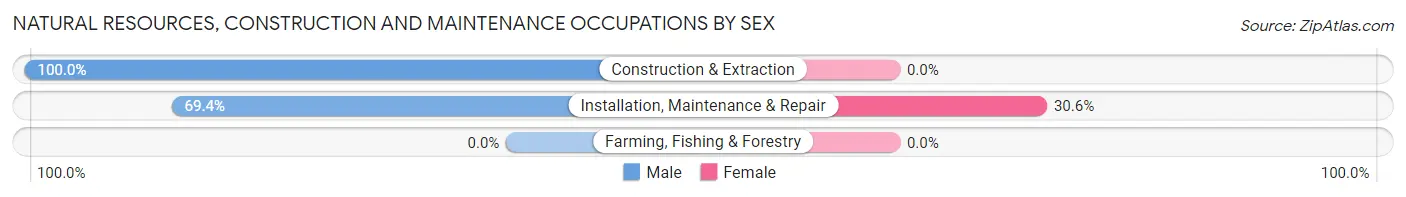
| Occupation | Male | Female |
| Farming, Fishing & Forestry | 0 (0.0%) | 0 (0.0%) |
| Construction & Extraction | 174 (100.0%) | 0 (0.0%) |
| Installation, Maintenance & Repair | 93 (69.4%) | 41 (30.6%) |
| Total (Category) | 267 (86.7%) | 41 (13.3%) |
| Total (Overall) | 1,184 (51.1%) | 1,135 (48.9%) |
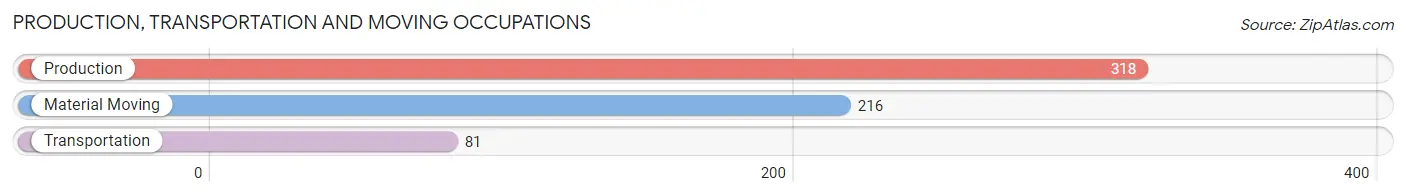
Production, Transportation and Moving Occupations
The most common Production, Transportation and Moving occupations in Dyersville are Production (318 | 13.7%), Material Moving (216 | 9.3%), and Transportation (81 | 3.5%).
Production, Transportation and Moving Occupations by Sex
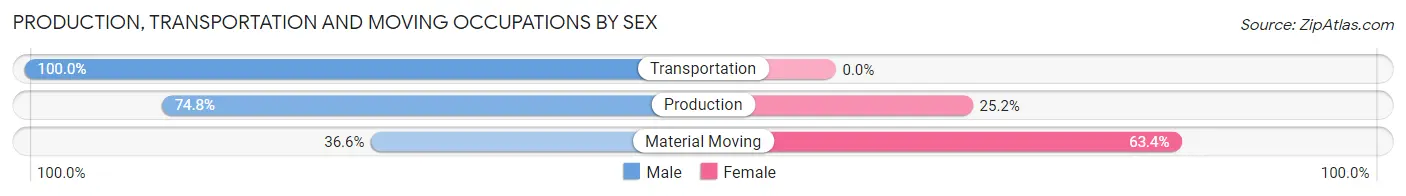
| Occupation | Male | Female |
| Production | 238 (74.8%) | 80 (25.2%) |
| Transportation | 81 (100.0%) | 0 (0.0%) |
| Material Moving | 79 (36.6%) | 137 (63.4%) |
| Total (Category) | 398 (64.7%) | 217 (35.3%) |
| Total (Overall) | 1,184 (51.1%) | 1,135 (48.9%) |
Employment Industries by Sex in Dyersville
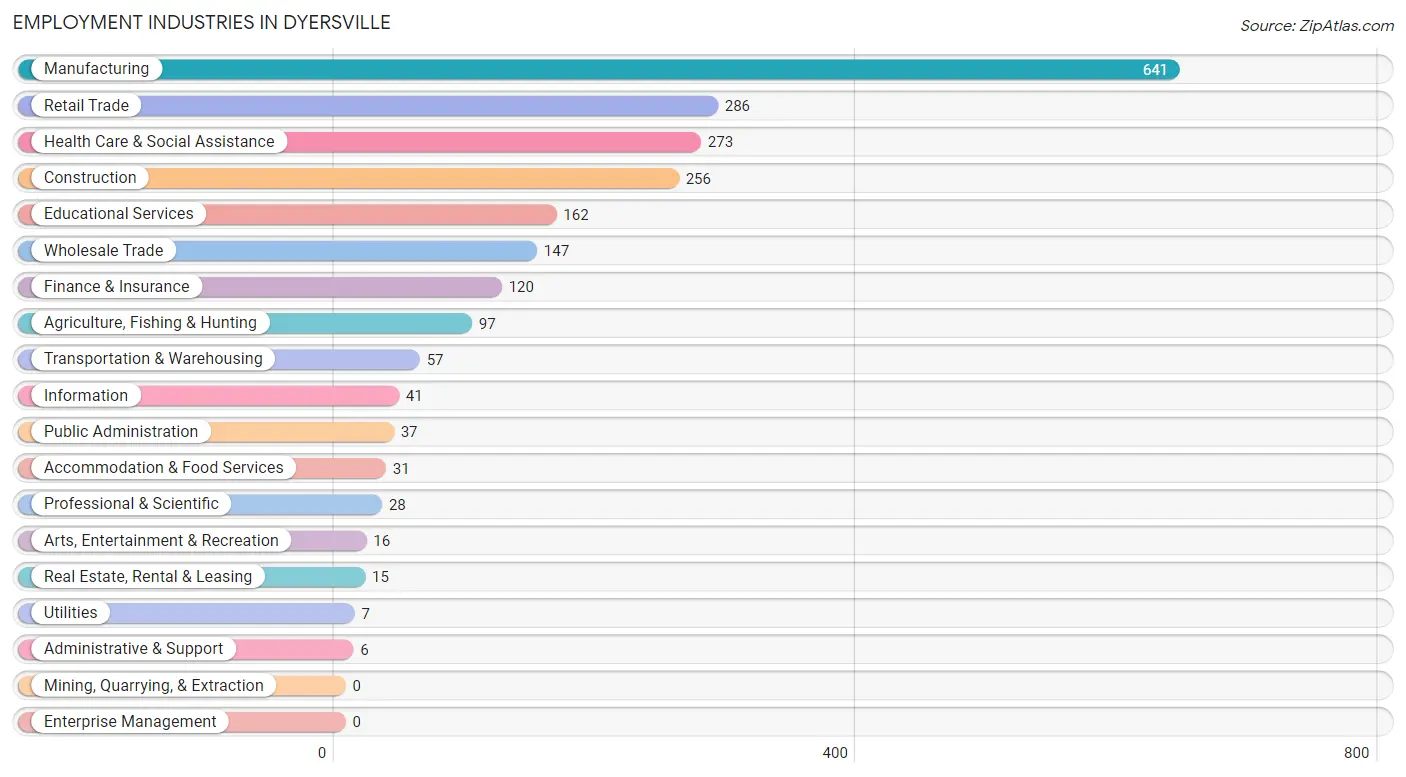
Employment Industries in Dyersville
The major employment industries in Dyersville include Manufacturing (641 | 27.6%), Retail Trade (286 | 12.3%), Health Care & Social Assistance (273 | 11.8%), Construction (256 | 11.0%), and Educational Services (162 | 7.0%).
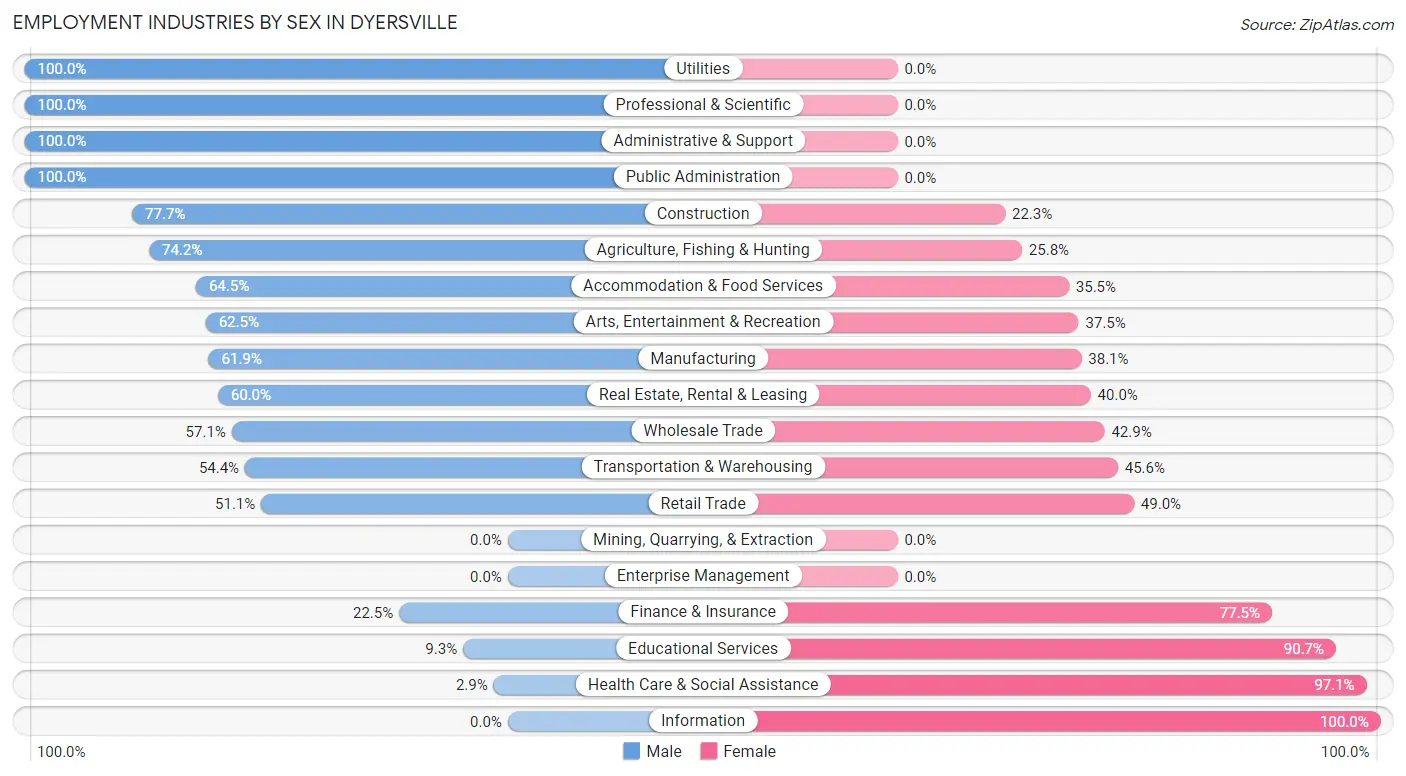
Employment Industries by Sex in Dyersville
The Dyersville industries that see more men than women are Utilities (100.0%), Professional & Scientific (100.0%), and Administrative & Support (100.0%), whereas the industries that tend to have a higher number of women are Information (100.0%), Health Care & Social Assistance (97.1%), and Educational Services (90.7%).
| Industry | Male | Female |
| Agriculture, Fishing & Hunting | 72 (74.2%) | 25 (25.8%) |
| Mining, Quarrying, & Extraction | 0 (0.0%) | 0 (0.0%) |
| Construction | 199 (77.7%) | 57 (22.3%) |
| Manufacturing | 397 (61.9%) | 244 (38.1%) |
| Wholesale Trade | 84 (57.1%) | 63 (42.9%) |
| Retail Trade | 146 (51.0%) | 140 (48.9%) |
| Transportation & Warehousing | 31 (54.4%) | 26 (45.6%) |
| Utilities | 7 (100.0%) | 0 (0.0%) |
| Information | 0 (0.0%) | 41 (100.0%) |
| Finance & Insurance | 27 (22.5%) | 93 (77.5%) |
| Real Estate, Rental & Leasing | 9 (60.0%) | 6 (40.0%) |
| Professional & Scientific | 28 (100.0%) | 0 (0.0%) |
| Enterprise Management | 0 (0.0%) | 0 (0.0%) |
| Administrative & Support | 6 (100.0%) | 0 (0.0%) |
| Educational Services | 15 (9.3%) | 147 (90.7%) |
| Health Care & Social Assistance | 8 (2.9%) | 265 (97.1%) |
| Arts, Entertainment & Recreation | 10 (62.5%) | 6 (37.5%) |
| Accommodation & Food Services | 20 (64.5%) | 11 (35.5%) |
| Public Administration | 37 (100.0%) | 0 (0.0%) |
| Total | 1,184 (51.1%) | 1,135 (48.9%) |
Education in Dyersville
School Enrollment in Dyersville
The most common levels of schooling among the 912 students in Dyersville are elementary school (290 | 31.8%), high school (238 | 26.1%), and middle school (154 | 16.9%).
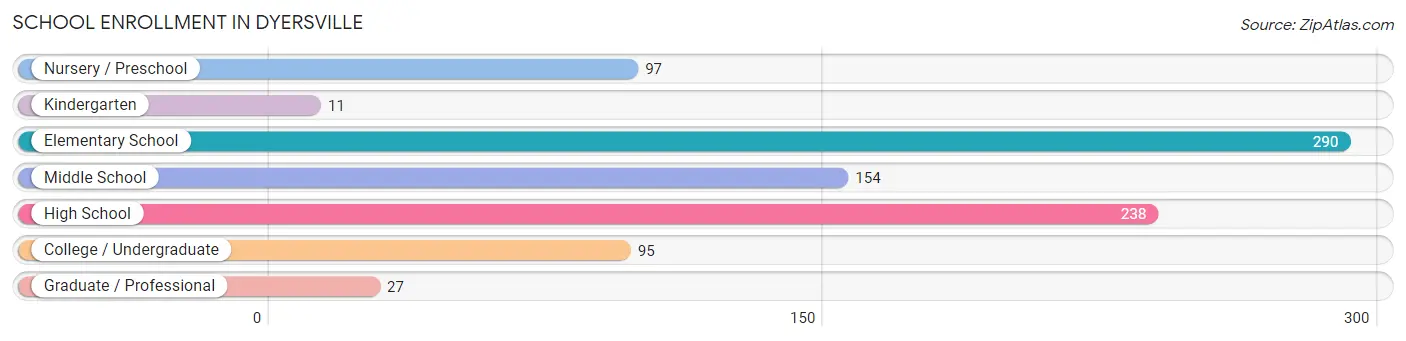
| School Level | # Students | % Students |
| Nursery / Preschool | 97 | 10.6% |
| Kindergarten | 11 | 1.2% |
| Elementary School | 290 | 31.8% |
| Middle School | 154 | 16.9% |
| High School | 238 | 26.1% |
| College / Undergraduate | 95 | 10.4% |
| Graduate / Professional | 27 | 3.0% |
| Total | 912 | 100.0% |
School Enrollment by Age by Funding Source in Dyersville
Out of a total of 912 students who are enrolled in schools in Dyersville, 253 (27.7%) attend a private institution, while the remaining 659 (72.3%) are enrolled in public schools. The age group of 15 to 17 year olds has the highest likelihood of being enrolled in private schools, with 78 (47.0% in the age bracket) enrolled. Conversely, the age group of 20 to 24 year olds has the lowest likelihood of being enrolled in a private school, with 78 (96.3% in the age bracket) attending a public institution.
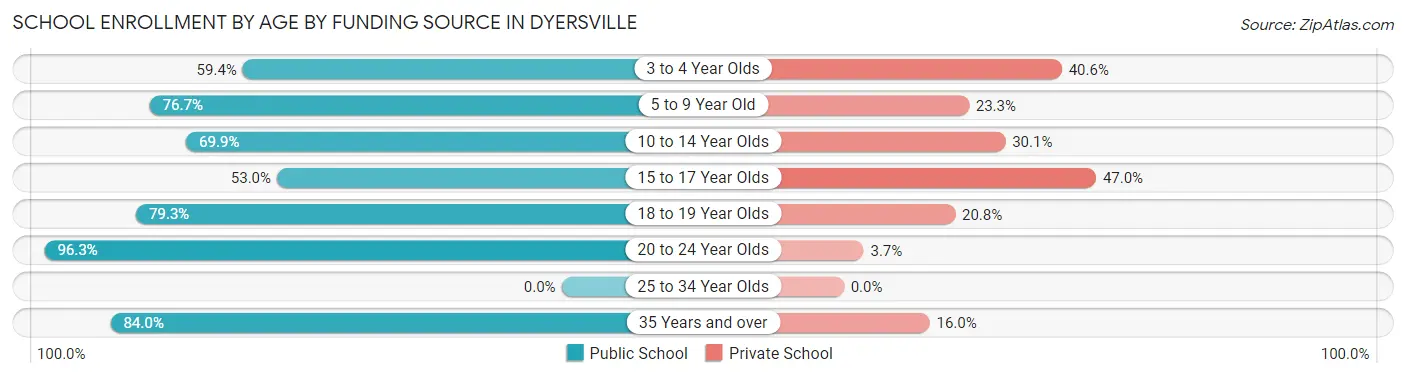
| Age Bracket | Public School | Private School |
| 3 to 4 Year Olds | 19 (59.4%) | 13 (40.6%) |
| 5 to 9 Year Old | 260 (76.7%) | 79 (23.3%) |
| 10 to 14 Year Olds | 151 (69.9%) | 65 (30.1%) |
| 15 to 17 Year Olds | 88 (53.0%) | 78 (47.0%) |
| 18 to 19 Year Olds | 42 (79.2%) | 11 (20.7%) |
| 20 to 24 Year Olds | 78 (96.3%) | 3 (3.7%) |
| 25 to 34 Year Olds | 0 (0.0%) | 0 (0.0%) |
| 35 Years and over | 21 (84.0%) | 4 (16.0%) |
| Total | 659 (72.3%) | 253 (27.7%) |
Educational Attainment by Field of Study in Dyersville
Business (155 | 22.6%), education (120 | 17.5%), arts & humanities (75 | 11.0%), science & technology (73 | 10.7%), and bio, nature & agricultural (61 | 8.9%) are the most common fields of study among 685 individuals in Dyersville who have obtained a bachelor's degree or higher.
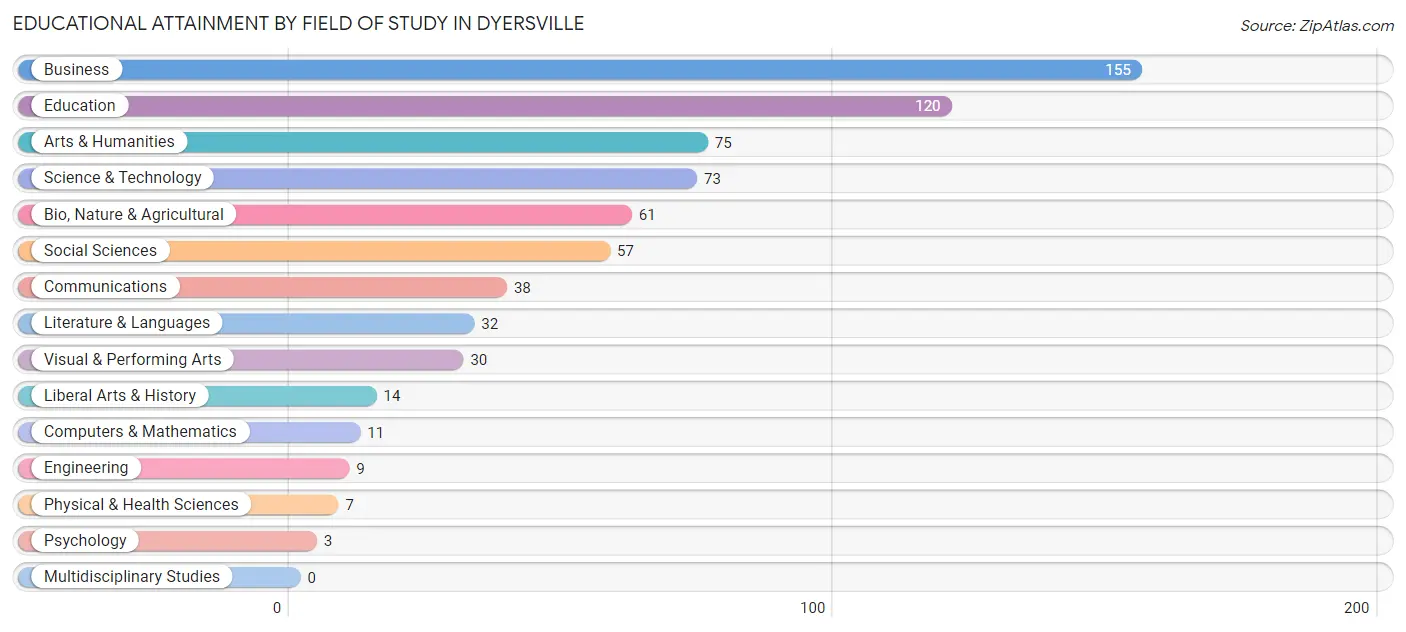
| Field of Study | # Graduates | % Graduates |
| Computers & Mathematics | 11 | 1.6% |
| Bio, Nature & Agricultural | 61 | 8.9% |
| Physical & Health Sciences | 7 | 1.0% |
| Psychology | 3 | 0.4% |
| Social Sciences | 57 | 8.3% |
| Engineering | 9 | 1.3% |
| Multidisciplinary Studies | 0 | 0.0% |
| Science & Technology | 73 | 10.7% |
| Business | 155 | 22.6% |
| Education | 120 | 17.5% |
| Literature & Languages | 32 | 4.7% |
| Liberal Arts & History | 14 | 2.0% |
| Visual & Performing Arts | 30 | 4.4% |
| Communications | 38 | 5.6% |
| Arts & Humanities | 75 | 11.0% |
| Total | 685 | 100.0% |
Transportation & Commute in Dyersville
Vehicle Availability by Sex in Dyersville
The most prevalent vehicle ownership categories in Dyersville are males with 2 vehicles (624, accounting for 52.7%) and females with 2 vehicles (657, making up 55.0%).
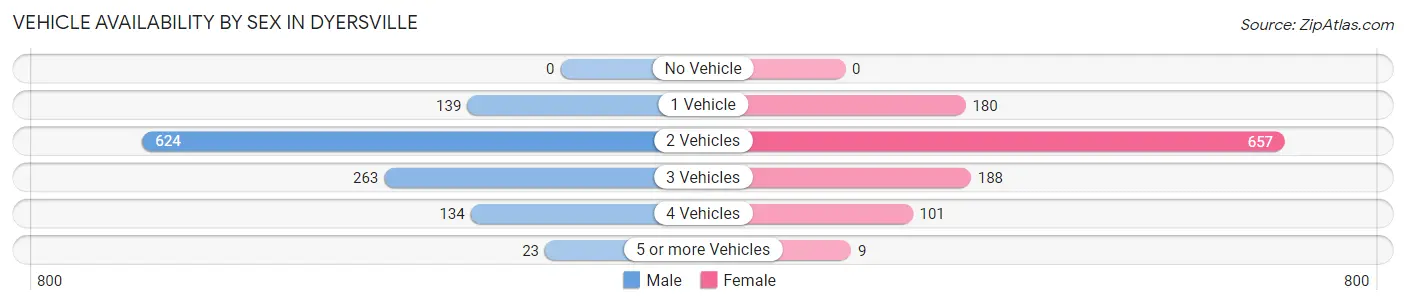
| Vehicles Available | Male | Female |
| No Vehicle | 0 (0.0%) | 0 (0.0%) |
| 1 Vehicle | 139 (11.7%) | 180 (15.9%) |
| 2 Vehicles | 624 (52.7%) | 657 (57.9%) |
| 3 Vehicles | 263 (22.2%) | 188 (16.6%) |
| 4 Vehicles | 134 (11.3%) | 101 (8.9%) |
| 5 or more Vehicles | 23 (1.9%) | 9 (0.8%) |
| Total | 1,183 (100.0%) | 1,135 (100.0%) |
Commute Time in Dyersville
The most frequently occuring commute durations in Dyersville are 5 to 9 minutes (762 commuters, 34.8%), less than 5 minutes (305 commuters, 13.9%), and 10 to 14 minutes (303 commuters, 13.8%).
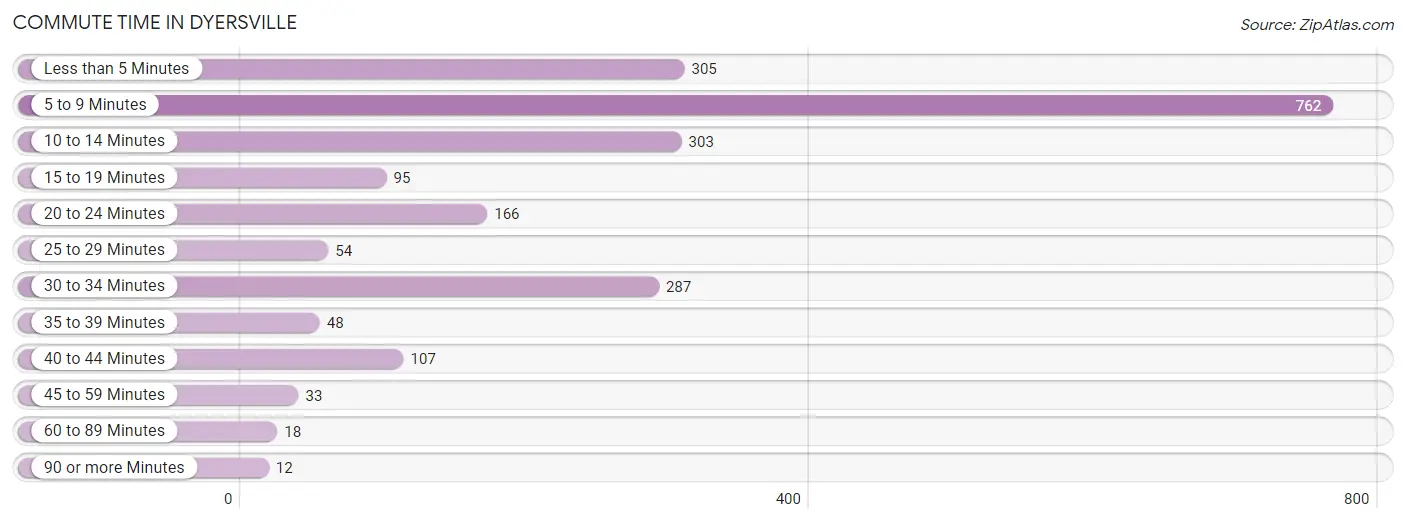
| Commute Time | # Commuters | % Commuters |
| Less than 5 Minutes | 305 | 13.9% |
| 5 to 9 Minutes | 762 | 34.8% |
| 10 to 14 Minutes | 303 | 13.8% |
| 15 to 19 Minutes | 95 | 4.3% |
| 20 to 24 Minutes | 166 | 7.6% |
| 25 to 29 Minutes | 54 | 2.5% |
| 30 to 34 Minutes | 287 | 13.1% |
| 35 to 39 Minutes | 48 | 2.2% |
| 40 to 44 Minutes | 107 | 4.9% |
| 45 to 59 Minutes | 33 | 1.5% |
| 60 to 89 Minutes | 18 | 0.8% |
| 90 or more Minutes | 12 | 0.5% |
Commute Time by Sex in Dyersville
The most common commute times in Dyersville are 5 to 9 minutes (404 commuters, 34.4%) for males and 5 to 9 minutes (358 commuters, 35.2%) for females.
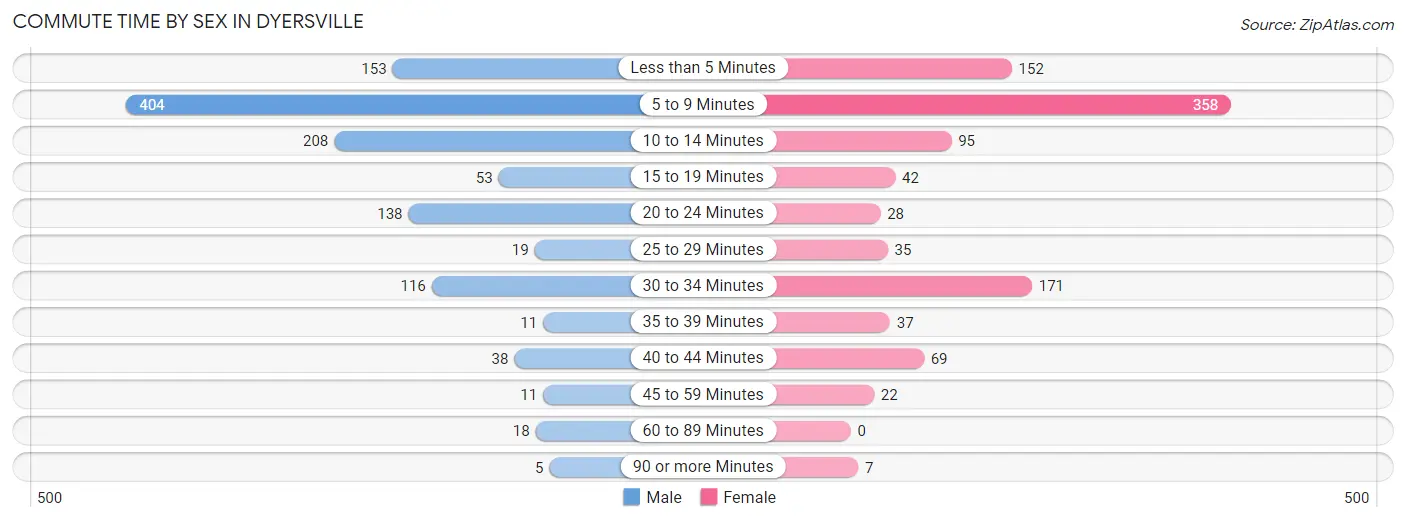
| Commute Time | Male | Female |
| Less than 5 Minutes | 153 (13.0%) | 152 (15.0%) |
| 5 to 9 Minutes | 404 (34.4%) | 358 (35.2%) |
| 10 to 14 Minutes | 208 (17.7%) | 95 (9.3%) |
| 15 to 19 Minutes | 53 (4.5%) | 42 (4.1%) |
| 20 to 24 Minutes | 138 (11.7%) | 28 (2.8%) |
| 25 to 29 Minutes | 19 (1.6%) | 35 (3.4%) |
| 30 to 34 Minutes | 116 (9.9%) | 171 (16.8%) |
| 35 to 39 Minutes | 11 (0.9%) | 37 (3.6%) |
| 40 to 44 Minutes | 38 (3.2%) | 69 (6.8%) |
| 45 to 59 Minutes | 11 (0.9%) | 22 (2.2%) |
| 60 to 89 Minutes | 18 (1.5%) | 0 (0.0%) |
| 90 or more Minutes | 5 (0.4%) | 7 (0.7%) |
Time of Departure to Work by Sex in Dyersville
The most frequent times of departure to work in Dyersville are 6:30 AM to 6:59 AM (220, 18.7%) for males and 7:00 AM to 7:29 AM (227, 22.3%) for females.
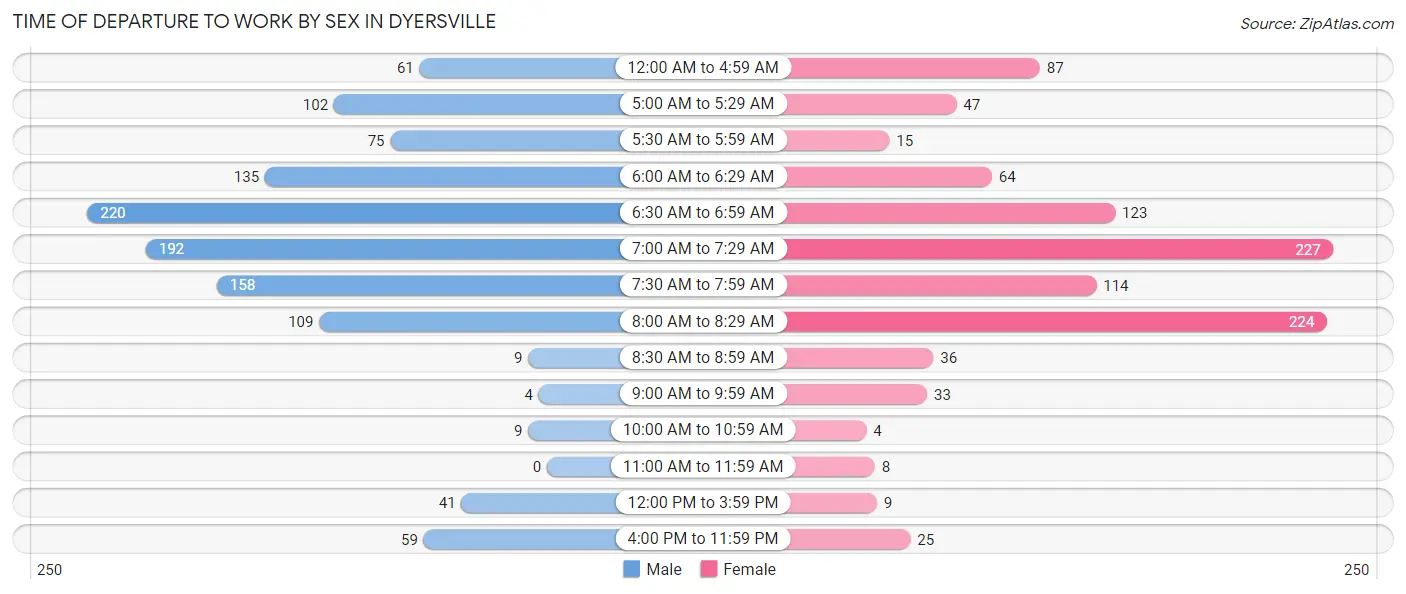
| Time of Departure | Male | Female |
| 12:00 AM to 4:59 AM | 61 (5.2%) | 87 (8.6%) |
| 5:00 AM to 5:29 AM | 102 (8.7%) | 47 (4.6%) |
| 5:30 AM to 5:59 AM | 75 (6.4%) | 15 (1.5%) |
| 6:00 AM to 6:29 AM | 135 (11.5%) | 64 (6.3%) |
| 6:30 AM to 6:59 AM | 220 (18.7%) | 123 (12.1%) |
| 7:00 AM to 7:29 AM | 192 (16.4%) | 227 (22.3%) |
| 7:30 AM to 7:59 AM | 158 (13.5%) | 114 (11.2%) |
| 8:00 AM to 8:29 AM | 109 (9.3%) | 224 (22.1%) |
| 8:30 AM to 8:59 AM | 9 (0.8%) | 36 (3.5%) |
| 9:00 AM to 9:59 AM | 4 (0.3%) | 33 (3.3%) |
| 10:00 AM to 10:59 AM | 9 (0.8%) | 4 (0.4%) |
| 11:00 AM to 11:59 AM | 0 (0.0%) | 8 (0.8%) |
| 12:00 PM to 3:59 PM | 41 (3.5%) | 9 (0.9%) |
| 4:00 PM to 11:59 PM | 59 (5.0%) | 25 (2.5%) |
| Total | 1,174 (100.0%) | 1,016 (100.0%) |
Housing Occupancy in Dyersville
Occupancy by Ownership in Dyersville
Of the total 1,756 dwellings in Dyersville, owner-occupied units account for 1,513 (86.2%), while renter-occupied units make up 243 (13.8%).
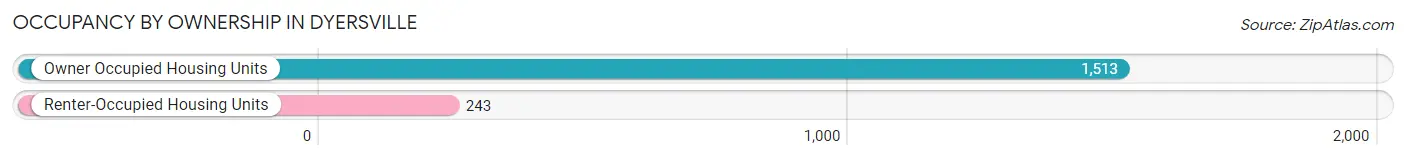
| Occupancy | # Housing Units | % Housing Units |
| Owner Occupied Housing Units | 1,513 | 86.2% |
| Renter-Occupied Housing Units | 243 | 13.8% |
| Total Occupied Housing Units | 1,756 | 100.0% |
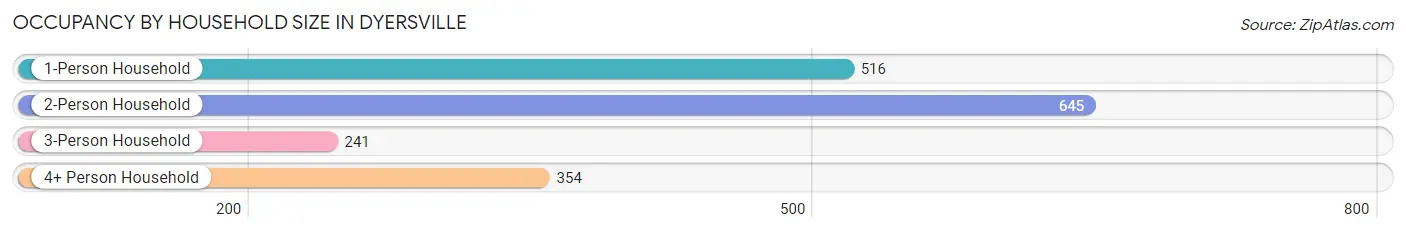
Occupancy by Household Size in Dyersville
| Household Size | # Housing Units | % Housing Units |
| 1-Person Household | 516 | 29.4% |
| 2-Person Household | 645 | 36.7% |
| 3-Person Household | 241 | 13.7% |
| 4+ Person Household | 354 | 20.2% |
| Total Housing Units | 1,756 | 100.0% |
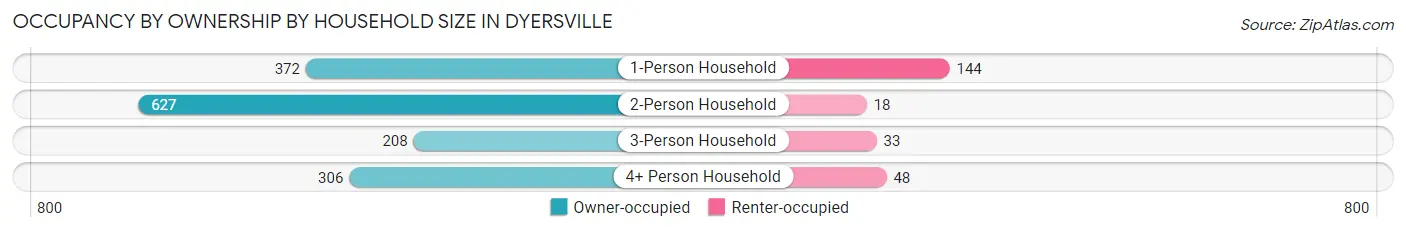
Occupancy by Ownership by Household Size in Dyersville
| Household Size | Owner-occupied | Renter-occupied |
| 1-Person Household | 372 (72.1%) | 144 (27.9%) |
| 2-Person Household | 627 (97.2%) | 18 (2.8%) |
| 3-Person Household | 208 (86.3%) | 33 (13.7%) |
| 4+ Person Household | 306 (86.4%) | 48 (13.6%) |
| Total Housing Units | 1,513 (86.2%) | 243 (13.8%) |
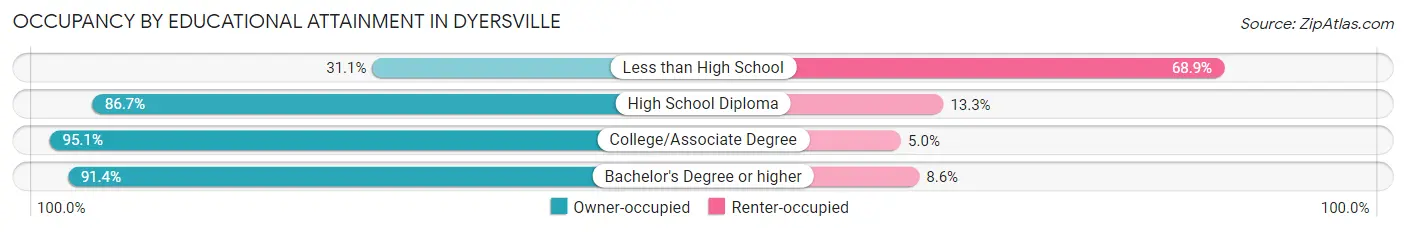
Occupancy by Educational Attainment in Dyersville
| Household Size | Owner-occupied | Renter-occupied |
| Less than High School | 41 (31.1%) | 91 (68.9%) |
| High School Diploma | 578 (86.7%) | 89 (13.3%) |
| College/Associate Degree | 499 (95.1%) | 26 (5.0%) |
| Bachelor's Degree or higher | 395 (91.4%) | 37 (8.6%) |
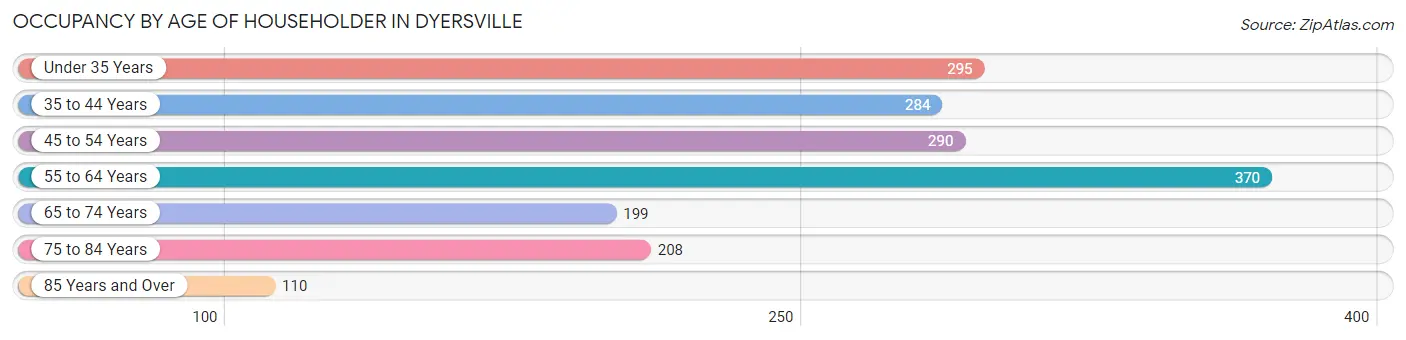
Occupancy by Age of Householder in Dyersville
| Age Bracket | # Households | % Households |
| Under 35 Years | 295 | 16.8% |
| 35 to 44 Years | 284 | 16.2% |
| 45 to 54 Years | 290 | 16.5% |
| 55 to 64 Years | 370 | 21.1% |
| 65 to 74 Years | 199 | 11.3% |
| 75 to 84 Years | 208 | 11.8% |
| 85 Years and Over | 110 | 6.3% |
| Total | 1,756 | 100.0% |
Housing Finances in Dyersville
Median Income by Occupancy in Dyersville
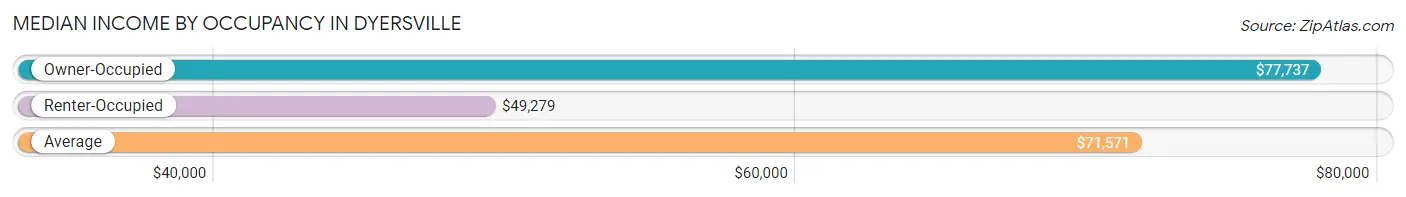
| Occupancy Type | # Households | Median Income |
| Owner-Occupied | 1,513 (86.2%) | $77,737 |
| Renter-Occupied | 243 (13.8%) | $49,279 |
| Average | 1,756 (100.0%) | $71,571 |
Occupancy by Householder Income Bracket in Dyersville
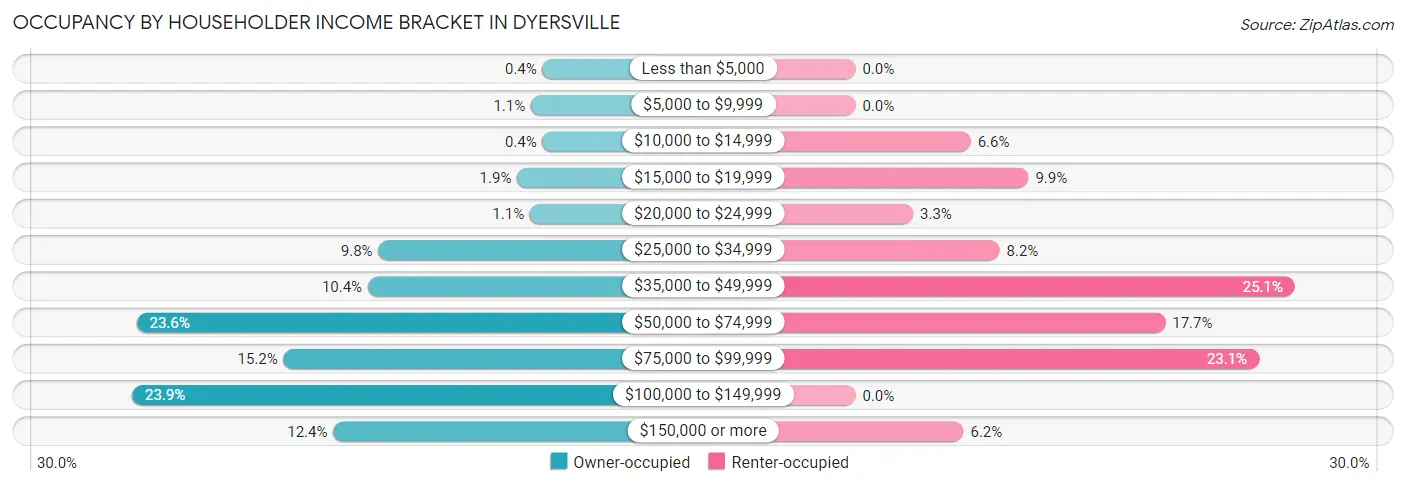
| Income Bracket | Owner-occupied | Renter-occupied |
| Less than $5,000 | 6 (0.4%) | 0 (0.0%) |
| $5,000 to $9,999 | 16 (1.1%) | 0 (0.0%) |
| $10,000 to $14,999 | 6 (0.4%) | 16 (6.6%) |
| $15,000 to $19,999 | 28 (1.8%) | 24 (9.9%) |
| $20,000 to $24,999 | 17 (1.1%) | 8 (3.3%) |
| $25,000 to $34,999 | 148 (9.8%) | 20 (8.2%) |
| $35,000 to $49,999 | 157 (10.4%) | 61 (25.1%) |
| $50,000 to $74,999 | 357 (23.6%) | 43 (17.7%) |
| $75,000 to $99,999 | 230 (15.2%) | 56 (23.1%) |
| $100,000 to $149,999 | 361 (23.9%) | 0 (0.0%) |
| $150,000 or more | 187 (12.4%) | 15 (6.2%) |
| Total | 1,513 (100.0%) | 243 (100.0%) |
Monthly Housing Cost Tiers in Dyersville
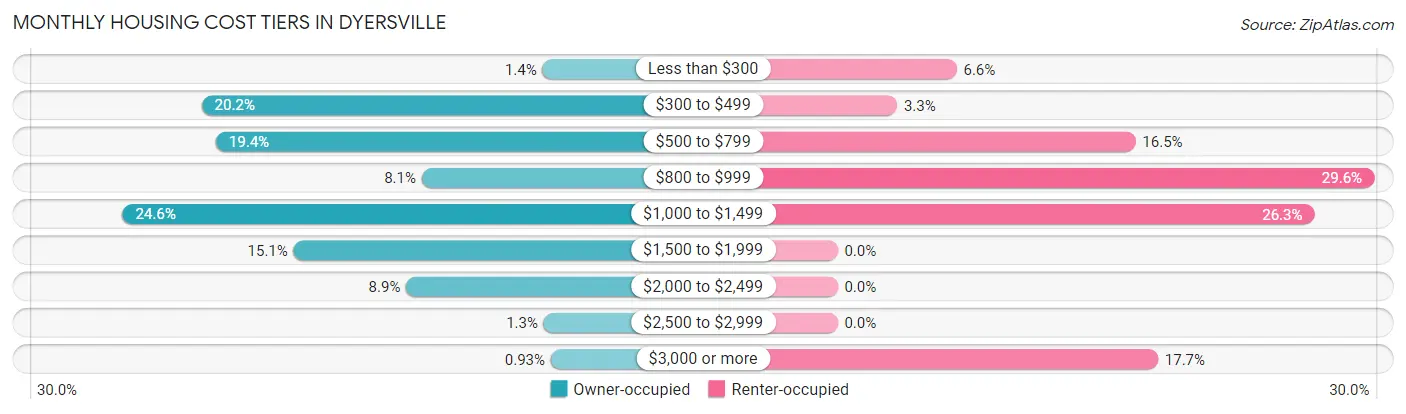
| Monthly Cost | Owner-occupied | Renter-occupied |
| Less than $300 | 21 (1.4%) | 16 (6.6%) |
| $300 to $499 | 306 (20.2%) | 8 (3.3%) |
| $500 to $799 | 294 (19.4%) | 40 (16.5%) |
| $800 to $999 | 122 (8.1%) | 72 (29.6%) |
| $1,000 to $1,499 | 372 (24.6%) | 64 (26.3%) |
| $1,500 to $1,999 | 229 (15.1%) | 0 (0.0%) |
| $2,000 to $2,499 | 135 (8.9%) | 0 (0.0%) |
| $2,500 to $2,999 | 20 (1.3%) | 0 (0.0%) |
| $3,000 or more | 14 (0.9%) | 43 (17.7%) |
| Total | 1,513 (100.0%) | 243 (100.0%) |
Physical Housing Characteristics in Dyersville
Housing Structures in Dyersville
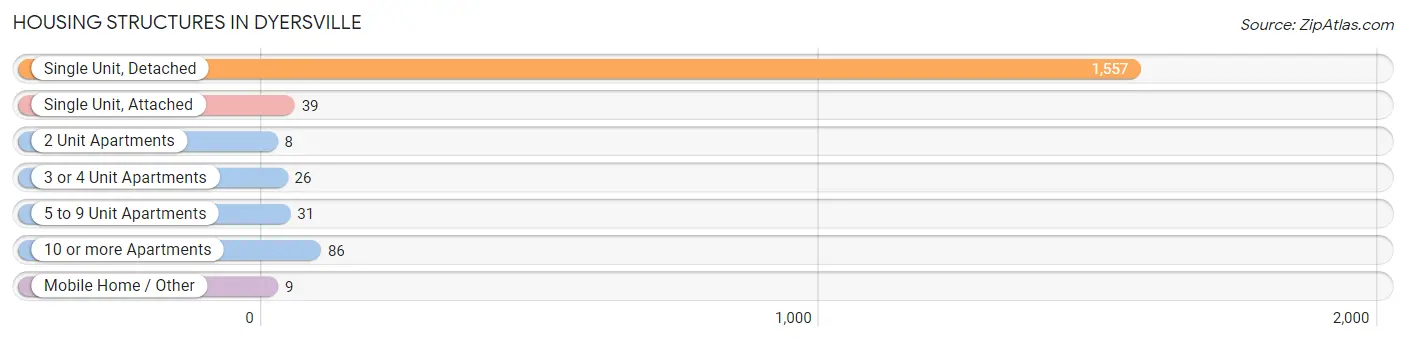
| Structure Type | # Housing Units | % Housing Units |
| Single Unit, Detached | 1,557 | 88.7% |
| Single Unit, Attached | 39 | 2.2% |
| 2 Unit Apartments | 8 | 0.5% |
| 3 or 4 Unit Apartments | 26 | 1.5% |
| 5 to 9 Unit Apartments | 31 | 1.8% |
| 10 or more Apartments | 86 | 4.9% |
| Mobile Home / Other | 9 | 0.5% |
| Total | 1,756 | 100.0% |
Housing Structures by Occupancy in Dyersville
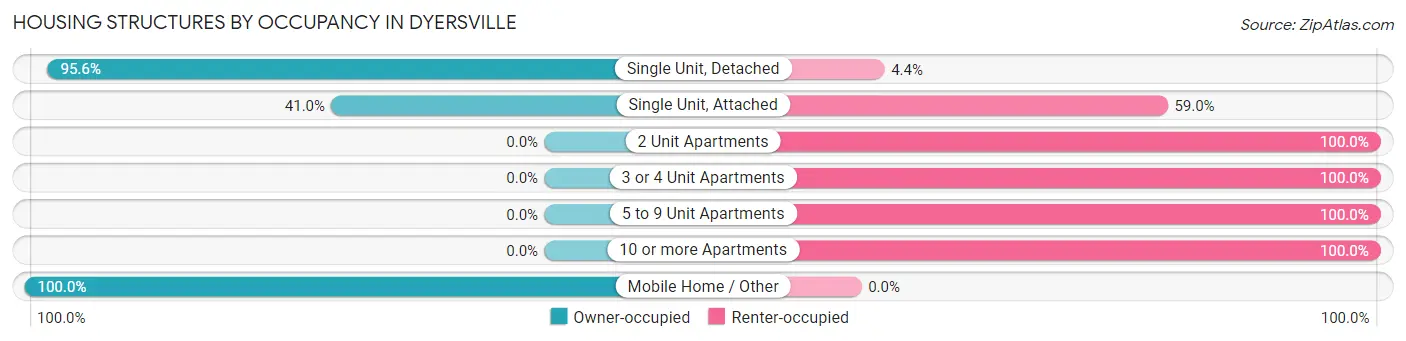
| Structure Type | Owner-occupied | Renter-occupied |
| Single Unit, Detached | 1,488 (95.6%) | 69 (4.4%) |
| Single Unit, Attached | 16 (41.0%) | 23 (59.0%) |
| 2 Unit Apartments | 0 (0.0%) | 8 (100.0%) |
| 3 or 4 Unit Apartments | 0 (0.0%) | 26 (100.0%) |
| 5 to 9 Unit Apartments | 0 (0.0%) | 31 (100.0%) |
| 10 or more Apartments | 0 (0.0%) | 86 (100.0%) |
| Mobile Home / Other | 9 (100.0%) | 0 (0.0%) |
| Total | 1,513 (86.2%) | 243 (13.8%) |
Housing Structures by Number of Rooms in Dyersville
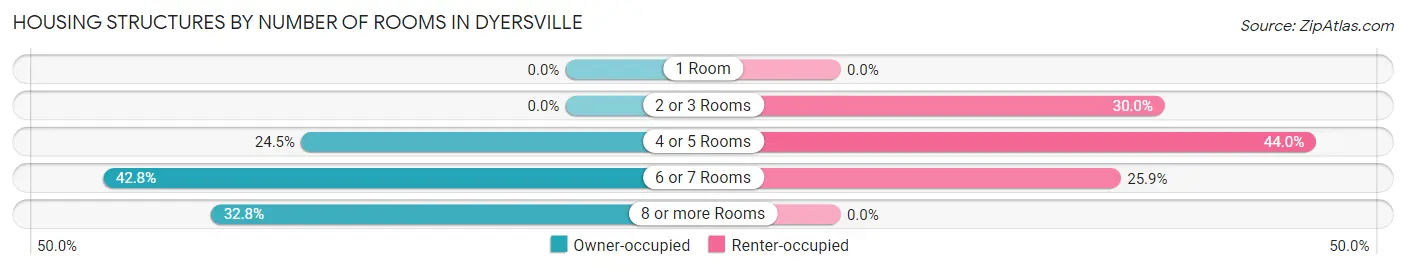
| Number of Rooms | Owner-occupied | Renter-occupied |
| 1 Room | 0 (0.0%) | 0 (0.0%) |
| 2 or 3 Rooms | 0 (0.0%) | 73 (30.0%) |
| 4 or 5 Rooms | 370 (24.4%) | 107 (44.0%) |
| 6 or 7 Rooms | 647 (42.8%) | 63 (25.9%) |
| 8 or more Rooms | 496 (32.8%) | 0 (0.0%) |
| Total | 1,513 (100.0%) | 243 (100.0%) |
Housing Structure by Heating Type in Dyersville
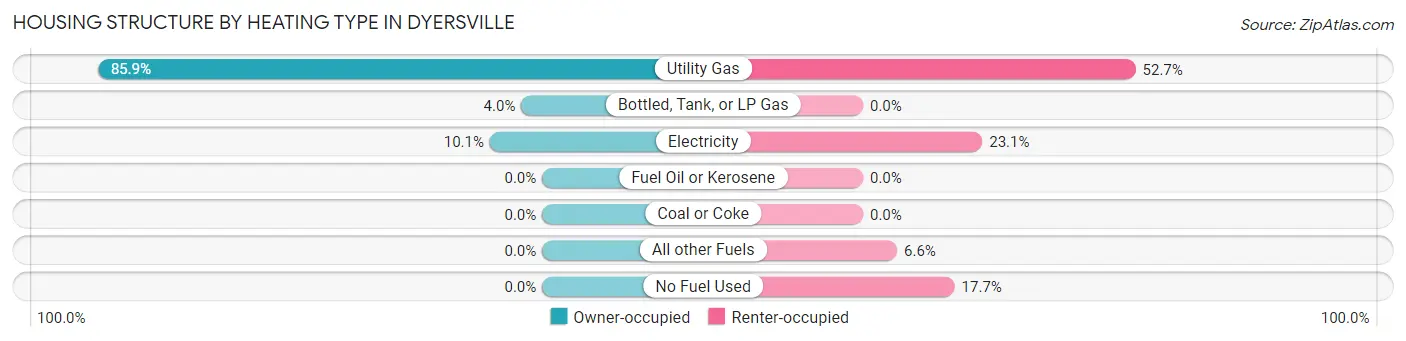
| Heating Type | Owner-occupied | Renter-occupied |
| Utility Gas | 1,299 (85.9%) | 128 (52.7%) |
| Bottled, Tank, or LP Gas | 61 (4.0%) | 0 (0.0%) |
| Electricity | 153 (10.1%) | 56 (23.1%) |
| Fuel Oil or Kerosene | 0 (0.0%) | 0 (0.0%) |
| Coal or Coke | 0 (0.0%) | 0 (0.0%) |
| All other Fuels | 0 (0.0%) | 16 (6.6%) |
| No Fuel Used | 0 (0.0%) | 43 (17.7%) |
| Total | 1,513 (100.0%) | 243 (100.0%) |
Household Vehicle Usage in Dyersville
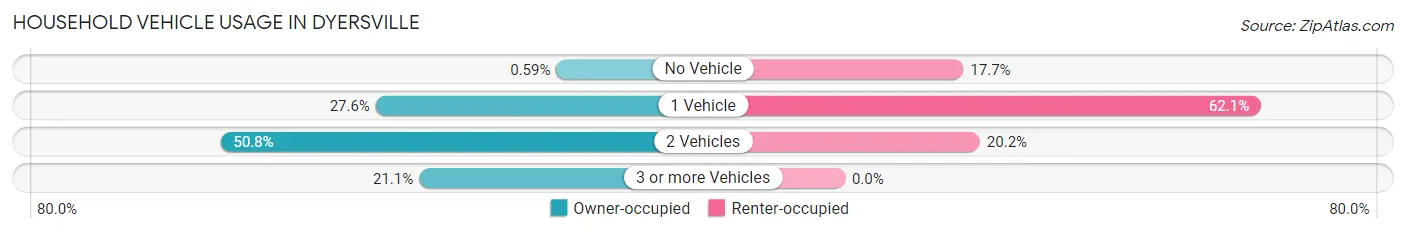
| Vehicles per Household | Owner-occupied | Renter-occupied |
| No Vehicle | 9 (0.6%) | 43 (17.7%) |
| 1 Vehicle | 417 (27.6%) | 151 (62.1%) |
| 2 Vehicles | 768 (50.8%) | 49 (20.2%) |
| 3 or more Vehicles | 319 (21.1%) | 0 (0.0%) |
| Total | 1,513 (100.0%) | 243 (100.0%) |
Real Estate & Mortgages in Dyersville
Real Estate and Mortgage Overview in Dyersville
| Characteristic | Without Mortgage | With Mortgage |
| Housing Units | 668 | 845 |
| Median Property Value | $188,900 | $214,100 |
| Median Household Income | $58,333 | $129 |
| Monthly Housing Costs | $522 | $14 |
| Real Estate Taxes | $2,329 | $0 |
Property Value by Mortgage Status in Dyersville
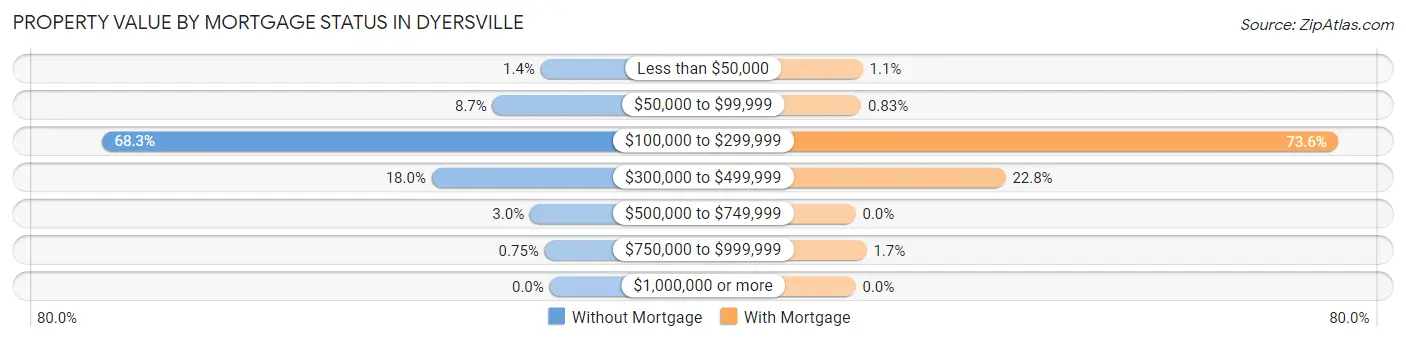
| Property Value | Without Mortgage | With Mortgage |
| Less than $50,000 | 9 (1.3%) | 9 (1.1%) |
| $50,000 to $99,999 | 58 (8.7%) | 7 (0.8%) |
| $100,000 to $299,999 | 456 (68.3%) | 622 (73.6%) |
| $300,000 to $499,999 | 120 (18.0%) | 193 (22.8%) |
| $500,000 to $749,999 | 20 (3.0%) | 0 (0.0%) |
| $750,000 to $999,999 | 5 (0.7%) | 14 (1.7%) |
| $1,000,000 or more | 0 (0.0%) | 0 (0.0%) |
| Total | 668 (100.0%) | 845 (100.0%) |
Household Income by Mortgage Status in Dyersville
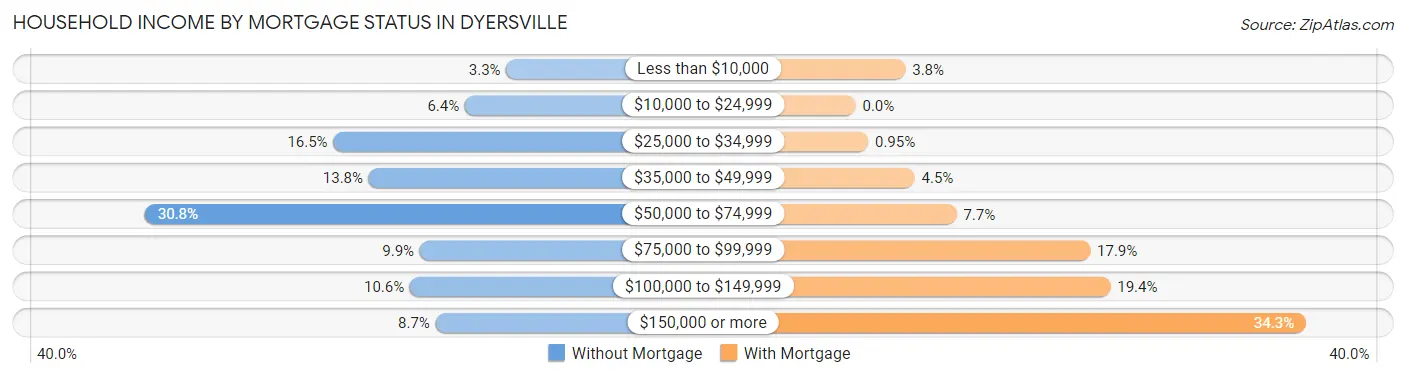
| Household Income | Without Mortgage | With Mortgage |
| Less than $10,000 | 22 (3.3%) | 32 (3.8%) |
| $10,000 to $24,999 | 43 (6.4%) | 0 (0.0%) |
| $25,000 to $34,999 | 110 (16.5%) | 8 (0.9%) |
| $35,000 to $49,999 | 92 (13.8%) | 38 (4.5%) |
| $50,000 to $74,999 | 206 (30.8%) | 65 (7.7%) |
| $75,000 to $99,999 | 66 (9.9%) | 151 (17.9%) |
| $100,000 to $149,999 | 71 (10.6%) | 164 (19.4%) |
| $150,000 or more | 58 (8.7%) | 290 (34.3%) |
| Total | 668 (100.0%) | 845 (100.0%) |
Property Value to Household Income Ratio in Dyersville
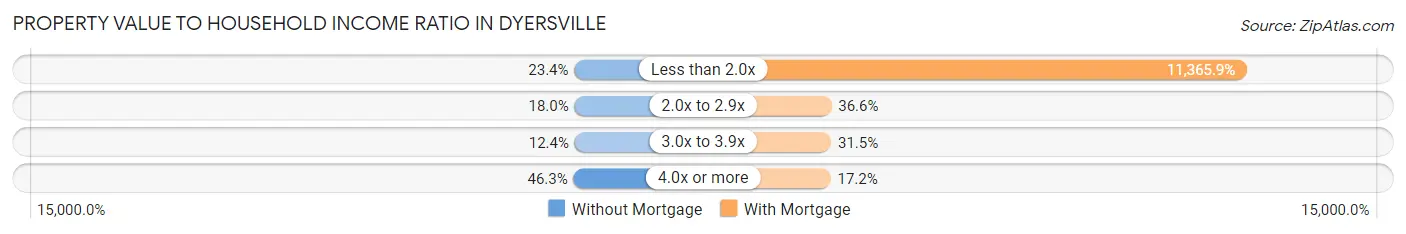
| Value-to-Income Ratio | Without Mortgage | With Mortgage |
| Less than 2.0x | 156 (23.4%) | 96,042 (11,365.9%) |
| 2.0x to 2.9x | 120 (18.0%) | 309 (36.6%) |
| 3.0x to 3.9x | 83 (12.4%) | 266 (31.5%) |
| 4.0x or more | 309 (46.3%) | 145 (17.2%) |
| Total | 668 (100.0%) | 845 (100.0%) |
Real Estate Taxes by Mortgage Status in Dyersville
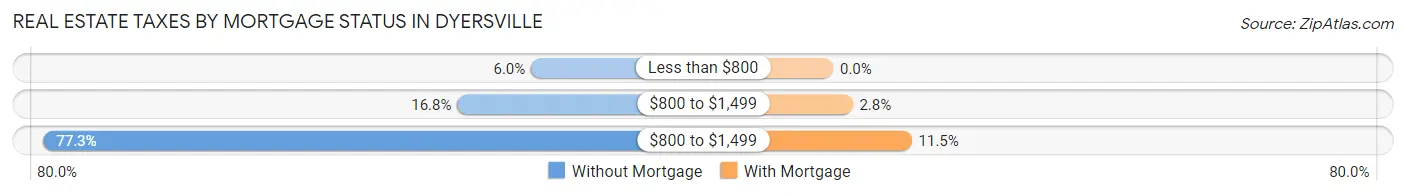
| Property Taxes | Without Mortgage | With Mortgage |
| Less than $800 | 40 (6.0%) | 0 (0.0%) |
| $800 to $1,499 | 112 (16.8%) | 24 (2.8%) |
| $800 to $1,499 | 516 (77.2%) | 97 (11.5%) |
| Total | 668 (100.0%) | 845 (100.0%) |
Health & Disability in Dyersville
Health Insurance Coverage by Age in Dyersville
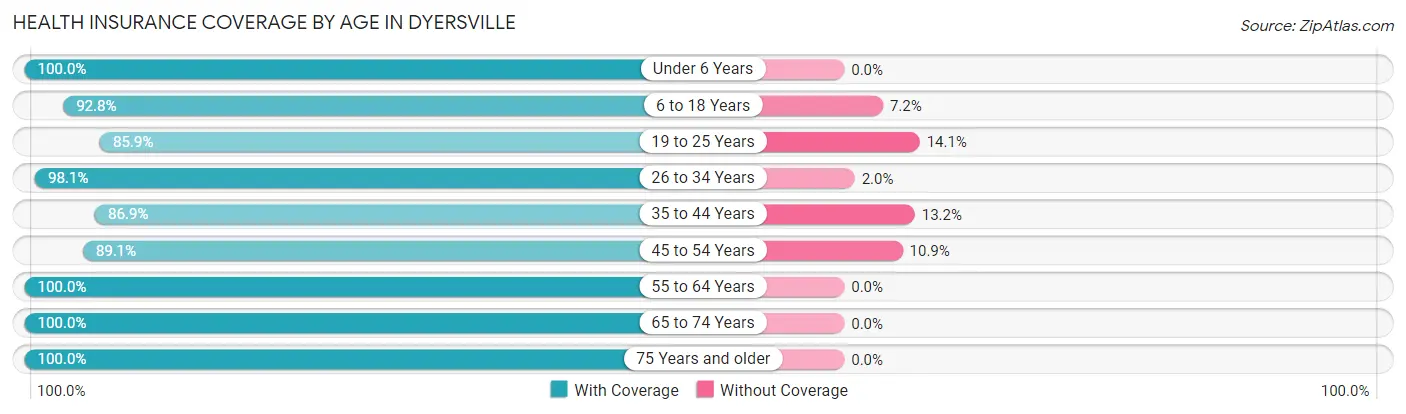
| Age Bracket | With Coverage | Without Coverage |
| Under 6 Years | 383 (100.0%) | 0 (0.0%) |
| 6 to 18 Years | 669 (92.8%) | 52 (7.2%) |
| 19 to 25 Years | 269 (85.9%) | 44 (14.1%) |
| 26 to 34 Years | 352 (98.1%) | 7 (1.9%) |
| 35 to 44 Years | 416 (86.9%) | 63 (13.2%) |
| 45 to 54 Years | 541 (89.1%) | 66 (10.9%) |
| 55 to 64 Years | 679 (100.0%) | 0 (0.0%) |
| 65 to 74 Years | 313 (100.0%) | 0 (0.0%) |
| 75 Years and older | 419 (100.0%) | 0 (0.0%) |
| Total | 4,041 (94.6%) | 232 (5.4%) |
Health Insurance Coverage by Citizenship Status in Dyersville
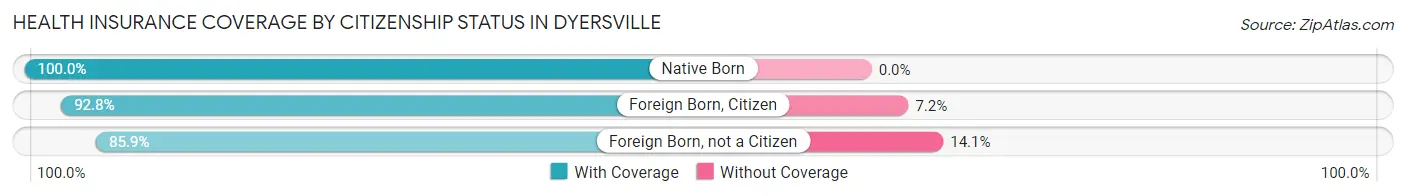
| Citizenship Status | With Coverage | Without Coverage |
| Native Born | 383 (100.0%) | 0 (0.0%) |
| Foreign Born, Citizen | 669 (92.8%) | 52 (7.2%) |
| Foreign Born, not a Citizen | 269 (85.9%) | 44 (14.1%) |
Health Insurance Coverage by Household Income in Dyersville
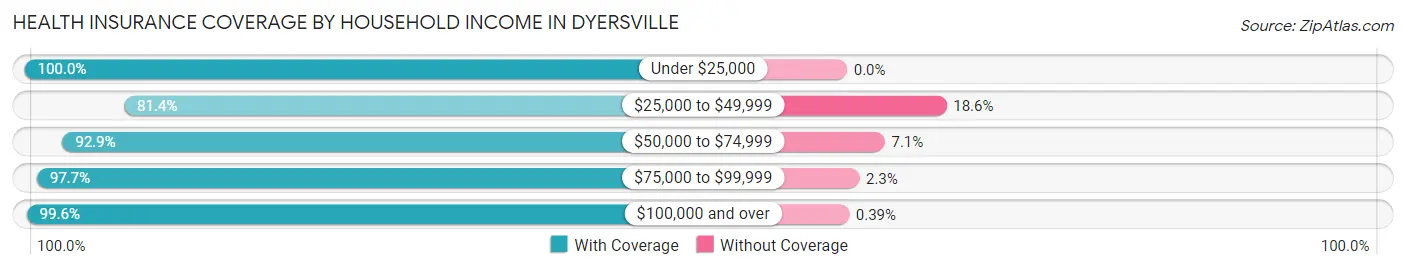
| Household Income | With Coverage | Without Coverage |
| Under $25,000 | 131 (100.0%) | 0 (0.0%) |
| $25,000 to $49,999 | 633 (81.4%) | 145 (18.6%) |
| $50,000 to $74,999 | 868 (92.9%) | 66 (7.1%) |
| $75,000 to $99,999 | 598 (97.7%) | 14 (2.3%) |
| $100,000 and over | 1,809 (99.6%) | 7 (0.4%) |
Public vs Private Health Insurance Coverage by Age in Dyersville
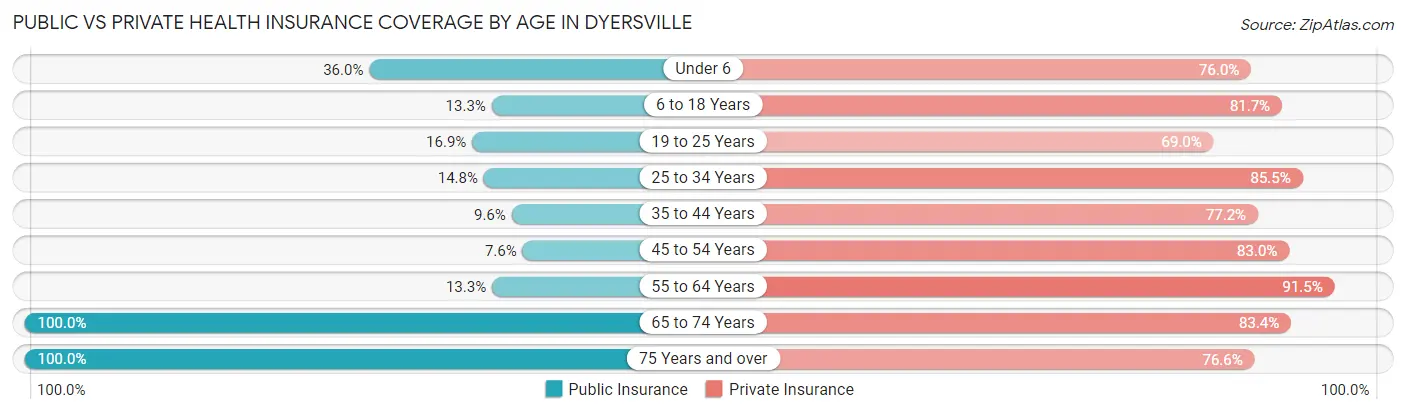
| Age Bracket | Public Insurance | Private Insurance |
| Under 6 | 138 (36.0%) | 291 (76.0%) |
| 6 to 18 Years | 96 (13.3%) | 589 (81.7%) |
| 19 to 25 Years | 53 (16.9%) | 216 (69.0%) |
| 25 to 34 Years | 53 (14.8%) | 307 (85.5%) |
| 35 to 44 Years | 46 (9.6%) | 370 (77.2%) |
| 45 to 54 Years | 46 (7.6%) | 504 (83.0%) |
| 55 to 64 Years | 90 (13.3%) | 621 (91.5%) |
| 65 to 74 Years | 313 (100.0%) | 261 (83.4%) |
| 75 Years and over | 419 (100.0%) | 321 (76.6%) |
| Total | 1,254 (29.3%) | 3,480 (81.4%) |
Disability Status by Sex by Age in Dyersville
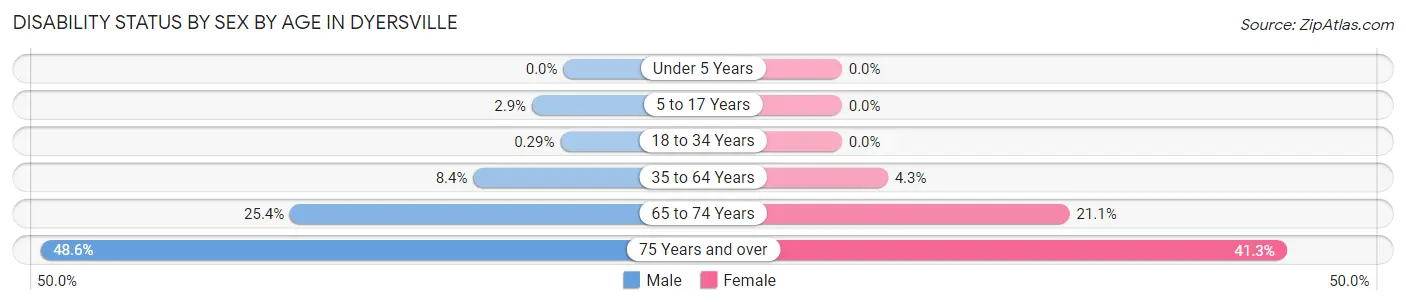
| Age Bracket | Male | Female |
| Under 5 Years | 0 (0.0%) | 0 (0.0%) |
| 5 to 17 Years | 15 (2.9%) | 0 (0.0%) |
| 18 to 34 Years | 1 (0.3%) | 0 (0.0%) |
| 35 to 64 Years | 73 (8.4%) | 38 (4.3%) |
| 65 to 74 Years | 35 (25.4%) | 37 (21.1%) |
| 75 Years and over | 67 (48.5%) | 116 (41.3%) |
Disability Class by Sex by Age in Dyersville
Disability Class: Hearing Difficulty
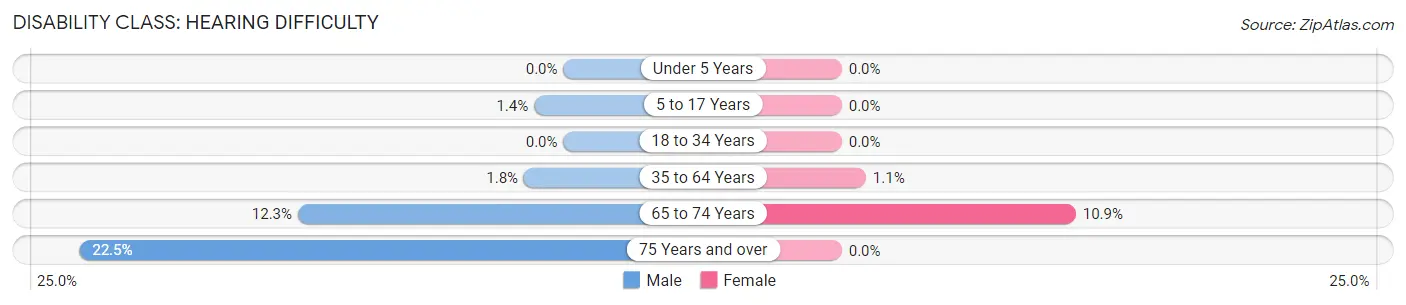
| Age Bracket | Male | Female |
| Under 5 Years | 0 (0.0%) | 0 (0.0%) |
| 5 to 17 Years | 7 (1.4%) | 0 (0.0%) |
| 18 to 34 Years | 0 (0.0%) | 0 (0.0%) |
| 35 to 64 Years | 16 (1.8%) | 10 (1.1%) |
| 65 to 74 Years | 17 (12.3%) | 19 (10.9%) |
| 75 Years and over | 31 (22.5%) | 0 (0.0%) |
Disability Class: Vision Difficulty
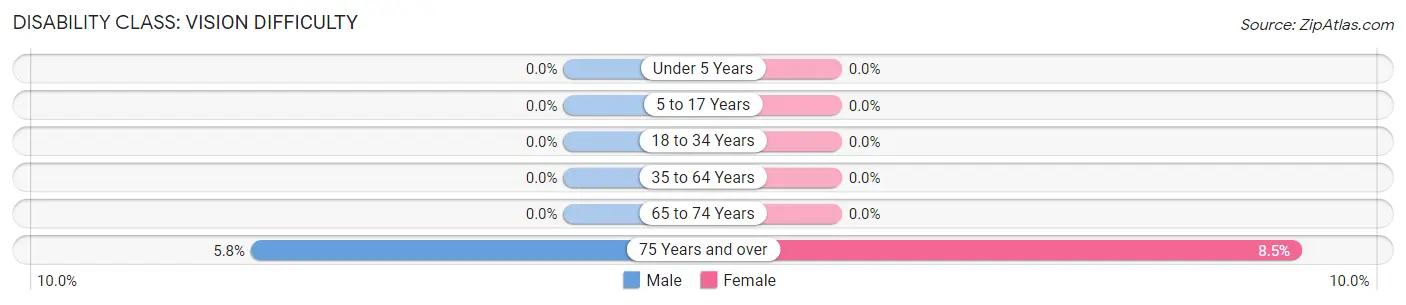
| Age Bracket | Male | Female |
| Under 5 Years | 0 (0.0%) | 0 (0.0%) |
| 5 to 17 Years | 0 (0.0%) | 0 (0.0%) |
| 18 to 34 Years | 0 (0.0%) | 0 (0.0%) |
| 35 to 64 Years | 0 (0.0%) | 0 (0.0%) |
| 65 to 74 Years | 0 (0.0%) | 0 (0.0%) |
| 75 Years and over | 8 (5.8%) | 24 (8.5%) |
Disability Class: Cognitive Difficulty
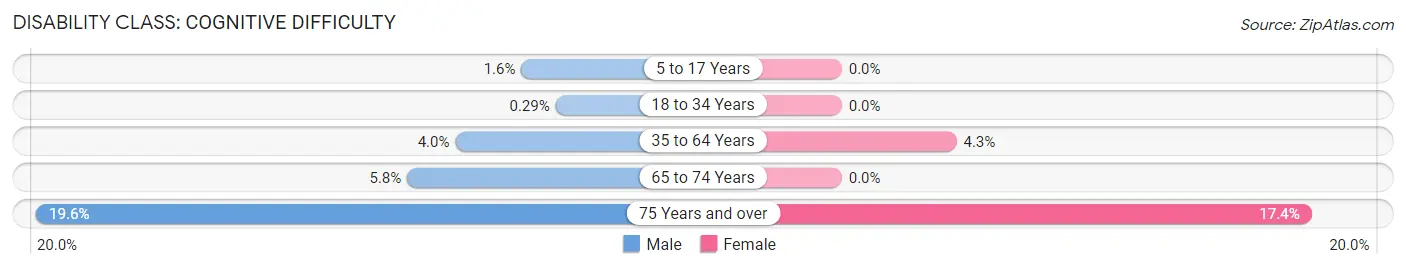
| Age Bracket | Male | Female |
| 5 to 17 Years | 8 (1.6%) | 0 (0.0%) |
| 18 to 34 Years | 1 (0.3%) | 0 (0.0%) |
| 35 to 64 Years | 35 (4.0%) | 38 (4.3%) |
| 65 to 74 Years | 8 (5.8%) | 0 (0.0%) |
| 75 Years and over | 27 (19.6%) | 49 (17.4%) |
Disability Class: Ambulatory Difficulty
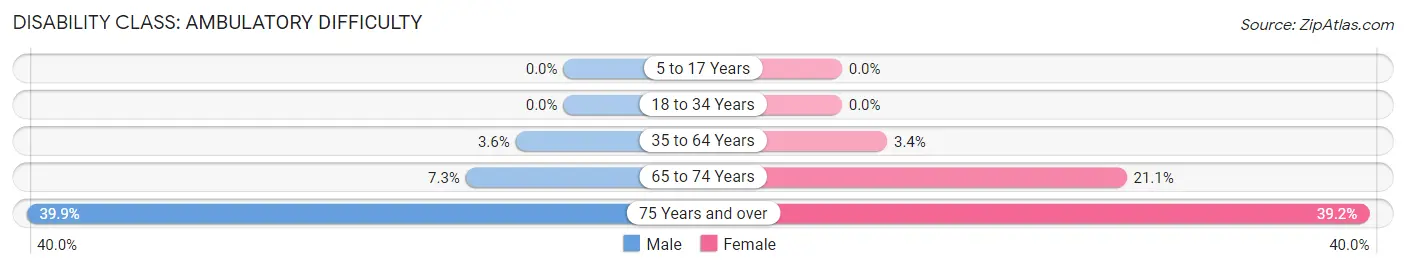
| Age Bracket | Male | Female |
| 5 to 17 Years | 0 (0.0%) | 0 (0.0%) |
| 18 to 34 Years | 0 (0.0%) | 0 (0.0%) |
| 35 to 64 Years | 31 (3.5%) | 30 (3.4%) |
| 65 to 74 Years | 10 (7.2%) | 37 (21.1%) |
| 75 Years and over | 55 (39.9%) | 110 (39.2%) |
Disability Class: Self-Care Difficulty
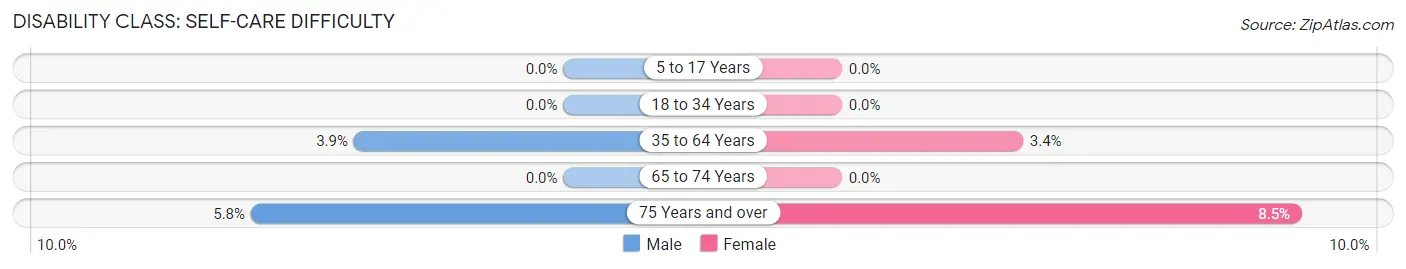
| Age Bracket | Male | Female |
| 5 to 17 Years | 0 (0.0%) | 0 (0.0%) |
| 18 to 34 Years | 0 (0.0%) | 0 (0.0%) |
| 35 to 64 Years | 34 (3.9%) | 30 (3.4%) |
| 65 to 74 Years | 0 (0.0%) | 0 (0.0%) |
| 75 Years and over | 8 (5.8%) | 24 (8.5%) |
Technology Access in Dyersville
Computing Device Access in Dyersville
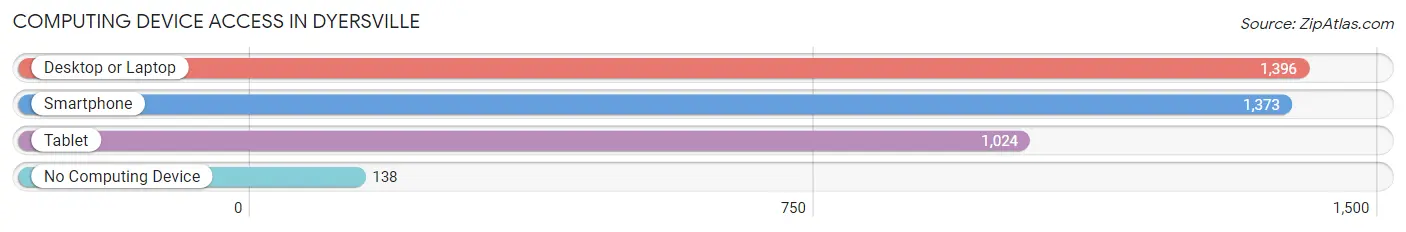
| Device Type | # Households | % Households |
| Desktop or Laptop | 1,396 | 79.5% |
| Smartphone | 1,373 | 78.2% |
| Tablet | 1,024 | 58.3% |
| No Computing Device | 138 | 7.9% |
| Total | 1,756 | 100.0% |
Internet Access in Dyersville
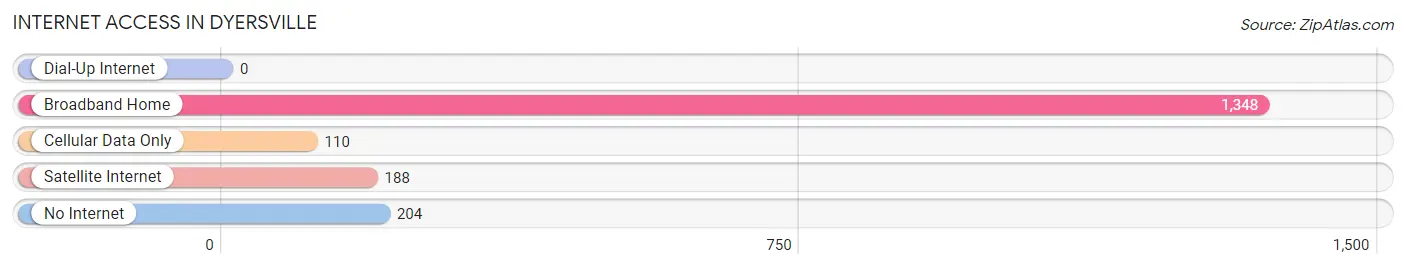
| Internet Type | # Households | % Households |
| Dial-Up Internet | 0 | 0.0% |
| Broadband Home | 1,348 | 76.8% |
| Cellular Data Only | 110 | 6.3% |
| Satellite Internet | 188 | 10.7% |
| No Internet | 204 | 11.6% |
| Total | 1,756 | 100.0% |
Dyersville Summary
Dyersville, Iowa is a small city located in Dubuque County, Iowa. It is situated along the banks of the Maquoketa River, approximately 25 miles west of Dubuque. The city has a population of 4,058 as of the 2010 census, making it the second-largest city in Dubuque County.
History
Dyersville was founded in 1845 by German immigrants, who named the city after their hometown of Dyersville, Germany. The city was incorporated in 1876 and has since grown to become a thriving community.
The city is best known for its role in the 1989 movie Field of Dreams, which was filmed in the city. The movie was a major success and has since become a popular tourist destination.
Geography
Dyersville is located in the rolling hills of the Driftless Area of Iowa. The city is situated along the banks of the Maquoketa River, which flows through the city. The city is located approximately 25 miles west of Dubuque and is part of the Dubuque Metropolitan Statistical Area.
The city has a total area of 4.2 square miles, all of which is land. The city has a humid continental climate, with cold winters and hot, humid summers.
Economy
Dyersville is a small city with a diverse economy. The city is home to several manufacturing companies, including John Deere, which has a large manufacturing plant in the city. The city is also home to several small businesses, including restaurants, retail stores, and other services.
The city is also home to several tourist attractions, including the Field of Dreams movie site, the National Farm Toy Museum, and the Dyersville Commercial Club Park. These attractions bring in thousands of visitors each year, providing a boost to the local economy.
Demographics
As of the 2010 census, the city had a population of 4,058. The racial makeup of the city was 97.3% White, 0.7% African American, 0.3% Native American, 0.3% Asian, 0.2% from other races, and 1.2% from two or more races. Hispanic or Latino of any race were 1.2% of the population.
The median income for a household in the city was $50,902, and the median income for a family was $60,902. The per capita income for the city was $24,902. About 5.2% of families and 6.7% of the population were below the poverty line, including 8.2% of those under age 18 and 5.2% of those age 65 or over.
Dyersville is a small city with a rich history and a diverse economy. The city is home to several tourist attractions, which bring in thousands of visitors each year. The city has a population of 4,058, with a median income of $50,902. The city is a great place to live and work, and is a great place to visit.
Common Questions
What is Per Capita Income in Dyersville?
Per Capita income in Dyersville is $39,088.
What is the Median Family Income in Dyersville?
Median Family Income in Dyersville is $91,094.
What is the Median Household income in Dyersville?
Median Household Income in Dyersville is $71,571.
What is Income or Wage Gap in Dyersville?
Income or Wage Gap in Dyersville is 33.4%.
Women in Dyersville earn 66.6 cents for every dollar earned by a man.
What is Inequality or Gini Index in Dyersville?
Inequality or Gini Index in Dyersville is 0.41.
What is the Total Population of Dyersville?
Total Population of Dyersville is 4,318.
What is the Total Male Population of Dyersville?
Total Male Population of Dyersville is 2,171.
What is the Total Female Population of Dyersville?
Total Female Population of Dyersville is 2,147.
What is the Ratio of Males per 100 Females in Dyersville?
There are 101.12 Males per 100 Females in Dyersville.
What is the Ratio of Females per 100 Males in Dyersville?
There are 98.89 Females per 100 Males in Dyersville.
What is the Median Population Age in Dyersville?
Median Population Age in Dyersville is 42.1 Years.
What is the Average Family Size in Dyersville
Average Family Size in Dyersville is 3.0 People.
What is the Average Household Size in Dyersville
Average Household Size in Dyersville is 2.4 People.
How Large is the Labor Force in Dyersville?
There are 2,392 People in the Labor Forcein in Dyersville.
What is the Percentage of People in the Labor Force in Dyersville?
70.2% of People are in the Labor Force in Dyersville.
What is the Unemployment Rate in Dyersville?
Unemployment Rate in Dyersville is 3.1%.