Cities with the Highest Percentage of German Population in Colorado
RELATED REPORTS & OPTIONS
German
Colorado
Compare Cities
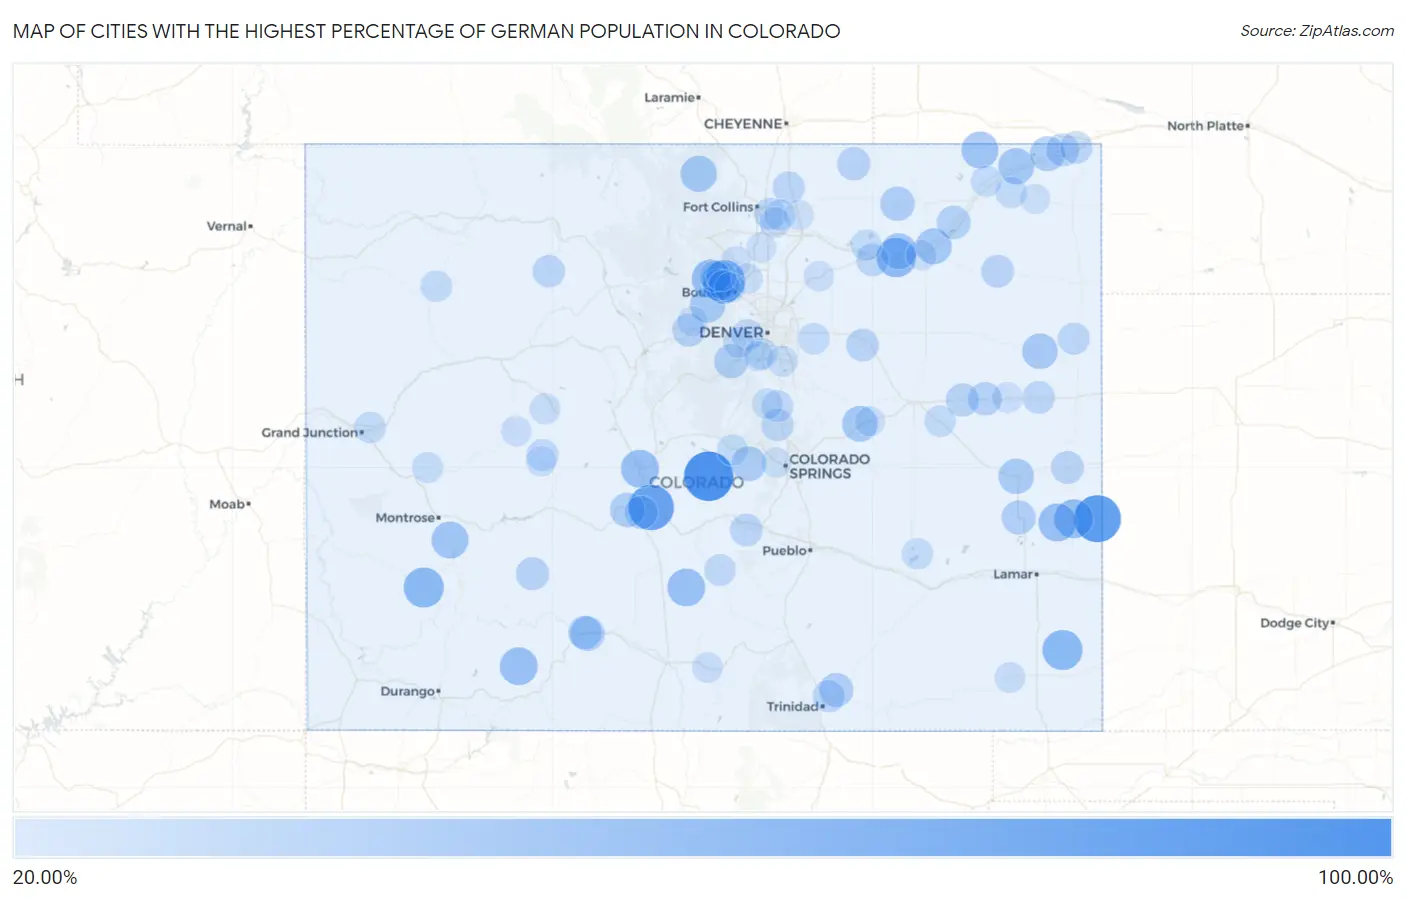
Map of Cities with the Highest Percentage of German Population in Colorado
0.00%
100.00%
Cities with the Highest Percentage of German Population in Colorado
| City | German | vs State | vs National | |
| 1. | Guffey | 100.00% | 17.84%(+82.2)#1 | 12.66%(+87.3)#37 |
| 2. | Towner | 90.00% | 17.84%(+72.2)#2 | 12.66%(+77.3)#110 |
| 3. | Smeltertown | 83.65% | 17.84%(+65.8)#3 | 12.66%(+71.0)#134 |
| 4. | Glendale | 73.53% | 17.84%(+55.7)#4 | 12.66%(+60.9)#220 |
| 5. | Sawpit | 63.64% | 17.84%(+45.8)#5 | 12.66%(+51.0)#456 |
| 6. | Two Buttes | 63.16% | 17.84%(+45.3)#6 | 12.66%(+50.5)#476 |
| 7. | Trail Side | 61.45% | 17.84%(+43.6)#7 | 12.66%(+48.8)#554 |
| 8. | Sheridan Lake | 58.93% | 17.84%(+41.1)#8 | 12.66%(+46.3)#658 |
| 9. | Hidden Lake | 58.62% | 17.84%(+40.8)#9 | 12.66%(+46.0)#673 |
| 10. | Brandon | 55.56% | 17.84%(+37.7)#10 | 12.66%(+42.9)#836 |
| 11. | Johnson Village | 55.41% | 17.84%(+37.6)#11 | 12.66%(+42.8)#846 |
| 12. | Piedra | 55.00% | 17.84%(+37.2)#12 | 12.66%(+42.3)#867 |
| 13. | Crestone | 54.55% | 17.84%(+36.7)#13 | 12.66%(+41.9)#893 |
| 14. | Colona | 51.69% | 17.84%(+33.8)#14 | 12.66%(+39.0)#1,115 |
| 15. | Peetz | 51.52% | 17.84%(+33.7)#15 | 12.66%(+38.9)#1,137 |
| 16. | Red Feather Lakes | 49.30% | 17.84%(+31.5)#16 | 12.66%(+36.6)#1,388 |
| 17. | Crook | 48.75% | 17.84%(+30.9)#17 | 12.66%(+36.1)#1,451 |
| 18. | Morgan Heights | 48.10% | 17.84%(+30.3)#18 | 12.66%(+35.4)#1,535 |
| 19. | Hillrose | 48.03% | 17.84%(+30.2)#19 | 12.66%(+35.4)#1,545 |
| 20. | Ramah | 47.13% | 17.84%(+29.3)#20 | 12.66%(+34.5)#1,692 |
| 21. | Kirk | 46.67% | 17.84%(+28.8)#21 | 12.66%(+34.0)#1,756 |
| 22. | Kit Carson | 45.61% | 17.84%(+27.8)#22 | 12.66%(+33.0)#1,936 |
| 23. | Rollinsville | 45.50% | 17.84%(+27.7)#23 | 12.66%(+32.8)#1,953 |
| 24. | Briggsdale | 45.16% | 17.84%(+27.3)#24 | 12.66%(+32.5)#2,011 |
| 25. | Sedgwick | 44.37% | 17.84%(+26.5)#25 | 12.66%(+31.7)#2,138 |
| 26. | Midland | 43.53% | 17.84%(+25.7)#26 | 12.66%(+30.9)#2,295 |
| 27. | Maysville | 43.45% | 17.84%(+25.6)#27 | 12.66%(+30.8)#2,313 |
| 28. | Gerrard | 42.77% | 17.84%(+24.9)#28 | 12.66%(+30.1)#2,454 |
| 29. | Somerset | 42.62% | 17.84%(+24.8)#29 | 12.66%(+30.0)#2,487 |
| 30. | Raymer New Raymer | 42.55% | 17.84%(+24.7)#30 | 12.66%(+29.9)#2,503 |
| 31. | Hoehne | 41.23% | 17.84%(+23.4)#31 | 12.66%(+28.6)#2,777 |
| 32. | Eads | 41.18% | 17.84%(+23.3)#32 | 12.66%(+28.5)#2,786 |
| 33. | Aspen Park | 40.85% | 17.84%(+23.0)#33 | 12.66%(+28.2)#2,855 |
| 34. | Merino | 39.78% | 17.84%(+21.9)#34 | 12.66%(+27.1)#3,065 |
| 35. | Alpine | 39.27% | 17.84%(+21.4)#35 | 12.66%(+26.6)#3,175 |
| 36. | Crisman | 39.02% | 17.84%(+21.2)#36 | 12.66%(+26.4)#3,233 |
| 37. | Flagler | 38.55% | 17.84%(+20.7)#37 | 12.66%(+25.9)#3,358 |
| 38. | Arriba | 38.30% | 17.84%(+20.5)#38 | 12.66%(+25.6)#3,427 |
| 39. | Grover | 38.18% | 17.84%(+20.3)#39 | 12.66%(+25.5)#3,459 |
| 40. | Poncha Springs | 37.83% | 17.84%(+20.0)#40 | 12.66%(+25.2)#3,537 |
| 41. | Empire | 37.58% | 17.84%(+19.7)#41 | 12.66%(+24.9)#3,596 |
| 42. | Cathedral | 37.50% | 17.84%(+19.7)#42 | 12.66%(+24.8)#3,624 |
| 43. | Ovid | 37.04% | 17.84%(+19.2)#43 | 12.66%(+24.4)#3,752 |
| 44. | Otis | 36.51% | 17.84%(+18.7)#44 | 12.66%(+23.8)#3,894 |
| 45. | Peoria | 36.49% | 17.84%(+18.6)#45 | 12.66%(+23.8)#3,903 |
| 46. | Cheyenne Wells | 36.27% | 17.84%(+18.4)#46 | 12.66%(+23.6)#3,955 |
| 47. | Williamsburg | 35.43% | 17.84%(+17.6)#47 | 12.66%(+22.8)#4,184 |
| 48. | Yampa | 35.14% | 17.84%(+17.3)#48 | 12.66%(+22.5)#4,260 |
| 49. | El Moro | 35.00% | 17.84%(+17.2)#49 | 12.66%(+22.3)#4,294 |
| 50. | Julesburg | 34.96% | 17.84%(+17.1)#50 | 12.66%(+22.3)#4,305 |
| 51. | Wiggins | 34.89% | 17.84%(+17.0)#51 | 12.66%(+22.2)#4,325 |
| 52. | Stratton | 34.76% | 17.84%(+16.9)#52 | 12.66%(+22.1)#4,365 |
| 53. | Blue Valley | 34.50% | 17.84%(+16.7)#53 | 12.66%(+21.8)#4,453 |
| 54. | Nunn | 34.35% | 17.84%(+16.5)#54 | 12.66%(+21.7)#4,491 |
| 55. | Palmer Lake | 33.88% | 17.84%(+16.0)#55 | 12.66%(+21.2)#4,664 |
| 56. | Idalia | 33.77% | 17.84%(+15.9)#56 | 12.66%(+21.1)#4,699 |
| 57. | Timnath | 33.64% | 17.84%(+15.8)#57 | 12.66%(+21.0)#4,731 |
| 58. | Mount Crested Butte | 33.49% | 17.84%(+15.6)#58 | 12.66%(+20.8)#4,780 |
| 59. | Gold Hill | 33.33% | 17.84%(+15.5)#59 | 12.66%(+20.7)#4,813 |
| 60. | Lazear | 33.10% | 17.84%(+15.3)#60 | 12.66%(+20.4)#4,910 |
| 61. | Larkspur | 32.97% | 17.84%(+15.1)#61 | 12.66%(+20.3)#4,952 |
| 62. | East Pleasant View | 32.84% | 17.84%(+15.0)#62 | 12.66%(+20.2)#4,996 |
| 63. | Silver Cliff | 32.65% | 17.84%(+14.8)#63 | 12.66%(+20.0)#5,069 |
| 64. | Columbine Valley | 32.26% | 17.84%(+14.4)#64 | 12.66%(+19.6)#5,218 |
| 65. | Watkins | 32.09% | 17.84%(+14.2)#65 | 12.66%(+19.4)#5,291 |
| 66. | Meeker | 32.00% | 17.84%(+14.2)#66 | 12.66%(+19.3)#5,325 |
| 67. | Fleming | 31.54% | 17.84%(+13.7)#67 | 12.66%(+18.9)#5,491 |
| 68. | Fruitvale | 31.53% | 17.84%(+13.7)#68 | 12.66%(+18.9)#5,498 |
| 69. | Hugo | 31.32% | 17.84%(+13.5)#69 | 12.66%(+18.7)#5,563 |
| 70. | Sugar City | 30.64% | 17.84%(+12.8)#70 | 12.66%(+18.0)#5,815 |
| 71. | Florissant | 30.64% | 17.84%(+12.8)#71 | 12.66%(+18.0)#5,816 |
| 72. | Severance | 30.60% | 17.84%(+12.8)#72 | 12.66%(+17.9)#5,833 |
| 73. | Orchard City | 30.51% | 17.84%(+12.7)#73 | 12.66%(+17.8)#5,862 |
| 74. | Iliff | 30.33% | 17.84%(+12.5)#74 | 12.66%(+17.7)#5,932 |
| 75. | Bark Ranch | 30.23% | 17.84%(+12.4)#75 | 12.66%(+17.6)#5,976 |
| 76. | Orchard | 30.23% | 17.84%(+12.4)#76 | 12.66%(+17.6)#5,978 |
| 77. | Idledale | 29.79% | 17.84%(+11.9)#77 | 12.66%(+17.1)#6,147 |
| 78. | Snowmass Village | 29.62% | 17.84%(+11.8)#78 | 12.66%(+17.0)#6,221 |
| 79. | Meridian | 29.13% | 17.84%(+11.3)#79 | 12.66%(+16.5)#6,418 |
| 80. | Perry Park | 28.74% | 17.84%(+10.9)#80 | 12.66%(+16.1)#6,587 |
| 81. | Windsor | 28.72% | 17.84%(+10.9)#81 | 12.66%(+16.1)#6,597 |
| 82. | Pritchett | 28.68% | 17.84%(+10.8)#82 | 12.66%(+16.0)#6,612 |
| 83. | Blanca | 28.66% | 17.84%(+10.8)#83 | 12.66%(+16.0)#6,621 |
| 84. | Seibert | 28.57% | 17.84%(+10.7)#84 | 12.66%(+15.9)#6,675 |
| 85. | Lyons | 28.56% | 17.84%(+10.7)#85 | 12.66%(+15.9)#6,692 |
| 86. | Niwot | 28.38% | 17.84%(+10.5)#86 | 12.66%(+15.7)#6,767 |
| 87. | Crested Butte | 28.31% | 17.84%(+10.5)#87 | 12.66%(+15.7)#6,788 |
| 88. | Keenesburg | 27.98% | 17.84%(+10.1)#88 | 12.66%(+15.3)#6,921 |
| 89. | Brush | 27.98% | 17.84%(+10.1)#89 | 12.66%(+15.3)#6,922 |
| 90. | Sunshine | 27.83% | 17.84%(+9.99)#90 | 12.66%(+15.2)#6,985 |
| 91. | Marble | 27.75% | 17.84%(+9.91)#91 | 12.66%(+15.1)#7,031 |
| 92. | Pine Brook Hill | 27.64% | 17.84%(+9.80)#92 | 12.66%(+15.0)#7,076 |
| 93. | Berthoud | 27.41% | 17.84%(+9.57)#93 | 12.66%(+14.8)#7,172 |
| 94. | Manitou Springs | 27.33% | 17.84%(+9.49)#94 | 12.66%(+14.7)#7,203 |
| 95. | Columbine | 27.27% | 17.84%(+9.43)#95 | 12.66%(+14.6)#7,228 |
| 96. | St Mary S | 27.19% | 17.84%(+9.35)#96 | 12.66%(+14.5)#7,257 |
| 97. | Haxtun | 27.04% | 17.84%(+9.20)#97 | 12.66%(+14.4)#7,328 |
| 98. | Simla | 26.87% | 17.84%(+9.03)#98 | 12.66%(+14.2)#7,409 |
| 99. | Eaton | 26.86% | 17.84%(+9.02)#99 | 12.66%(+14.2)#7,413 |
| 100. | Jamestown | 26.83% | 17.84%(+8.99)#100 | 12.66%(+14.2)#7,422 |
Common Questions
What are the Top 10 Cities with the Highest Percentage of German Population in Colorado?
Top 10 Cities with the Highest Percentage of German Population in Colorado are:
#1
100.00%
#2
90.00%
#3
83.65%
#4
73.53%
#5
63.64%
#6
63.16%
#7
61.45%
#8
58.93%
#9
58.62%
#10
55.56%
What city has the Highest Percentage of German Population in Colorado?
Guffey has the Highest Percentage of German Population in Colorado with 100.00%.
What is the Percentage of German Population in the State of Colorado?
Percentage of German Population in Colorado is 17.84%.
What is the Percentage of German Population in the United States?
Percentage of German Population in the United States is 12.66%.