Little Rock, IA Map & Demographics
Little Rock Map
Little Rock Overview
$27,607
PER CAPITA INCOME
$68,906
AVG FAMILY INCOME
$64,000
AVG HOUSEHOLD INCOME
56.6%
WAGE / INCOME GAP [ % ]
43.4¢/ $1
WAGE / INCOME GAP [ $ ]
0.37
INEQUALITY / GINI INDEX
430
TOTAL POPULATION
223
MALE POPULATION
207
FEMALE POPULATION
107.73
MALES / 100 FEMALES
92.83
FEMALES / 100 MALES
30.7
MEDIAN AGE
3.7
AVG FAMILY SIZE
2.8
AVG HOUSEHOLD SIZE
236
LABOR FORCE [ PEOPLE ]
68.4%
PERCENT IN LABOR FORCE
0.9%
UNEMPLOYMENT RATE
Little Rock Zip Codes
Little Rock Area Codes
Income in Little Rock
Income Overview in Little Rock
Per Capita Income in Little Rock is $27,607, while median incomes of families and households are $68,906 and $64,000 respectively.
| Characteristic | Number | Measure |
| Per Capita Income | 430 | $27,607 |
| Median Family Income | 95 | $68,906 |
| Mean Family Income | 95 | $87,256 |
| Median Household Income | 154 | $64,000 |
| Mean Household Income | 154 | $72,912 |
| Income Deficit | 95 | $0 |
| Wage / Income Gap (%) | 430 | 56.65% |
| Wage / Income Gap ($) | 430 | 43.35¢ per $1 |
| Gini / Inequality Index | 430 | 0.37 |
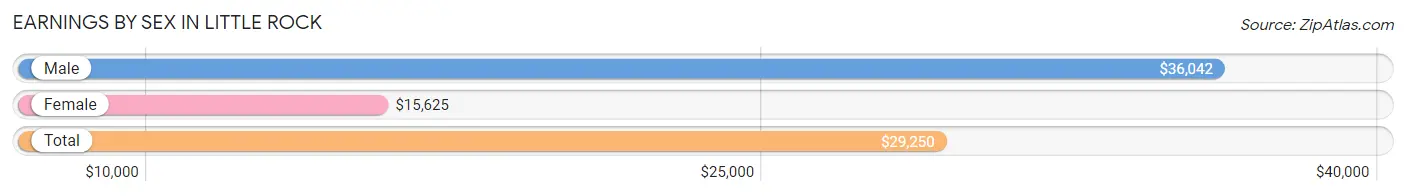
Earnings by Sex in Little Rock
Average Earnings in Little Rock are $29,250, $36,042 for men and $15,625 for women, a difference of 56.7%.
| Sex | Number | Average Earnings |
| Male | 144 (54.3%) | $36,042 |
| Female | 121 (45.7%) | $15,625 |
| Total | 265 (100.0%) | $29,250 |
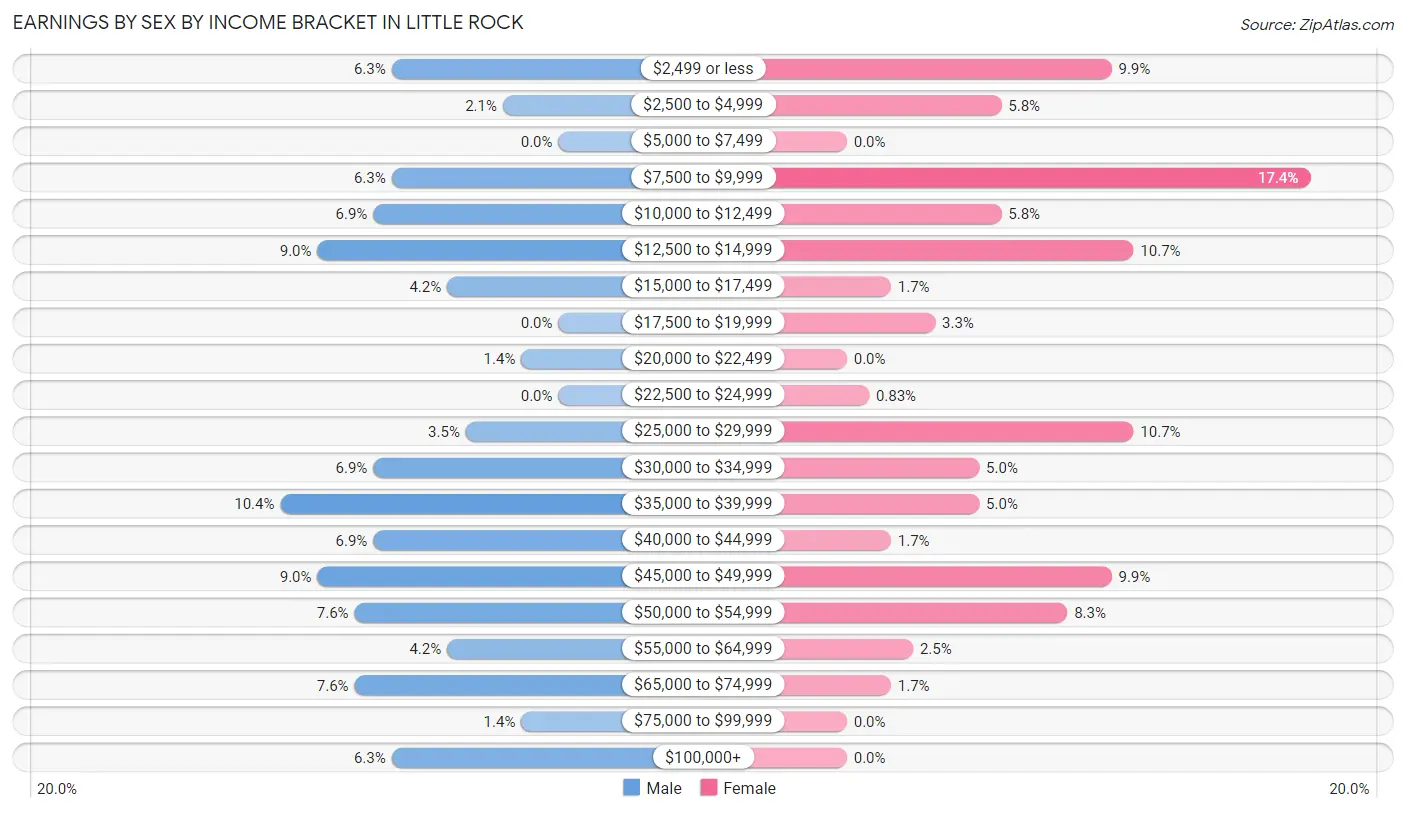
Earnings by Sex by Income Bracket in Little Rock
The most common earnings brackets in Little Rock are $35,000 to $39,999 for men (15 | 10.4%) and $7,500 to $9,999 for women (21 | 17.4%).
| Income | Male | Female |
| $2,499 or less | 9 (6.2%) | 12 (9.9%) |
| $2,500 to $4,999 | 3 (2.1%) | 7 (5.8%) |
| $5,000 to $7,499 | 0 (0.0%) | 0 (0.0%) |
| $7,500 to $9,999 | 9 (6.2%) | 21 (17.4%) |
| $10,000 to $12,499 | 10 (6.9%) | 7 (5.8%) |
| $12,500 to $14,999 | 13 (9.0%) | 13 (10.7%) |
| $15,000 to $17,499 | 6 (4.2%) | 2 (1.7%) |
| $17,500 to $19,999 | 0 (0.0%) | 4 (3.3%) |
| $20,000 to $22,499 | 2 (1.4%) | 0 (0.0%) |
| $22,500 to $24,999 | 0 (0.0%) | 1 (0.8%) |
| $25,000 to $29,999 | 5 (3.5%) | 13 (10.7%) |
| $30,000 to $34,999 | 10 (6.9%) | 6 (5.0%) |
| $35,000 to $39,999 | 15 (10.4%) | 6 (5.0%) |
| $40,000 to $44,999 | 10 (6.9%) | 2 (1.7%) |
| $45,000 to $49,999 | 13 (9.0%) | 12 (9.9%) |
| $50,000 to $54,999 | 11 (7.6%) | 10 (8.3%) |
| $55,000 to $64,999 | 6 (4.2%) | 3 (2.5%) |
| $65,000 to $74,999 | 11 (7.6%) | 2 (1.7%) |
| $75,000 to $99,999 | 2 (1.4%) | 0 (0.0%) |
| $100,000+ | 9 (6.2%) | 0 (0.0%) |
| Total | 144 (100.0%) | 121 (100.0%) |
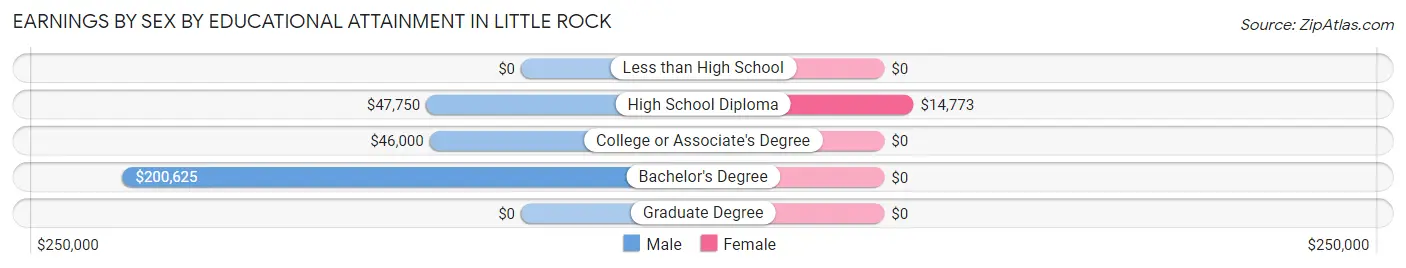
Earnings by Sex by Educational Attainment in Little Rock
Average earnings in Little Rock are $47,656 for men and $28,000 for women, a difference of 41.2%. Men with an educational attainment of bachelor's degree enjoy the highest average annual earnings of $200,625, while those with college or associate's degree education earn the least with $46,000. Women with an educational attainment of high school diploma earn the most with the average annual earnings of $14,773, while those with high school diploma education have the smallest earnings of $14,773.
| Educational Attainment | Male Income | Female Income |
| Less than High School | - | - |
| High School Diploma | $47,750 | $14,773 |
| College or Associate's Degree | $46,000 | $0 |
| Bachelor's Degree | $200,625 | $0 |
| Graduate Degree | - | - |
| Total | $47,656 | $28,000 |
Family Income in Little Rock
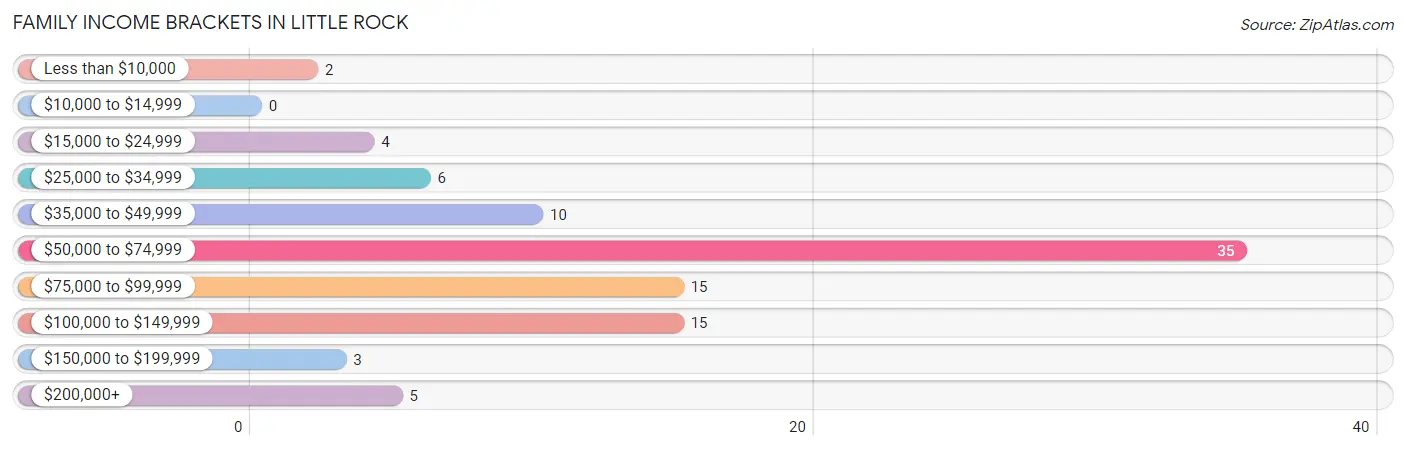
Family Income Brackets in Little Rock
According to the Little Rock family income data, there are 35 families falling into the $50,000 to $74,999 income range, which is the most common income bracket and makes up 36.8% of all families.
| Income Bracket | # Families | % Families |
| Less than $10,000 | 2 | 2.1% |
| $10,000 to $14,999 | 0 | 0.0% |
| $15,000 to $24,999 | 4 | 4.2% |
| $25,000 to $34,999 | 6 | 6.3% |
| $35,000 to $49,999 | 10 | 10.5% |
| $50,000 to $74,999 | 35 | 36.8% |
| $75,000 to $99,999 | 15 | 15.8% |
| $100,000 to $149,999 | 15 | 15.8% |
| $150,000 to $199,999 | 3 | 3.2% |
| $200,000+ | 5 | 5.3% |
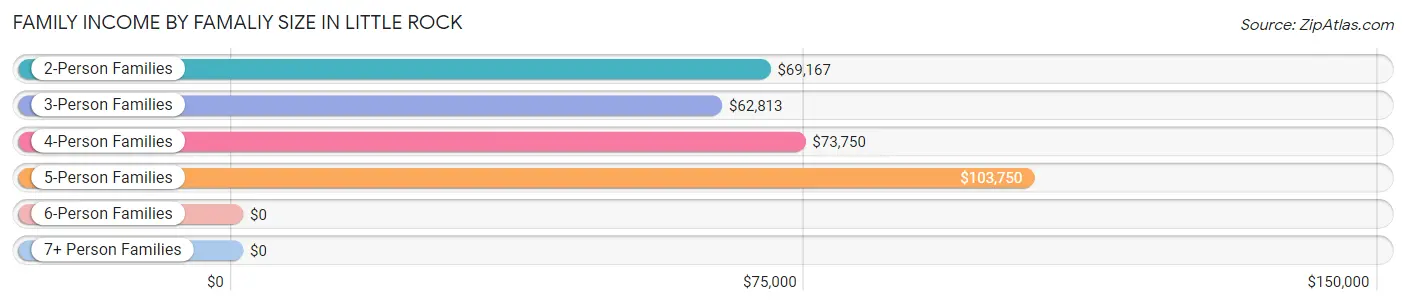
Family Income by Famaliy Size in Little Rock
5-person families (13 | 13.7%) account for the highest median family income in Little Rock with $103,750 per family, while 2-person families (48 | 50.5%) have the highest median income of $34,584 per family member.
| Income Bracket | # Families | Median Income |
| 2-Person Families | 48 (50.5%) | $69,167 |
| 3-Person Families | 20 (21.0%) | $62,813 |
| 4-Person Families | 9 (9.5%) | $73,750 |
| 5-Person Families | 13 (13.7%) | $103,750 |
| 6-Person Families | 3 (3.2%) | $0 |
| 7+ Person Families | 2 (2.1%) | $0 |
| Total | 95 (100.0%) | $68,906 |
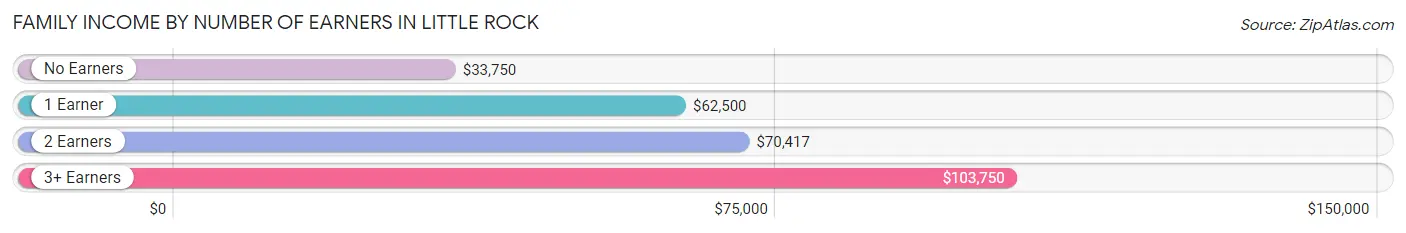
Family Income by Number of Earners in Little Rock
The median family income in Little Rock is $68,906, with families comprising 3+ earners (17) having the highest median family income of $103,750, while families with no earners (11) have the lowest median family income of $33,750, accounting for 17.9% and 11.6% of families, respectively.
| Number of Earners | # Families | Median Income |
| No Earners | 11 (11.6%) | $33,750 |
| 1 Earner | 20 (21.0%) | $62,500 |
| 2 Earners | 47 (49.5%) | $70,417 |
| 3+ Earners | 17 (17.9%) | $103,750 |
| Total | 95 (100.0%) | $68,906 |
Household Income in Little Rock
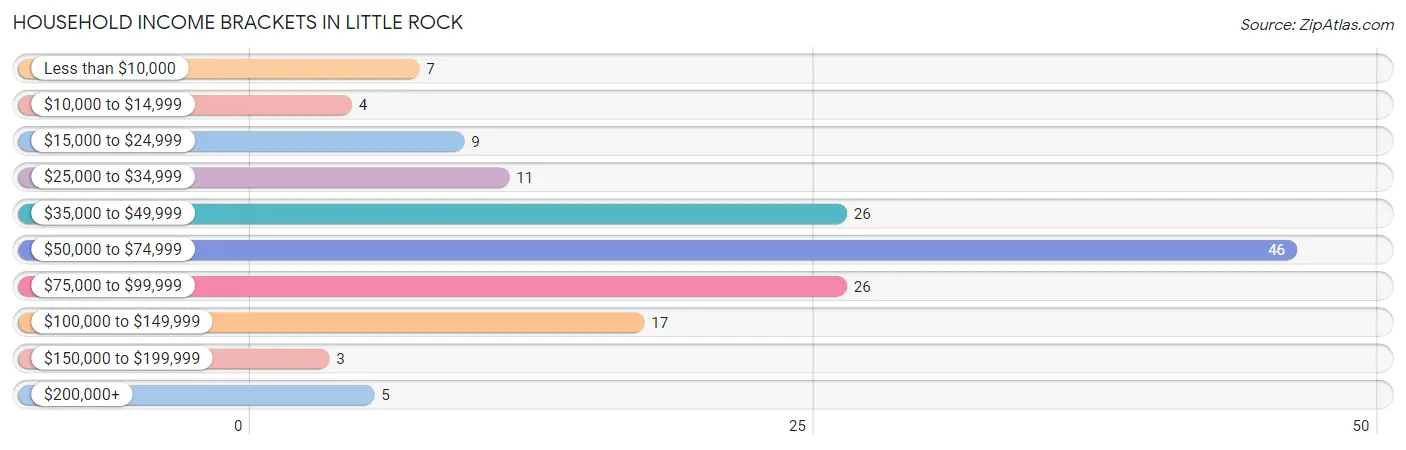
Household Income Brackets in Little Rock
With 46 households falling in the category, the $50,000 to $74,999 income range is the most frequent in Little Rock, accounting for 29.9% of all households. In contrast, only 3 households (1.9%) fall into the $150,000 to $199,999 income bracket, making it the least populous group.
| Income Bracket | # Households | % Households |
| Less than $10,000 | 7 | 4.5% |
| $10,000 to $14,999 | 4 | 2.6% |
| $15,000 to $24,999 | 9 | 5.8% |
| $25,000 to $34,999 | 11 | 7.1% |
| $35,000 to $49,999 | 26 | 16.9% |
| $50,000 to $74,999 | 46 | 29.9% |
| $75,000 to $99,999 | 26 | 16.9% |
| $100,000 to $149,999 | 17 | 11.0% |
| $150,000 to $199,999 | 3 | 1.9% |
| $200,000+ | 5 | 3.2% |
Household Income by Householder Age in Little Rock
The median household income in Little Rock is $64,000, with the highest median household income of $83,036 found in the 45 to 64 years age bracket for the primary householder. A total of 51 households (33.1%) fall into this category. Meanwhile, the 65+ years age bracket for the primary householder has the lowest median household income of $42,750, with 59 households (38.3%) in this group.
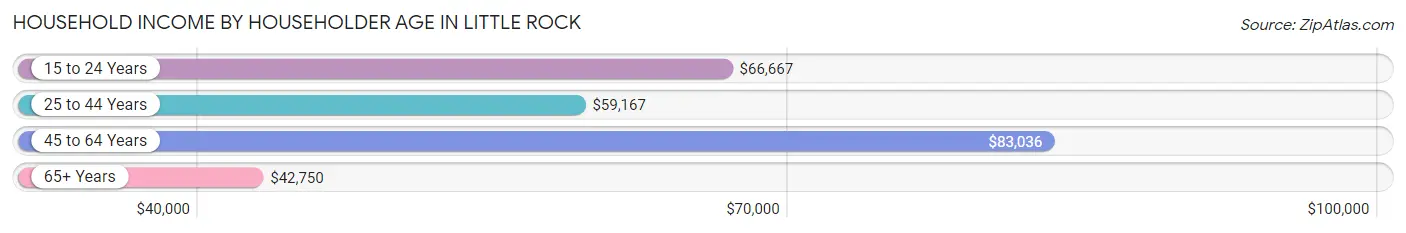
| Income Bracket | # Households | Median Income |
| 15 to 24 Years | 8 (5.2%) | $66,667 |
| 25 to 44 Years | 36 (23.4%) | $59,167 |
| 45 to 64 Years | 51 (33.1%) | $83,036 |
| 65+ Years | 59 (38.3%) | $42,750 |
| Total | 154 (100.0%) | $64,000 |
Poverty in Little Rock
Income Below Poverty by Sex and Age in Little Rock
With 2.2% poverty level for males and 4.8% for females among the residents of Little Rock, 75 year old and over males and 75 year old and over females are the most vulnerable to poverty, with 4 males (17.4%) and 6 females (25.0%) in their respective age groups living below the poverty level.
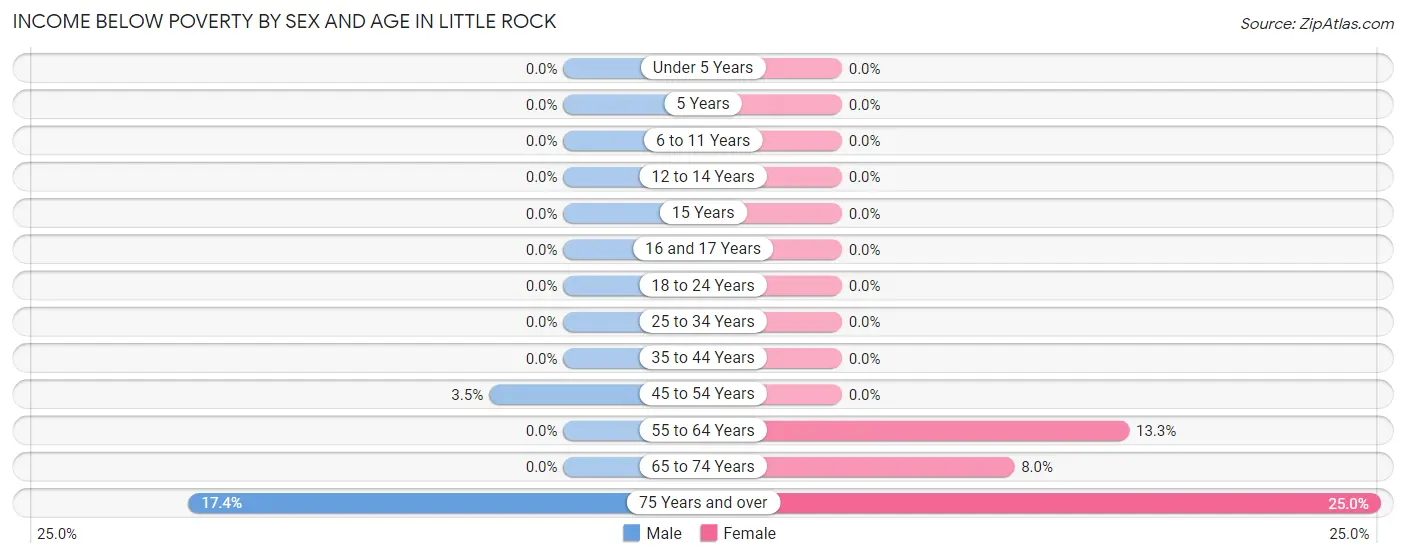
| Age Bracket | Male | Female |
| Under 5 Years | 0 (0.0%) | 0 (0.0%) |
| 5 Years | 0 (0.0%) | 0 (0.0%) |
| 6 to 11 Years | 0 (0.0%) | 0 (0.0%) |
| 12 to 14 Years | 0 (0.0%) | 0 (0.0%) |
| 15 Years | 0 (0.0%) | 0 (0.0%) |
| 16 and 17 Years | 0 (0.0%) | 0 (0.0%) |
| 18 to 24 Years | 0 (0.0%) | 0 (0.0%) |
| 25 to 34 Years | 0 (0.0%) | 0 (0.0%) |
| 35 to 44 Years | 0 (0.0%) | 0 (0.0%) |
| 45 to 54 Years | 1 (3.5%) | 0 (0.0%) |
| 55 to 64 Years | 0 (0.0%) | 2 (13.3%) |
| 65 to 74 Years | 0 (0.0%) | 2 (8.0%) |
| 75 Years and over | 4 (17.4%) | 6 (25.0%) |
| Total | 5 (2.2%) | 10 (4.8%) |
Income Above Poverty by Sex and Age in Little Rock
According to the poverty statistics in Little Rock, males aged under 5 years and females aged under 5 years are the age groups that are most secure financially, with 100.0% of males and 100.0% of females in these age groups living above the poverty line.
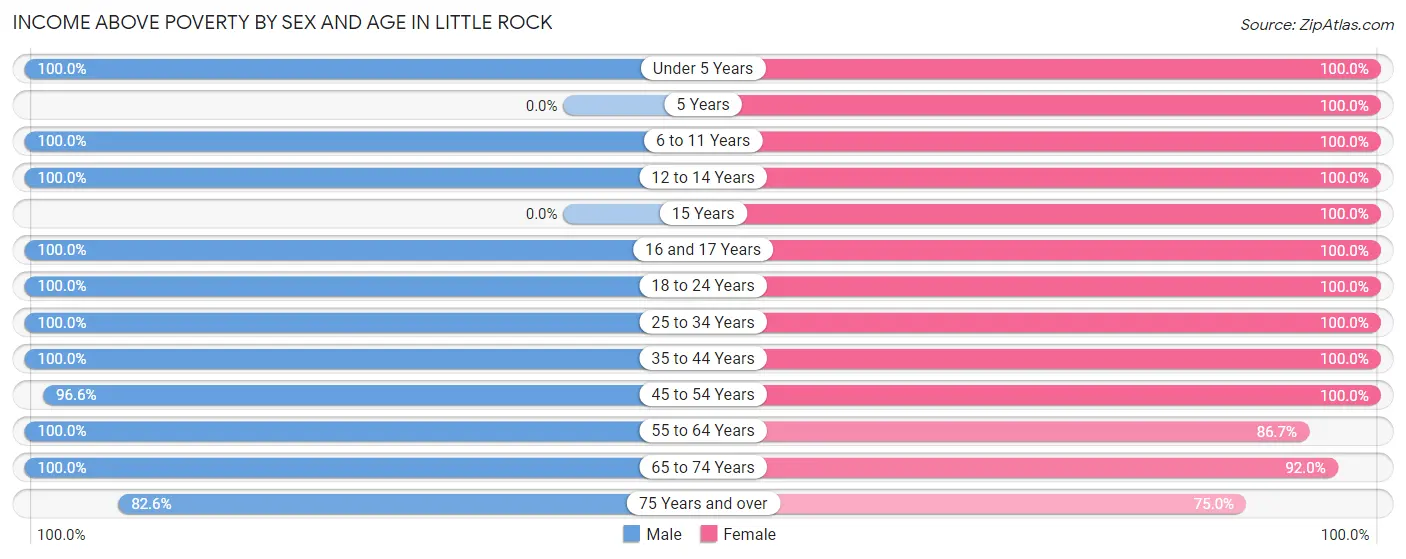
| Age Bracket | Male | Female |
| Under 5 Years | 6 (100.0%) | 25 (100.0%) |
| 5 Years | 0 (0.0%) | 1 (100.0%) |
| 6 to 11 Years | 20 (100.0%) | 9 (100.0%) |
| 12 to 14 Years | 14 (100.0%) | 7 (100.0%) |
| 15 Years | 0 (0.0%) | 3 (100.0%) |
| 16 and 17 Years | 18 (100.0%) | 4 (100.0%) |
| 18 to 24 Years | 46 (100.0%) | 31 (100.0%) |
| 25 to 34 Years | 18 (100.0%) | 24 (100.0%) |
| 35 to 44 Years | 15 (100.0%) | 11 (100.0%) |
| 45 to 54 Years | 28 (96.6%) | 28 (100.0%) |
| 55 to 64 Years | 15 (100.0%) | 13 (86.7%) |
| 65 to 74 Years | 19 (100.0%) | 23 (92.0%) |
| 75 Years and over | 19 (82.6%) | 18 (75.0%) |
| Total | 218 (97.8%) | 197 (95.2%) |
Income Below Poverty Among Married-Couple Families in Little Rock
The poverty statistics for married-couple families in Little Rock show that 2.5% or 2 of the total 80 families live below the poverty line. Families with no children have the highest poverty rate of 4.4%, comprising of 2 families. On the other hand, families with 1 or 2 children have the lowest poverty rate of 0.0%, which includes 0 families.
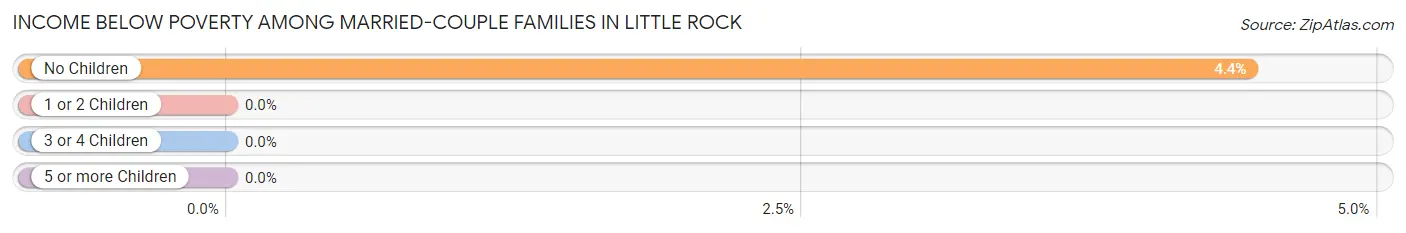
| Children | Above Poverty | Below Poverty |
| No Children | 43 (95.6%) | 2 (4.4%) |
| 1 or 2 Children | 30 (100.0%) | 0 (0.0%) |
| 3 or 4 Children | 3 (100.0%) | 0 (0.0%) |
| 5 or more Children | 2 (100.0%) | 0 (0.0%) |
| Total | 78 (97.5%) | 2 (2.5%) |
Income Below Poverty Among Single-Parent Households in Little Rock
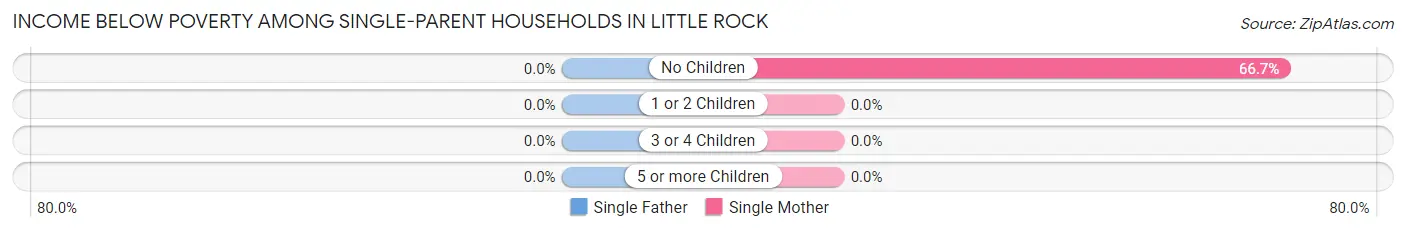
| Children | Single Father | Single Mother |
| No Children | 0 (0.0%) | 2 (66.7%) |
| 1 or 2 Children | 0 (0.0%) | 0 (0.0%) |
| 3 or 4 Children | 0 (0.0%) | 0 (0.0%) |
| 5 or more Children | 0 (0.0%) | 0 (0.0%) |
| Total | 0 (0.0%) | 2 (15.4%) |
Income Below Poverty Among Married-Couple vs Single-Parent Households in Little Rock
The poverty data for Little Rock shows that 2 of the married-couple family households (2.5%) and 2 of the single-parent households (13.3%) are living below the poverty level. Within the married-couple family households, those with no children have the highest poverty rate, with 2 households (4.4%) falling below the poverty line. Among the single-parent households, those with no children have the highest poverty rate, with 2 household (40.0%) living below poverty.
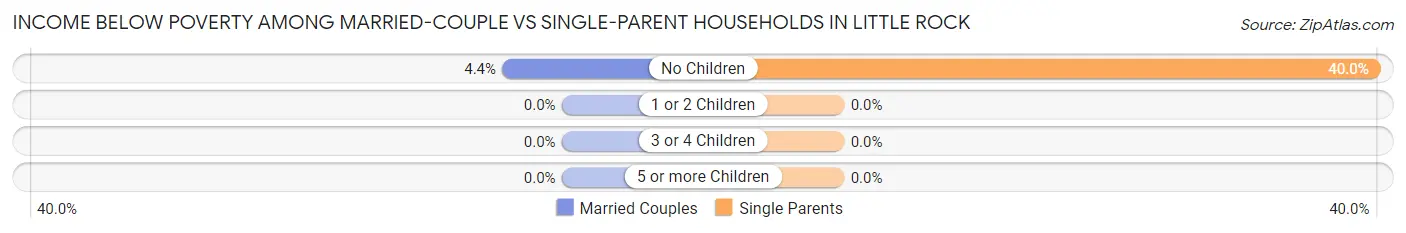
| Children | Married-Couple Families | Single-Parent Households |
| No Children | 2 (4.4%) | 2 (40.0%) |
| 1 or 2 Children | 0 (0.0%) | 0 (0.0%) |
| 3 or 4 Children | 0 (0.0%) | 0 (0.0%) |
| 5 or more Children | 0 (0.0%) | 0 (0.0%) |
| Total | 2 (2.5%) | 2 (13.3%) |
Race in Little Rock
The most populous races in Little Rock are White / Caucasian (374 | 87.0%), Hispanic or Latino (42 | 9.8%), and Two or more Races (30 | 7.0%).
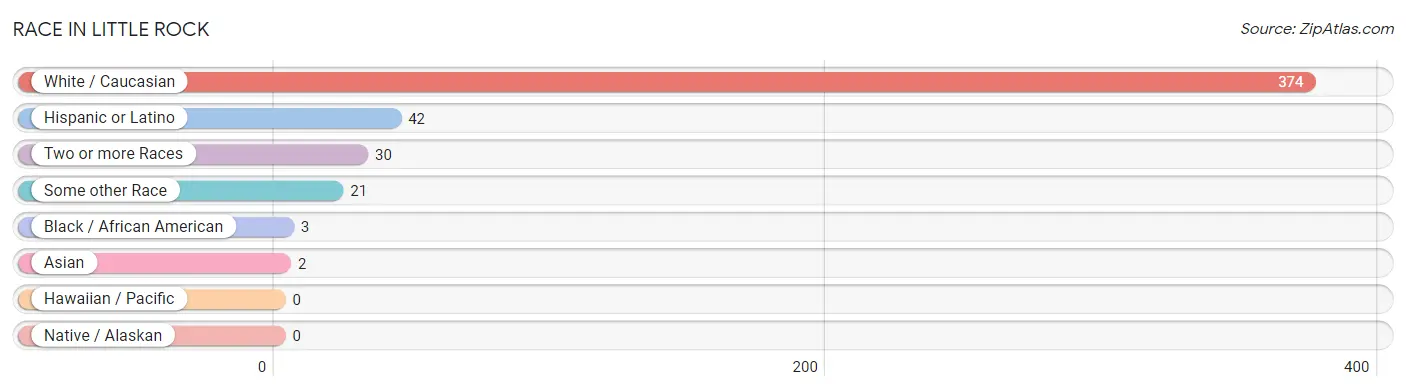
| Race | # Population | % Population |
| Asian | 2 | 0.5% |
| Black / African American | 3 | 0.7% |
| Hawaiian / Pacific | 0 | 0.0% |
| Hispanic or Latino | 42 | 9.8% |
| Native / Alaskan | 0 | 0.0% |
| White / Caucasian | 374 | 87.0% |
| Two or more Races | 30 | 7.0% |
| Some other Race | 21 | 4.9% |
| Total | 430 | 100.0% |
Ancestry in Little Rock
The most populous ancestries reported in Little Rock are German (237 | 55.1%), Dutch (85 | 19.8%), Mexican (35 | 8.1%), American (18 | 4.2%), and Korean (11 | 2.6%), together accounting for 89.8% of all Little Rock residents.
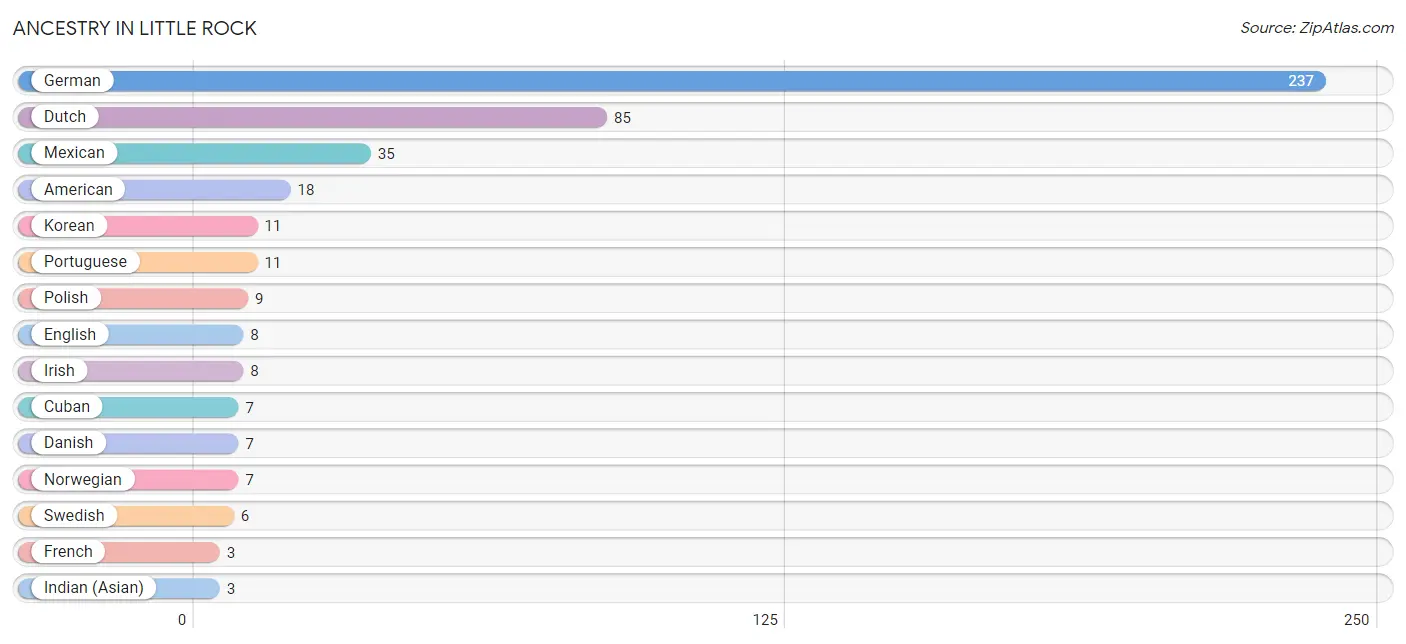
| Ancestry | # Population | % Population |
| American | 18 | 4.2% |
| Cuban | 7 | 1.6% |
| Danish | 7 | 1.6% |
| Dutch | 85 | 19.8% |
| English | 8 | 1.9% |
| French | 3 | 0.7% |
| German | 237 | 55.1% |
| Indian (Asian) | 3 | 0.7% |
| Irish | 8 | 1.9% |
| Italian | 2 | 0.5% |
| Korean | 11 | 2.6% |
| Lithuanian | 1 | 0.2% |
| Mexican | 35 | 8.1% |
| Norwegian | 7 | 1.6% |
| Polish | 9 | 2.1% |
| Portuguese | 11 | 2.6% |
| Russian | 1 | 0.2% |
| Scottish | 1 | 0.2% |
| Sri Lankan | 3 | 0.7% |
| Swedish | 6 | 1.4% |
| Swiss | 2 | 0.5% |
| Welsh | 3 | 0.7% | View All 22 Rows |
Immigrants in Little Rock
The most numerous immigrant groups reported in Little Rock came from Latin America (25 | 5.8%), Central America (23 | 5.3%), Mexico (23 | 5.3%), Asia (2 | 0.5%), and Brazil (2 | 0.5%), together accounting for 17.5% of all Little Rock residents.
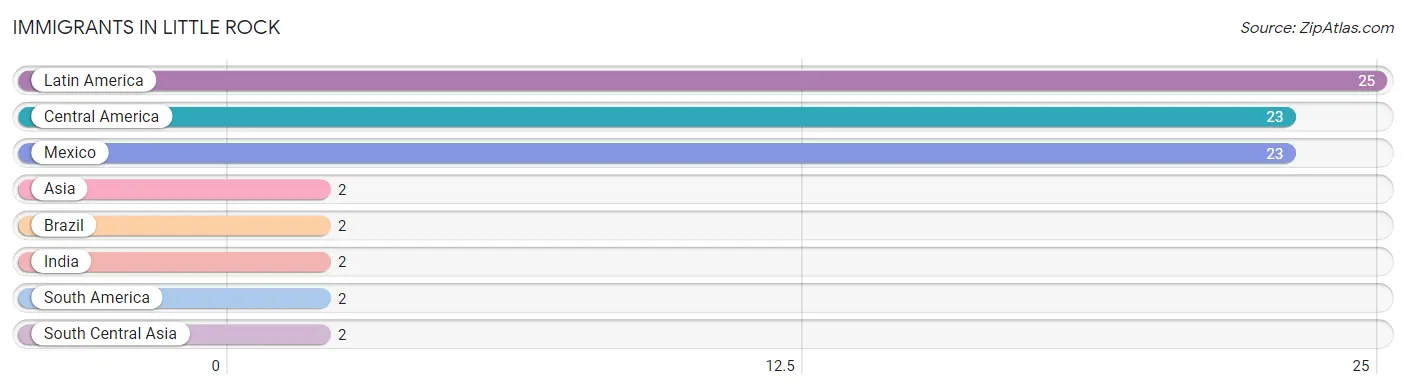
| Immigration Origin | # Population | % Population |
| Asia | 2 | 0.5% |
| Brazil | 2 | 0.5% |
| Central America | 23 | 5.3% |
| India | 2 | 0.5% |
| Latin America | 25 | 5.8% |
| Mexico | 23 | 5.3% |
| South America | 2 | 0.5% |
| South Central Asia | 2 | 0.5% | View All 8 Rows |
Sex and Age in Little Rock
Sex and Age in Little Rock
The most populous age groups in Little Rock are 20 to 24 Years (33 | 14.8%) for men and 20 to 24 Years (28 | 13.5%) for women.
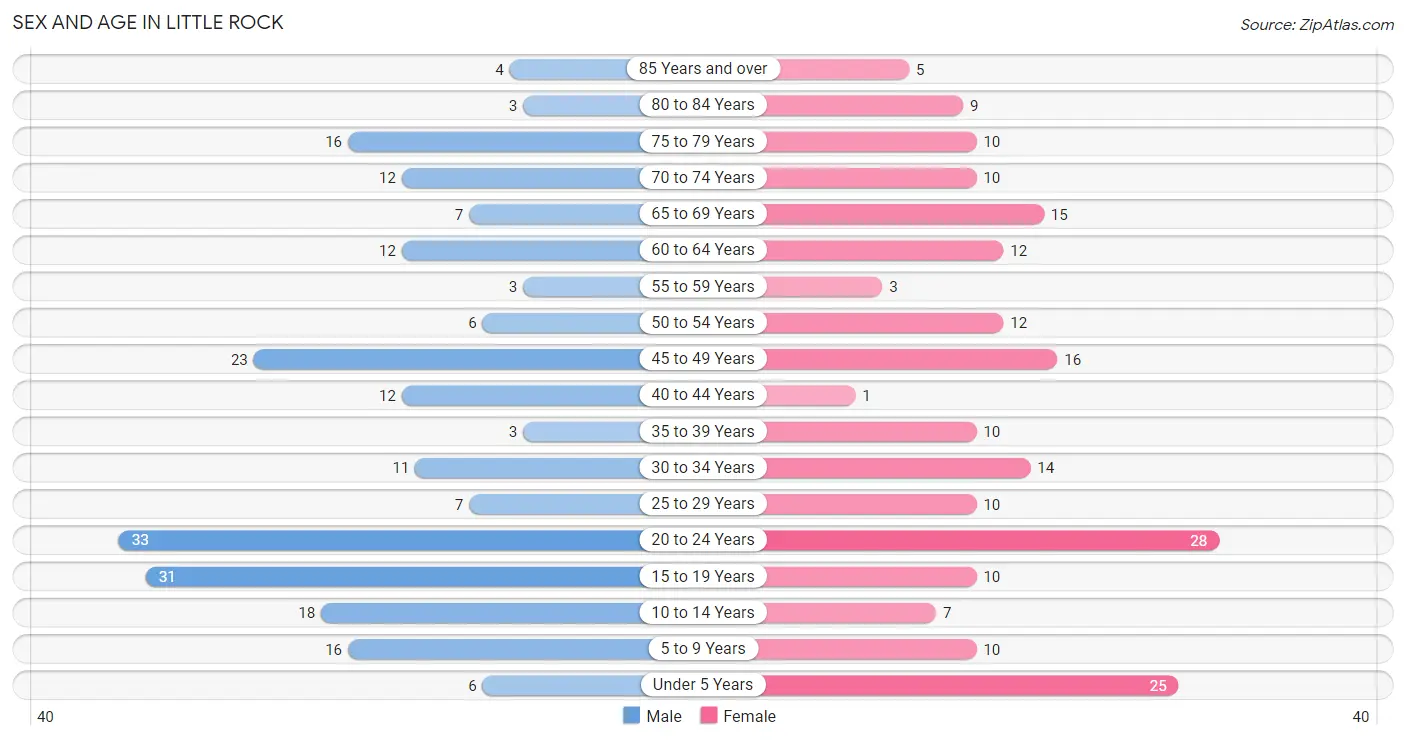
| Age Bracket | Male | Female |
| Under 5 Years | 6 (2.7%) | 25 (12.1%) |
| 5 to 9 Years | 16 (7.2%) | 10 (4.8%) |
| 10 to 14 Years | 18 (8.1%) | 7 (3.4%) |
| 15 to 19 Years | 31 (13.9%) | 10 (4.8%) |
| 20 to 24 Years | 33 (14.8%) | 28 (13.5%) |
| 25 to 29 Years | 7 (3.1%) | 10 (4.8%) |
| 30 to 34 Years | 11 (4.9%) | 14 (6.8%) |
| 35 to 39 Years | 3 (1.3%) | 10 (4.8%) |
| 40 to 44 Years | 12 (5.4%) | 1 (0.5%) |
| 45 to 49 Years | 23 (10.3%) | 16 (7.7%) |
| 50 to 54 Years | 6 (2.7%) | 12 (5.8%) |
| 55 to 59 Years | 3 (1.3%) | 3 (1.5%) |
| 60 to 64 Years | 12 (5.4%) | 12 (5.8%) |
| 65 to 69 Years | 7 (3.1%) | 15 (7.2%) |
| 70 to 74 Years | 12 (5.4%) | 10 (4.8%) |
| 75 to 79 Years | 16 (7.2%) | 10 (4.8%) |
| 80 to 84 Years | 3 (1.3%) | 9 (4.3%) |
| 85 Years and over | 4 (1.8%) | 5 (2.4%) |
| Total | 223 (100.0%) | 207 (100.0%) |
Families and Households in Little Rock
Median Family Size in Little Rock
The median family size in Little Rock is 3.72 persons per family, with single female/mother families (13 | 13.7%) accounting for the largest median family size of 4.46 persons per family. On the other hand, single male/father families (2 | 2.1%) represent the smallest median family size with 3.00 persons per family.
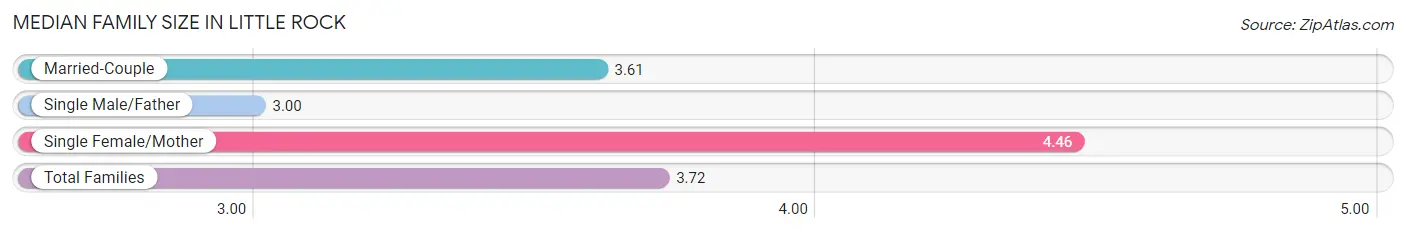
| Family Type | # Families | Family Size |
| Married-Couple | 80 (84.2%) | 3.61 |
| Single Male/Father | 2 (2.1%) | 3.00 |
| Single Female/Mother | 13 (13.7%) | 4.46 |
| Total Families | 95 (100.0%) | 3.72 |
Median Household Size in Little Rock
The median household size in Little Rock is 2.79 persons per household, with single female/mother households (13 | 8.4%) accounting for the largest median household size of 4.62 persons per household. non-family households (59 | 38.3%) represent the smallest median household size with 1.27 persons per household.
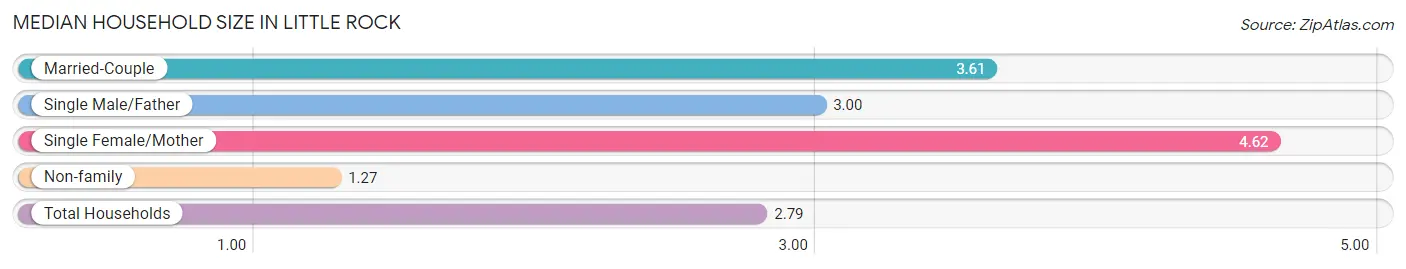
| Household Type | # Households | Household Size |
| Married-Couple | 80 (51.9%) | 3.61 |
| Single Male/Father | 2 (1.3%) | 3.00 |
| Single Female/Mother | 13 (8.4%) | 4.62 |
| Non-family | 59 (38.3%) | 1.27 |
| Total Households | 154 (100.0%) | 2.79 |
Household Size by Marriage Status in Little Rock
Out of a total of 154 households in Little Rock, 95 (61.7%) are family households, while 59 (38.3%) are nonfamily households. The most numerous type of family households are 2-person households, comprising 46, and the most common type of nonfamily households are 1-person households, comprising 48.
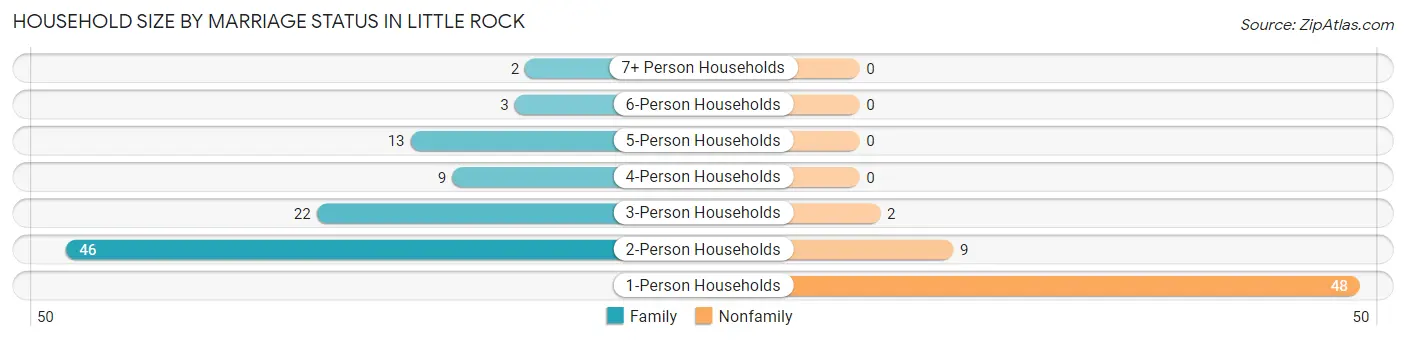
| Household Size | Family Households | Nonfamily Households |
| 1-Person Households | - | 48 (31.2%) |
| 2-Person Households | 46 (29.9%) | 9 (5.8%) |
| 3-Person Households | 22 (14.3%) | 2 (1.3%) |
| 4-Person Households | 9 (5.8%) | 0 (0.0%) |
| 5-Person Households | 13 (8.4%) | 0 (0.0%) |
| 6-Person Households | 3 (1.9%) | 0 (0.0%) |
| 7+ Person Households | 2 (1.3%) | 0 (0.0%) |
| Total | 95 (61.7%) | 59 (38.3%) |
Female Fertility in Little Rock
Fertility by Age in Little Rock
Average fertility rate in Little Rock is 45.0 births per 1,000 women. Women in the age bracket of 35 to 50 years have the highest fertility rate with 111.0 births per 1,000 women. Women in the age bracket of 35 to 50 years acount for 75.0% of all women with births.
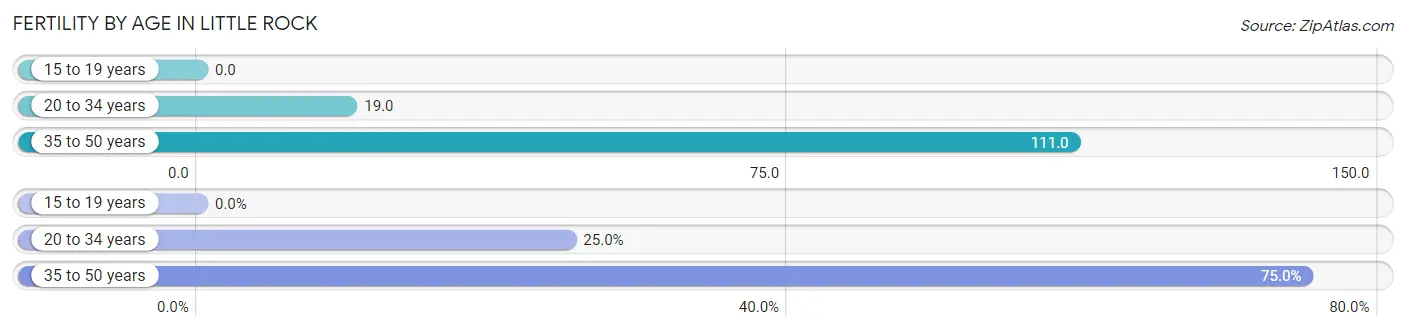
| Age Bracket | Women with Births | Births / 1,000 Women |
| 15 to 19 years | 0 (0.0%) | 0.0 |
| 20 to 34 years | 1 (25.0%) | 19.0 |
| 35 to 50 years | 3 (75.0%) | 111.0 |
| Total | 4 (100.0%) | 45.0 |
Fertility by Age by Marriage Status in Little Rock
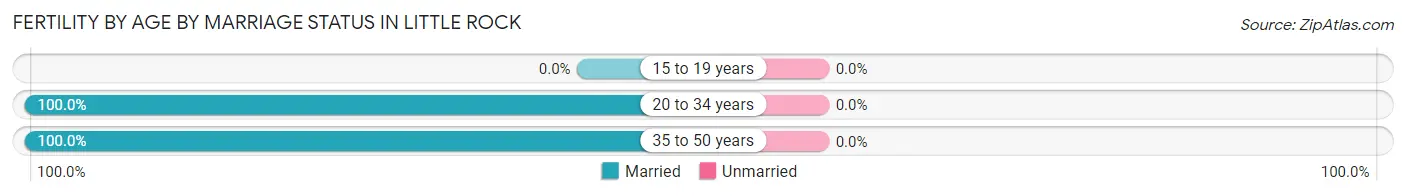
| Age Bracket | Married | Unmarried |
| 15 to 19 years | 0 (0.0%) | 0 (0.0%) |
| 20 to 34 years | 1 (100.0%) | 0 (0.0%) |
| 35 to 50 years | 3 (100.0%) | 0 (0.0%) |
| Total | 4 (100.0%) | 0 (0.0%) |
Fertility by Education in Little Rock
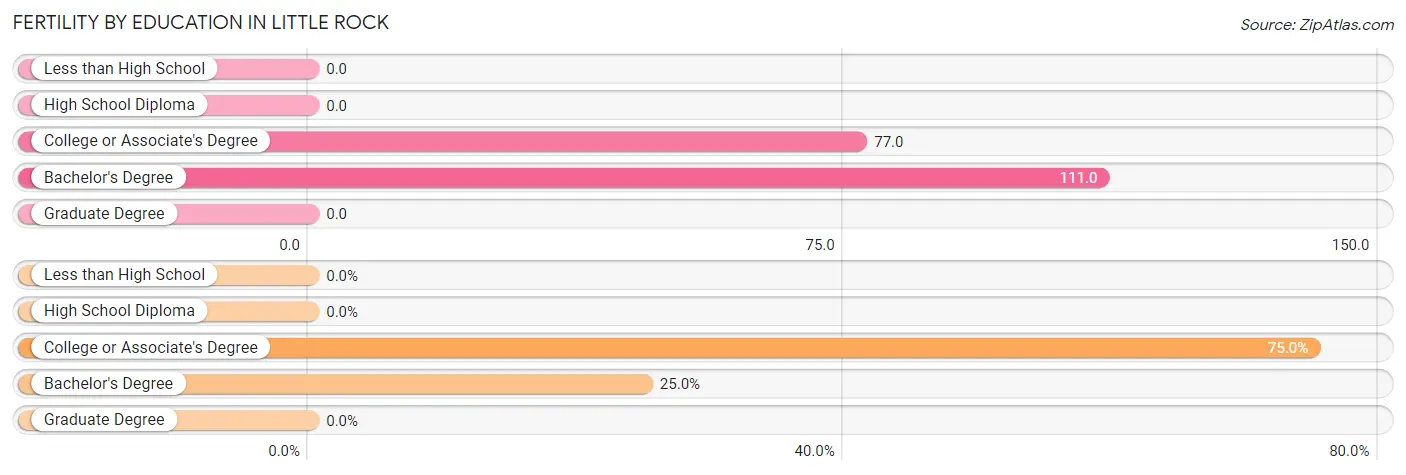
| Educational Attainment | Women with Births | Births / 1,000 Women |
| Less than High School | 0 (0.0%) | 0.0 |
| High School Diploma | 0 (0.0%) | 0.0 |
| College or Associate's Degree | 3 (75.0%) | 77.0 |
| Bachelor's Degree | 1 (25.0%) | 111.0 |
| Graduate Degree | 0 (0.0%) | 0.0 |
| Total | 4 (100.0%) | 45.0 |
Fertility by Education by Marriage Status in Little Rock
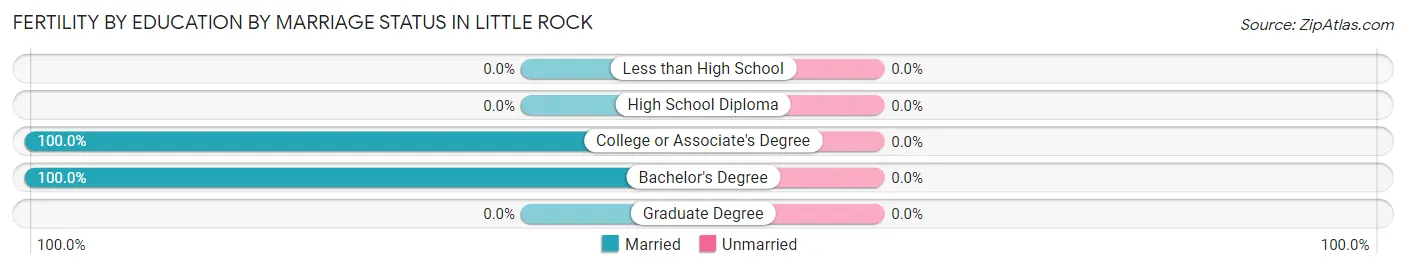
| Educational Attainment | Married | Unmarried |
| Less than High School | 0 (0.0%) | 0 (0.0%) |
| High School Diploma | 0 (0.0%) | 0 (0.0%) |
| College or Associate's Degree | 3 (100.0%) | 0 (0.0%) |
| Bachelor's Degree | 1 (100.0%) | 0 (0.0%) |
| Graduate Degree | 0 (0.0%) | 0 (0.0%) |
| Total | 4 (100.0%) | 0 (0.0%) |
Employment Characteristics in Little Rock
Employment by Class of Employer in Little Rock
Among the 225 employed individuals in Little Rock, private company employees (131 | 58.2%), not-for-profit organizations (33 | 14.7%), and local government employees (21 | 9.3%) make up the most common classes of employment.
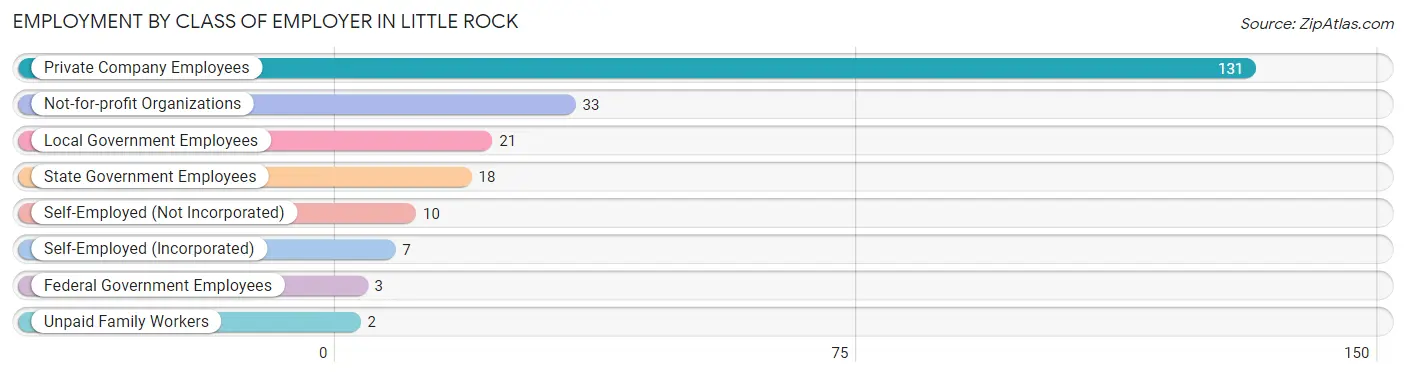
| Employer Class | # Employees | % Employees |
| Private Company Employees | 131 | 58.2% |
| Self-Employed (Incorporated) | 7 | 3.1% |
| Self-Employed (Not Incorporated) | 10 | 4.4% |
| Not-for-profit Organizations | 33 | 14.7% |
| Local Government Employees | 21 | 9.3% |
| State Government Employees | 18 | 8.0% |
| Federal Government Employees | 3 | 1.3% |
| Unpaid Family Workers | 2 | 0.9% |
| Total | 225 | 100.0% |
Employment Status by Age in Little Rock
According to the labor force statistics for Little Rock, out of the total population over 16 years of age (345), 68.4% or 236 individuals are in the labor force, with 0.9% or 2 of them unemployed. The age group with the highest labor force participation rate is 20 to 24 years, with 100.0% or 61 individuals in the labor force. Within the labor force, the 55 to 59 years age range has the highest percentage of unemployed individuals, with 20.0% or 1 of them being unemployed.
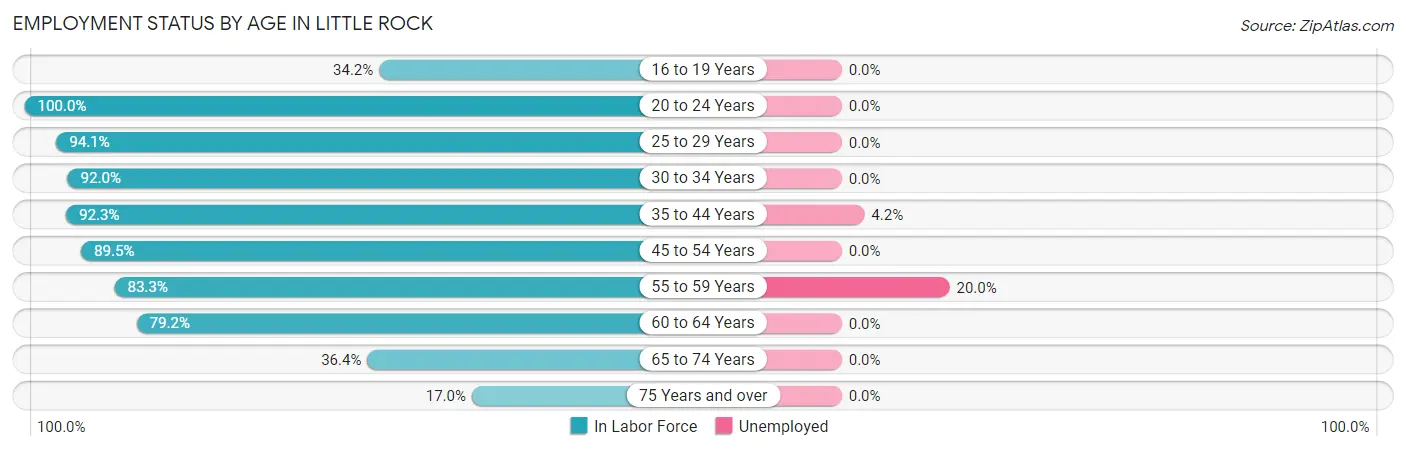
| Age Bracket | In Labor Force | Unemployed |
| 16 to 19 Years | 13 (34.2%) | 0 (0.0%) |
| 20 to 24 Years | 61 (100.0%) | 0 (0.0%) |
| 25 to 29 Years | 16 (94.1%) | 0 (0.0%) |
| 30 to 34 Years | 23 (92.0%) | 0 (0.0%) |
| 35 to 44 Years | 24 (92.3%) | 1 (4.2%) |
| 45 to 54 Years | 51 (89.5%) | 0 (0.0%) |
| 55 to 59 Years | 5 (83.3%) | 1 (20.0%) |
| 60 to 64 Years | 19 (79.2%) | 0 (0.0%) |
| 65 to 74 Years | 16 (36.4%) | 0 (0.0%) |
| 75 Years and over | 8 (17.0%) | 0 (0.0%) |
| Total | 236 (68.4%) | 2 (0.9%) |
Employment Status by Educational Attainment in Little Rock
According to labor force statistics for Little Rock, 89.0% of individuals (138) out of the total population between 25 and 64 years of age (155) are in the labor force, with 1.5% or 2 of them being unemployed. The group with the highest labor force participation rate are those with the educational attainment of less than high school, with 100.0% or 6 individuals in the labor force. Within the labor force, individuals with high school diploma education have the highest percentage of unemployment, with 4.2% or 2 of them being unemployed.
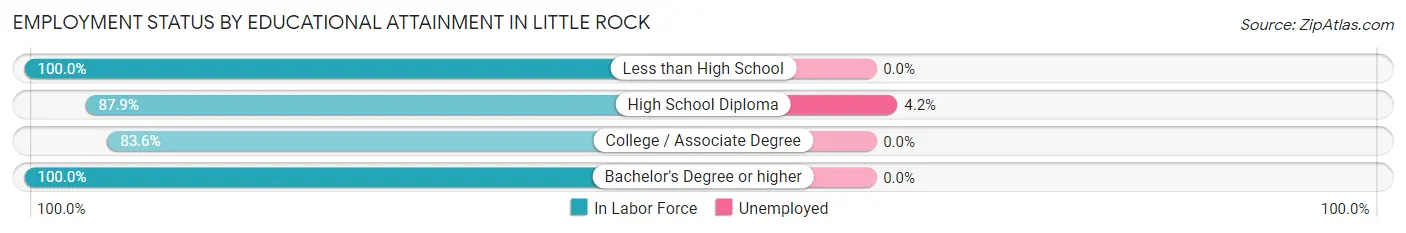
| Educational Attainment | In Labor Force | Unemployed |
| Less than High School | 6 (100.0%) | 0 (0.0%) |
| High School Diploma | 51 (87.9%) | 2 (4.2%) |
| College / Associate Degree | 51 (83.6%) | 0 (0.0%) |
| Bachelor's Degree or higher | 30 (100.0%) | 0 (0.0%) |
| Total | 138 (89.0%) | 2 (1.5%) |
Employment Occupations by Sex in Little Rock
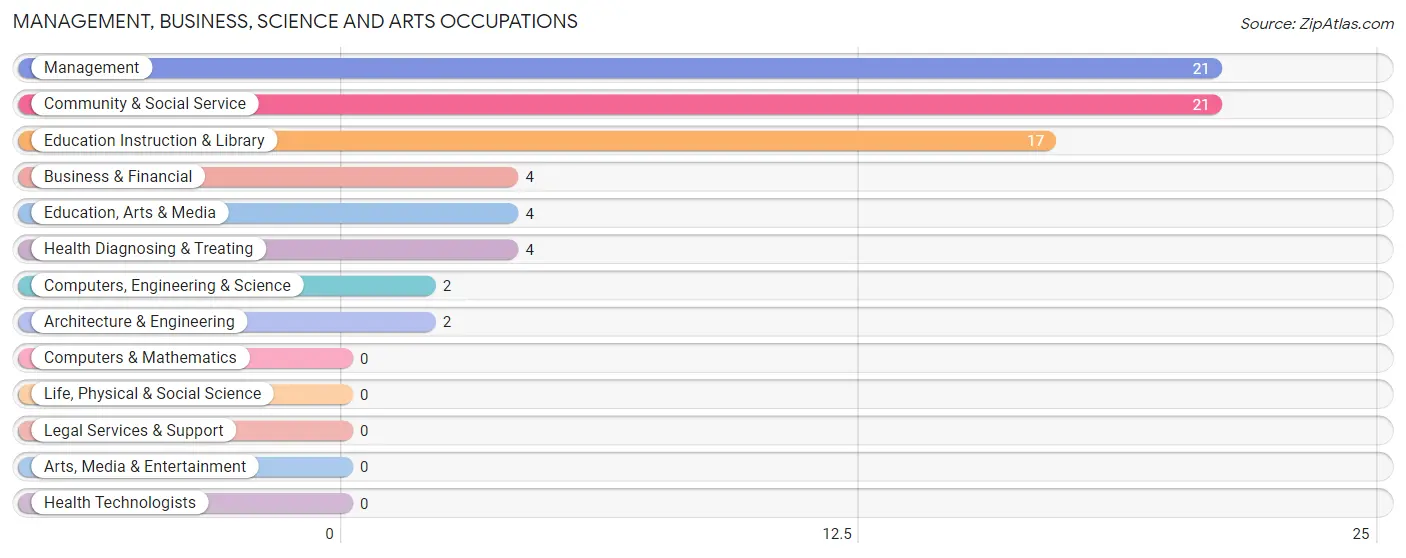
Management, Business, Science and Arts Occupations
The most common Management, Business, Science and Arts occupations in Little Rock are Management (21 | 9.1%), Community & Social Service (21 | 9.1%), Education Instruction & Library (17 | 7.4%), Business & Financial (4 | 1.7%), and Education, Arts & Media (4 | 1.7%).
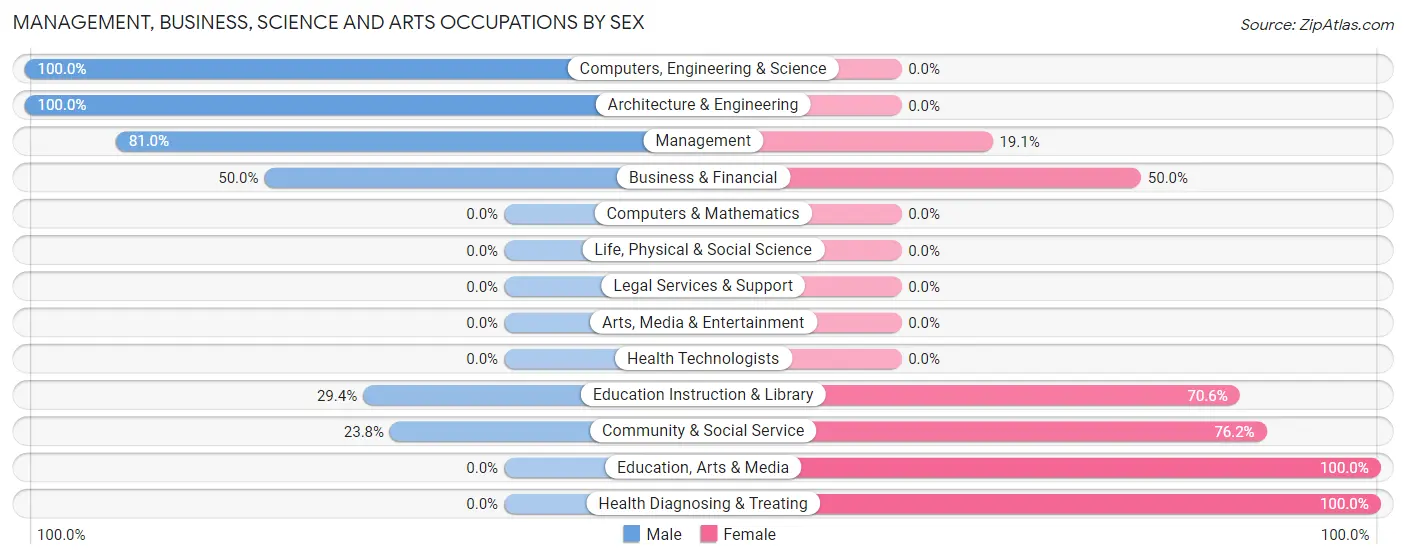
Management, Business, Science and Arts Occupations by Sex
Within the Management, Business, Science and Arts occupations in Little Rock, the most male-oriented occupations are Computers, Engineering & Science (100.0%), Architecture & Engineering (100.0%), and Management (80.9%), while the most female-oriented occupations are Education, Arts & Media (100.0%), Health Diagnosing & Treating (100.0%), and Community & Social Service (76.2%).
| Occupation | Male | Female |
| Management | 17 (80.9%) | 4 (19.1%) |
| Business & Financial | 2 (50.0%) | 2 (50.0%) |
| Computers, Engineering & Science | 2 (100.0%) | 0 (0.0%) |
| Computers & Mathematics | 0 (0.0%) | 0 (0.0%) |
| Architecture & Engineering | 2 (100.0%) | 0 (0.0%) |
| Life, Physical & Social Science | 0 (0.0%) | 0 (0.0%) |
| Community & Social Service | 5 (23.8%) | 16 (76.2%) |
| Education, Arts & Media | 0 (0.0%) | 4 (100.0%) |
| Legal Services & Support | 0 (0.0%) | 0 (0.0%) |
| Education Instruction & Library | 5 (29.4%) | 12 (70.6%) |
| Arts, Media & Entertainment | 0 (0.0%) | 0 (0.0%) |
| Health Diagnosing & Treating | 0 (0.0%) | 4 (100.0%) |
| Health Technologists | 0 (0.0%) | 0 (0.0%) |
| Total (Category) | 26 (50.0%) | 26 (50.0%) |
| Total (Overall) | 123 (53.2%) | 108 (46.8%) |
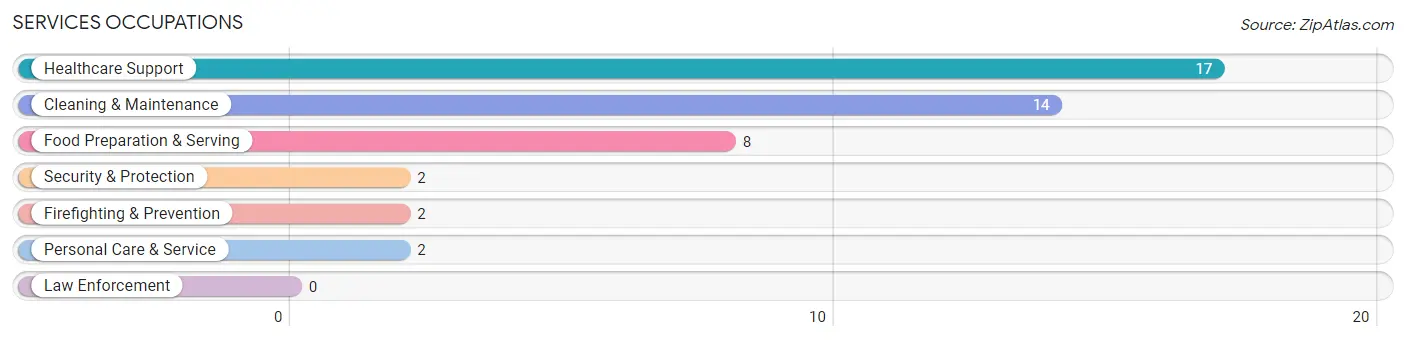
Services Occupations
The most common Services occupations in Little Rock are Healthcare Support (17 | 7.4%), Cleaning & Maintenance (14 | 6.1%), Food Preparation & Serving (8 | 3.5%), Security & Protection (2 | 0.9%), and Firefighting & Prevention (2 | 0.9%).
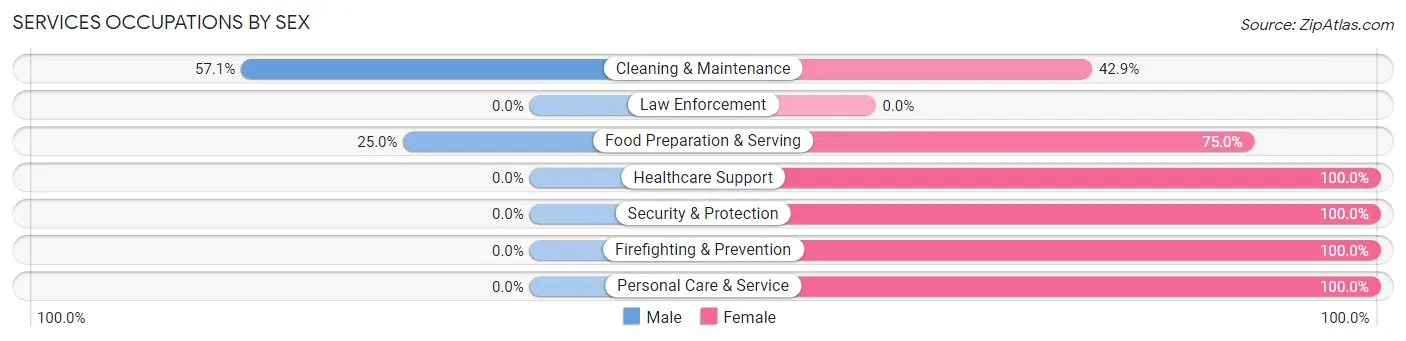
Services Occupations by Sex
Within the Services occupations in Little Rock, the most male-oriented occupations are Cleaning & Maintenance (57.1%), and Food Preparation & Serving (25.0%), while the most female-oriented occupations are Healthcare Support (100.0%), Security & Protection (100.0%), and Firefighting & Prevention (100.0%).
| Occupation | Male | Female |
| Healthcare Support | 0 (0.0%) | 17 (100.0%) |
| Security & Protection | 0 (0.0%) | 2 (100.0%) |
| Firefighting & Prevention | 0 (0.0%) | 2 (100.0%) |
| Law Enforcement | 0 (0.0%) | 0 (0.0%) |
| Food Preparation & Serving | 2 (25.0%) | 6 (75.0%) |
| Cleaning & Maintenance | 8 (57.1%) | 6 (42.9%) |
| Personal Care & Service | 0 (0.0%) | 2 (100.0%) |
| Total (Category) | 10 (23.3%) | 33 (76.7%) |
| Total (Overall) | 123 (53.2%) | 108 (46.8%) |
Sales and Office Occupations
The most common Sales and Office occupations in Little Rock are Office & Administration (20 | 8.7%), and Sales & Related (7 | 3.0%).

Sales and Office Occupations by Sex

| Occupation | Male | Female |
| Sales & Related | 6 (85.7%) | 1 (14.3%) |
| Office & Administration | 5 (25.0%) | 15 (75.0%) |
| Total (Category) | 11 (40.7%) | 16 (59.3%) |
| Total (Overall) | 123 (53.2%) | 108 (46.8%) |
Natural Resources, Construction and Maintenance Occupations
The most common Natural Resources, Construction and Maintenance occupations in Little Rock are Construction & Extraction (20 | 8.7%), Farming, Fishing & Forestry (8 | 3.5%), and Installation, Maintenance & Repair (4 | 1.7%).
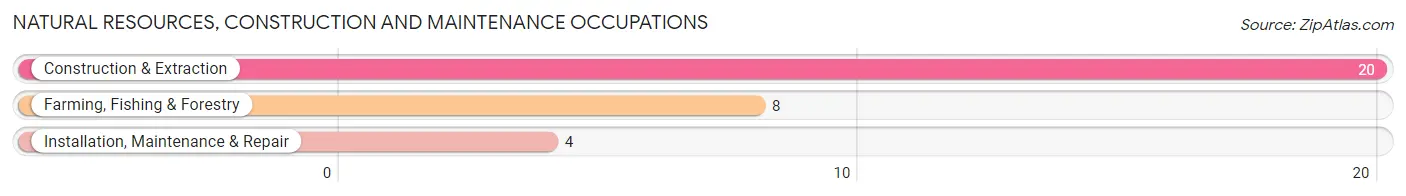
Natural Resources, Construction and Maintenance Occupations by Sex
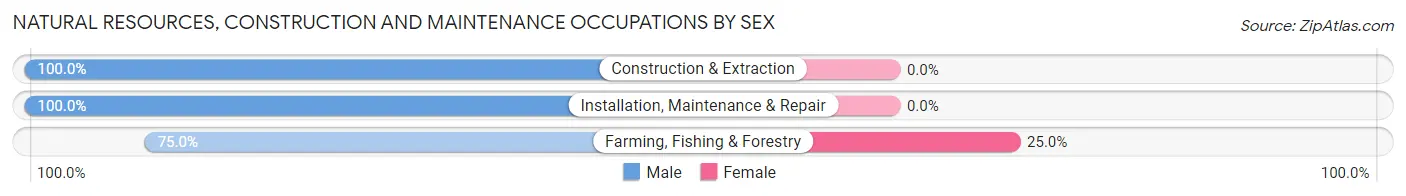
| Occupation | Male | Female |
| Farming, Fishing & Forestry | 6 (75.0%) | 2 (25.0%) |
| Construction & Extraction | 20 (100.0%) | 0 (0.0%) |
| Installation, Maintenance & Repair | 4 (100.0%) | 0 (0.0%) |
| Total (Category) | 30 (93.8%) | 2 (6.2%) |
| Total (Overall) | 123 (53.2%) | 108 (46.8%) |
Production, Transportation and Moving Occupations
The most common Production, Transportation and Moving occupations in Little Rock are Production (53 | 22.9%), Material Moving (16 | 6.9%), and Transportation (8 | 3.5%).
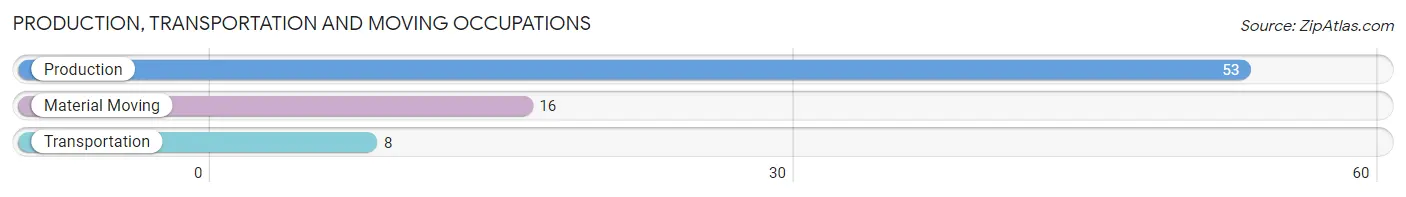
Production, Transportation and Moving Occupations by Sex
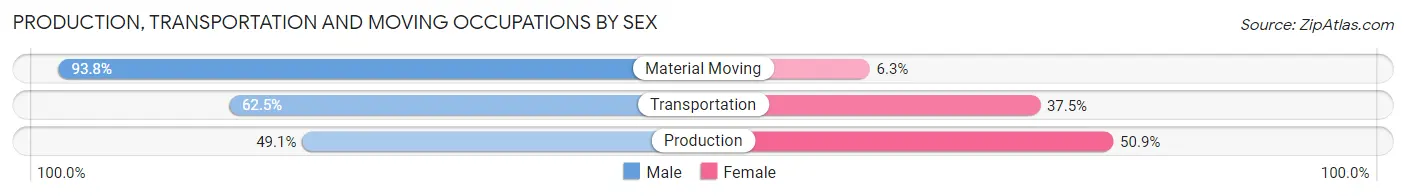
| Occupation | Male | Female |
| Production | 26 (49.1%) | 27 (50.9%) |
| Transportation | 5 (62.5%) | 3 (37.5%) |
| Material Moving | 15 (93.8%) | 1 (6.2%) |
| Total (Category) | 46 (59.7%) | 31 (40.3%) |
| Total (Overall) | 123 (53.2%) | 108 (46.8%) |
Employment Industries by Sex in Little Rock
Employment Industries in Little Rock
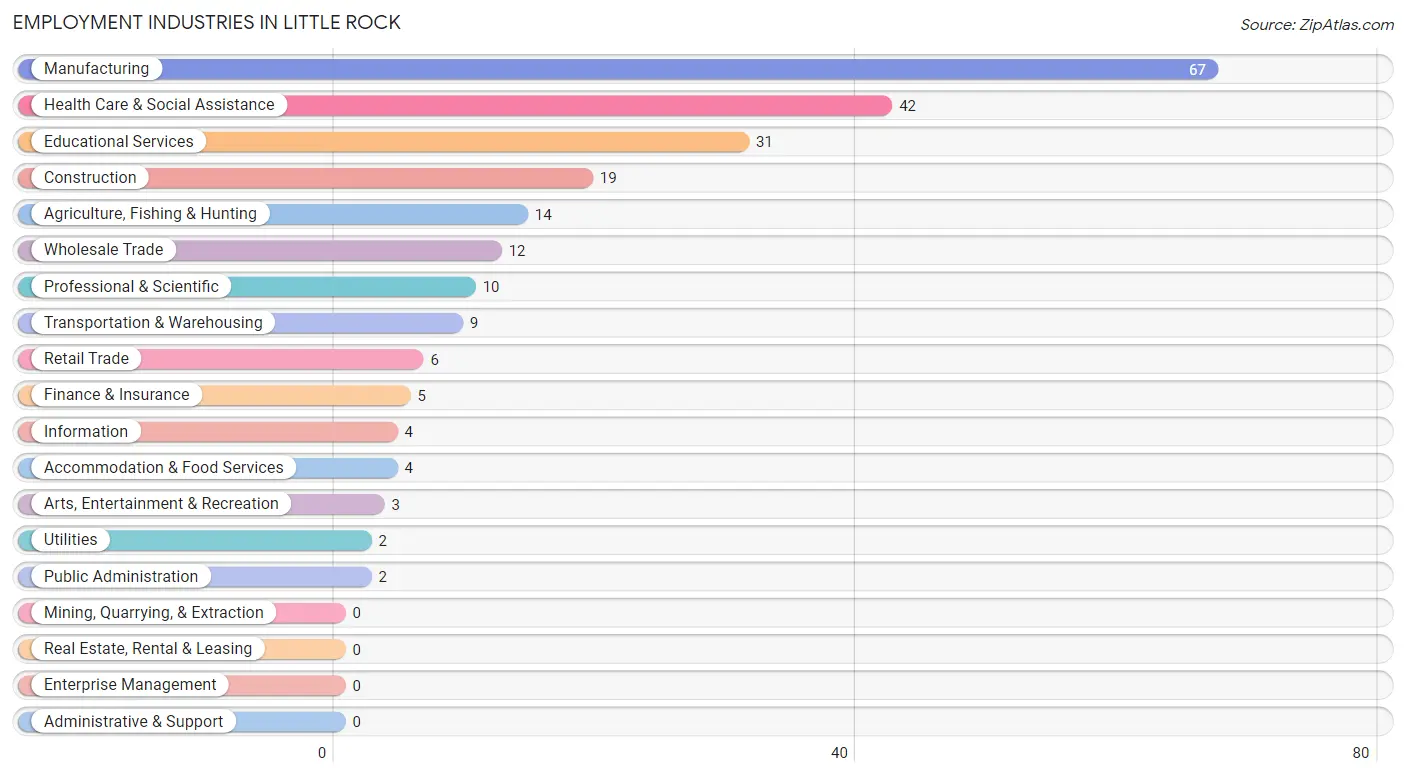
The major employment industries in Little Rock include Manufacturing (67 | 29.0%), Health Care & Social Assistance (42 | 18.2%), Educational Services (31 | 13.4%), Construction (19 | 8.2%), and Agriculture, Fishing & Hunting (14 | 6.1%).
Employment Industries by Sex in Little Rock
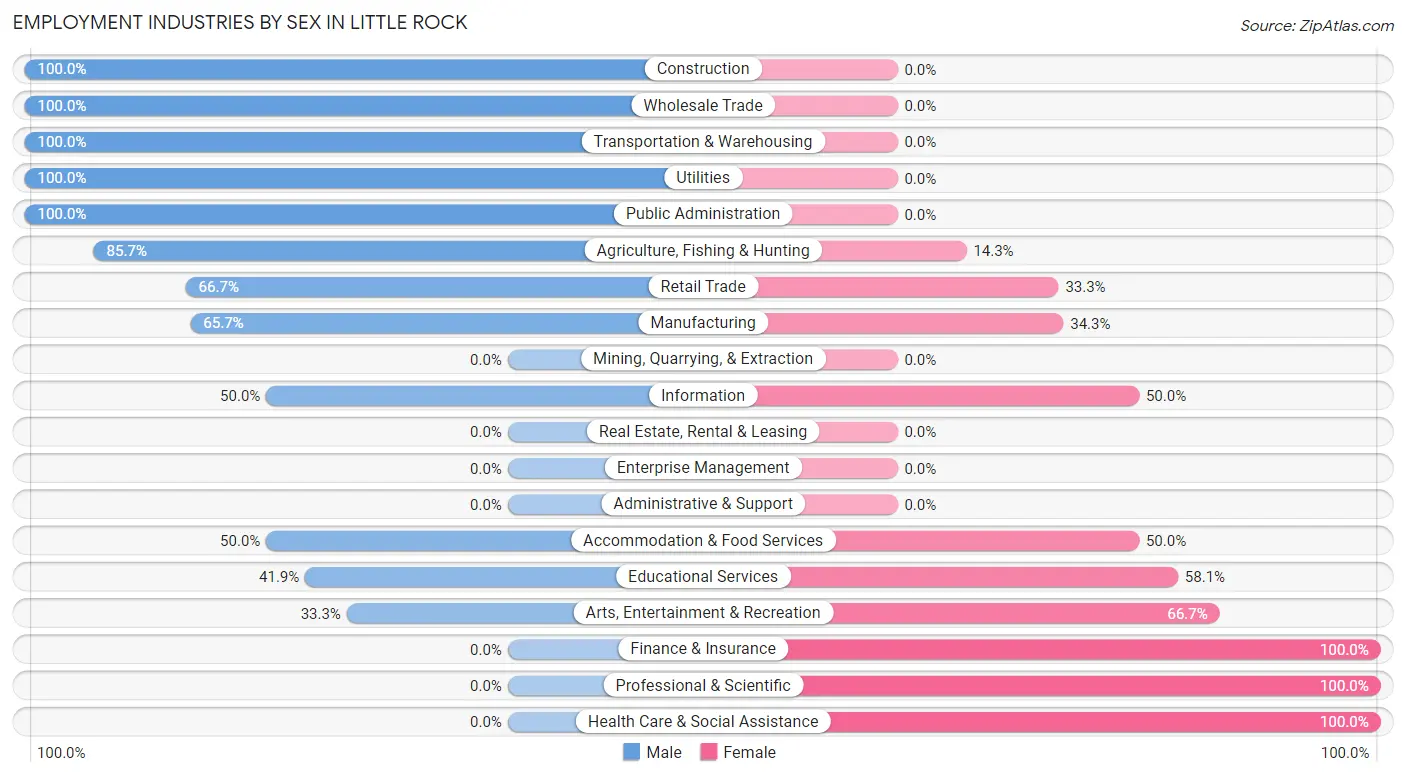
The Little Rock industries that see more men than women are Construction (100.0%), Wholesale Trade (100.0%), and Transportation & Warehousing (100.0%), whereas the industries that tend to have a higher number of women are Finance & Insurance (100.0%), Professional & Scientific (100.0%), and Health Care & Social Assistance (100.0%).
| Industry | Male | Female |
| Agriculture, Fishing & Hunting | 12 (85.7%) | 2 (14.3%) |
| Mining, Quarrying, & Extraction | 0 (0.0%) | 0 (0.0%) |
| Construction | 19 (100.0%) | 0 (0.0%) |
| Manufacturing | 44 (65.7%) | 23 (34.3%) |
| Wholesale Trade | 12 (100.0%) | 0 (0.0%) |
| Retail Trade | 4 (66.7%) | 2 (33.3%) |
| Transportation & Warehousing | 9 (100.0%) | 0 (0.0%) |
| Utilities | 2 (100.0%) | 0 (0.0%) |
| Information | 2 (50.0%) | 2 (50.0%) |
| Finance & Insurance | 0 (0.0%) | 5 (100.0%) |
| Real Estate, Rental & Leasing | 0 (0.0%) | 0 (0.0%) |
| Professional & Scientific | 0 (0.0%) | 10 (100.0%) |
| Enterprise Management | 0 (0.0%) | 0 (0.0%) |
| Administrative & Support | 0 (0.0%) | 0 (0.0%) |
| Educational Services | 13 (41.9%) | 18 (58.1%) |
| Health Care & Social Assistance | 0 (0.0%) | 42 (100.0%) |
| Arts, Entertainment & Recreation | 1 (33.3%) | 2 (66.7%) |
| Accommodation & Food Services | 2 (50.0%) | 2 (50.0%) |
| Public Administration | 2 (100.0%) | 0 (0.0%) |
| Total | 123 (53.2%) | 108 (46.8%) |
Education in Little Rock
School Enrollment in Little Rock
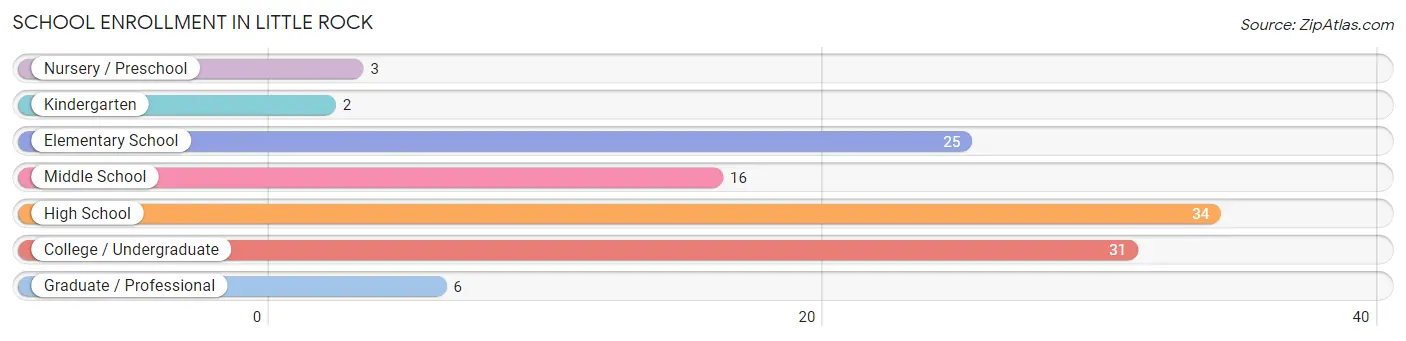
The most common levels of schooling among the 117 students in Little Rock are high school (34 | 29.1%), college / undergraduate (31 | 26.5%), and elementary school (25 | 21.4%).
| School Level | # Students | % Students |
| Nursery / Preschool | 3 | 2.6% |
| Kindergarten | 2 | 1.7% |
| Elementary School | 25 | 21.4% |
| Middle School | 16 | 13.7% |
| High School | 34 | 29.1% |
| College / Undergraduate | 31 | 26.5% |
| Graduate / Professional | 6 | 5.1% |
| Total | 117 | 100.0% |
School Enrollment by Age by Funding Source in Little Rock
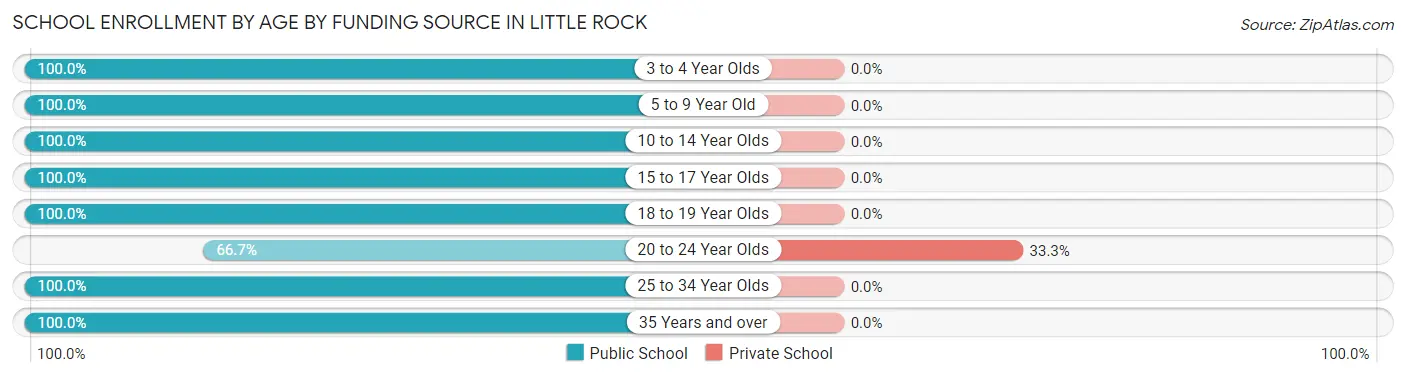
Out of a total of 117 students who are enrolled in schools in Little Rock, 5 (4.3%) attend a private institution, while the remaining 112 (95.7%) are enrolled in public schools. The age group of 20 to 24 year olds has the highest likelihood of being enrolled in private schools, with 5 (33.3% in the age bracket) enrolled. Conversely, the age group of 3 to 4 year olds has the lowest likelihood of being enrolled in a private school, with 2 (100.0% in the age bracket) attending a public institution.
| Age Bracket | Public School | Private School |
| 3 to 4 Year Olds | 2 (100.0%) | 0 (0.0%) |
| 5 to 9 Year Old | 26 (100.0%) | 0 (0.0%) |
| 10 to 14 Year Olds | 25 (100.0%) | 0 (0.0%) |
| 15 to 17 Year Olds | 23 (100.0%) | 0 (0.0%) |
| 18 to 19 Year Olds | 10 (100.0%) | 0 (0.0%) |
| 20 to 24 Year Olds | 10 (66.7%) | 5 (33.3%) |
| 25 to 34 Year Olds | 10 (100.0%) | 0 (0.0%) |
| 35 Years and over | 6 (100.0%) | 0 (0.0%) |
| Total | 112 (95.7%) | 5 (4.3%) |
Educational Attainment by Field of Study in Little Rock
Psychology (10 | 27.0%), engineering (10 | 27.0%), business (10 | 27.0%), education (3 | 8.1%), and bio, nature & agricultural (2 | 5.4%) are the most common fields of study among 37 individuals in Little Rock who have obtained a bachelor's degree or higher.
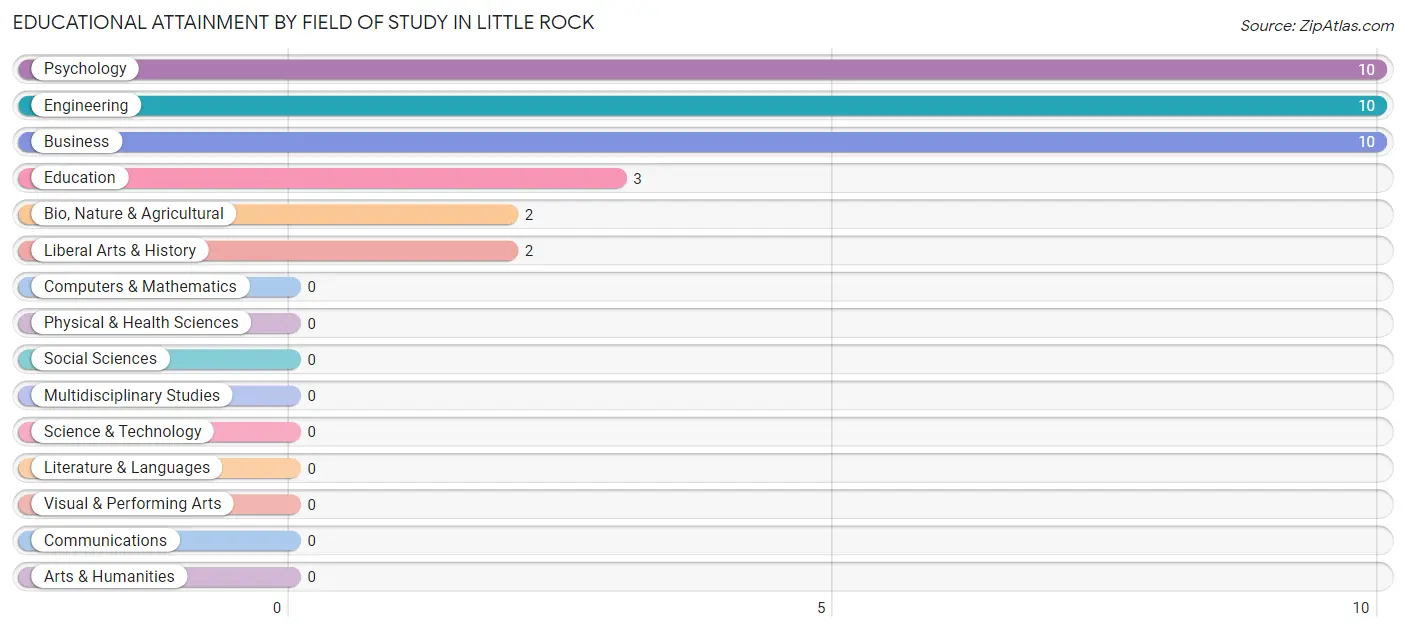
| Field of Study | # Graduates | % Graduates |
| Computers & Mathematics | 0 | 0.0% |
| Bio, Nature & Agricultural | 2 | 5.4% |
| Physical & Health Sciences | 0 | 0.0% |
| Psychology | 10 | 27.0% |
| Social Sciences | 0 | 0.0% |
| Engineering | 10 | 27.0% |
| Multidisciplinary Studies | 0 | 0.0% |
| Science & Technology | 0 | 0.0% |
| Business | 10 | 27.0% |
| Education | 3 | 8.1% |
| Literature & Languages | 0 | 0.0% |
| Liberal Arts & History | 2 | 5.4% |
| Visual & Performing Arts | 0 | 0.0% |
| Communications | 0 | 0.0% |
| Arts & Humanities | 0 | 0.0% |
| Total | 37 | 100.0% |
Transportation & Commute in Little Rock
Vehicle Availability by Sex in Little Rock
The most prevalent vehicle ownership categories in Little Rock are males with 2 vehicles (50, accounting for 40.6%) and females with 2 vehicles (23, making up 49.0%).
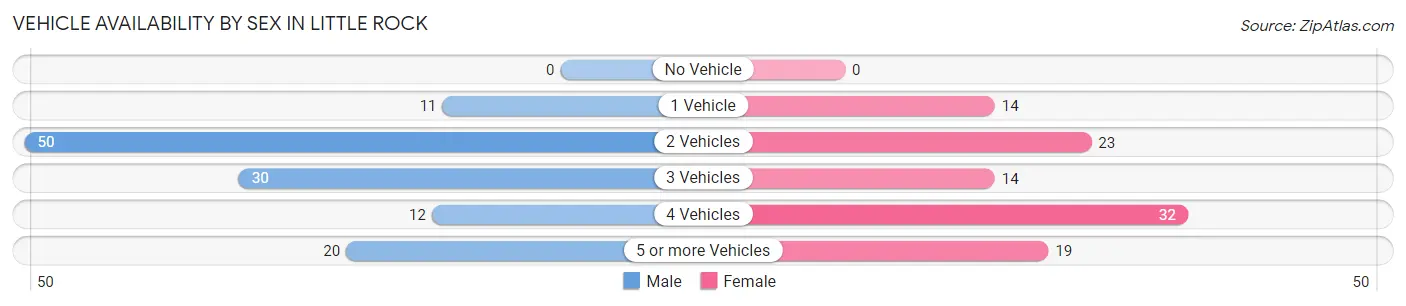
| Vehicles Available | Male | Female |
| No Vehicle | 0 (0.0%) | 0 (0.0%) |
| 1 Vehicle | 11 (8.9%) | 14 (13.7%) |
| 2 Vehicles | 50 (40.6%) | 23 (22.6%) |
| 3 Vehicles | 30 (24.4%) | 14 (13.7%) |
| 4 Vehicles | 12 (9.8%) | 32 (31.4%) |
| 5 or more Vehicles | 20 (16.3%) | 19 (18.6%) |
| Total | 123 (100.0%) | 102 (100.0%) |
Commute Time in Little Rock
The most frequently occuring commute durations in Little Rock are 15 to 19 minutes (43 commuters, 19.7%), 20 to 24 minutes (38 commuters, 17.4%), and 45 to 59 minutes (25 commuters, 11.5%).
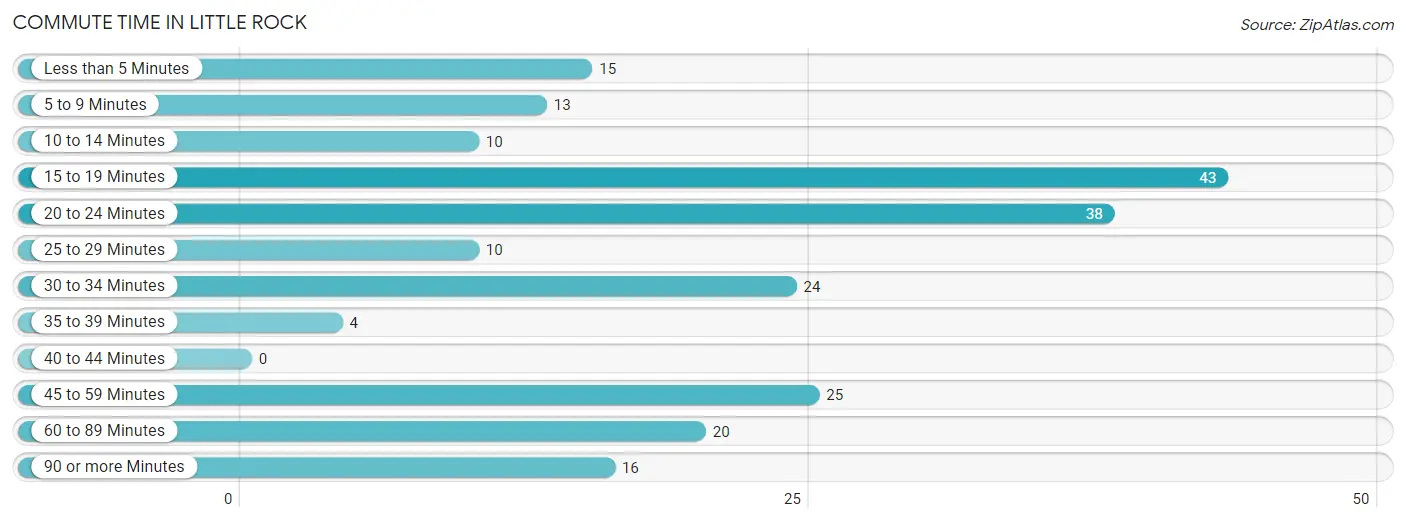
| Commute Time | # Commuters | % Commuters |
| Less than 5 Minutes | 15 | 6.9% |
| 5 to 9 Minutes | 13 | 6.0% |
| 10 to 14 Minutes | 10 | 4.6% |
| 15 to 19 Minutes | 43 | 19.7% |
| 20 to 24 Minutes | 38 | 17.4% |
| 25 to 29 Minutes | 10 | 4.6% |
| 30 to 34 Minutes | 24 | 11.0% |
| 35 to 39 Minutes | 4 | 1.8% |
| 40 to 44 Minutes | 0 | 0.0% |
| 45 to 59 Minutes | 25 | 11.5% |
| 60 to 89 Minutes | 20 | 9.2% |
| 90 or more Minutes | 16 | 7.3% |
Commute Time by Sex in Little Rock
The most common commute times in Little Rock are 15 to 19 minutes (24 commuters, 20.3%) for males and 20 to 24 minutes (20 commuters, 20.0%) for females.
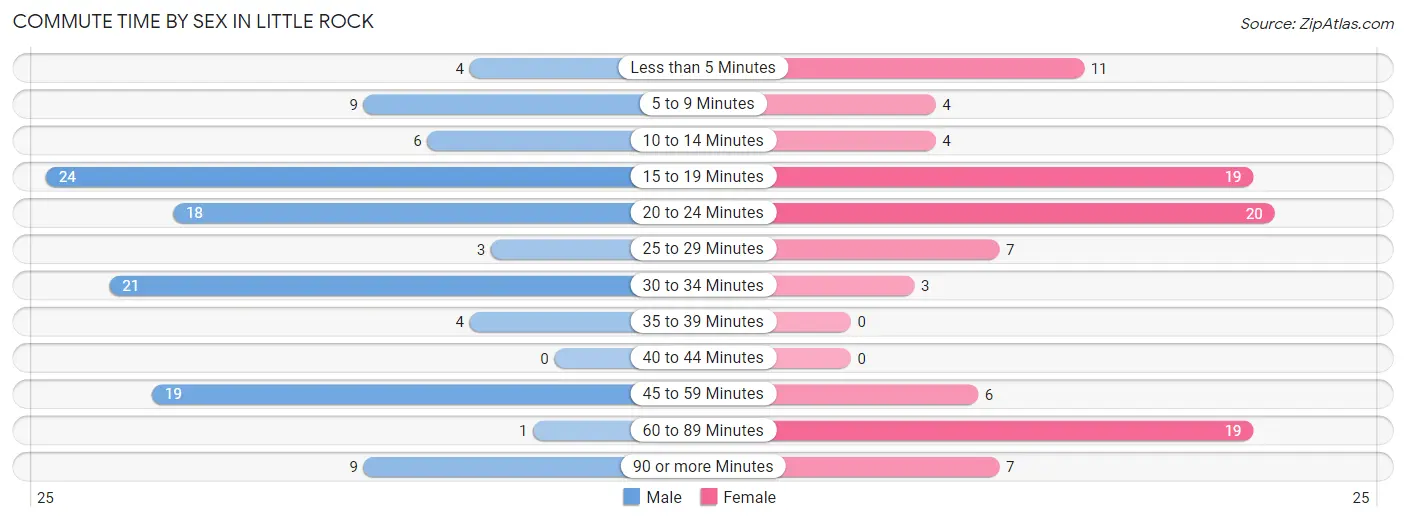
| Commute Time | Male | Female |
| Less than 5 Minutes | 4 (3.4%) | 11 (11.0%) |
| 5 to 9 Minutes | 9 (7.6%) | 4 (4.0%) |
| 10 to 14 Minutes | 6 (5.1%) | 4 (4.0%) |
| 15 to 19 Minutes | 24 (20.3%) | 19 (19.0%) |
| 20 to 24 Minutes | 18 (15.2%) | 20 (20.0%) |
| 25 to 29 Minutes | 3 (2.5%) | 7 (7.0%) |
| 30 to 34 Minutes | 21 (17.8%) | 3 (3.0%) |
| 35 to 39 Minutes | 4 (3.4%) | 0 (0.0%) |
| 40 to 44 Minutes | 0 (0.0%) | 0 (0.0%) |
| 45 to 59 Minutes | 19 (16.1%) | 6 (6.0%) |
| 60 to 89 Minutes | 1 (0.9%) | 19 (19.0%) |
| 90 or more Minutes | 9 (7.6%) | 7 (7.0%) |
Time of Departure to Work by Sex in Little Rock
The most frequent times of departure to work in Little Rock are 6:30 AM to 6:59 AM (24, 20.3%) for males and 12:00 PM to 3:59 PM (29, 29.0%) for females.
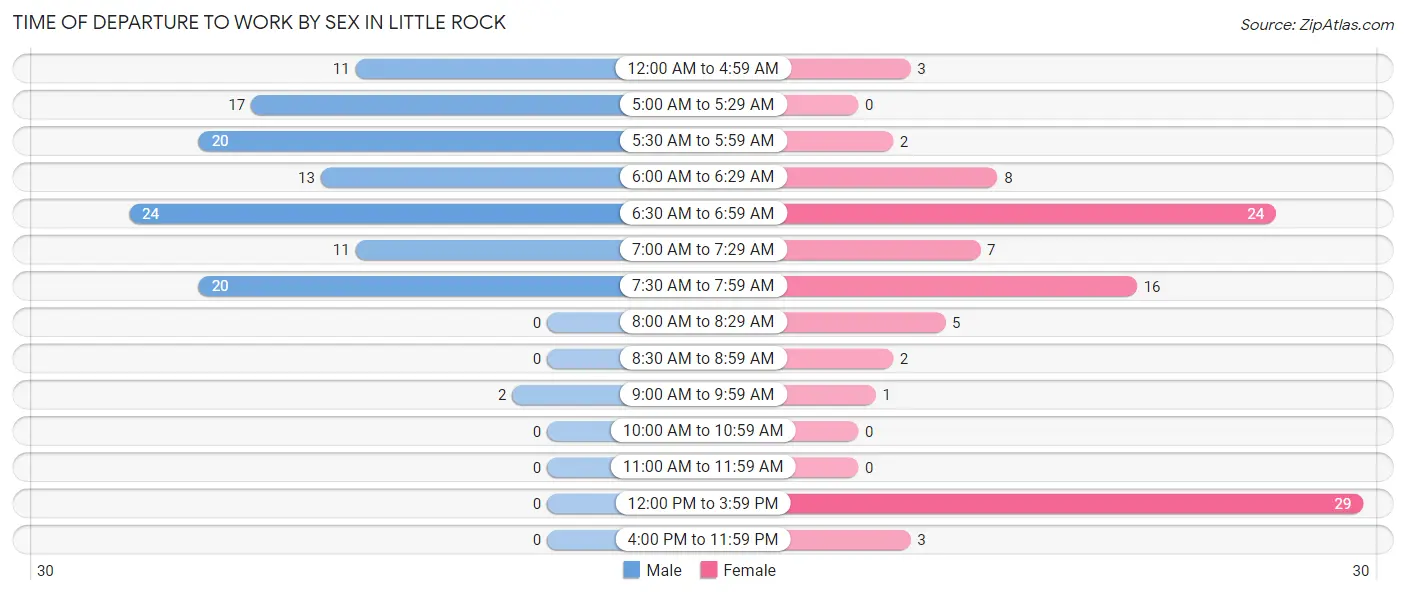
| Time of Departure | Male | Female |
| 12:00 AM to 4:59 AM | 11 (9.3%) | 3 (3.0%) |
| 5:00 AM to 5:29 AM | 17 (14.4%) | 0 (0.0%) |
| 5:30 AM to 5:59 AM | 20 (17.0%) | 2 (2.0%) |
| 6:00 AM to 6:29 AM | 13 (11.0%) | 8 (8.0%) |
| 6:30 AM to 6:59 AM | 24 (20.3%) | 24 (24.0%) |
| 7:00 AM to 7:29 AM | 11 (9.3%) | 7 (7.0%) |
| 7:30 AM to 7:59 AM | 20 (17.0%) | 16 (16.0%) |
| 8:00 AM to 8:29 AM | 0 (0.0%) | 5 (5.0%) |
| 8:30 AM to 8:59 AM | 0 (0.0%) | 2 (2.0%) |
| 9:00 AM to 9:59 AM | 2 (1.7%) | 1 (1.0%) |
| 10:00 AM to 10:59 AM | 0 (0.0%) | 0 (0.0%) |
| 11:00 AM to 11:59 AM | 0 (0.0%) | 0 (0.0%) |
| 12:00 PM to 3:59 PM | 0 (0.0%) | 29 (29.0%) |
| 4:00 PM to 11:59 PM | 0 (0.0%) | 3 (3.0%) |
| Total | 118 (100.0%) | 100 (100.0%) |
Housing Occupancy in Little Rock
Occupancy by Ownership in Little Rock
Of the total 154 dwellings in Little Rock, owner-occupied units account for 135 (87.7%), while renter-occupied units make up 19 (12.3%).
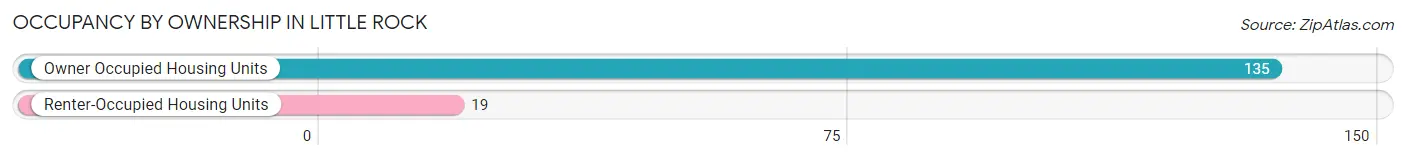
| Occupancy | # Housing Units | % Housing Units |
| Owner Occupied Housing Units | 135 | 87.7% |
| Renter-Occupied Housing Units | 19 | 12.3% |
| Total Occupied Housing Units | 154 | 100.0% |
Occupancy by Household Size in Little Rock
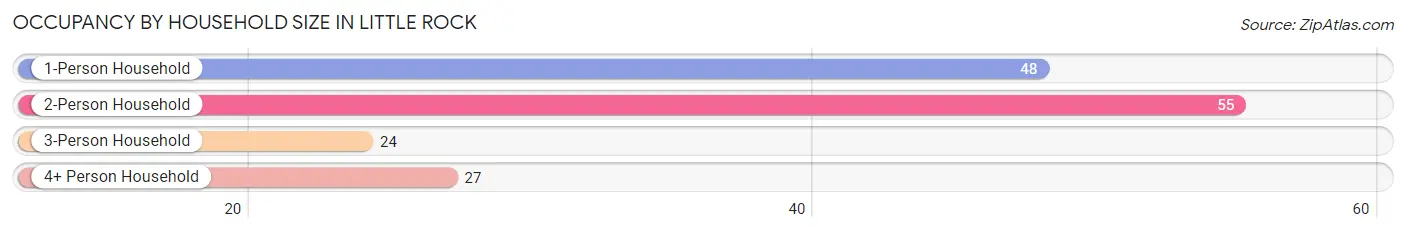
| Household Size | # Housing Units | % Housing Units |
| 1-Person Household | 48 | 31.2% |
| 2-Person Household | 55 | 35.7% |
| 3-Person Household | 24 | 15.6% |
| 4+ Person Household | 27 | 17.5% |
| Total Housing Units | 154 | 100.0% |
Occupancy by Ownership by Household Size in Little Rock
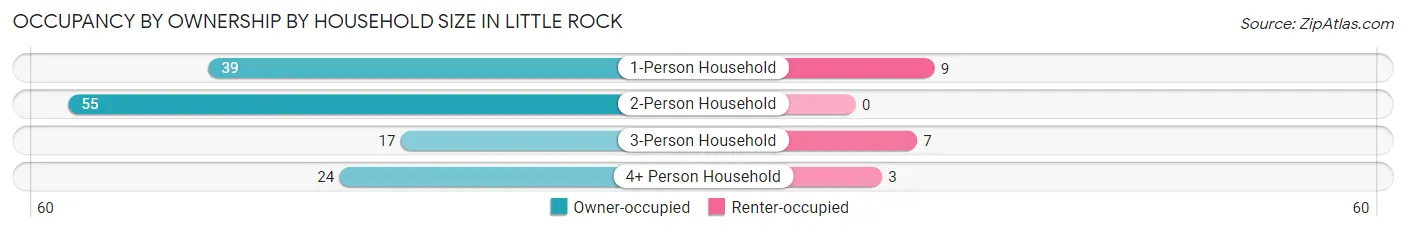
| Household Size | Owner-occupied | Renter-occupied |
| 1-Person Household | 39 (81.2%) | 9 (18.8%) |
| 2-Person Household | 55 (100.0%) | 0 (0.0%) |
| 3-Person Household | 17 (70.8%) | 7 (29.2%) |
| 4+ Person Household | 24 (88.9%) | 3 (11.1%) |
| Total Housing Units | 135 (87.7%) | 19 (12.3%) |
Occupancy by Educational Attainment in Little Rock
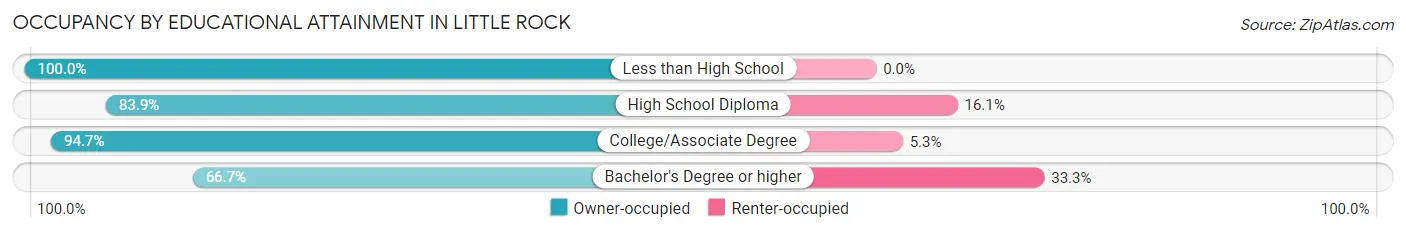
| Household Size | Owner-occupied | Renter-occupied |
| Less than High School | 17 (100.0%) | 0 (0.0%) |
| High School Diploma | 52 (83.9%) | 10 (16.1%) |
| College/Associate Degree | 54 (94.7%) | 3 (5.3%) |
| Bachelor's Degree or higher | 12 (66.7%) | 6 (33.3%) |
Occupancy by Age of Householder in Little Rock
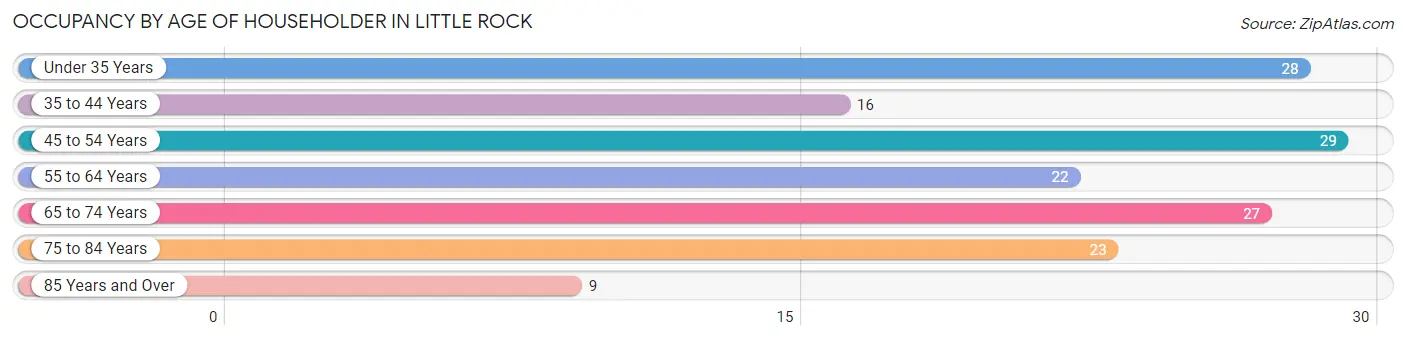
| Age Bracket | # Households | % Households |
| Under 35 Years | 28 | 18.2% |
| 35 to 44 Years | 16 | 10.4% |
| 45 to 54 Years | 29 | 18.8% |
| 55 to 64 Years | 22 | 14.3% |
| 65 to 74 Years | 27 | 17.5% |
| 75 to 84 Years | 23 | 14.9% |
| 85 Years and Over | 9 | 5.8% |
| Total | 154 | 100.0% |
Housing Finances in Little Rock
Median Income by Occupancy in Little Rock
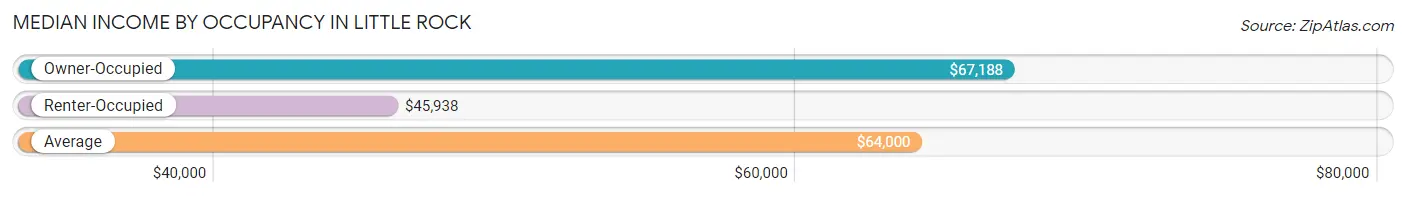
| Occupancy Type | # Households | Median Income |
| Owner-Occupied | 135 (87.7%) | $67,188 |
| Renter-Occupied | 19 (12.3%) | $45,938 |
| Average | 154 (100.0%) | $64,000 |
Occupancy by Householder Income Bracket in Little Rock
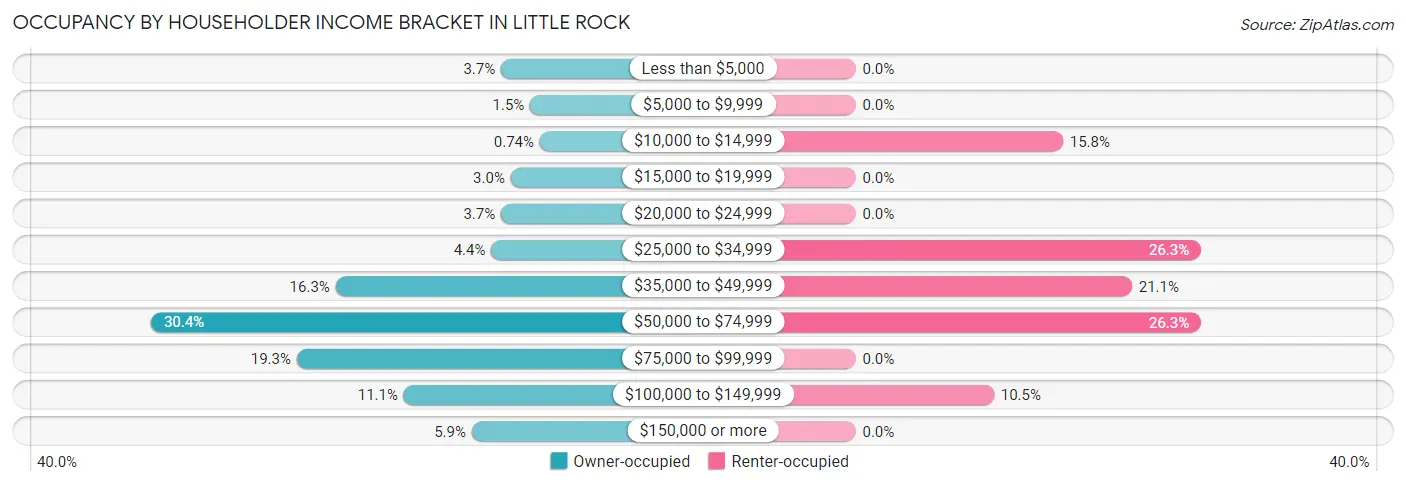
| Income Bracket | Owner-occupied | Renter-occupied |
| Less than $5,000 | 5 (3.7%) | 0 (0.0%) |
| $5,000 to $9,999 | 2 (1.5%) | 0 (0.0%) |
| $10,000 to $14,999 | 1 (0.7%) | 3 (15.8%) |
| $15,000 to $19,999 | 4 (3.0%) | 0 (0.0%) |
| $20,000 to $24,999 | 5 (3.7%) | 0 (0.0%) |
| $25,000 to $34,999 | 6 (4.4%) | 5 (26.3%) |
| $35,000 to $49,999 | 22 (16.3%) | 4 (21.0%) |
| $50,000 to $74,999 | 41 (30.4%) | 5 (26.3%) |
| $75,000 to $99,999 | 26 (19.3%) | 0 (0.0%) |
| $100,000 to $149,999 | 15 (11.1%) | 2 (10.5%) |
| $150,000 or more | 8 (5.9%) | 0 (0.0%) |
| Total | 135 (100.0%) | 19 (100.0%) |
Monthly Housing Cost Tiers in Little Rock
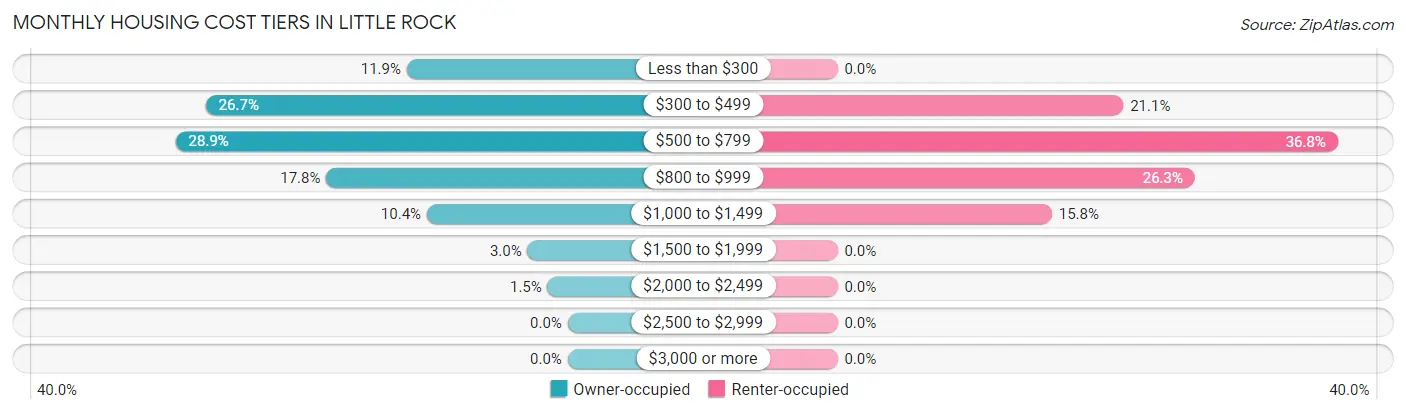
| Monthly Cost | Owner-occupied | Renter-occupied |
| Less than $300 | 16 (11.8%) | 0 (0.0%) |
| $300 to $499 | 36 (26.7%) | 4 (21.0%) |
| $500 to $799 | 39 (28.9%) | 7 (36.8%) |
| $800 to $999 | 24 (17.8%) | 5 (26.3%) |
| $1,000 to $1,499 | 14 (10.4%) | 3 (15.8%) |
| $1,500 to $1,999 | 4 (3.0%) | 0 (0.0%) |
| $2,000 to $2,499 | 2 (1.5%) | 0 (0.0%) |
| $2,500 to $2,999 | 0 (0.0%) | 0 (0.0%) |
| $3,000 or more | 0 (0.0%) | 0 (0.0%) |
| Total | 135 (100.0%) | 19 (100.0%) |
Physical Housing Characteristics in Little Rock
Housing Structures in Little Rock
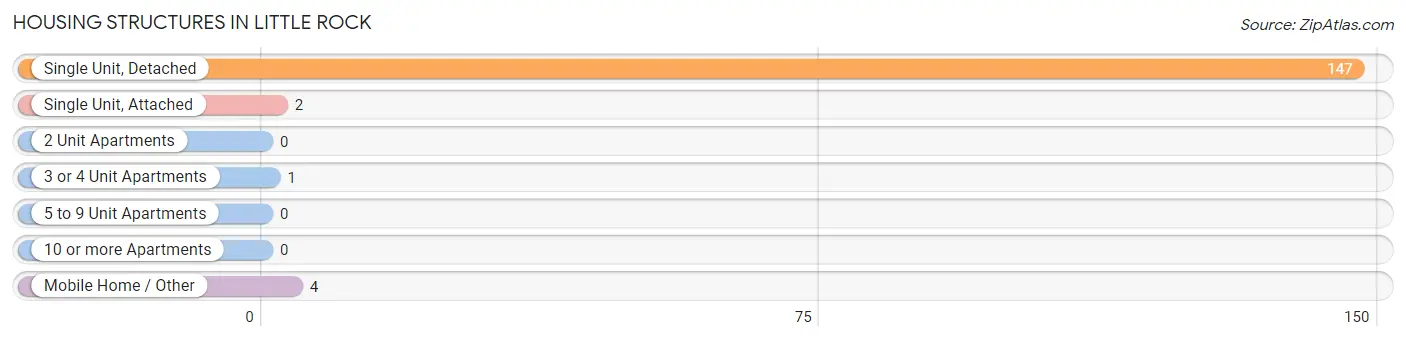
| Structure Type | # Housing Units | % Housing Units |
| Single Unit, Detached | 147 | 95.5% |
| Single Unit, Attached | 2 | 1.3% |
| 2 Unit Apartments | 0 | 0.0% |
| 3 or 4 Unit Apartments | 1 | 0.6% |
| 5 to 9 Unit Apartments | 0 | 0.0% |
| 10 or more Apartments | 0 | 0.0% |
| Mobile Home / Other | 4 | 2.6% |
| Total | 154 | 100.0% |
Housing Structures by Occupancy in Little Rock
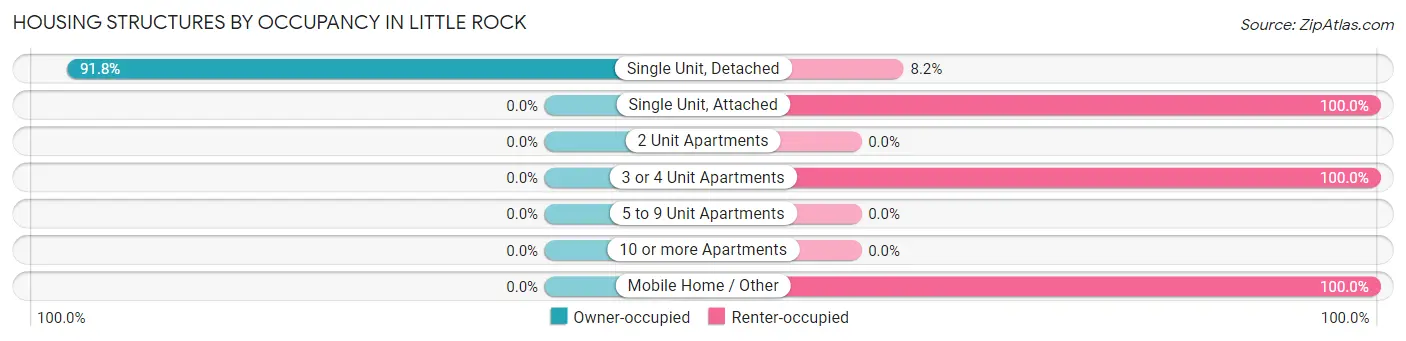
| Structure Type | Owner-occupied | Renter-occupied |
| Single Unit, Detached | 135 (91.8%) | 12 (8.2%) |
| Single Unit, Attached | 0 (0.0%) | 2 (100.0%) |
| 2 Unit Apartments | 0 (0.0%) | 0 (0.0%) |
| 3 or 4 Unit Apartments | 0 (0.0%) | 1 (100.0%) |
| 5 to 9 Unit Apartments | 0 (0.0%) | 0 (0.0%) |
| 10 or more Apartments | 0 (0.0%) | 0 (0.0%) |
| Mobile Home / Other | 0 (0.0%) | 4 (100.0%) |
| Total | 135 (87.7%) | 19 (12.3%) |
Housing Structures by Number of Rooms in Little Rock
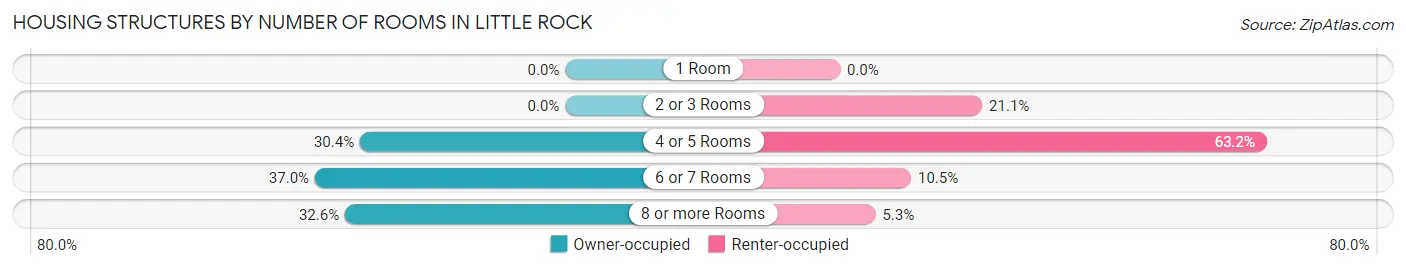
| Number of Rooms | Owner-occupied | Renter-occupied |
| 1 Room | 0 (0.0%) | 0 (0.0%) |
| 2 or 3 Rooms | 0 (0.0%) | 4 (21.0%) |
| 4 or 5 Rooms | 41 (30.4%) | 12 (63.2%) |
| 6 or 7 Rooms | 50 (37.0%) | 2 (10.5%) |
| 8 or more Rooms | 44 (32.6%) | 1 (5.3%) |
| Total | 135 (100.0%) | 19 (100.0%) |
Housing Structure by Heating Type in Little Rock
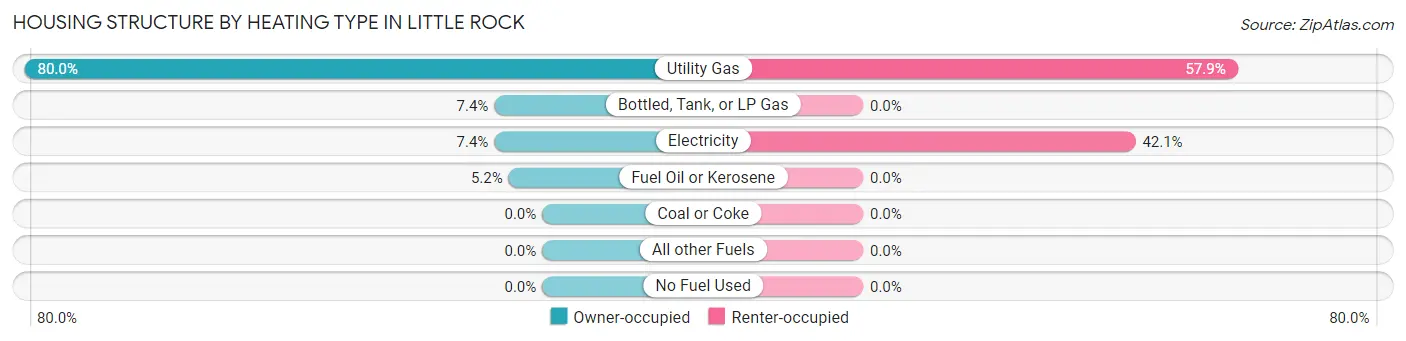
| Heating Type | Owner-occupied | Renter-occupied |
| Utility Gas | 108 (80.0%) | 11 (57.9%) |
| Bottled, Tank, or LP Gas | 10 (7.4%) | 0 (0.0%) |
| Electricity | 10 (7.4%) | 8 (42.1%) |
| Fuel Oil or Kerosene | 7 (5.2%) | 0 (0.0%) |
| Coal or Coke | 0 (0.0%) | 0 (0.0%) |
| All other Fuels | 0 (0.0%) | 0 (0.0%) |
| No Fuel Used | 0 (0.0%) | 0 (0.0%) |
| Total | 135 (100.0%) | 19 (100.0%) |
Household Vehicle Usage in Little Rock
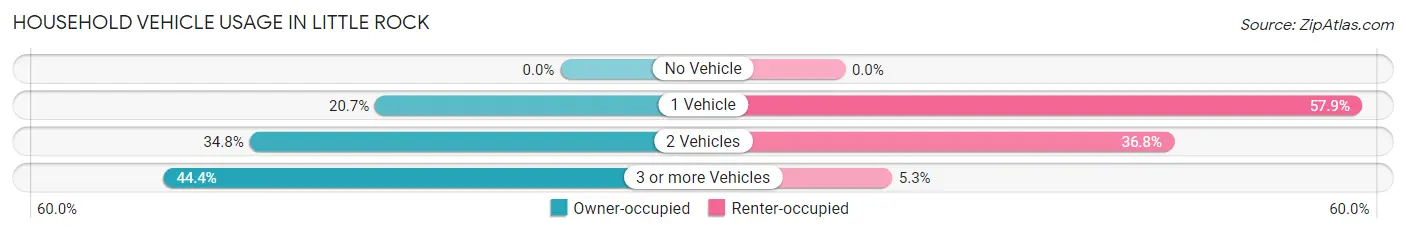
| Vehicles per Household | Owner-occupied | Renter-occupied |
| No Vehicle | 0 (0.0%) | 0 (0.0%) |
| 1 Vehicle | 28 (20.7%) | 11 (57.9%) |
| 2 Vehicles | 47 (34.8%) | 7 (36.8%) |
| 3 or more Vehicles | 60 (44.4%) | 1 (5.3%) |
| Total | 135 (100.0%) | 19 (100.0%) |
Real Estate & Mortgages in Little Rock
Real Estate and Mortgage Overview in Little Rock
| Characteristic | Without Mortgage | With Mortgage |
| Housing Units | 83 | 52 |
| Median Property Value | $81,700 | $82,300 |
| Median Household Income | $61,607 | $3 |
| Monthly Housing Costs | $438 | $0 |
| Real Estate Taxes | $1,113 | $1 |
Property Value by Mortgage Status in Little Rock
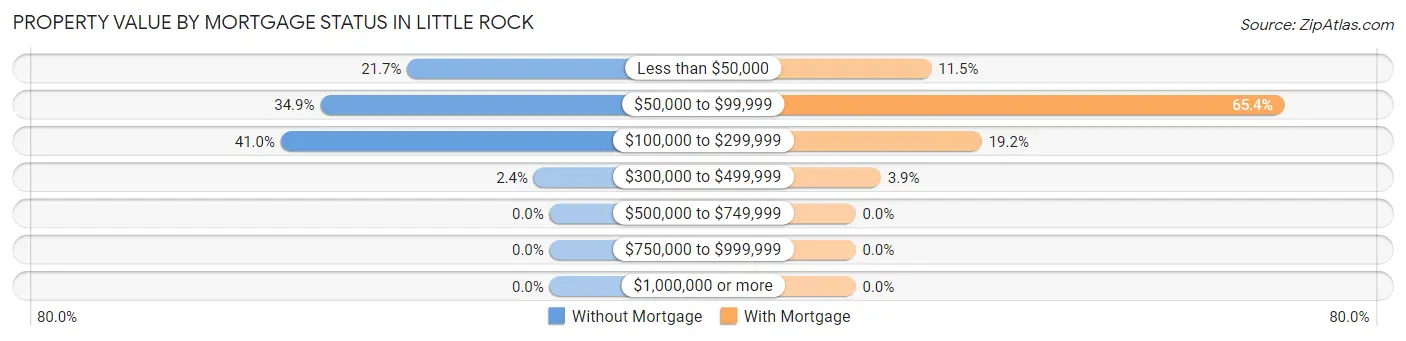
| Property Value | Without Mortgage | With Mortgage |
| Less than $50,000 | 18 (21.7%) | 6 (11.5%) |
| $50,000 to $99,999 | 29 (34.9%) | 34 (65.4%) |
| $100,000 to $299,999 | 34 (41.0%) | 10 (19.2%) |
| $300,000 to $499,999 | 2 (2.4%) | 2 (3.8%) |
| $500,000 to $749,999 | 0 (0.0%) | 0 (0.0%) |
| $750,000 to $999,999 | 0 (0.0%) | 0 (0.0%) |
| $1,000,000 or more | 0 (0.0%) | 0 (0.0%) |
| Total | 83 (100.0%) | 52 (100.0%) |
Household Income by Mortgage Status in Little Rock
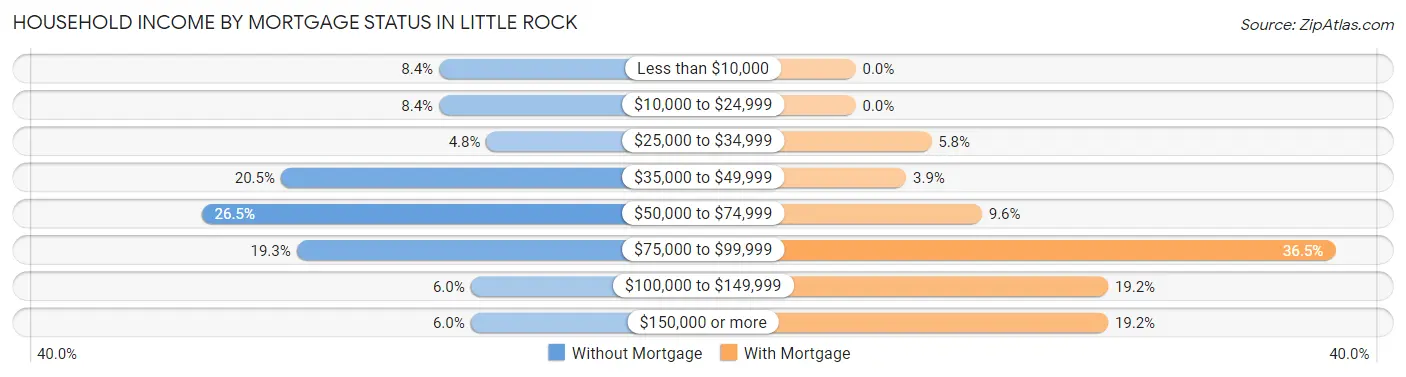
| Household Income | Without Mortgage | With Mortgage |
| Less than $10,000 | 7 (8.4%) | 0 (0.0%) |
| $10,000 to $24,999 | 7 (8.4%) | 0 (0.0%) |
| $25,000 to $34,999 | 4 (4.8%) | 3 (5.8%) |
| $35,000 to $49,999 | 17 (20.5%) | 2 (3.8%) |
| $50,000 to $74,999 | 22 (26.5%) | 5 (9.6%) |
| $75,000 to $99,999 | 16 (19.3%) | 19 (36.5%) |
| $100,000 to $149,999 | 5 (6.0%) | 10 (19.2%) |
| $150,000 or more | 5 (6.0%) | 10 (19.2%) |
| Total | 83 (100.0%) | 52 (100.0%) |
Property Value to Household Income Ratio in Little Rock
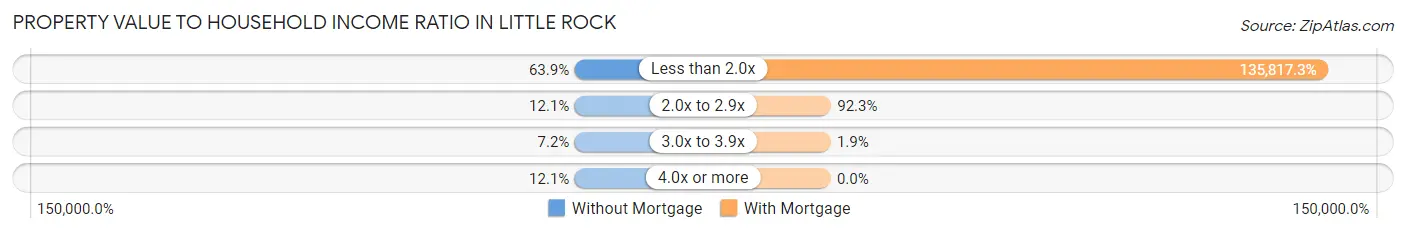
| Value-to-Income Ratio | Without Mortgage | With Mortgage |
| Less than 2.0x | 53 (63.9%) | 70,625 (135,817.3%) |
| 2.0x to 2.9x | 10 (12.0%) | 48 (92.3%) |
| 3.0x to 3.9x | 6 (7.2%) | 1 (1.9%) |
| 4.0x or more | 10 (12.0%) | 0 (0.0%) |
| Total | 83 (100.0%) | 52 (100.0%) |
Real Estate Taxes by Mortgage Status in Little Rock
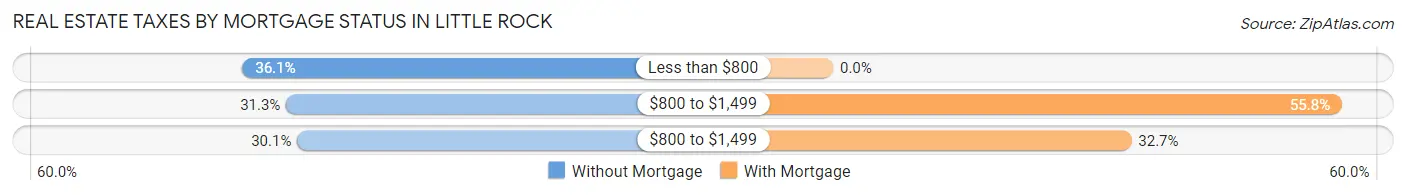
| Property Taxes | Without Mortgage | With Mortgage |
| Less than $800 | 30 (36.1%) | 0 (0.0%) |
| $800 to $1,499 | 26 (31.3%) | 29 (55.8%) |
| $800 to $1,499 | 25 (30.1%) | 17 (32.7%) |
| Total | 83 (100.0%) | 52 (100.0%) |
Health & Disability in Little Rock
Health Insurance Coverage by Age in Little Rock
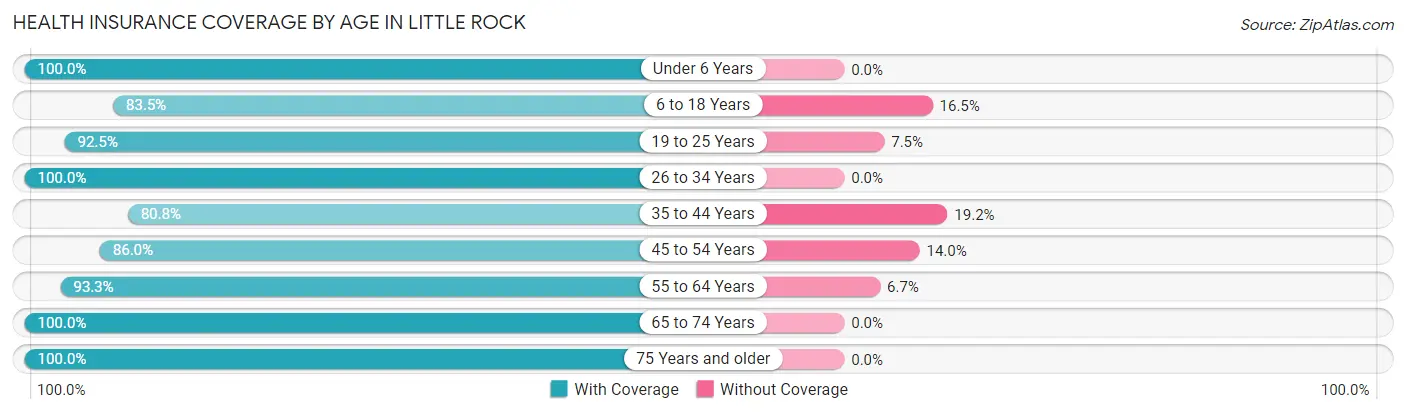
| Age Bracket | With Coverage | Without Coverage |
| Under 6 Years | 32 (100.0%) | 0 (0.0%) |
| 6 to 18 Years | 71 (83.5%) | 14 (16.5%) |
| 19 to 25 Years | 62 (92.5%) | 5 (7.5%) |
| 26 to 34 Years | 39 (100.0%) | 0 (0.0%) |
| 35 to 44 Years | 21 (80.8%) | 5 (19.2%) |
| 45 to 54 Years | 49 (86.0%) | 8 (14.0%) |
| 55 to 64 Years | 28 (93.3%) | 2 (6.7%) |
| 65 to 74 Years | 44 (100.0%) | 0 (0.0%) |
| 75 Years and older | 47 (100.0%) | 0 (0.0%) |
| Total | 393 (92.0%) | 34 (8.0%) |
Health Insurance Coverage by Citizenship Status in Little Rock
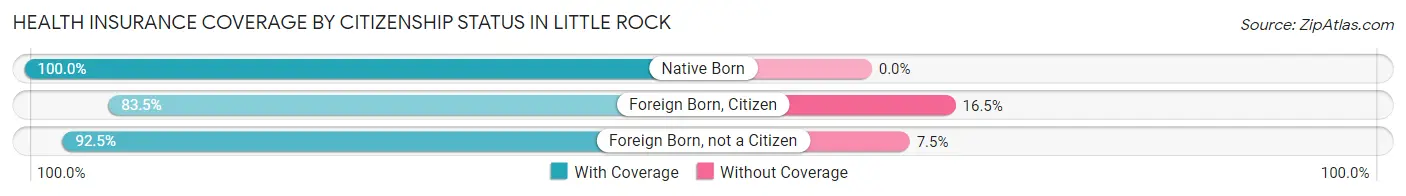
| Citizenship Status | With Coverage | Without Coverage |
| Native Born | 32 (100.0%) | 0 (0.0%) |
| Foreign Born, Citizen | 71 (83.5%) | 14 (16.5%) |
| Foreign Born, not a Citizen | 62 (92.5%) | 5 (7.5%) |
Health Insurance Coverage by Household Income in Little Rock
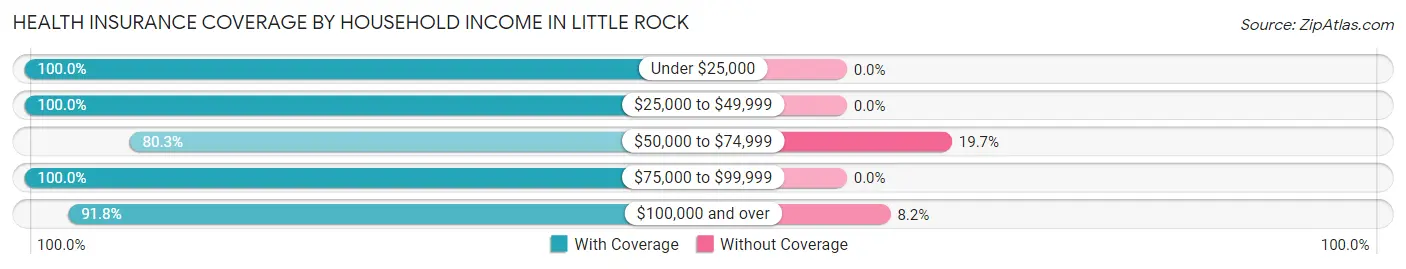
| Household Income | With Coverage | Without Coverage |
| Under $25,000 | 32 (100.0%) | 0 (0.0%) |
| $25,000 to $49,999 | 94 (100.0%) | 0 (0.0%) |
| $50,000 to $74,999 | 102 (80.3%) | 25 (19.7%) |
| $75,000 to $99,999 | 64 (100.0%) | 0 (0.0%) |
| $100,000 and over | 101 (91.8%) | 9 (8.2%) |
Public vs Private Health Insurance Coverage by Age in Little Rock
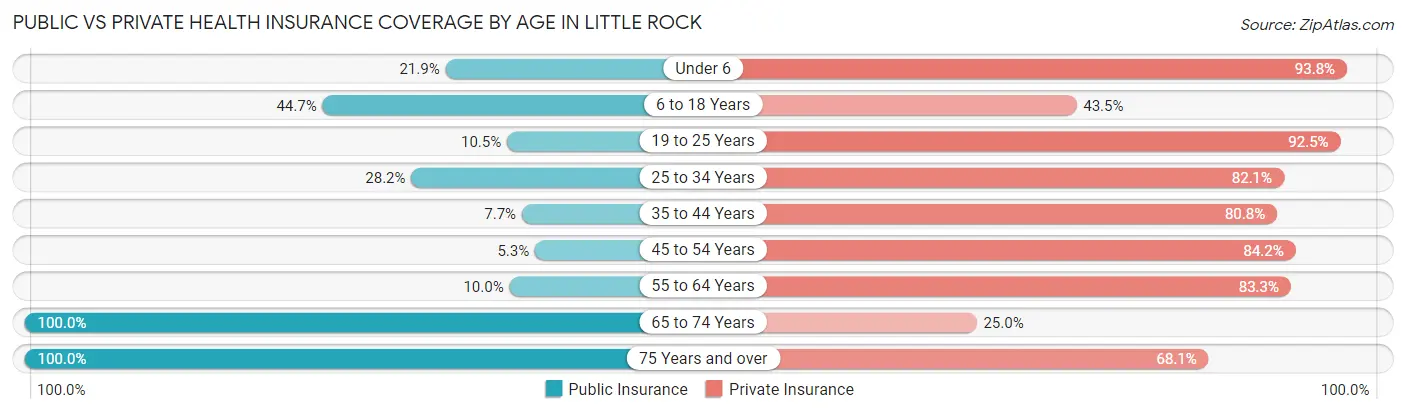
| Age Bracket | Public Insurance | Private Insurance |
| Under 6 | 7 (21.9%) | 30 (93.8%) |
| 6 to 18 Years | 38 (44.7%) | 37 (43.5%) |
| 19 to 25 Years | 7 (10.4%) | 62 (92.5%) |
| 25 to 34 Years | 11 (28.2%) | 32 (82.1%) |
| 35 to 44 Years | 2 (7.7%) | 21 (80.8%) |
| 45 to 54 Years | 3 (5.3%) | 48 (84.2%) |
| 55 to 64 Years | 3 (10.0%) | 25 (83.3%) |
| 65 to 74 Years | 44 (100.0%) | 11 (25.0%) |
| 75 Years and over | 47 (100.0%) | 32 (68.1%) |
| Total | 162 (37.9%) | 298 (69.8%) |
Disability Status by Sex by Age in Little Rock
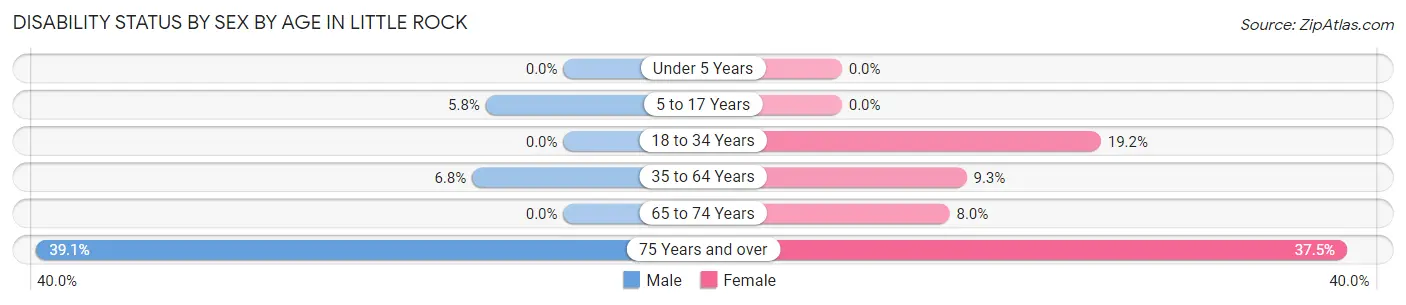
| Age Bracket | Male | Female |
| Under 5 Years | 0 (0.0%) | 0 (0.0%) |
| 5 to 17 Years | 3 (5.8%) | 0 (0.0%) |
| 18 to 34 Years | 0 (0.0%) | 10 (19.2%) |
| 35 to 64 Years | 4 (6.8%) | 5 (9.3%) |
| 65 to 74 Years | 0 (0.0%) | 2 (8.0%) |
| 75 Years and over | 9 (39.1%) | 9 (37.5%) |
Disability Class by Sex by Age in Little Rock
Disability Class: Hearing Difficulty
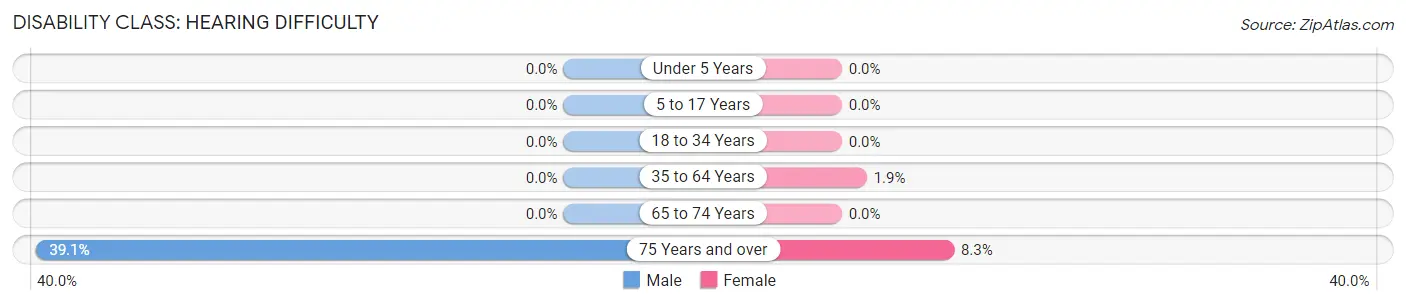
| Age Bracket | Male | Female |
| Under 5 Years | 0 (0.0%) | 0 (0.0%) |
| 5 to 17 Years | 0 (0.0%) | 0 (0.0%) |
| 18 to 34 Years | 0 (0.0%) | 0 (0.0%) |
| 35 to 64 Years | 0 (0.0%) | 1 (1.8%) |
| 65 to 74 Years | 0 (0.0%) | 0 (0.0%) |
| 75 Years and over | 9 (39.1%) | 2 (8.3%) |
Disability Class: Vision Difficulty
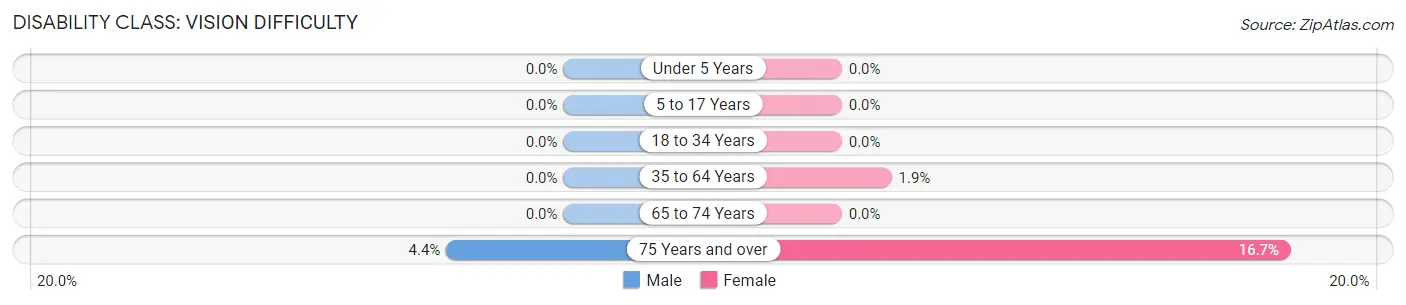
| Age Bracket | Male | Female |
| Under 5 Years | 0 (0.0%) | 0 (0.0%) |
| 5 to 17 Years | 0 (0.0%) | 0 (0.0%) |
| 18 to 34 Years | 0 (0.0%) | 0 (0.0%) |
| 35 to 64 Years | 0 (0.0%) | 1 (1.8%) |
| 65 to 74 Years | 0 (0.0%) | 0 (0.0%) |
| 75 Years and over | 1 (4.3%) | 4 (16.7%) |
Disability Class: Cognitive Difficulty
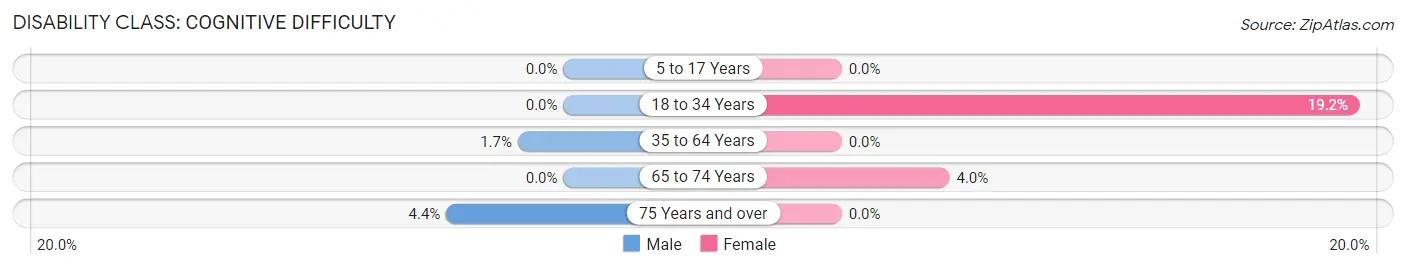
| Age Bracket | Male | Female |
| 5 to 17 Years | 0 (0.0%) | 0 (0.0%) |
| 18 to 34 Years | 0 (0.0%) | 10 (19.2%) |
| 35 to 64 Years | 1 (1.7%) | 0 (0.0%) |
| 65 to 74 Years | 0 (0.0%) | 1 (4.0%) |
| 75 Years and over | 1 (4.3%) | 0 (0.0%) |
Disability Class: Ambulatory Difficulty
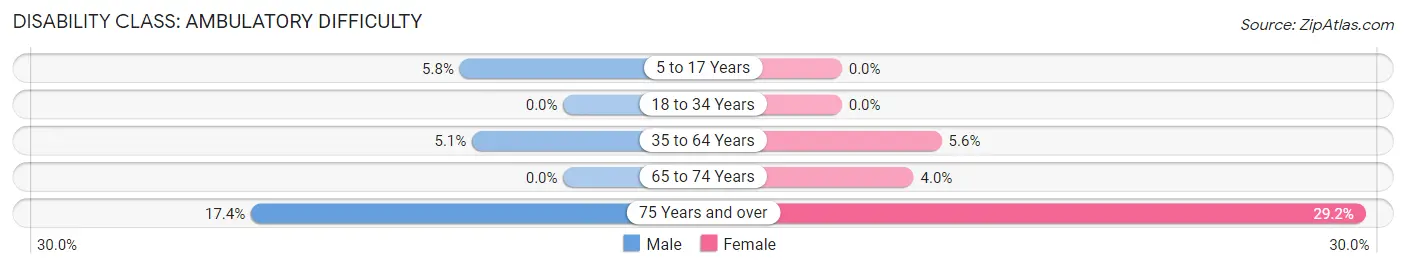
| Age Bracket | Male | Female |
| 5 to 17 Years | 3 (5.8%) | 0 (0.0%) |
| 18 to 34 Years | 0 (0.0%) | 0 (0.0%) |
| 35 to 64 Years | 3 (5.1%) | 3 (5.6%) |
| 65 to 74 Years | 0 (0.0%) | 1 (4.0%) |
| 75 Years and over | 4 (17.4%) | 7 (29.2%) |
Disability Class: Self-Care Difficulty
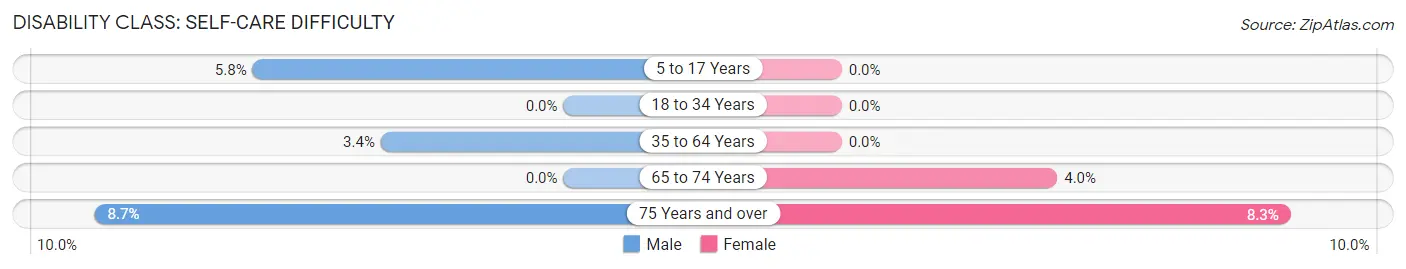
| Age Bracket | Male | Female |
| 5 to 17 Years | 3 (5.8%) | 0 (0.0%) |
| 18 to 34 Years | 0 (0.0%) | 0 (0.0%) |
| 35 to 64 Years | 2 (3.4%) | 0 (0.0%) |
| 65 to 74 Years | 0 (0.0%) | 1 (4.0%) |
| 75 Years and over | 2 (8.7%) | 2 (8.3%) |
Technology Access in Little Rock
Computing Device Access in Little Rock
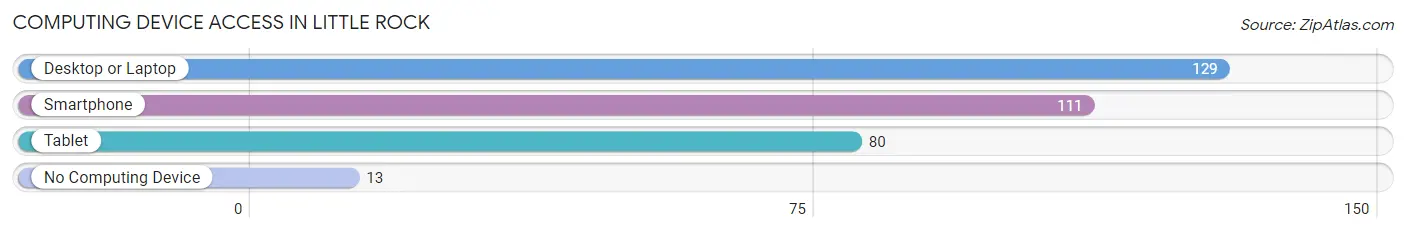
| Device Type | # Households | % Households |
| Desktop or Laptop | 129 | 83.8% |
| Smartphone | 111 | 72.1% |
| Tablet | 80 | 51.9% |
| No Computing Device | 13 | 8.4% |
| Total | 154 | 100.0% |
Internet Access in Little Rock
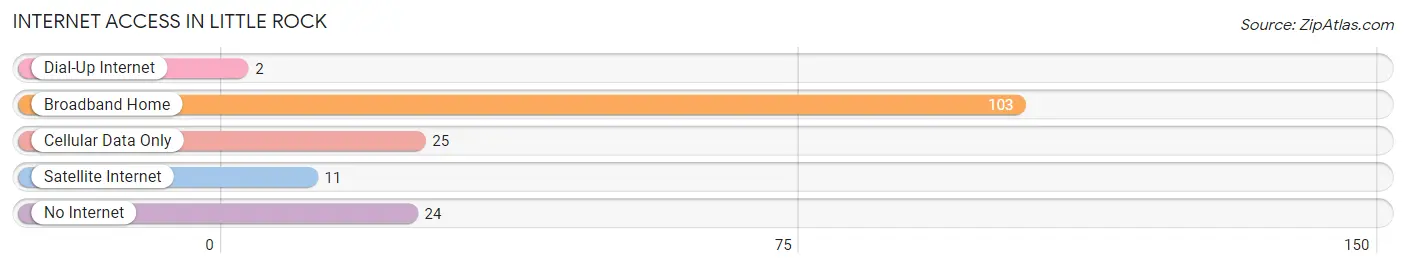
| Internet Type | # Households | % Households |
| Dial-Up Internet | 2 | 1.3% |
| Broadband Home | 103 | 66.9% |
| Cellular Data Only | 25 | 16.2% |
| Satellite Internet | 11 | 7.1% |
| No Internet | 24 | 15.6% |
| Total | 154 | 100.0% |
Little Rock Summary
Little Rock, Iowa is a small town located in the southeastern corner of the state, in Jackson County. It is situated on the banks of the Maquoketa River, and is surrounded by rolling hills and farmland. The town was founded in 1854, and has a population of just over 500 people.
Geography
Little Rock is located in the southeastern corner of Iowa, in Jackson County. It is situated on the banks of the Maquoketa River, and is surrounded by rolling hills and farmland. The town is located about 25 miles from the Mississippi River, and is about an hour and a half drive from the state capital of Des Moines. The town is located in a rural area, and is surrounded by small towns and villages.
Economy
Little Rock’s economy is largely based on agriculture. The town is home to several farms, and the surrounding area is known for its production of corn, soybeans, and hay. The town also has a few small businesses, including a grocery store, a hardware store, and a few restaurants. The town is also home to a few manufacturing companies, including a furniture factory and a plastics factory.
Demographics
As of the 2010 census, Little Rock had a population of 514 people. The population is predominantly white, with about 95% of the population being white. The median household income is $41,250, and the median age is 44. The town is also home to a small Hispanic population, with about 5% of the population being Hispanic.
History
Little Rock was founded in 1854, and was originally known as “Little Rock Station”. The town was named after the nearby Little Rock Creek, which was named after a large rock that was located in the creek. The town was originally a stop on the Chicago, Rock Island and Pacific Railroad, and was a popular stop for travelers. The town was also home to a few small businesses, including a general store and a blacksmith shop.
In the late 19th century, the town began to grow, and several new businesses were established. The town was also home to a few churches, and a school was built in 1891. The town continued to grow throughout the 20th century, and in the 1950s, the town was home to several manufacturing companies.
Today, Little Rock is a small, rural town, and is home to a few small businesses and farms. The town is also home to a few churches, and a school. The town is a popular destination for tourists, and is known for its scenic views and peaceful atmosphere.
Common Questions
What is Per Capita Income in Little Rock?
Per Capita income in Little Rock is $27,607.
What is the Median Family Income in Little Rock?
Median Family Income in Little Rock is $68,906.
What is the Median Household income in Little Rock?
Median Household Income in Little Rock is $64,000.
What is Income or Wage Gap in Little Rock?
Income or Wage Gap in Little Rock is 56.6%.
Women in Little Rock earn 43.4 cents for every dollar earned by a man.
What is Inequality or Gini Index in Little Rock?
Inequality or Gini Index in Little Rock is 0.37.
What is the Total Population of Little Rock?
Total Population of Little Rock is 430.
What is the Total Male Population of Little Rock?
Total Male Population of Little Rock is 223.
What is the Total Female Population of Little Rock?
Total Female Population of Little Rock is 207.
What is the Ratio of Males per 100 Females in Little Rock?
There are 107.73 Males per 100 Females in Little Rock.
What is the Ratio of Females per 100 Males in Little Rock?
There are 92.83 Females per 100 Males in Little Rock.
What is the Median Population Age in Little Rock?
Median Population Age in Little Rock is 30.7 Years.
What is the Average Family Size in Little Rock
Average Family Size in Little Rock is 3.7 People.
What is the Average Household Size in Little Rock
Average Household Size in Little Rock is 2.8 People.
How Large is the Labor Force in Little Rock?
There are 236 People in the Labor Forcein in Little Rock.
What is the Percentage of People in the Labor Force in Little Rock?
68.4% of People are in the Labor Force in Little Rock.
What is the Unemployment Rate in Little Rock?
Unemployment Rate in Little Rock is 0.9%.