West Bend, IA Map & Demographics
West Bend Map
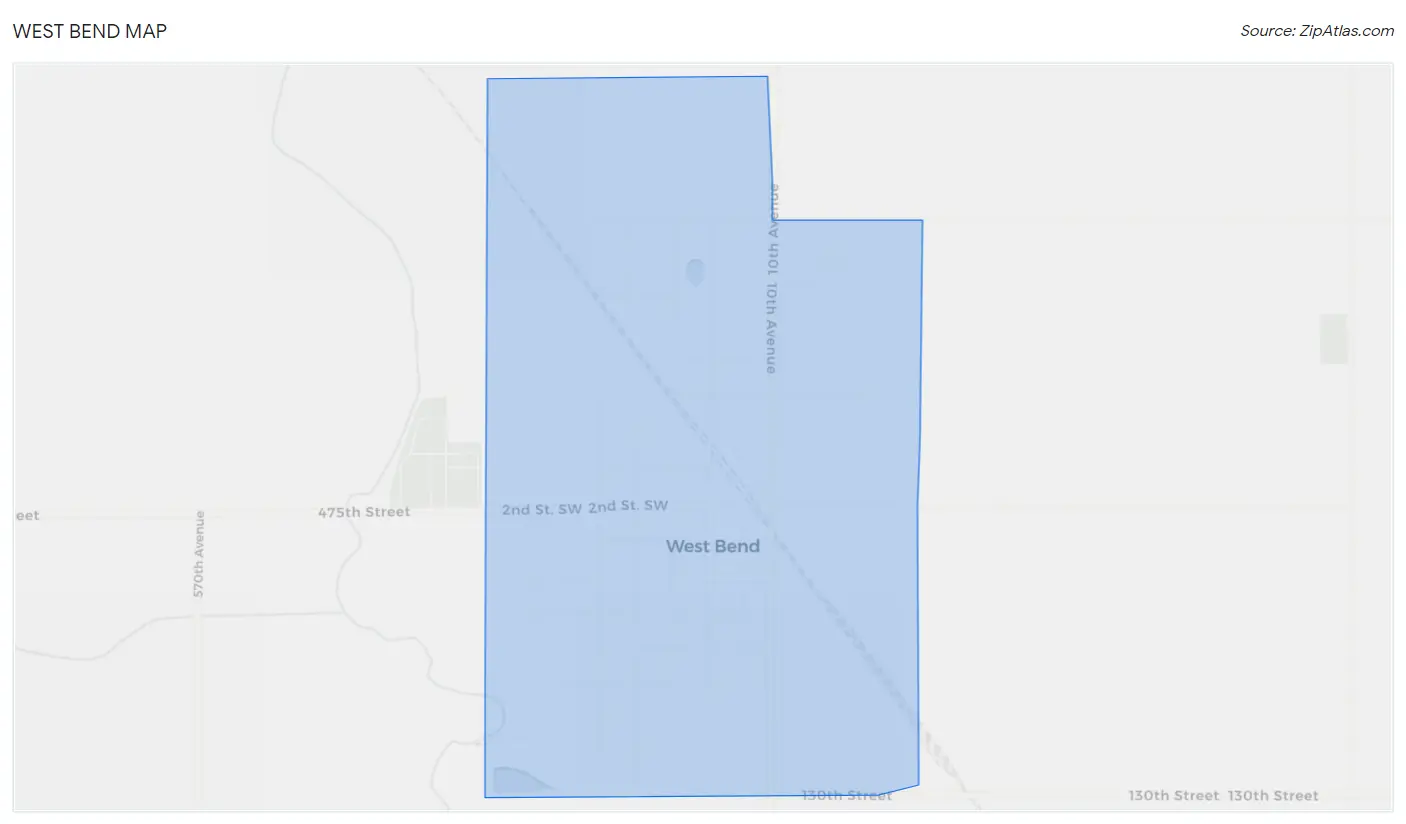
West Bend Overview
$30,222
PER CAPITA INCOME
$85,898
AVG FAMILY INCOME
$80,337
AVG HOUSEHOLD INCOME
24.6%
WAGE / INCOME GAP [ % ]
75.4¢/ $1
WAGE / INCOME GAP [ $ ]
0.39
INEQUALITY / GINI INDEX
936
TOTAL POPULATION
423
MALE POPULATION
513
FEMALE POPULATION
82.46
MALES / 100 FEMALES
121.28
FEMALES / 100 MALES
35.6
MEDIAN AGE
3.5
AVG FAMILY SIZE
2.8
AVG HOUSEHOLD SIZE
421
LABOR FORCE [ PEOPLE ]
58.2%
PERCENT IN LABOR FORCE
4.0%
UNEMPLOYMENT RATE
West Bend Zip Codes
West Bend Area Codes
Income in West Bend
Income Overview in West Bend
Per Capita Income in West Bend is $30,222, while median incomes of families and households are $85,898 and $80,337 respectively.
| Characteristic | Number | Measure |
| Per Capita Income | 936 | $30,222 |
| Median Family Income | 217 | $85,898 |
| Mean Family Income | 217 | $99,149 |
| Median Household Income | 323 | $80,337 |
| Mean Household Income | 323 | $83,309 |
| Income Deficit | 217 | $0 |
| Wage / Income Gap (%) | 936 | 24.57% |
| Wage / Income Gap ($) | 936 | 75.43¢ per $1 |
| Gini / Inequality Index | 936 | 0.39 |
Earnings by Sex in West Bend
Average Earnings in West Bend are $36,172, $40,282 for men and $30,385 for women, a difference of 24.6%.
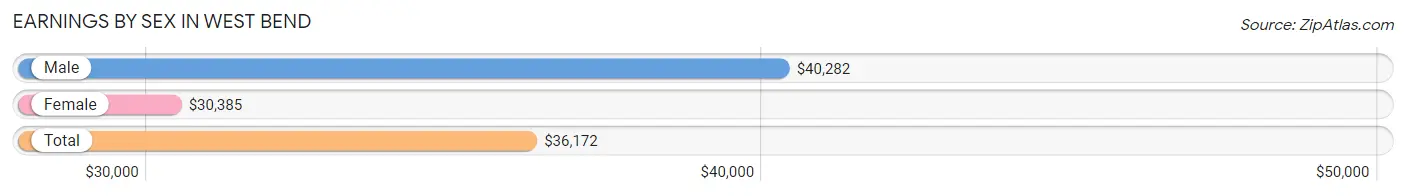
| Sex | Number | Average Earnings |
| Male | 247 (53.3%) | $40,282 |
| Female | 216 (46.7%) | $30,385 |
| Total | 463 (100.0%) | $36,172 |
Earnings by Sex by Income Bracket in West Bend
The most common earnings brackets in West Bend are $100,000+ for men (35 | 14.2%) and $40,000 to $44,999 for women (38 | 17.6%).
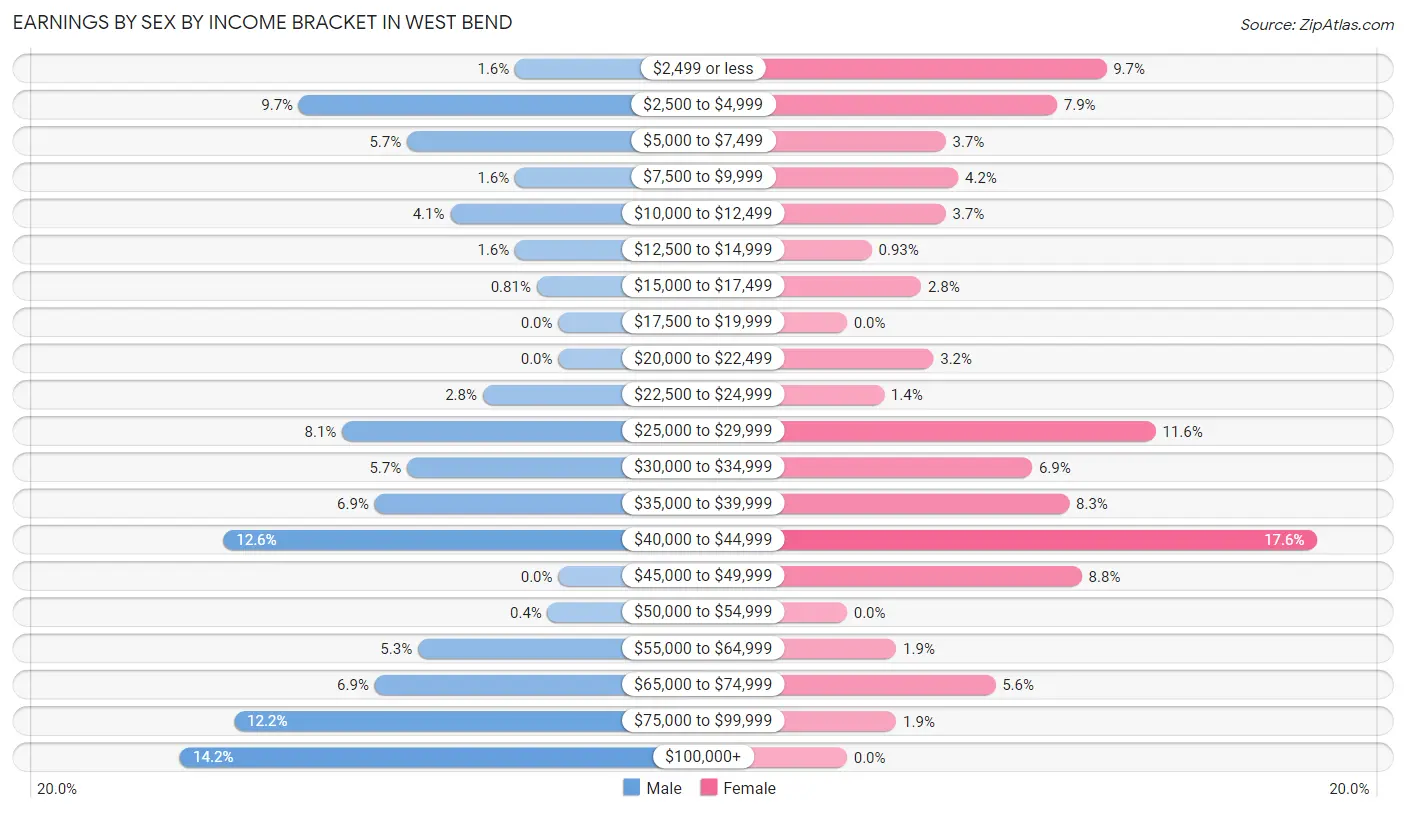
| Income | Male | Female |
| $2,499 or less | 4 (1.6%) | 21 (9.7%) |
| $2,500 to $4,999 | 24 (9.7%) | 17 (7.9%) |
| $5,000 to $7,499 | 14 (5.7%) | 8 (3.7%) |
| $7,500 to $9,999 | 4 (1.6%) | 9 (4.2%) |
| $10,000 to $12,499 | 10 (4.1%) | 8 (3.7%) |
| $12,500 to $14,999 | 4 (1.6%) | 2 (0.9%) |
| $15,000 to $17,499 | 2 (0.8%) | 6 (2.8%) |
| $17,500 to $19,999 | 0 (0.0%) | 0 (0.0%) |
| $20,000 to $22,499 | 0 (0.0%) | 7 (3.2%) |
| $22,500 to $24,999 | 7 (2.8%) | 3 (1.4%) |
| $25,000 to $29,999 | 20 (8.1%) | 25 (11.6%) |
| $30,000 to $34,999 | 14 (5.7%) | 15 (6.9%) |
| $35,000 to $39,999 | 17 (6.9%) | 18 (8.3%) |
| $40,000 to $44,999 | 31 (12.6%) | 38 (17.6%) |
| $45,000 to $49,999 | 0 (0.0%) | 19 (8.8%) |
| $50,000 to $54,999 | 1 (0.4%) | 0 (0.0%) |
| $55,000 to $64,999 | 13 (5.3%) | 4 (1.8%) |
| $65,000 to $74,999 | 17 (6.9%) | 12 (5.6%) |
| $75,000 to $99,999 | 30 (12.1%) | 4 (1.8%) |
| $100,000+ | 35 (14.2%) | 0 (0.0%) |
| Total | 247 (100.0%) | 216 (100.0%) |
Earnings by Sex by Educational Attainment in West Bend
Average earnings in West Bend are $58,000 for men and $38,295 for women, a difference of 34.0%. Men with an educational attainment of bachelor's degree enjoy the highest average annual earnings of $80,192, while those with less than high school education earn the least with $34,896. Women with an educational attainment of bachelor's degree earn the most with the average annual earnings of $47,344, while those with college or associate's degree education have the smallest earnings of $27,679.
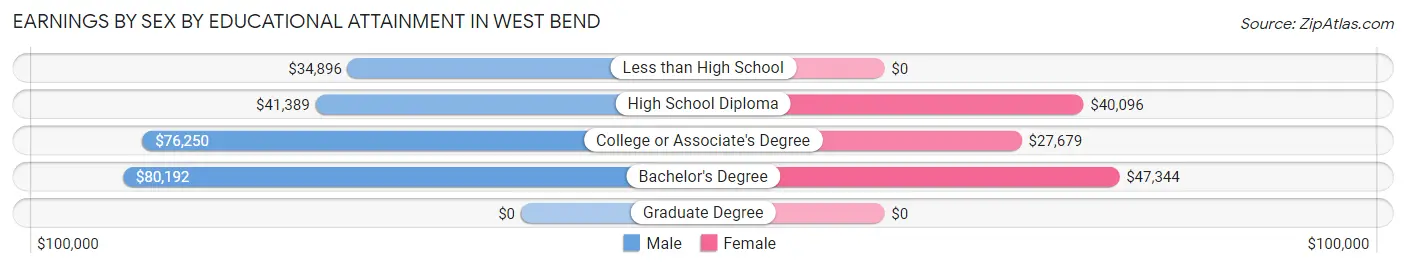
| Educational Attainment | Male Income | Female Income |
| Less than High School | $34,896 | $0 |
| High School Diploma | $41,389 | $40,096 |
| College or Associate's Degree | $76,250 | $27,679 |
| Bachelor's Degree | $80,192 | $47,344 |
| Graduate Degree | - | - |
| Total | $58,000 | $38,295 |
Family Income in West Bend
Family Income Brackets in West Bend
According to the West Bend family income data, there are 57 families falling into the $75,000 to $99,999 income range, which is the most common income bracket and makes up 26.3% of all families. Conversely, the less than $10,000 income bracket is the least frequent group with only 4 families (1.8%) belonging to this category.
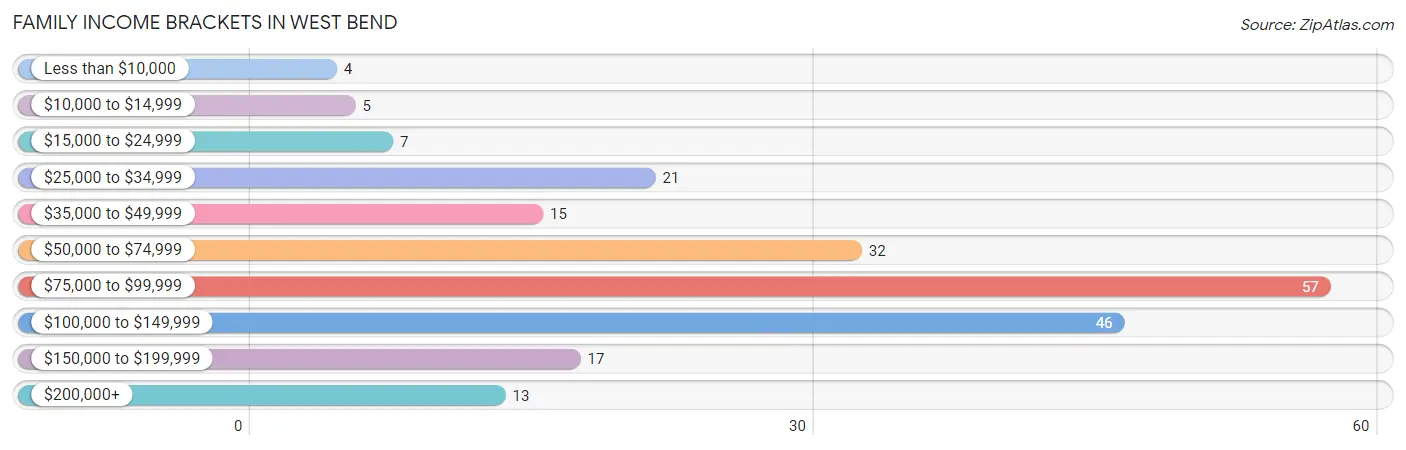
| Income Bracket | # Families | % Families |
| Less than $10,000 | 4 | 1.8% |
| $10,000 to $14,999 | 5 | 2.3% |
| $15,000 to $24,999 | 7 | 3.2% |
| $25,000 to $34,999 | 21 | 9.7% |
| $35,000 to $49,999 | 15 | 6.9% |
| $50,000 to $74,999 | 32 | 14.7% |
| $75,000 to $99,999 | 57 | 26.3% |
| $100,000 to $149,999 | 46 | 21.2% |
| $150,000 to $199,999 | 17 | 7.8% |
| $200,000+ | 13 | 6.0% |
Family Income by Famaliy Size in West Bend
4-person families (9 | 4.2%) account for the highest median family income in West Bend with $150,250 per family, while 2-person families (120 | 55.3%) have the highest median income of $40,416 per family member.
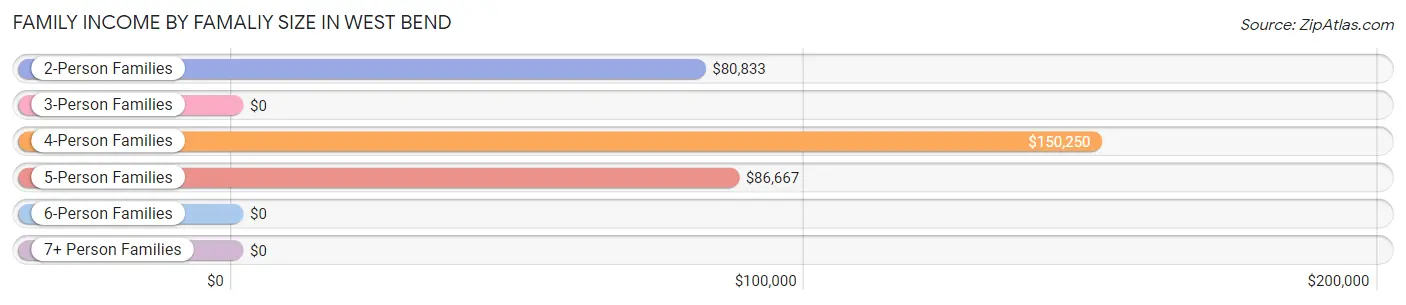
| Income Bracket | # Families | Median Income |
| 2-Person Families | 120 (55.3%) | $80,833 |
| 3-Person Families | 32 (14.7%) | $0 |
| 4-Person Families | 9 (4.2%) | $150,250 |
| 5-Person Families | 30 (13.8%) | $86,667 |
| 6-Person Families | 18 (8.3%) | $0 |
| 7+ Person Families | 8 (3.7%) | $0 |
| Total | 217 (100.0%) | $85,898 |
Family Income by Number of Earners in West Bend
The median family income in West Bend is $85,898, with families comprising 3+ earners (28) having the highest median family income of $147,500, while families with 1 earner (44) have the lowest median family income of $47,083, accounting for 12.9% and 20.3% of families, respectively.
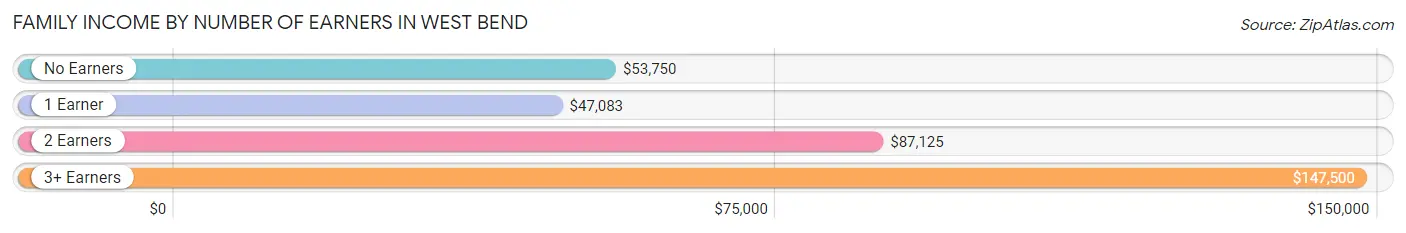
| Number of Earners | # Families | Median Income |
| No Earners | 33 (15.2%) | $53,750 |
| 1 Earner | 44 (20.3%) | $47,083 |
| 2 Earners | 112 (51.6%) | $87,125 |
| 3+ Earners | 28 (12.9%) | $147,500 |
| Total | 217 (100.0%) | $85,898 |
Household Income in West Bend
Household Income Brackets in West Bend
With 76 households falling in the category, the $75,000 to $99,999 income range is the most frequent in West Bend, accounting for 23.5% of all households. In contrast, only 6 households (1.9%) fall into the less than $10,000 income bracket, making it the least populous group.
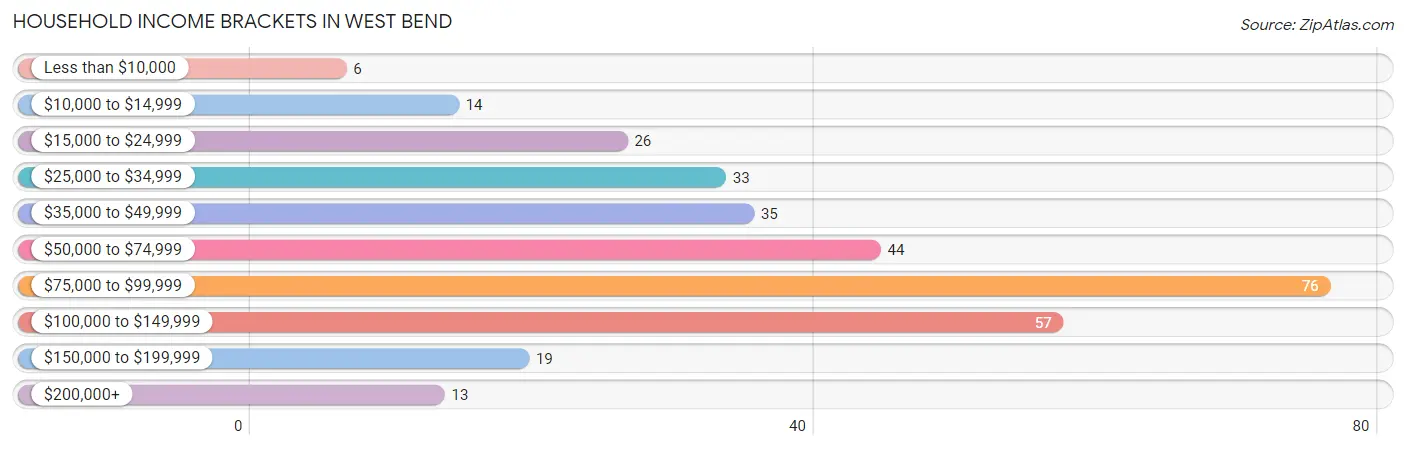
| Income Bracket | # Households | % Households |
| Less than $10,000 | 6 | 1.9% |
| $10,000 to $14,999 | 14 | 4.3% |
| $15,000 to $24,999 | 26 | 8.0% |
| $25,000 to $34,999 | 33 | 10.2% |
| $35,000 to $49,999 | 35 | 10.8% |
| $50,000 to $74,999 | 44 | 13.6% |
| $75,000 to $99,999 | 76 | 23.5% |
| $100,000 to $149,999 | 57 | 17.6% |
| $150,000 to $199,999 | 19 | 5.9% |
| $200,000+ | 13 | 4.0% |
Household Income by Householder Age in West Bend
The median household income in West Bend is $80,337, with the highest median household income of $89,375 found in the 45 to 64 years age bracket for the primary householder. A total of 72 households (22.3%) fall into this category. Meanwhile, the 65+ years age bracket for the primary householder has the lowest median household income of $46,591, with 138 households (42.7%) in this group.
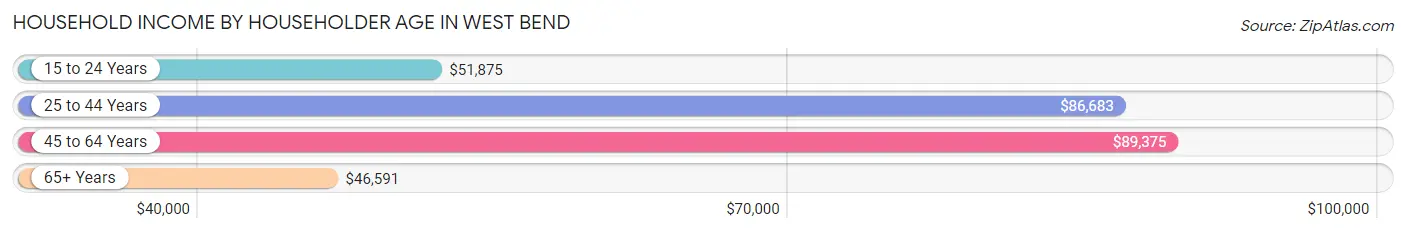
| Income Bracket | # Households | Median Income |
| 15 to 24 Years | 26 (8.1%) | $51,875 |
| 25 to 44 Years | 87 (26.9%) | $86,683 |
| 45 to 64 Years | 72 (22.3%) | $89,375 |
| 65+ Years | 138 (42.7%) | $46,591 |
| Total | 323 (100.0%) | $80,337 |
Poverty in West Bend
Income Below Poverty by Sex and Age in West Bend
With 5.7% poverty level for males and 3.2% for females among the residents of West Bend, 45 to 54 year old males and 45 to 54 year old females are the most vulnerable to poverty, with 9 males (36.0%) and 7 females (20.6%) in their respective age groups living below the poverty level.
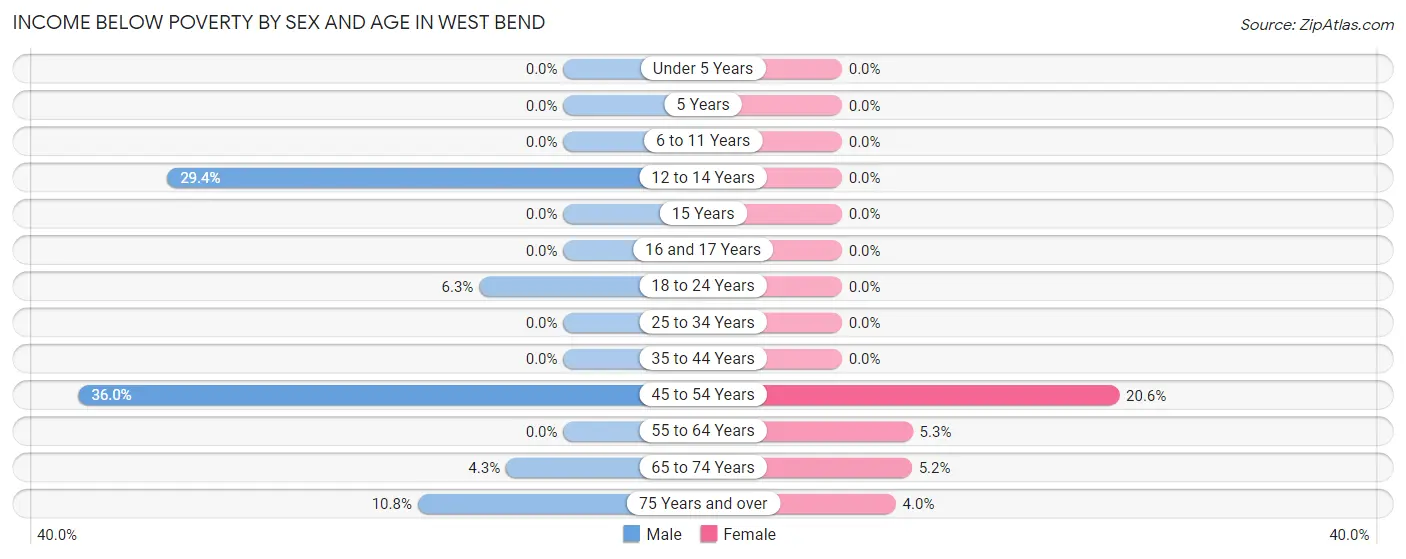
| Age Bracket | Male | Female |
| Under 5 Years | 0 (0.0%) | 0 (0.0%) |
| 5 Years | 0 (0.0%) | 0 (0.0%) |
| 6 to 11 Years | 0 (0.0%) | 0 (0.0%) |
| 12 to 14 Years | 5 (29.4%) | 0 (0.0%) |
| 15 Years | 0 (0.0%) | 0 (0.0%) |
| 16 and 17 Years | 0 (0.0%) | 0 (0.0%) |
| 18 to 24 Years | 4 (6.2%) | 0 (0.0%) |
| 25 to 34 Years | 0 (0.0%) | 0 (0.0%) |
| 35 to 44 Years | 0 (0.0%) | 0 (0.0%) |
| 45 to 54 Years | 9 (36.0%) | 7 (20.6%) |
| 55 to 64 Years | 0 (0.0%) | 2 (5.3%) |
| 65 to 74 Years | 2 (4.3%) | 4 (5.2%) |
| 75 Years and over | 4 (10.8%) | 2 (4.0%) |
| Total | 24 (5.7%) | 15 (3.2%) |
Income Above Poverty by Sex and Age in West Bend
According to the poverty statistics in West Bend, males aged under 5 years and females aged under 5 years are the age groups that are most secure financially, with 100.0% of males and 100.0% of females in these age groups living above the poverty line.
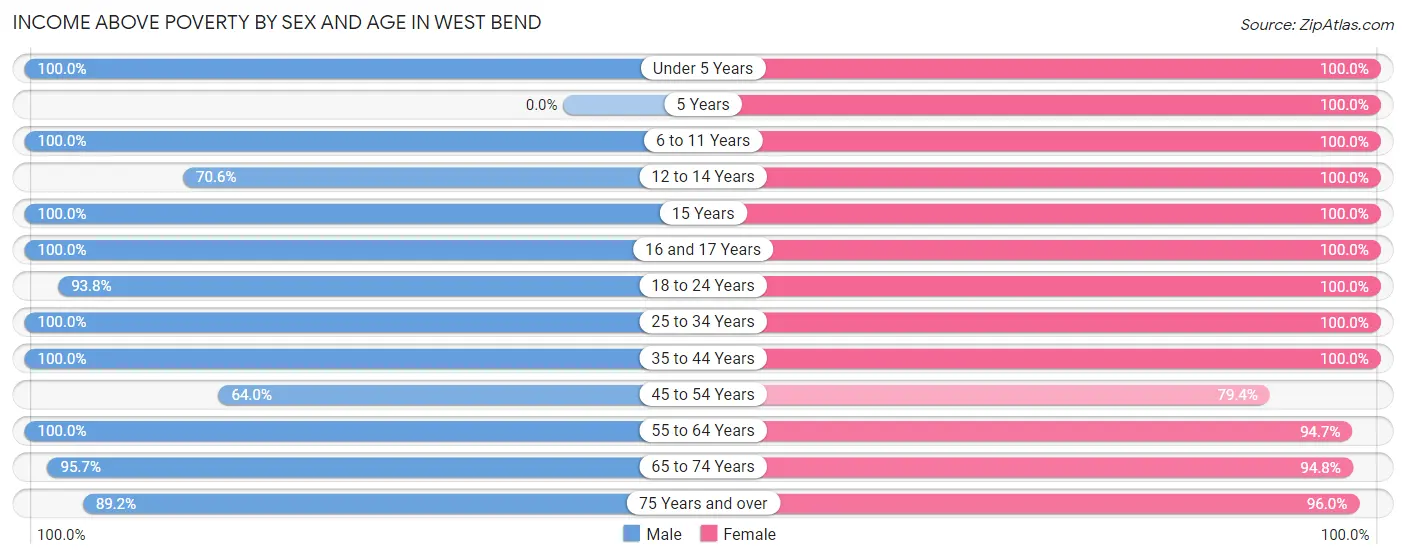
| Age Bracket | Male | Female |
| Under 5 Years | 32 (100.0%) | 32 (100.0%) |
| 5 Years | 0 (0.0%) | 10 (100.0%) |
| 6 to 11 Years | 31 (100.0%) | 41 (100.0%) |
| 12 to 14 Years | 12 (70.6%) | 18 (100.0%) |
| 15 Years | 27 (100.0%) | 5 (100.0%) |
| 16 and 17 Years | 18 (100.0%) | 44 (100.0%) |
| 18 to 24 Years | 60 (93.8%) | 45 (100.0%) |
| 25 to 34 Years | 45 (100.0%) | 30 (100.0%) |
| 35 to 44 Years | 51 (100.0%) | 49 (100.0%) |
| 45 to 54 Years | 16 (64.0%) | 27 (79.4%) |
| 55 to 64 Years | 29 (100.0%) | 36 (94.7%) |
| 65 to 74 Years | 45 (95.7%) | 73 (94.8%) |
| 75 Years and over | 33 (89.2%) | 48 (96.0%) |
| Total | 399 (94.3%) | 458 (96.8%) |
Income Below Poverty Among Married-Couple Families in West Bend
The poverty statistics for married-couple families in West Bend show that 3.0% or 6 of the total 200 families live below the poverty line. Families with no children have the highest poverty rate of 5.0%, comprising of 6 families. On the other hand, families with 1 or 2 children have the lowest poverty rate of 0.0%, which includes 0 families.
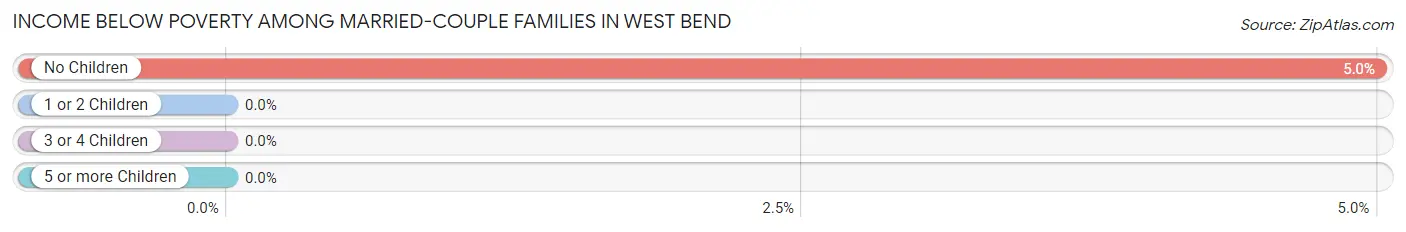
| Children | Above Poverty | Below Poverty |
| No Children | 114 (95.0%) | 6 (5.0%) |
| 1 or 2 Children | 38 (100.0%) | 0 (0.0%) |
| 3 or 4 Children | 34 (100.0%) | 0 (0.0%) |
| 5 or more Children | 8 (100.0%) | 0 (0.0%) |
| Total | 194 (97.0%) | 6 (3.0%) |
Income Below Poverty Among Single-Parent Households in West Bend
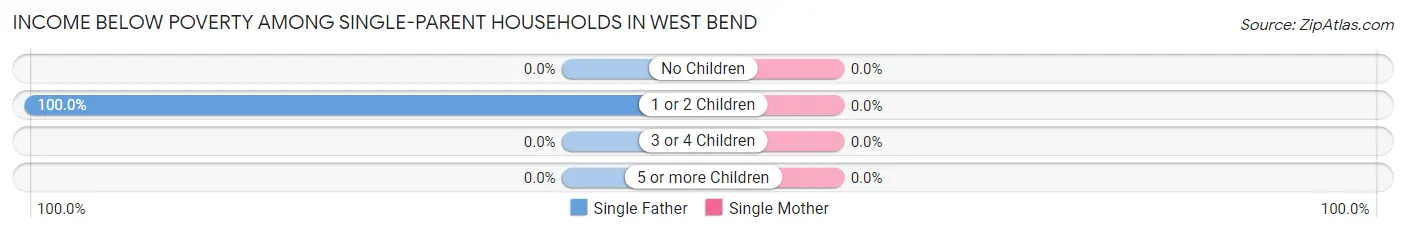
| Children | Single Father | Single Mother |
| No Children | 0 (0.0%) | 0 (0.0%) |
| 1 or 2 Children | 5 (100.0%) | 0 (0.0%) |
| 3 or 4 Children | 0 (0.0%) | 0 (0.0%) |
| 5 or more Children | 0 (0.0%) | 0 (0.0%) |
| Total | 5 (100.0%) | 0 (0.0%) |
Income Below Poverty Among Married-Couple vs Single-Parent Households in West Bend
The poverty data for West Bend shows that 6 of the married-couple family households (3.0%) and 5 of the single-parent households (29.4%) are living below the poverty level. Within the married-couple family households, those with no children have the highest poverty rate, with 6 households (5.0%) falling below the poverty line. Among the single-parent households, those with 1 or 2 children have the highest poverty rate, with 5 household (100.0%) living below poverty.
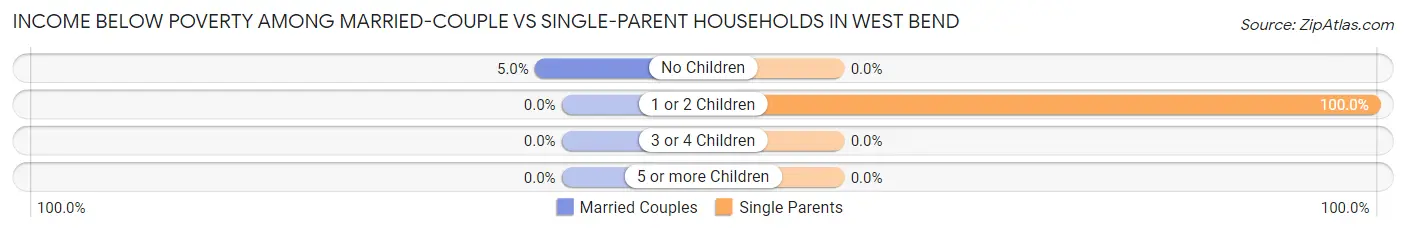
| Children | Married-Couple Families | Single-Parent Households |
| No Children | 6 (5.0%) | 0 (0.0%) |
| 1 or 2 Children | 0 (0.0%) | 5 (100.0%) |
| 3 or 4 Children | 0 (0.0%) | 0 (0.0%) |
| 5 or more Children | 0 (0.0%) | 0 (0.0%) |
| Total | 6 (3.0%) | 5 (29.4%) |
Race in West Bend
The most populous races in West Bend are White / Caucasian (838 | 89.5%), Hispanic or Latino (147 | 15.7%), and Two or more Races (54 | 5.8%).
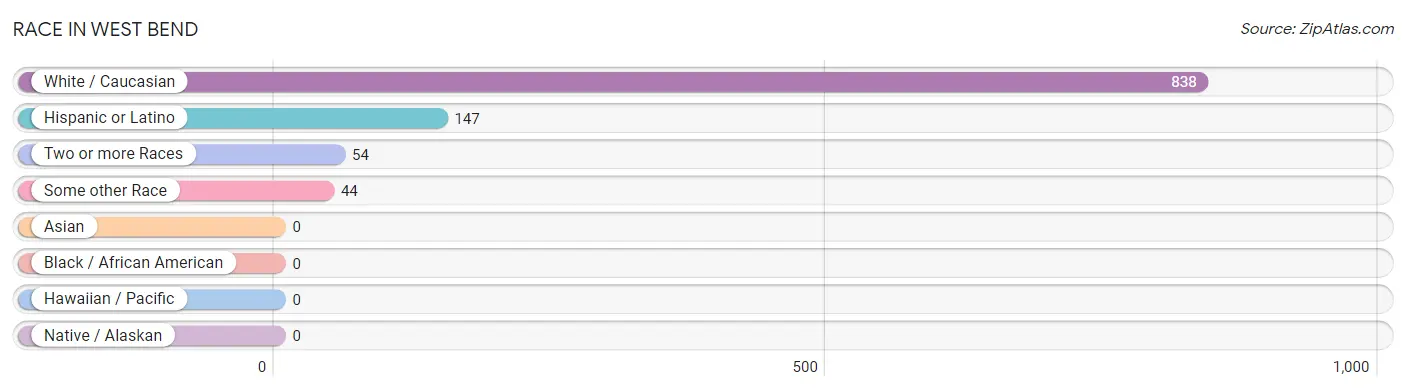
| Race | # Population | % Population |
| Asian | 0 | 0.0% |
| Black / African American | 0 | 0.0% |
| Hawaiian / Pacific | 0 | 0.0% |
| Hispanic or Latino | 147 | 15.7% |
| Native / Alaskan | 0 | 0.0% |
| White / Caucasian | 838 | 89.5% |
| Two or more Races | 54 | 5.8% |
| Some other Race | 44 | 4.7% |
| Total | 936 | 100.0% |
Ancestry in West Bend
The most populous ancestries reported in West Bend are German (512 | 54.7%), Irish (146 | 15.6%), Mexican (79 | 8.4%), Central American (63 | 6.7%), and English (58 | 6.2%), together accounting for 91.7% of all West Bend residents.
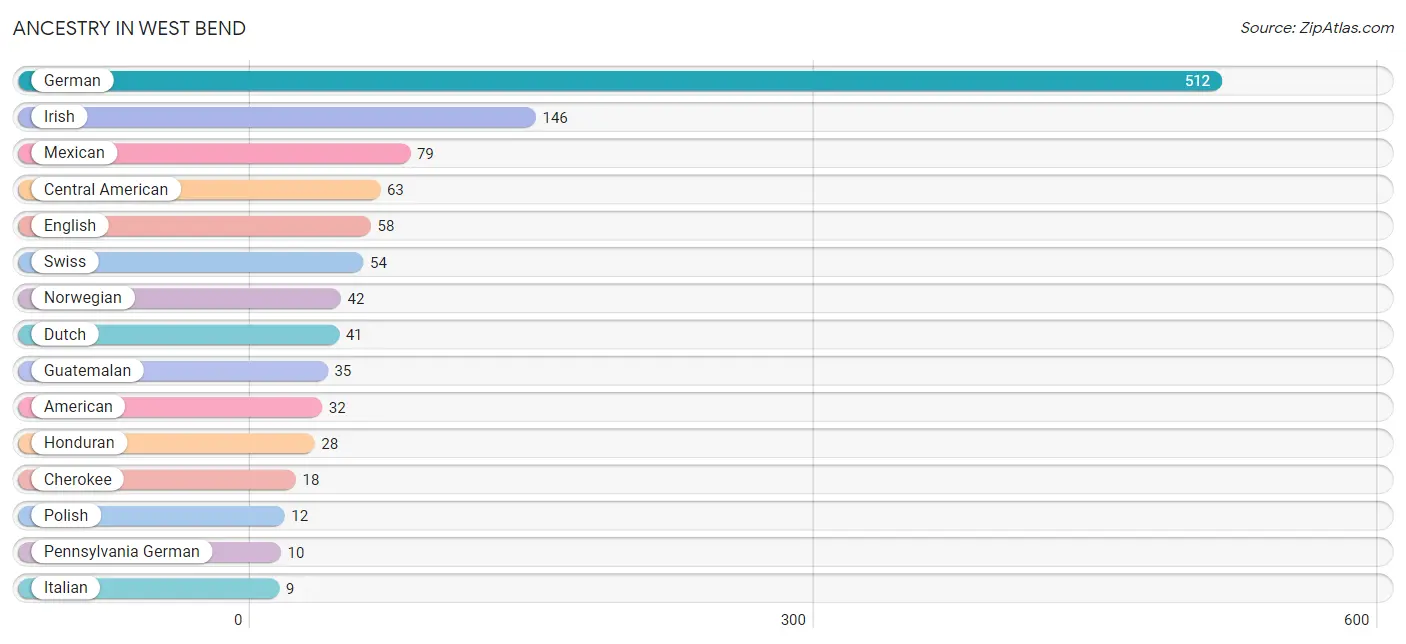
| Ancestry | # Population | % Population |
| American | 32 | 3.4% |
| Bolivian | 5 | 0.5% |
| Central American | 63 | 6.7% |
| Cherokee | 18 | 1.9% |
| Danish | 7 | 0.7% |
| Dutch | 41 | 4.4% |
| English | 58 | 6.2% |
| European | 6 | 0.6% |
| French | 8 | 0.9% |
| French Canadian | 5 | 0.5% |
| German | 512 | 54.7% |
| Guatemalan | 35 | 3.7% |
| Honduran | 28 | 3.0% |
| Irish | 146 | 15.6% |
| Italian | 9 | 1.0% |
| Luxembourger | 6 | 0.6% |
| Mexican | 79 | 8.4% |
| Norwegian | 42 | 4.5% |
| Pennsylvania German | 10 | 1.1% |
| Polish | 12 | 1.3% |
| Portuguese | 2 | 0.2% |
| Scandinavian | 9 | 1.0% |
| Scotch-Irish | 2 | 0.2% |
| Scottish | 7 | 0.7% |
| Slavic | 2 | 0.2% |
| South American | 5 | 0.5% |
| Swedish | 7 | 0.7% |
| Swiss | 54 | 5.8% |
| Welsh | 3 | 0.3% | View All 29 Rows |
Immigrants in West Bend
The most numerous immigrant groups reported in West Bend came from Central America (45 | 4.8%), Latin America (45 | 4.8%), Mexico (31 | 3.3%), Guatemala (14 | 1.5%), and Europe (3 | 0.3%), together accounting for 14.7% of all West Bend residents.
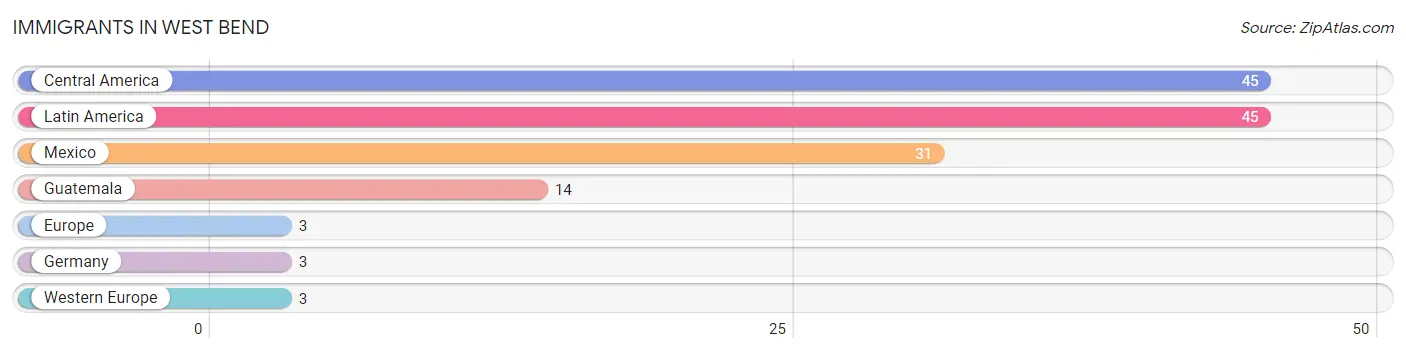
| Immigration Origin | # Population | % Population |
| Central America | 45 | 4.8% |
| Europe | 3 | 0.3% |
| Germany | 3 | 0.3% |
| Guatemala | 14 | 1.5% |
| Latin America | 45 | 4.8% |
| Mexico | 31 | 3.3% |
| Western Europe | 3 | 0.3% | View All 7 Rows |
Sex and Age in West Bend
Sex and Age in West Bend
The most populous age groups in West Bend are 15 to 19 Years (84 | 19.9%) for men and 85 Years and over (60 | 11.7%) for women.
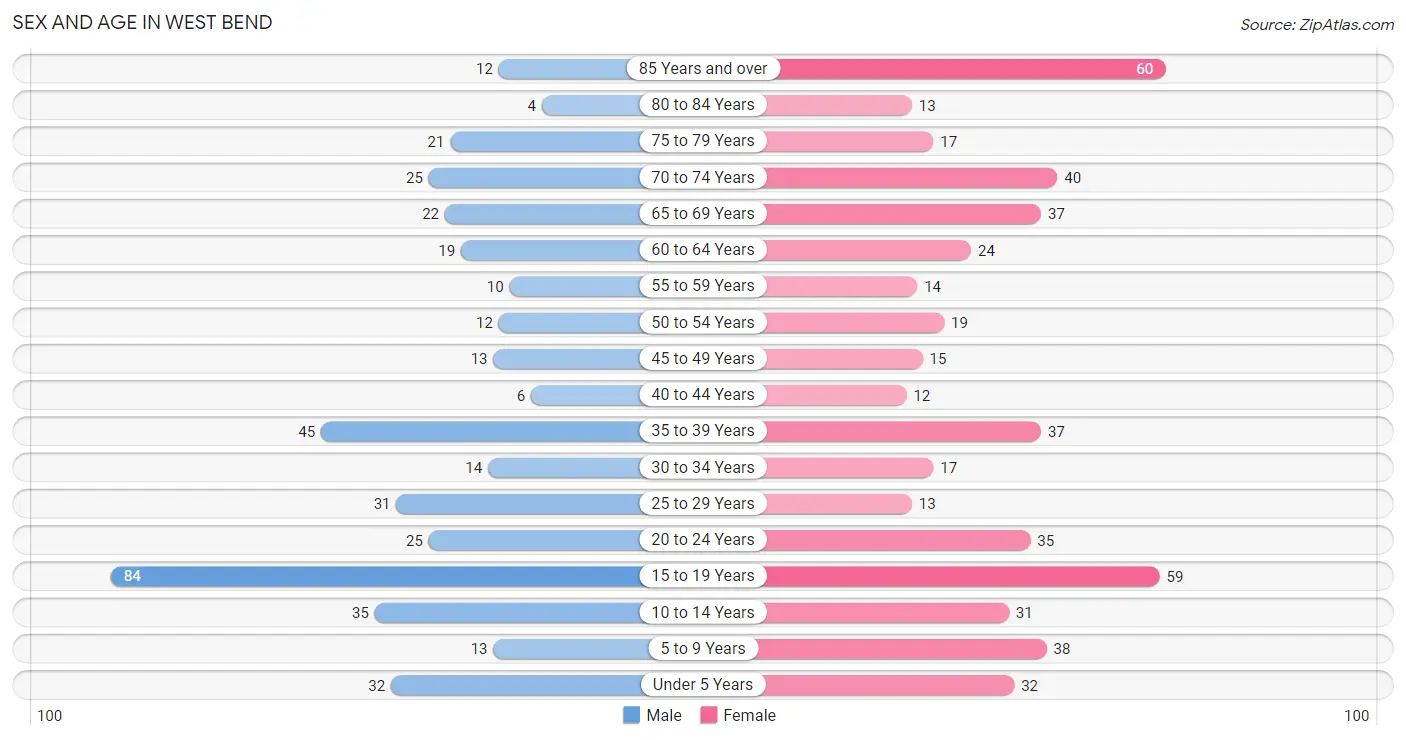
| Age Bracket | Male | Female |
| Under 5 Years | 32 (7.6%) | 32 (6.2%) |
| 5 to 9 Years | 13 (3.1%) | 38 (7.4%) |
| 10 to 14 Years | 35 (8.3%) | 31 (6.0%) |
| 15 to 19 Years | 84 (19.9%) | 59 (11.5%) |
| 20 to 24 Years | 25 (5.9%) | 35 (6.8%) |
| 25 to 29 Years | 31 (7.3%) | 13 (2.5%) |
| 30 to 34 Years | 14 (3.3%) | 17 (3.3%) |
| 35 to 39 Years | 45 (10.6%) | 37 (7.2%) |
| 40 to 44 Years | 6 (1.4%) | 12 (2.3%) |
| 45 to 49 Years | 13 (3.1%) | 15 (2.9%) |
| 50 to 54 Years | 12 (2.8%) | 19 (3.7%) |
| 55 to 59 Years | 10 (2.4%) | 14 (2.7%) |
| 60 to 64 Years | 19 (4.5%) | 24 (4.7%) |
| 65 to 69 Years | 22 (5.2%) | 37 (7.2%) |
| 70 to 74 Years | 25 (5.9%) | 40 (7.8%) |
| 75 to 79 Years | 21 (5.0%) | 17 (3.3%) |
| 80 to 84 Years | 4 (0.9%) | 13 (2.5%) |
| 85 Years and over | 12 (2.8%) | 60 (11.7%) |
| Total | 423 (100.0%) | 513 (100.0%) |
Families and Households in West Bend
Median Family Size in West Bend
The median family size in West Bend is 3.53 persons per family, with single female/mother families (12 | 5.5%) accounting for the largest median family size of 6.58 persons per family. On the other hand, single male/father families (5 | 2.3%) represent the smallest median family size with 2.00 persons per family.
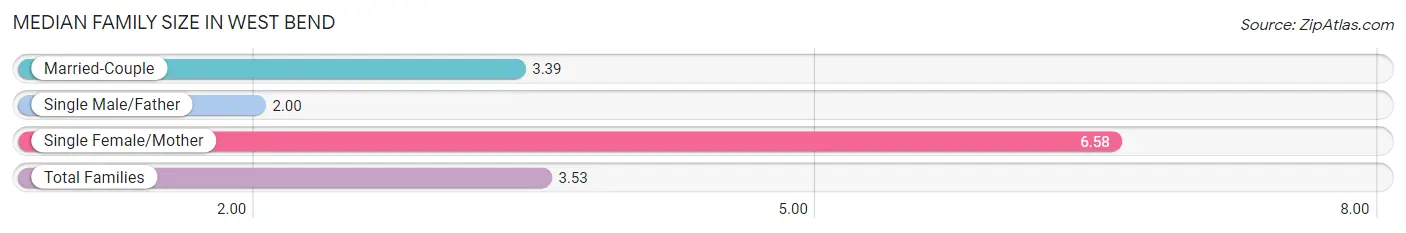
| Family Type | # Families | Family Size |
| Married-Couple | 200 (92.2%) | 3.39 |
| Single Male/Father | 5 (2.3%) | 2.00 |
| Single Female/Mother | 12 (5.5%) | 6.58 |
| Total Families | 217 (100.0%) | 3.53 |
Median Household Size in West Bend
The median household size in West Bend is 2.77 persons per household, with single female/mother households (12 | 3.7%) accounting for the largest median household size of 7.5 persons per household. non-family households (106 | 32.8%) represent the smallest median household size with 1.08 persons per household.
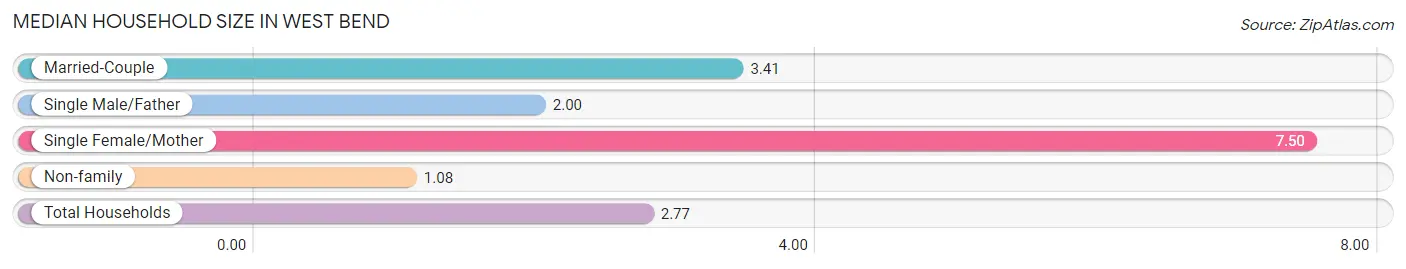
| Household Type | # Households | Household Size |
| Married-Couple | 200 (61.9%) | 3.41 |
| Single Male/Father | 5 (1.5%) | 2.00 |
| Single Female/Mother | 12 (3.7%) | 7.50 |
| Non-family | 106 (32.8%) | 1.08 |
| Total Households | 323 (100.0%) | 2.77 |
Household Size by Marriage Status in West Bend
Out of a total of 323 households in West Bend, 217 (67.2%) are family households, while 106 (32.8%) are nonfamily households. The most numerous type of family households are 2-person households, comprising 117, and the most common type of nonfamily households are 1-person households, comprising 100.
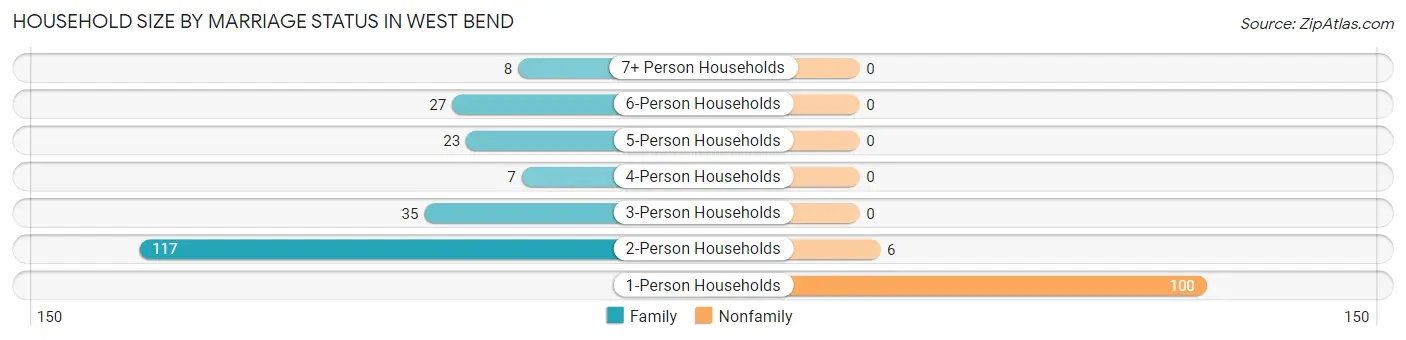
| Household Size | Family Households | Nonfamily Households |
| 1-Person Households | - | 100 (31.0%) |
| 2-Person Households | 117 (36.2%) | 6 (1.9%) |
| 3-Person Households | 35 (10.8%) | 0 (0.0%) |
| 4-Person Households | 7 (2.2%) | 0 (0.0%) |
| 5-Person Households | 23 (7.1%) | 0 (0.0%) |
| 6-Person Households | 27 (8.4%) | 0 (0.0%) |
| 7+ Person Households | 8 (2.5%) | 0 (0.0%) |
| Total | 217 (67.2%) | 106 (32.8%) |
Female Fertility in West Bend
Fertility by Age in West Bend
Average fertility rate in West Bend is 63.0 births per 1,000 women. Women in the age bracket of 20 to 34 years have the highest fertility rate with 108.0 births per 1,000 women. Women in the age bracket of 20 to 34 years acount for 58.3% of all women with births.
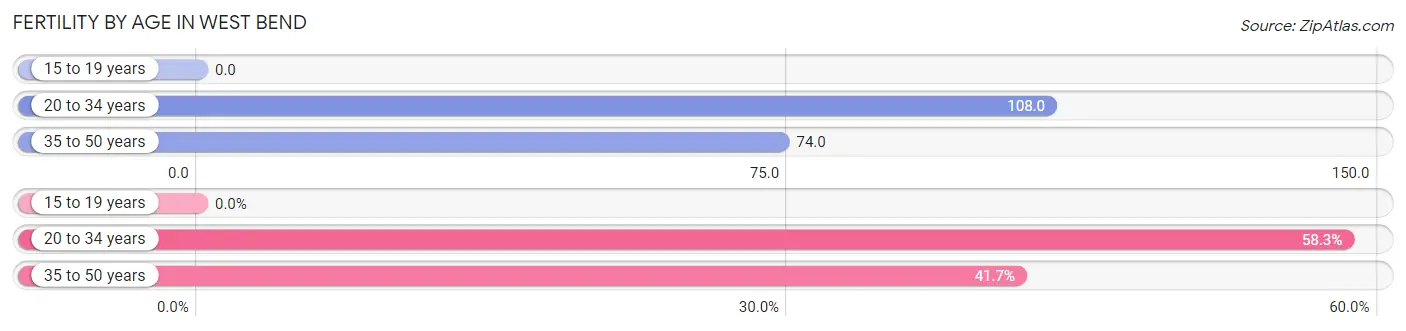
| Age Bracket | Women with Births | Births / 1,000 Women |
| 15 to 19 years | 0 (0.0%) | 0.0 |
| 20 to 34 years | 7 (58.3%) | 108.0 |
| 35 to 50 years | 5 (41.7%) | 74.0 |
| Total | 12 (100.0%) | 63.0 |
Fertility by Age by Marriage Status in West Bend
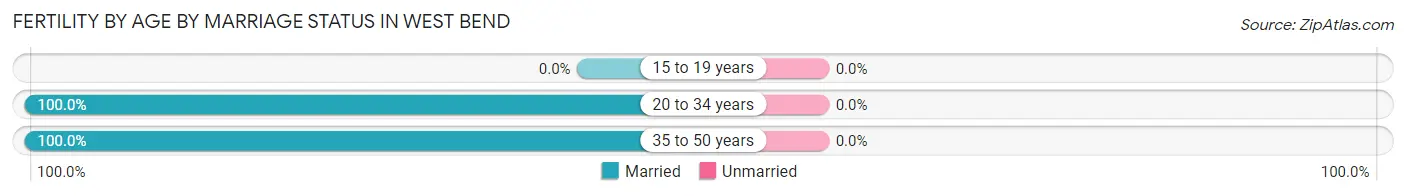
| Age Bracket | Married | Unmarried |
| 15 to 19 years | 0 (0.0%) | 0 (0.0%) |
| 20 to 34 years | 7 (100.0%) | 0 (0.0%) |
| 35 to 50 years | 5 (100.0%) | 0 (0.0%) |
| Total | 12 (100.0%) | 0 (0.0%) |
Fertility by Education in West Bend
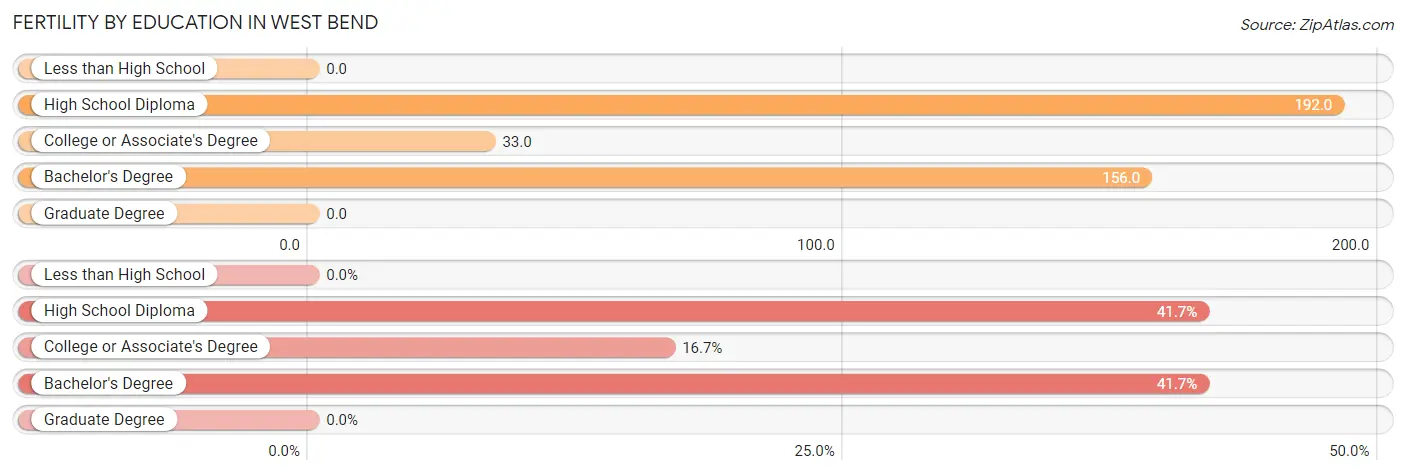
| Educational Attainment | Women with Births | Births / 1,000 Women |
| Less than High School | 0 (0.0%) | 0.0 |
| High School Diploma | 5 (41.7%) | 192.0 |
| College or Associate's Degree | 2 (16.7%) | 33.0 |
| Bachelor's Degree | 5 (41.7%) | 156.0 |
| Graduate Degree | 0 (0.0%) | 0.0 |
| Total | 12 (100.0%) | 63.0 |
Fertility by Education by Marriage Status in West Bend
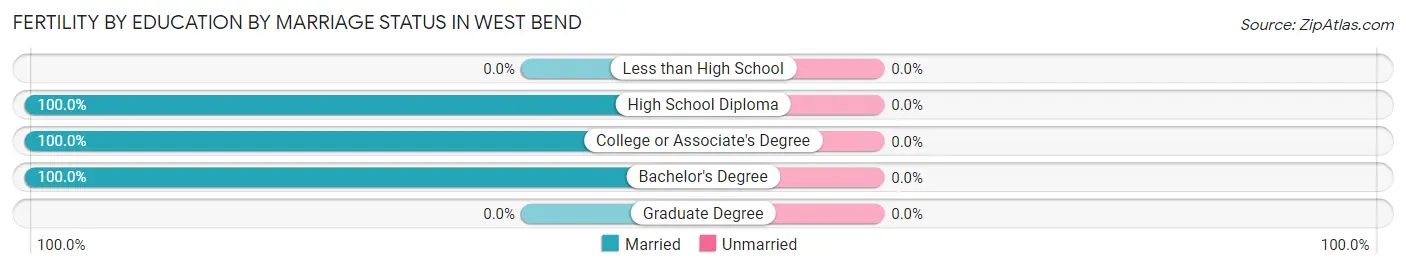
| Educational Attainment | Married | Unmarried |
| Less than High School | 0 (0.0%) | 0 (0.0%) |
| High School Diploma | 5 (100.0%) | 0 (0.0%) |
| College or Associate's Degree | 2 (100.0%) | 0 (0.0%) |
| Bachelor's Degree | 5 (100.0%) | 0 (0.0%) |
| Graduate Degree | 0 (0.0%) | 0 (0.0%) |
| Total | 12 (100.0%) | 0 (0.0%) |
Employment Characteristics in West Bend
Employment by Class of Employer in West Bend
Among the 389 employed individuals in West Bend, private company employees (290 | 74.6%), self-employed (not incorporated) (33 | 8.5%), and local government employees (19 | 4.9%) make up the most common classes of employment.
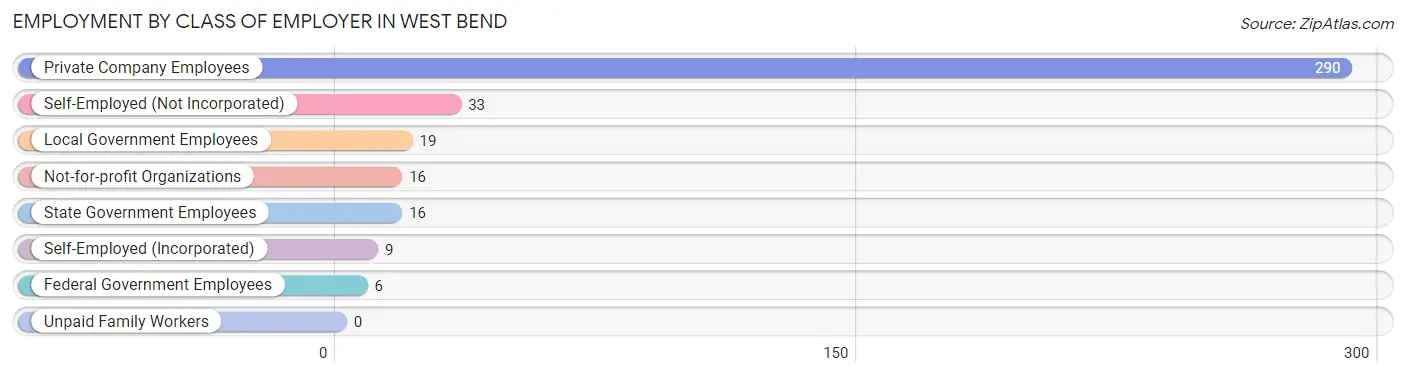
| Employer Class | # Employees | % Employees |
| Private Company Employees | 290 | 74.6% |
| Self-Employed (Incorporated) | 9 | 2.3% |
| Self-Employed (Not Incorporated) | 33 | 8.5% |
| Not-for-profit Organizations | 16 | 4.1% |
| Local Government Employees | 19 | 4.9% |
| State Government Employees | 16 | 4.1% |
| Federal Government Employees | 6 | 1.5% |
| Unpaid Family Workers | 0 | 0.0% |
| Total | 389 | 100.0% |
Employment Status by Age in West Bend
According to the labor force statistics for West Bend, out of the total population over 16 years of age (723), 58.2% or 421 individuals are in the labor force, with 4.0% or 17 of them unemployed. The age group with the highest labor force participation rate is 30 to 34 years, with 96.8% or 30 individuals in the labor force. Within the labor force, the 16 to 19 years age range has the highest percentage of unemployed individuals, with 23.1% or 15 of them being unemployed.
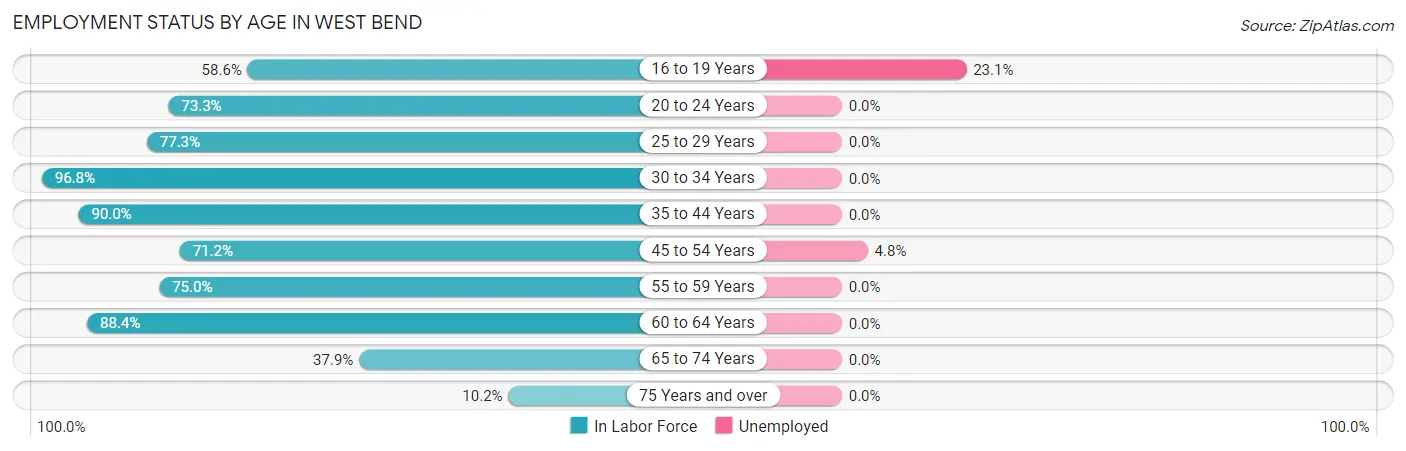
| Age Bracket | In Labor Force | Unemployed |
| 16 to 19 Years | 65 (58.6%) | 15 (23.1%) |
| 20 to 24 Years | 44 (73.3%) | 0 (0.0%) |
| 25 to 29 Years | 34 (77.3%) | 0 (0.0%) |
| 30 to 34 Years | 30 (96.8%) | 0 (0.0%) |
| 35 to 44 Years | 90 (90.0%) | 0 (0.0%) |
| 45 to 54 Years | 42 (71.2%) | 2 (4.8%) |
| 55 to 59 Years | 18 (75.0%) | 0 (0.0%) |
| 60 to 64 Years | 38 (88.4%) | 0 (0.0%) |
| 65 to 74 Years | 47 (37.9%) | 0 (0.0%) |
| 75 Years and over | 13 (10.2%) | 0 (0.0%) |
| Total | 421 (58.2%) | 17 (4.0%) |
Employment Status by Educational Attainment in West Bend
According to labor force statistics for West Bend, 83.7% of individuals (252) out of the total population between 25 and 64 years of age (301) are in the labor force, with 0.8% or 2 of them being unemployed. The group with the highest labor force participation rate are those with the educational attainment of less than high school, with 100.0% or 36 individuals in the labor force. Within the labor force, individuals with college / associate degree education have the highest percentage of unemployment, with 2.6% or 2 of them being unemployed.
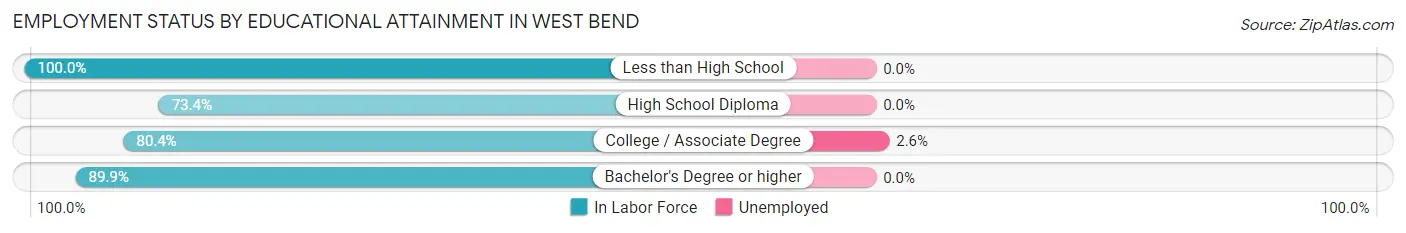
| Educational Attainment | In Labor Force | Unemployed |
| Less than High School | 36 (100.0%) | 0 (0.0%) |
| High School Diploma | 58 (73.4%) | 0 (0.0%) |
| College / Associate Degree | 78 (80.4%) | 3 (2.6%) |
| Bachelor's Degree or higher | 80 (89.9%) | 0 (0.0%) |
| Total | 252 (83.7%) | 2 (0.8%) |
Employment Occupations by Sex in West Bend
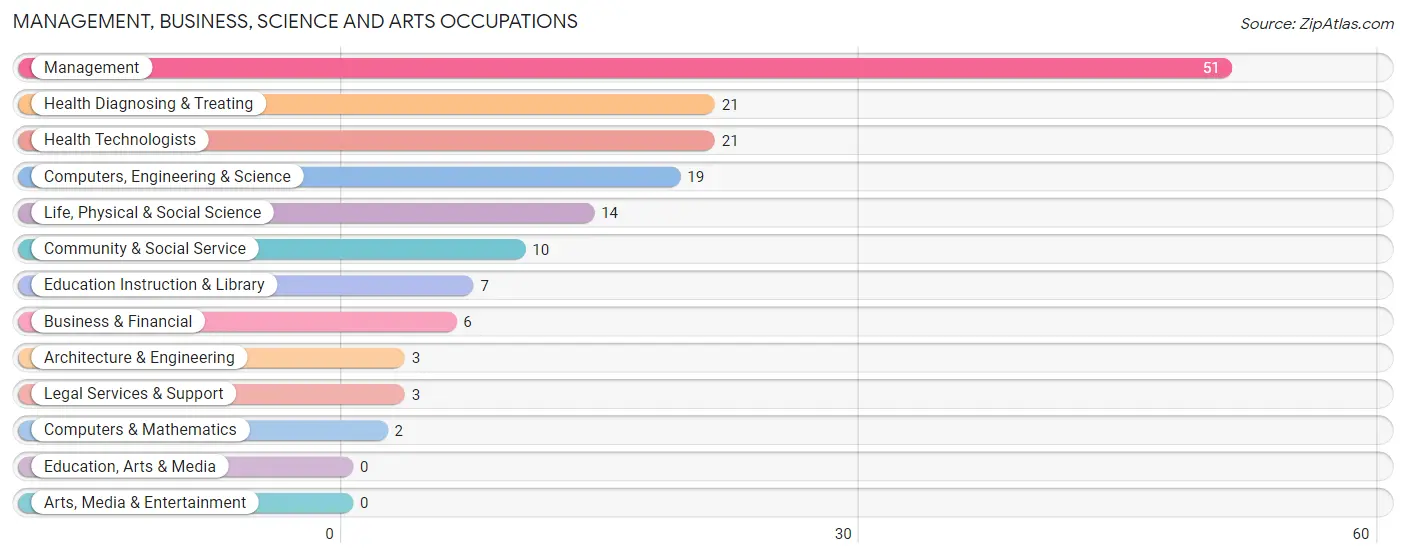
Management, Business, Science and Arts Occupations
The most common Management, Business, Science and Arts occupations in West Bend are Management (51 | 12.6%), Health Diagnosing & Treating (21 | 5.2%), Health Technologists (21 | 5.2%), Computers, Engineering & Science (19 | 4.7%), and Life, Physical & Social Science (14 | 3.5%).
Management, Business, Science and Arts Occupations by Sex
Within the Management, Business, Science and Arts occupations in West Bend, the most male-oriented occupations are Computers & Mathematics (100.0%), Legal Services & Support (100.0%), and Life, Physical & Social Science (92.9%), while the most female-oriented occupations are Health Diagnosing & Treating (100.0%), Health Technologists (100.0%), and Business & Financial (83.3%).
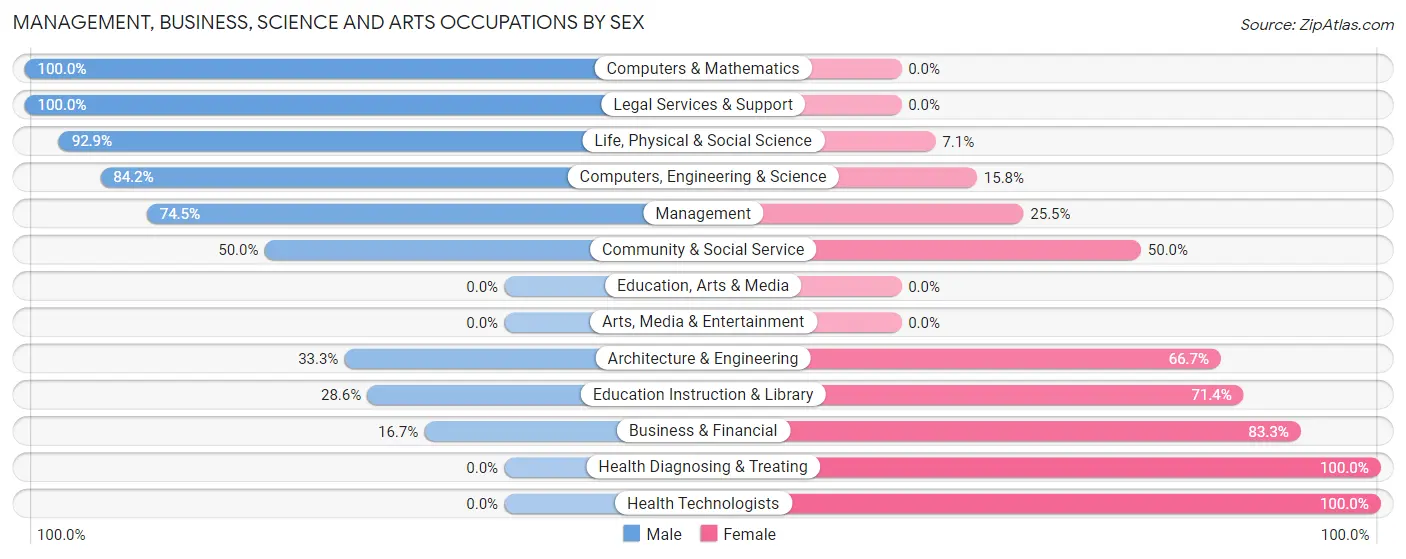
| Occupation | Male | Female |
| Management | 38 (74.5%) | 13 (25.5%) |
| Business & Financial | 1 (16.7%) | 5 (83.3%) |
| Computers, Engineering & Science | 16 (84.2%) | 3 (15.8%) |
| Computers & Mathematics | 2 (100.0%) | 0 (0.0%) |
| Architecture & Engineering | 1 (33.3%) | 2 (66.7%) |
| Life, Physical & Social Science | 13 (92.9%) | 1 (7.1%) |
| Community & Social Service | 5 (50.0%) | 5 (50.0%) |
| Education, Arts & Media | 0 (0.0%) | 0 (0.0%) |
| Legal Services & Support | 3 (100.0%) | 0 (0.0%) |
| Education Instruction & Library | 2 (28.6%) | 5 (71.4%) |
| Arts, Media & Entertainment | 0 (0.0%) | 0 (0.0%) |
| Health Diagnosing & Treating | 0 (0.0%) | 21 (100.0%) |
| Health Technologists | 0 (0.0%) | 21 (100.0%) |
| Total (Category) | 60 (56.1%) | 47 (43.9%) |
| Total (Overall) | 209 (51.7%) | 195 (48.3%) |
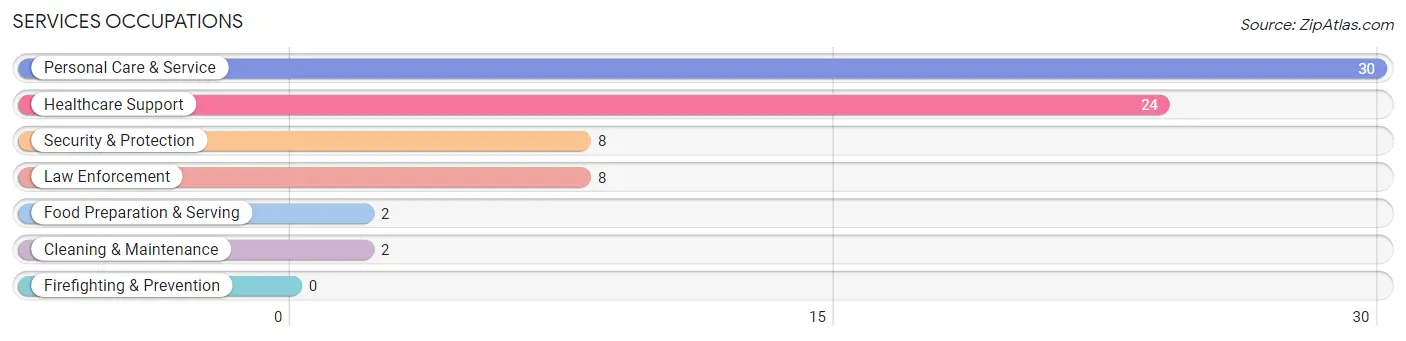
Services Occupations
The most common Services occupations in West Bend are Personal Care & Service (30 | 7.4%), Healthcare Support (24 | 5.9%), Security & Protection (8 | 2.0%), Law Enforcement (8 | 2.0%), and Food Preparation & Serving (2 | 0.5%).
Services Occupations by Sex
Within the Services occupations in West Bend, the most male-oriented occupations are Security & Protection (100.0%), Law Enforcement (100.0%), and Personal Care & Service (46.7%), while the most female-oriented occupations are Healthcare Support (100.0%), Food Preparation & Serving (100.0%), and Cleaning & Maintenance (100.0%).
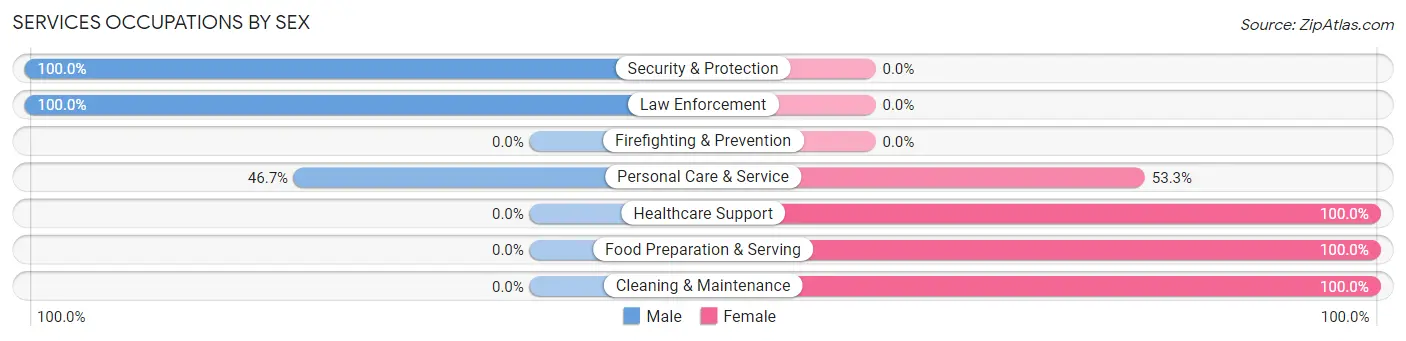
| Occupation | Male | Female |
| Healthcare Support | 0 (0.0%) | 24 (100.0%) |
| Security & Protection | 8 (100.0%) | 0 (0.0%) |
| Firefighting & Prevention | 0 (0.0%) | 0 (0.0%) |
| Law Enforcement | 8 (100.0%) | 0 (0.0%) |
| Food Preparation & Serving | 0 (0.0%) | 2 (100.0%) |
| Cleaning & Maintenance | 0 (0.0%) | 2 (100.0%) |
| Personal Care & Service | 14 (46.7%) | 16 (53.3%) |
| Total (Category) | 22 (33.3%) | 44 (66.7%) |
| Total (Overall) | 209 (51.7%) | 195 (48.3%) |
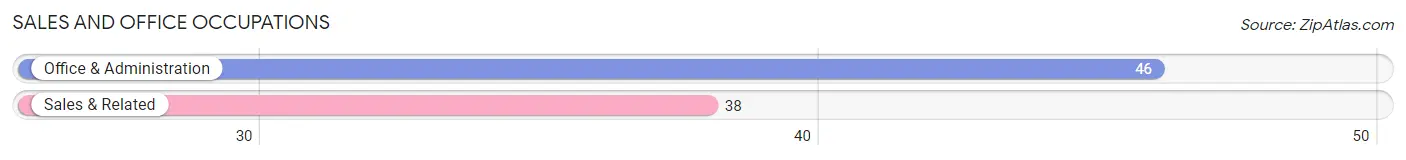
Sales and Office Occupations
The most common Sales and Office occupations in West Bend are Office & Administration (46 | 11.4%), and Sales & Related (38 | 9.4%).
Sales and Office Occupations by Sex
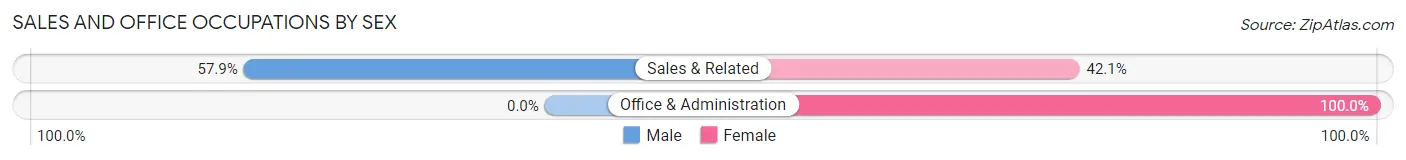
| Occupation | Male | Female |
| Sales & Related | 22 (57.9%) | 16 (42.1%) |
| Office & Administration | 0 (0.0%) | 46 (100.0%) |
| Total (Category) | 22 (26.2%) | 62 (73.8%) |
| Total (Overall) | 209 (51.7%) | 195 (48.3%) |
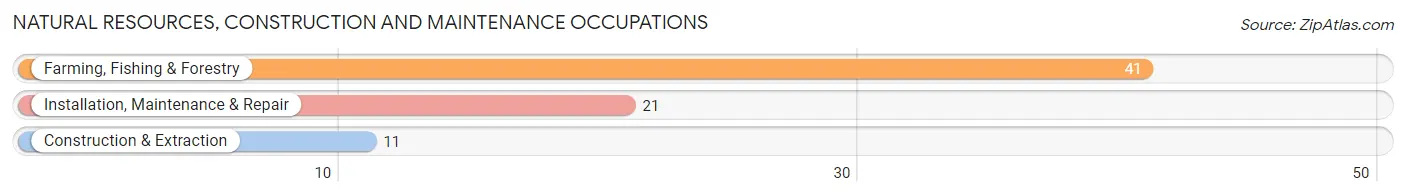
Natural Resources, Construction and Maintenance Occupations
The most common Natural Resources, Construction and Maintenance occupations in West Bend are Farming, Fishing & Forestry (41 | 10.2%), Installation, Maintenance & Repair (21 | 5.2%), and Construction & Extraction (11 | 2.7%).
Natural Resources, Construction and Maintenance Occupations by Sex
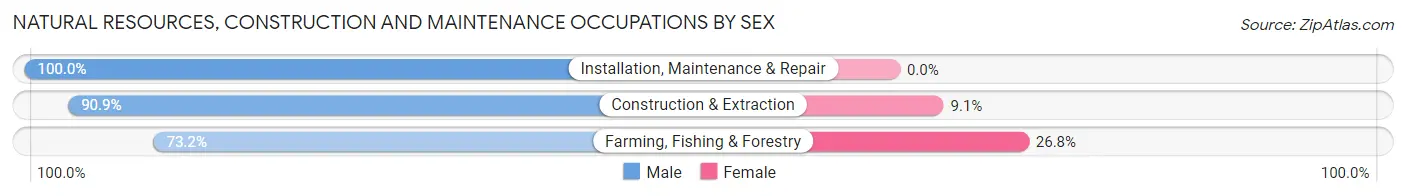
| Occupation | Male | Female |
| Farming, Fishing & Forestry | 30 (73.2%) | 11 (26.8%) |
| Construction & Extraction | 10 (90.9%) | 1 (9.1%) |
| Installation, Maintenance & Repair | 21 (100.0%) | 0 (0.0%) |
| Total (Category) | 61 (83.6%) | 12 (16.4%) |
| Total (Overall) | 209 (51.7%) | 195 (48.3%) |
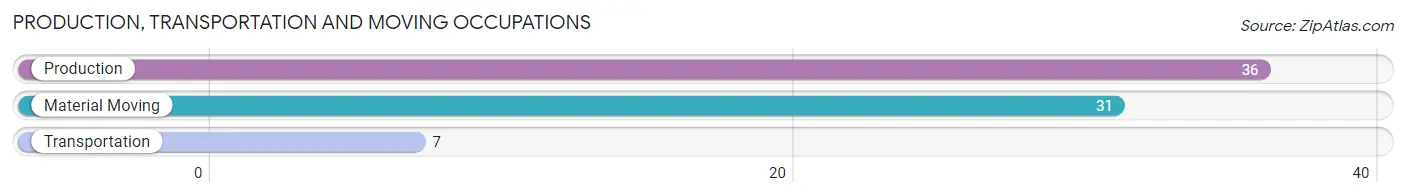
Production, Transportation and Moving Occupations
The most common Production, Transportation and Moving occupations in West Bend are Production (36 | 8.9%), Material Moving (31 | 7.7%), and Transportation (7 | 1.7%).
Production, Transportation and Moving Occupations by Sex
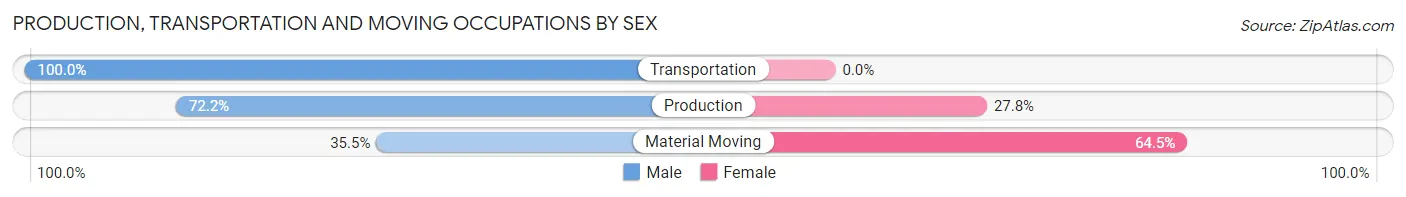
| Occupation | Male | Female |
| Production | 26 (72.2%) | 10 (27.8%) |
| Transportation | 7 (100.0%) | 0 (0.0%) |
| Material Moving | 11 (35.5%) | 20 (64.5%) |
| Total (Category) | 44 (59.5%) | 30 (40.5%) |
| Total (Overall) | 209 (51.7%) | 195 (48.3%) |
Employment Industries by Sex in West Bend
Employment Industries in West Bend
The major employment industries in West Bend include Agriculture, Fishing & Hunting (87 | 21.5%), Retail Trade (64 | 15.8%), Health Care & Social Assistance (59 | 14.6%), Manufacturing (37 | 9.2%), and Wholesale Trade (29 | 7.2%).
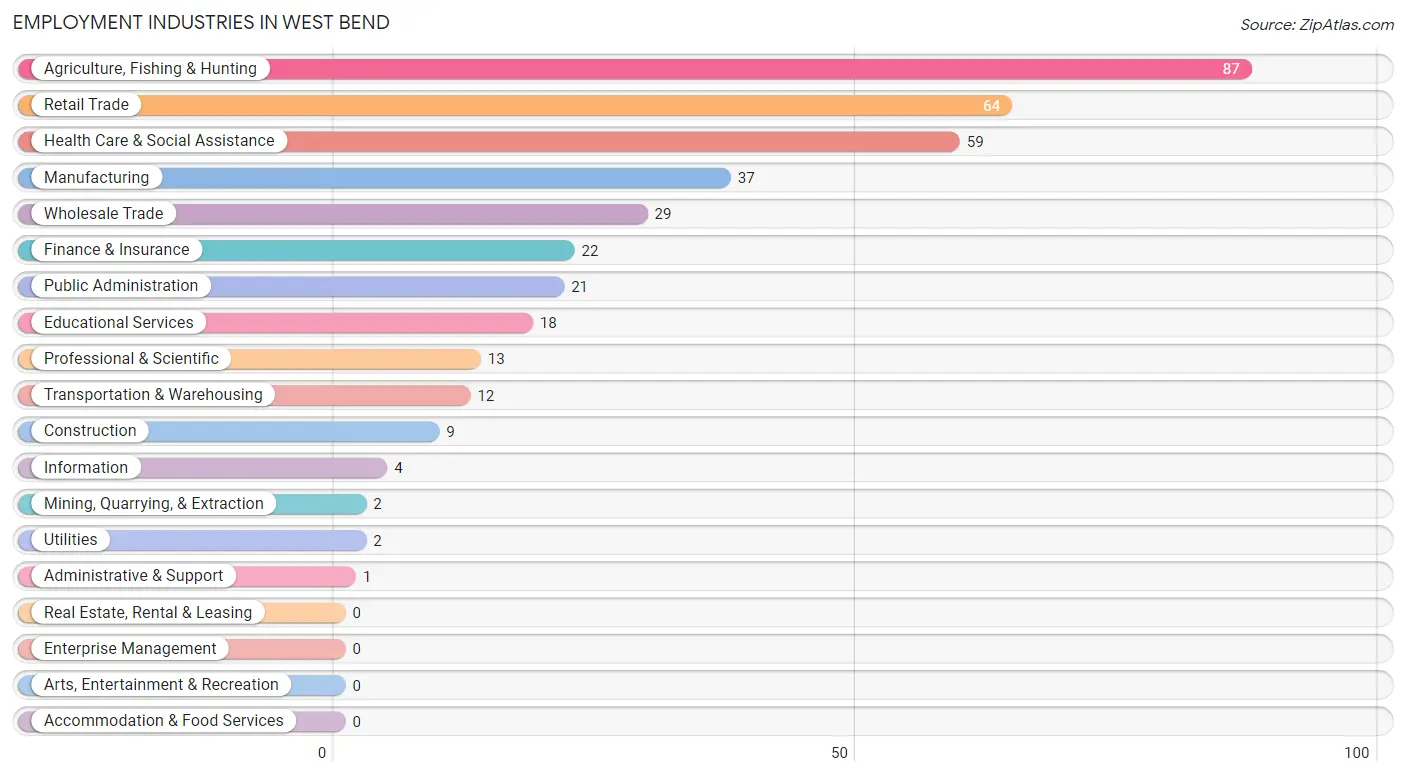
Employment Industries by Sex in West Bend
The West Bend industries that see more men than women are Mining, Quarrying, & Extraction (100.0%), Utilities (100.0%), and Public Administration (100.0%), whereas the industries that tend to have a higher number of women are Finance & Insurance (100.0%), Administrative & Support (100.0%), and Health Care & Social Assistance (100.0%).
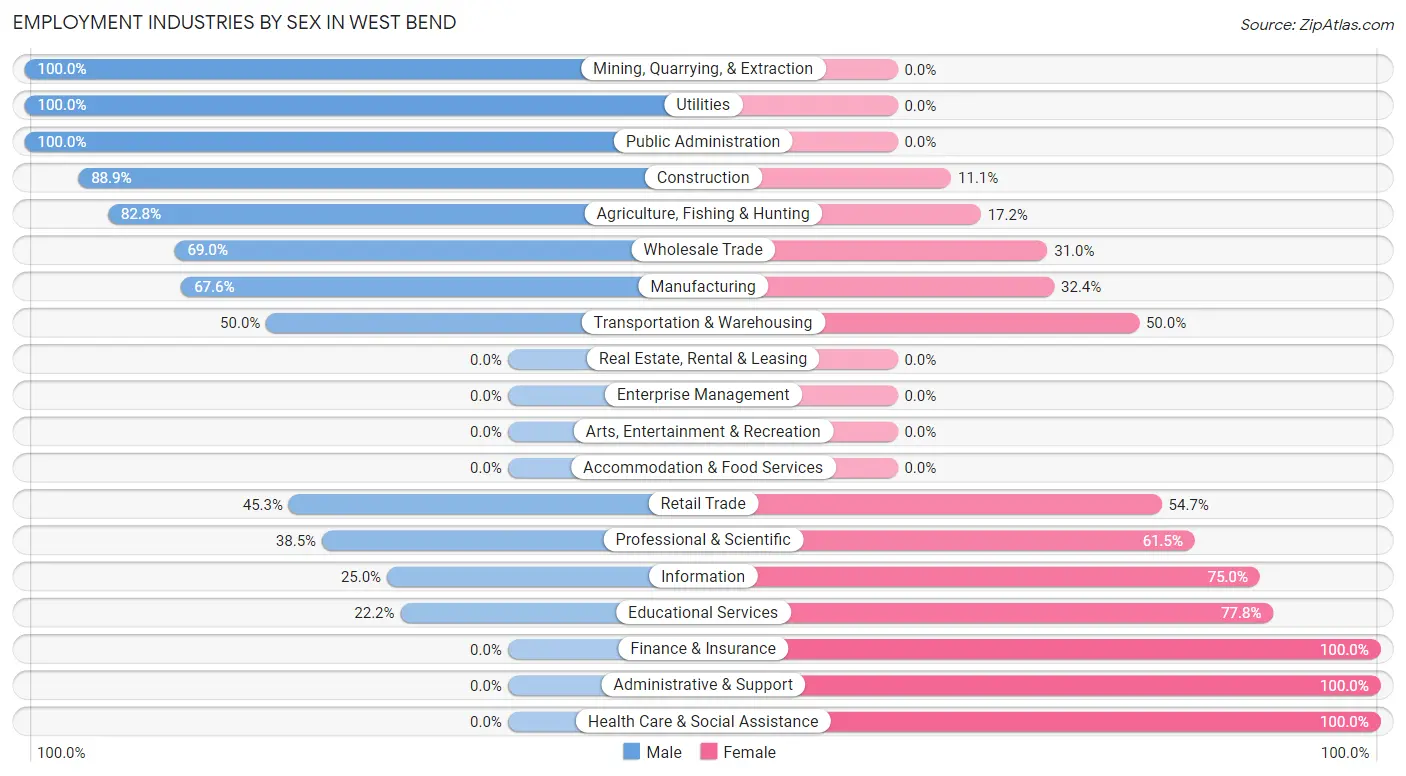
| Industry | Male | Female |
| Agriculture, Fishing & Hunting | 72 (82.8%) | 15 (17.2%) |
| Mining, Quarrying, & Extraction | 2 (100.0%) | 0 (0.0%) |
| Construction | 8 (88.9%) | 1 (11.1%) |
| Manufacturing | 25 (67.6%) | 12 (32.4%) |
| Wholesale Trade | 20 (69.0%) | 9 (31.0%) |
| Retail Trade | 29 (45.3%) | 35 (54.7%) |
| Transportation & Warehousing | 6 (50.0%) | 6 (50.0%) |
| Utilities | 2 (100.0%) | 0 (0.0%) |
| Information | 1 (25.0%) | 3 (75.0%) |
| Finance & Insurance | 0 (0.0%) | 22 (100.0%) |
| Real Estate, Rental & Leasing | 0 (0.0%) | 0 (0.0%) |
| Professional & Scientific | 5 (38.5%) | 8 (61.5%) |
| Enterprise Management | 0 (0.0%) | 0 (0.0%) |
| Administrative & Support | 0 (0.0%) | 1 (100.0%) |
| Educational Services | 4 (22.2%) | 14 (77.8%) |
| Health Care & Social Assistance | 0 (0.0%) | 59 (100.0%) |
| Arts, Entertainment & Recreation | 0 (0.0%) | 0 (0.0%) |
| Accommodation & Food Services | 0 (0.0%) | 0 (0.0%) |
| Public Administration | 21 (100.0%) | 0 (0.0%) |
| Total | 209 (51.7%) | 195 (48.3%) |
Education in West Bend
School Enrollment in West Bend
The most common levels of schooling among the 245 students in West Bend are high school (98 | 40.0%), middle school (64 | 26.1%), and elementary school (24 | 9.8%).
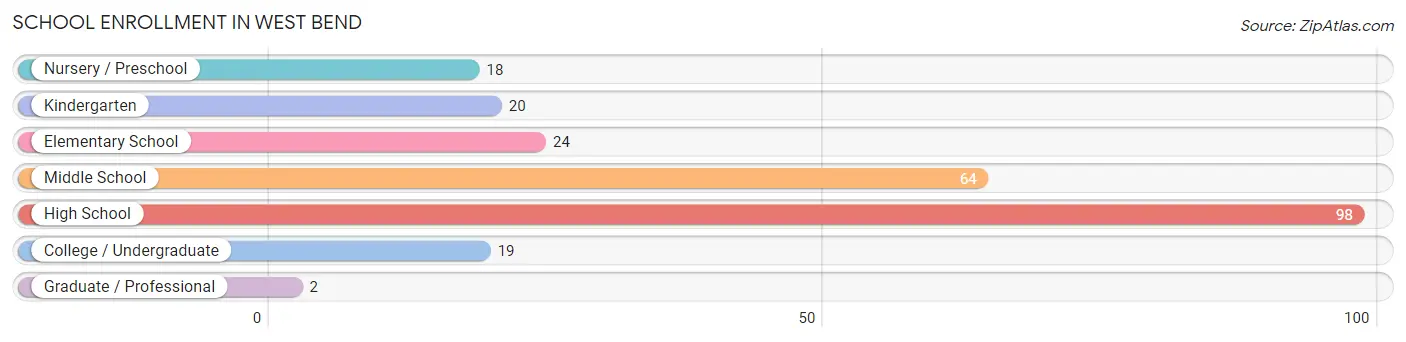
| School Level | # Students | % Students |
| Nursery / Preschool | 18 | 7.3% |
| Kindergarten | 20 | 8.2% |
| Elementary School | 24 | 9.8% |
| Middle School | 64 | 26.1% |
| High School | 98 | 40.0% |
| College / Undergraduate | 19 | 7.8% |
| Graduate / Professional | 2 | 0.8% |
| Total | 245 | 100.0% |
School Enrollment by Age by Funding Source in West Bend
Out of a total of 245 students who are enrolled in schools in West Bend, 7 (2.9%) attend a private institution, while the remaining 238 (97.1%) are enrolled in public schools. The age group of 35 years and over has the highest likelihood of being enrolled in private schools, with 2 (50.0% in the age bracket) enrolled. Conversely, the age group of 3 to 4 year olds has the lowest likelihood of being enrolled in a private school, with 18 (100.0% in the age bracket) attending a public institution.
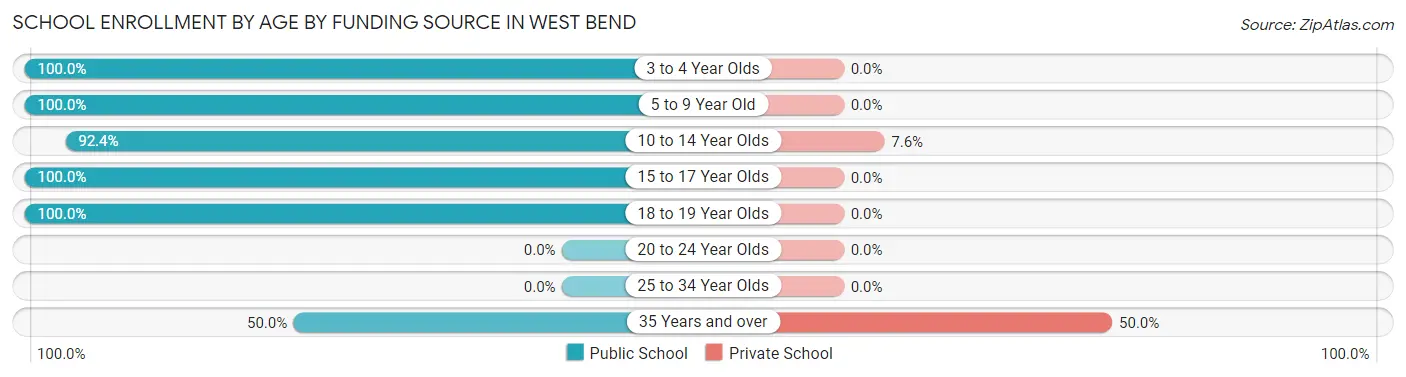
| Age Bracket | Public School | Private School |
| 3 to 4 Year Olds | 18 (100.0%) | 0 (0.0%) |
| 5 to 9 Year Old | 39 (100.0%) | 0 (0.0%) |
| 10 to 14 Year Olds | 61 (92.4%) | 5 (7.6%) |
| 15 to 17 Year Olds | 94 (100.0%) | 0 (0.0%) |
| 18 to 19 Year Olds | 24 (100.0%) | 0 (0.0%) |
| 20 to 24 Year Olds | 0 (0.0%) | 0 (0.0%) |
| 25 to 34 Year Olds | 0 (0.0%) | 0 (0.0%) |
| 35 Years and over | 2 (50.0%) | 2 (50.0%) |
| Total | 238 (97.1%) | 7 (2.9%) |
Educational Attainment by Field of Study in West Bend
Science & technology (28 | 21.9%), business (22 | 17.2%), education (22 | 17.2%), bio, nature & agricultural (20 | 15.6%), and arts & humanities (15 | 11.7%) are the most common fields of study among 128 individuals in West Bend who have obtained a bachelor's degree or higher.
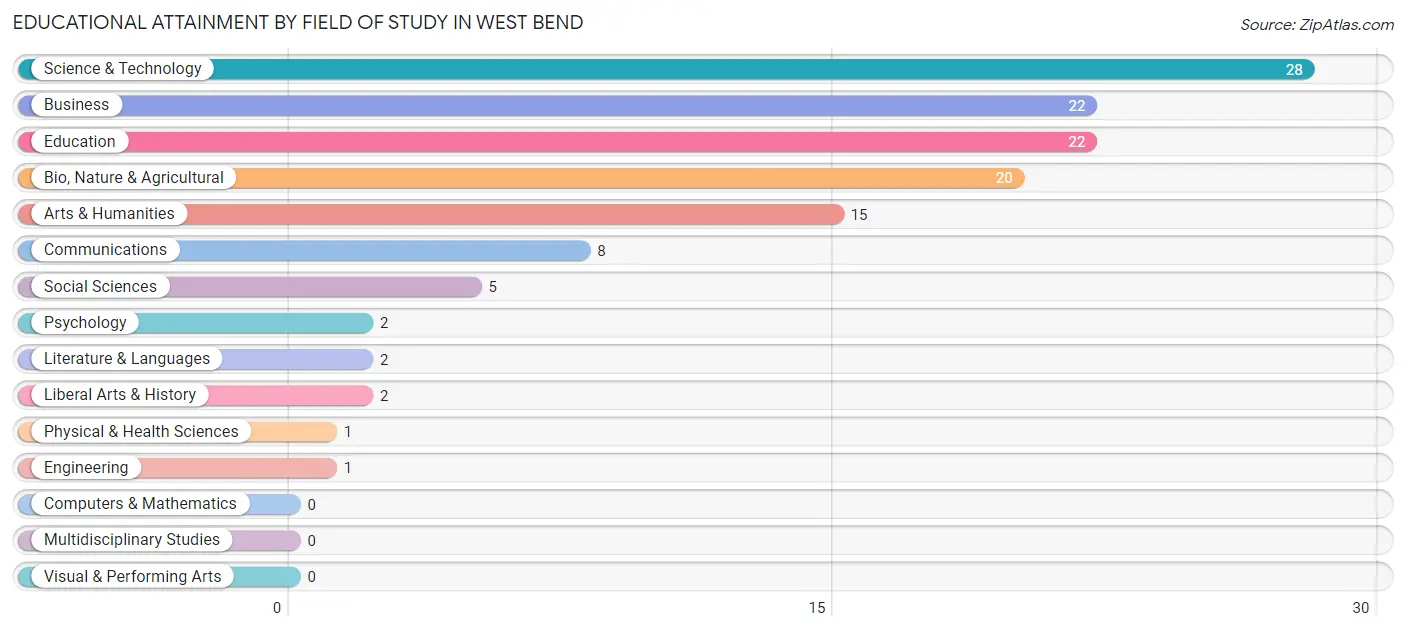
| Field of Study | # Graduates | % Graduates |
| Computers & Mathematics | 0 | 0.0% |
| Bio, Nature & Agricultural | 20 | 15.6% |
| Physical & Health Sciences | 1 | 0.8% |
| Psychology | 2 | 1.6% |
| Social Sciences | 5 | 3.9% |
| Engineering | 1 | 0.8% |
| Multidisciplinary Studies | 0 | 0.0% |
| Science & Technology | 28 | 21.9% |
| Business | 22 | 17.2% |
| Education | 22 | 17.2% |
| Literature & Languages | 2 | 1.6% |
| Liberal Arts & History | 2 | 1.6% |
| Visual & Performing Arts | 0 | 0.0% |
| Communications | 8 | 6.2% |
| Arts & Humanities | 15 | 11.7% |
| Total | 128 | 100.0% |
Transportation & Commute in West Bend
Vehicle Availability by Sex in West Bend
The most prevalent vehicle ownership categories in West Bend are males with 2 vehicles (78, accounting for 39.2%) and females with 2 vehicles (61, making up 41.0%).
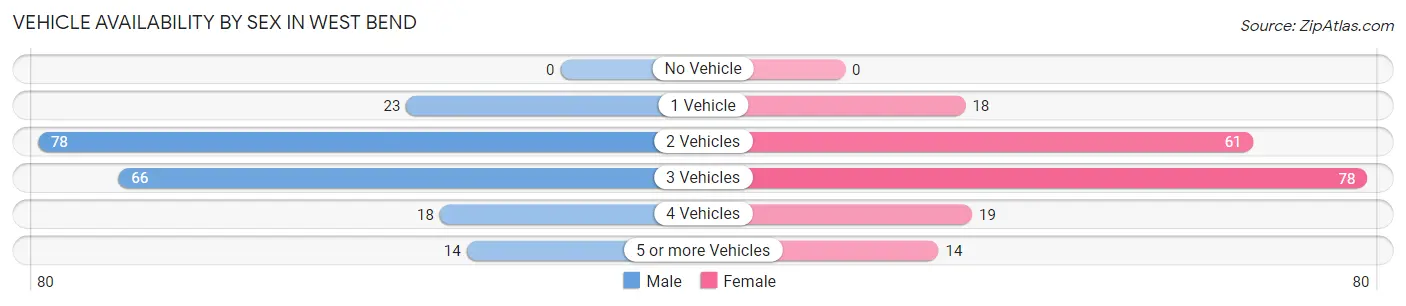
| Vehicles Available | Male | Female |
| No Vehicle | 0 (0.0%) | 0 (0.0%) |
| 1 Vehicle | 23 (11.6%) | 18 (9.5%) |
| 2 Vehicles | 78 (39.2%) | 61 (32.1%) |
| 3 Vehicles | 66 (33.2%) | 78 (41.0%) |
| 4 Vehicles | 18 (9.0%) | 19 (10.0%) |
| 5 or more Vehicles | 14 (7.0%) | 14 (7.4%) |
| Total | 199 (100.0%) | 190 (100.0%) |
Commute Time in West Bend
The most frequently occuring commute durations in West Bend are 5 to 9 minutes (146 commuters, 38.2%), less than 5 minutes (104 commuters, 27.2%), and 20 to 24 minutes (34 commuters, 8.9%).
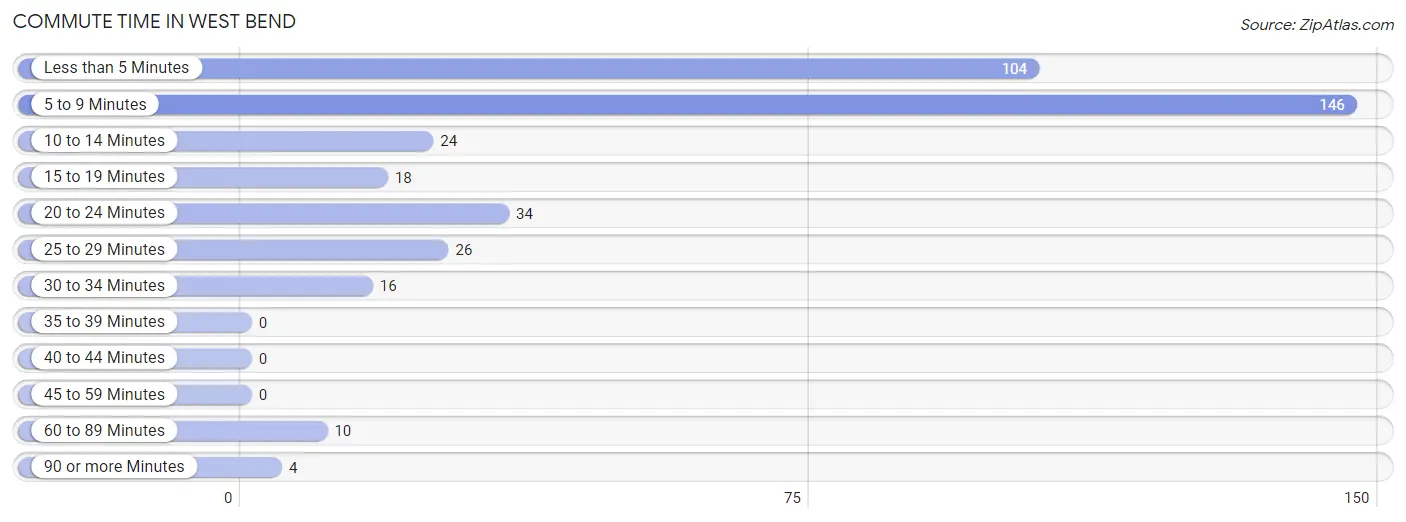
| Commute Time | # Commuters | % Commuters |
| Less than 5 Minutes | 104 | 27.2% |
| 5 to 9 Minutes | 146 | 38.2% |
| 10 to 14 Minutes | 24 | 6.3% |
| 15 to 19 Minutes | 18 | 4.7% |
| 20 to 24 Minutes | 34 | 8.9% |
| 25 to 29 Minutes | 26 | 6.8% |
| 30 to 34 Minutes | 16 | 4.2% |
| 35 to 39 Minutes | 0 | 0.0% |
| 40 to 44 Minutes | 0 | 0.0% |
| 45 to 59 Minutes | 0 | 0.0% |
| 60 to 89 Minutes | 10 | 2.6% |
| 90 or more Minutes | 4 | 1.1% |
Commute Time by Sex in West Bend
The most common commute times in West Bend are 5 to 9 minutes (74 commuters, 37.8%) for males and 5 to 9 minutes (72 commuters, 38.7%) for females.
| Commute Time | Male | Female |
| Less than 5 Minutes | 53 (27.0%) | 51 (27.4%) |
| 5 to 9 Minutes | 74 (37.8%) | 72 (38.7%) |
| 10 to 14 Minutes | 18 (9.2%) | 6 (3.2%) |
| 15 to 19 Minutes | 9 (4.6%) | 9 (4.8%) |
| 20 to 24 Minutes | 16 (8.2%) | 18 (9.7%) |
| 25 to 29 Minutes | 8 (4.1%) | 18 (9.7%) |
| 30 to 34 Minutes | 12 (6.1%) | 4 (2.1%) |
| 35 to 39 Minutes | 0 (0.0%) | 0 (0.0%) |
| 40 to 44 Minutes | 0 (0.0%) | 0 (0.0%) |
| 45 to 59 Minutes | 0 (0.0%) | 0 (0.0%) |
| 60 to 89 Minutes | 2 (1.0%) | 8 (4.3%) |
| 90 or more Minutes | 4 (2.0%) | 0 (0.0%) |
Time of Departure to Work by Sex in West Bend
The most frequent times of departure to work in West Bend are 5:00 AM to 5:29 AM (44, 22.5%) for males and 12:00 PM to 3:59 PM (29, 15.6%) for females.
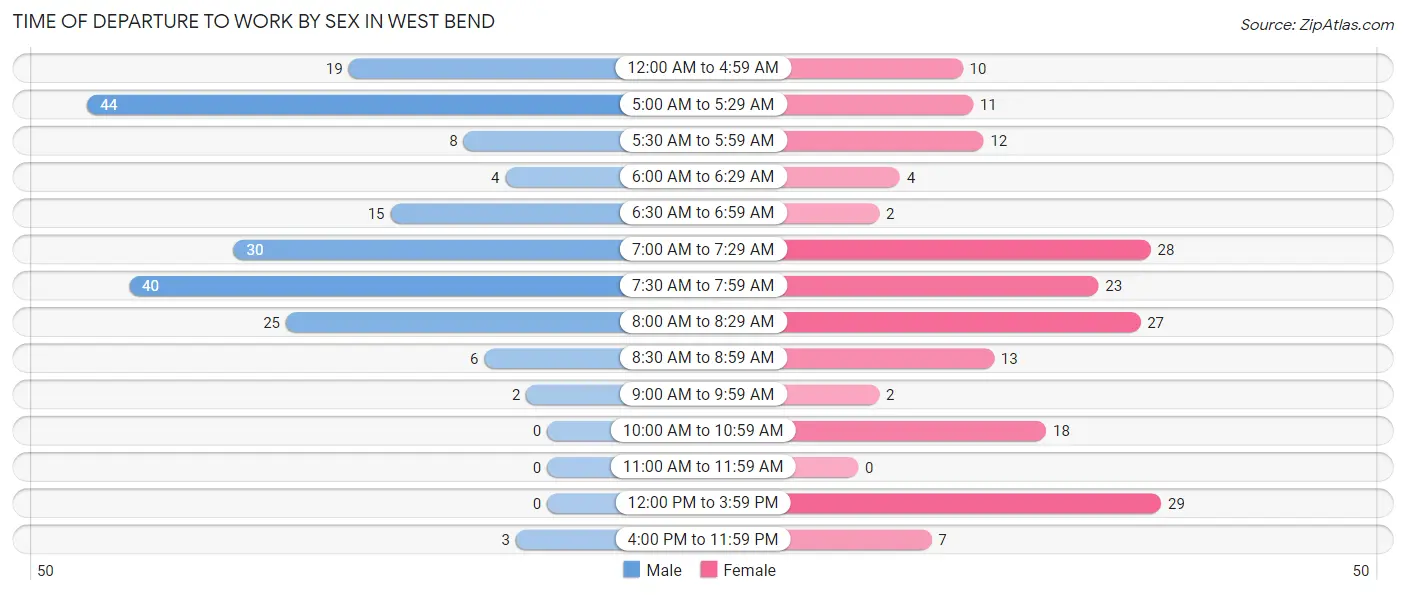
| Time of Departure | Male | Female |
| 12:00 AM to 4:59 AM | 19 (9.7%) | 10 (5.4%) |
| 5:00 AM to 5:29 AM | 44 (22.5%) | 11 (5.9%) |
| 5:30 AM to 5:59 AM | 8 (4.1%) | 12 (6.5%) |
| 6:00 AM to 6:29 AM | 4 (2.0%) | 4 (2.1%) |
| 6:30 AM to 6:59 AM | 15 (7.6%) | 2 (1.1%) |
| 7:00 AM to 7:29 AM | 30 (15.3%) | 28 (15.0%) |
| 7:30 AM to 7:59 AM | 40 (20.4%) | 23 (12.4%) |
| 8:00 AM to 8:29 AM | 25 (12.8%) | 27 (14.5%) |
| 8:30 AM to 8:59 AM | 6 (3.1%) | 13 (7.0%) |
| 9:00 AM to 9:59 AM | 2 (1.0%) | 2 (1.1%) |
| 10:00 AM to 10:59 AM | 0 (0.0%) | 18 (9.7%) |
| 11:00 AM to 11:59 AM | 0 (0.0%) | 0 (0.0%) |
| 12:00 PM to 3:59 PM | 0 (0.0%) | 29 (15.6%) |
| 4:00 PM to 11:59 PM | 3 (1.5%) | 7 (3.8%) |
| Total | 196 (100.0%) | 186 (100.0%) |
Housing Occupancy in West Bend
Occupancy by Ownership in West Bend
Of the total 323 dwellings in West Bend, owner-occupied units account for 262 (81.1%), while renter-occupied units make up 61 (18.9%).
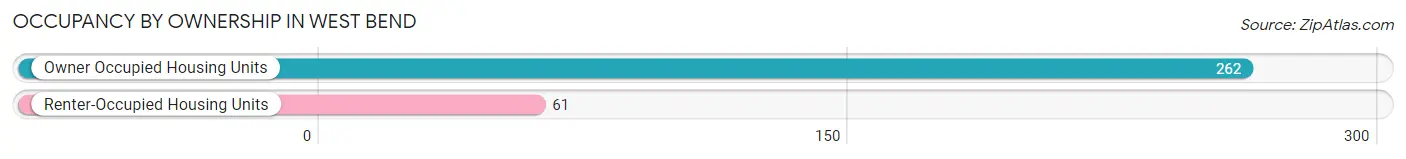
| Occupancy | # Housing Units | % Housing Units |
| Owner Occupied Housing Units | 262 | 81.1% |
| Renter-Occupied Housing Units | 61 | 18.9% |
| Total Occupied Housing Units | 323 | 100.0% |
Occupancy by Household Size in West Bend
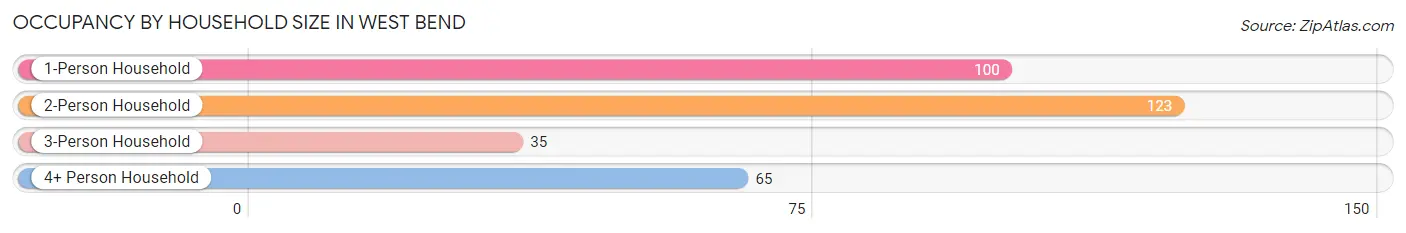
| Household Size | # Housing Units | % Housing Units |
| 1-Person Household | 100 | 31.0% |
| 2-Person Household | 123 | 38.1% |
| 3-Person Household | 35 | 10.8% |
| 4+ Person Household | 65 | 20.1% |
| Total Housing Units | 323 | 100.0% |
Occupancy by Ownership by Household Size in West Bend
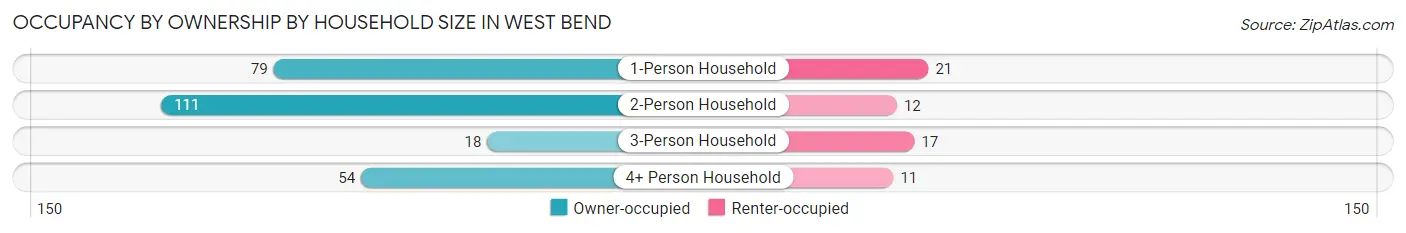
| Household Size | Owner-occupied | Renter-occupied |
| 1-Person Household | 79 (79.0%) | 21 (21.0%) |
| 2-Person Household | 111 (90.2%) | 12 (9.8%) |
| 3-Person Household | 18 (51.4%) | 17 (48.6%) |
| 4+ Person Household | 54 (83.1%) | 11 (16.9%) |
| Total Housing Units | 262 (81.1%) | 61 (18.9%) |
Occupancy by Educational Attainment in West Bend
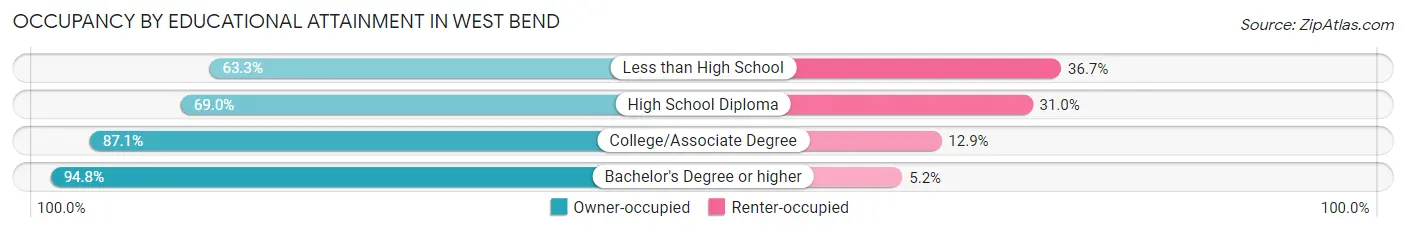
| Household Size | Owner-occupied | Renter-occupied |
| Less than High School | 19 (63.3%) | 11 (36.7%) |
| High School Diploma | 69 (69.0%) | 31 (31.0%) |
| College/Associate Degree | 101 (87.1%) | 15 (12.9%) |
| Bachelor's Degree or higher | 73 (94.8%) | 4 (5.2%) |
Occupancy by Age of Householder in West Bend
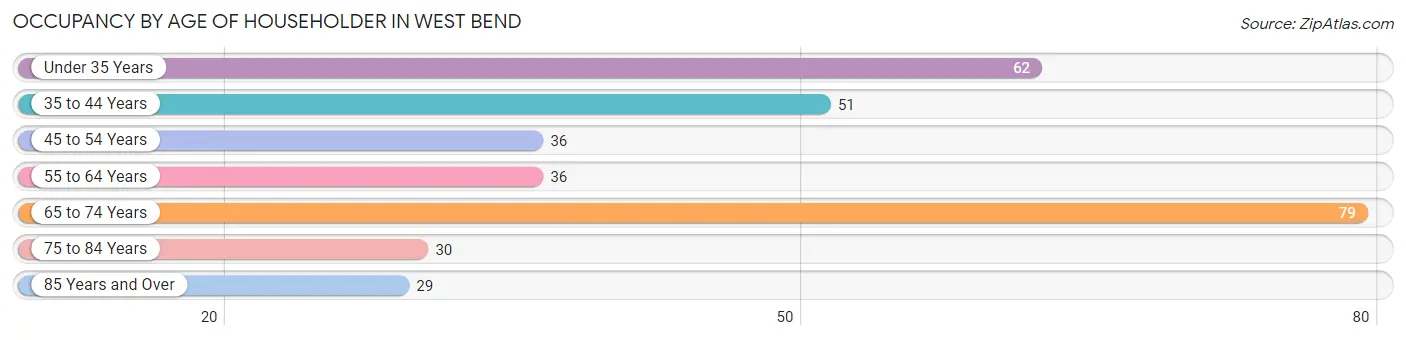
| Age Bracket | # Households | % Households |
| Under 35 Years | 62 | 19.2% |
| 35 to 44 Years | 51 | 15.8% |
| 45 to 54 Years | 36 | 11.2% |
| 55 to 64 Years | 36 | 11.2% |
| 65 to 74 Years | 79 | 24.5% |
| 75 to 84 Years | 30 | 9.3% |
| 85 Years and Over | 29 | 9.0% |
| Total | 323 | 100.0% |
Housing Finances in West Bend
Median Income by Occupancy in West Bend
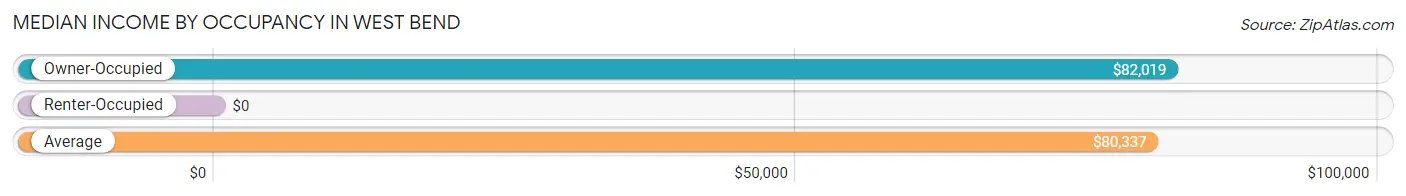
| Occupancy Type | # Households | Median Income |
| Owner-Occupied | 262 (81.1%) | $82,019 |
| Renter-Occupied | 61 (18.9%) | $0 |
| Average | 323 (100.0%) | $80,337 |
Occupancy by Householder Income Bracket in West Bend
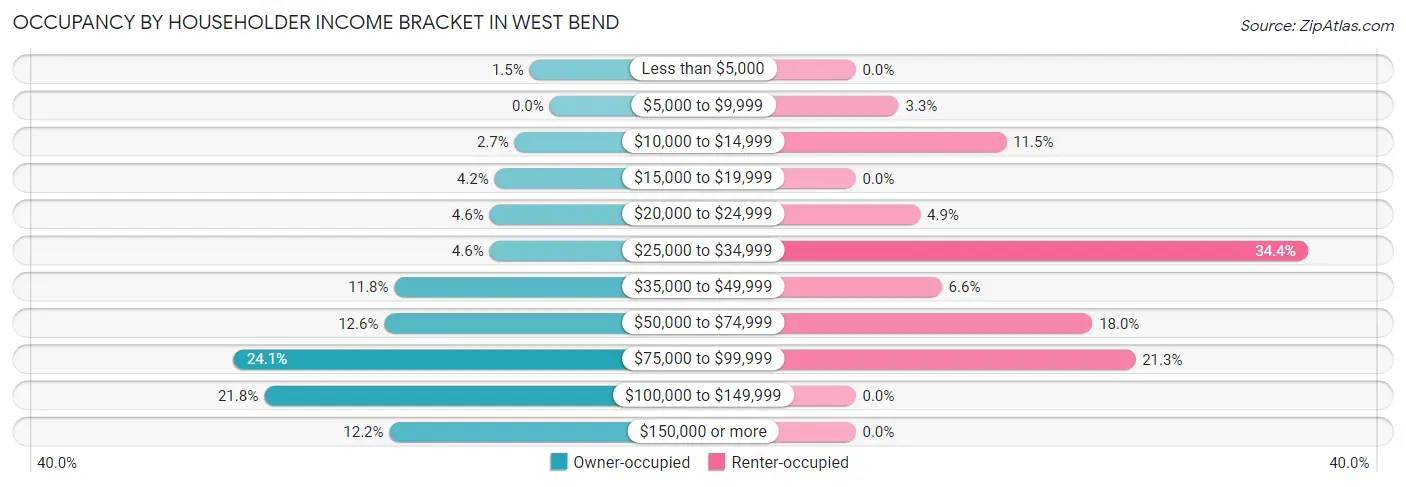
| Income Bracket | Owner-occupied | Renter-occupied |
| Less than $5,000 | 4 (1.5%) | 0 (0.0%) |
| $5,000 to $9,999 | 0 (0.0%) | 2 (3.3%) |
| $10,000 to $14,999 | 7 (2.7%) | 7 (11.5%) |
| $15,000 to $19,999 | 11 (4.2%) | 0 (0.0%) |
| $20,000 to $24,999 | 12 (4.6%) | 3 (4.9%) |
| $25,000 to $34,999 | 12 (4.6%) | 21 (34.4%) |
| $35,000 to $49,999 | 31 (11.8%) | 4 (6.6%) |
| $50,000 to $74,999 | 33 (12.6%) | 11 (18.0%) |
| $75,000 to $99,999 | 63 (24.0%) | 13 (21.3%) |
| $100,000 to $149,999 | 57 (21.8%) | 0 (0.0%) |
| $150,000 or more | 32 (12.2%) | 0 (0.0%) |
| Total | 262 (100.0%) | 61 (100.0%) |
Monthly Housing Cost Tiers in West Bend
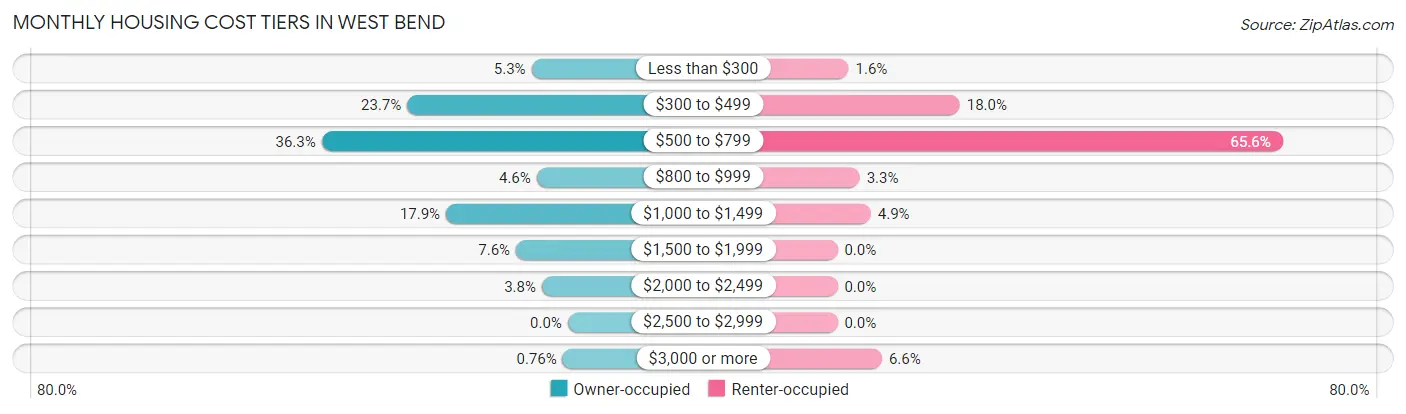
| Monthly Cost | Owner-occupied | Renter-occupied |
| Less than $300 | 14 (5.3%) | 1 (1.6%) |
| $300 to $499 | 62 (23.7%) | 11 (18.0%) |
| $500 to $799 | 95 (36.3%) | 40 (65.6%) |
| $800 to $999 | 12 (4.6%) | 2 (3.3%) |
| $1,000 to $1,499 | 47 (17.9%) | 3 (4.9%) |
| $1,500 to $1,999 | 20 (7.6%) | 0 (0.0%) |
| $2,000 to $2,499 | 10 (3.8%) | 0 (0.0%) |
| $2,500 to $2,999 | 0 (0.0%) | 0 (0.0%) |
| $3,000 or more | 2 (0.8%) | 4 (6.6%) |
| Total | 262 (100.0%) | 61 (100.0%) |
Physical Housing Characteristics in West Bend
Housing Structures in West Bend
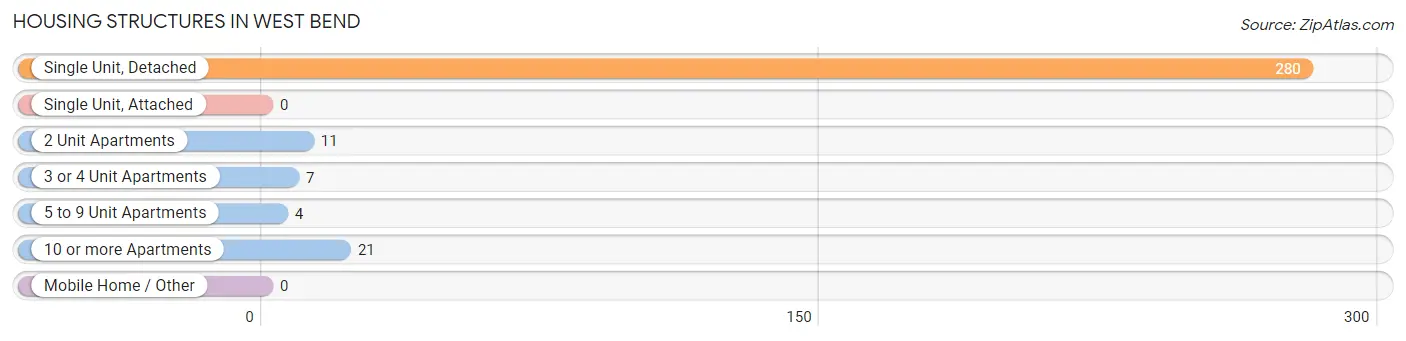
| Structure Type | # Housing Units | % Housing Units |
| Single Unit, Detached | 280 | 86.7% |
| Single Unit, Attached | 0 | 0.0% |
| 2 Unit Apartments | 11 | 3.4% |
| 3 or 4 Unit Apartments | 7 | 2.2% |
| 5 to 9 Unit Apartments | 4 | 1.2% |
| 10 or more Apartments | 21 | 6.5% |
| Mobile Home / Other | 0 | 0.0% |
| Total | 323 | 100.0% |
Housing Structures by Occupancy in West Bend
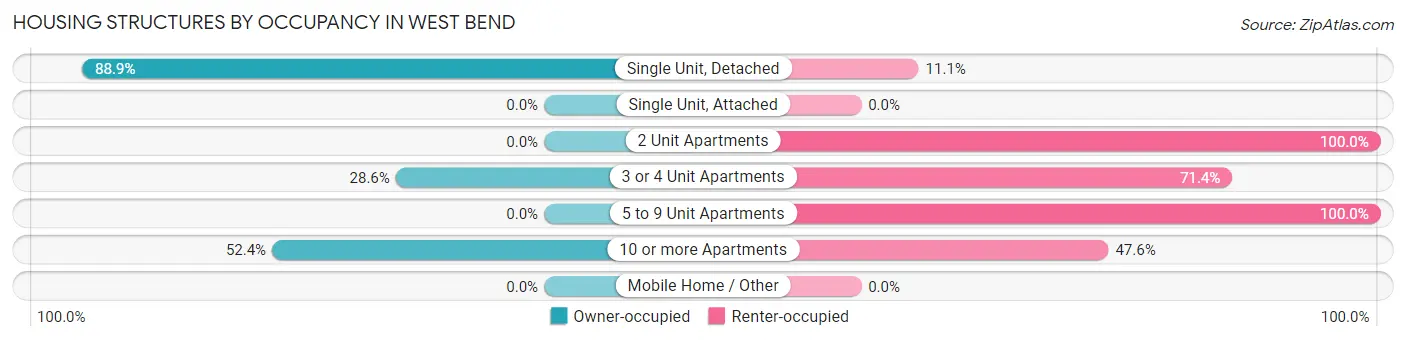
| Structure Type | Owner-occupied | Renter-occupied |
| Single Unit, Detached | 249 (88.9%) | 31 (11.1%) |
| Single Unit, Attached | 0 (0.0%) | 0 (0.0%) |
| 2 Unit Apartments | 0 (0.0%) | 11 (100.0%) |
| 3 or 4 Unit Apartments | 2 (28.6%) | 5 (71.4%) |
| 5 to 9 Unit Apartments | 0 (0.0%) | 4 (100.0%) |
| 10 or more Apartments | 11 (52.4%) | 10 (47.6%) |
| Mobile Home / Other | 0 (0.0%) | 0 (0.0%) |
| Total | 262 (81.1%) | 61 (18.9%) |
Housing Structures by Number of Rooms in West Bend
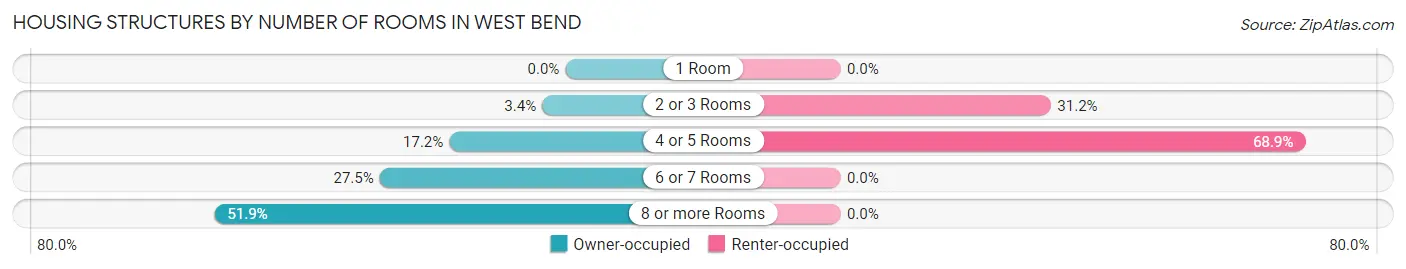
| Number of Rooms | Owner-occupied | Renter-occupied |
| 1 Room | 0 (0.0%) | 0 (0.0%) |
| 2 or 3 Rooms | 9 (3.4%) | 19 (31.1%) |
| 4 or 5 Rooms | 45 (17.2%) | 42 (68.9%) |
| 6 or 7 Rooms | 72 (27.5%) | 0 (0.0%) |
| 8 or more Rooms | 136 (51.9%) | 0 (0.0%) |
| Total | 262 (100.0%) | 61 (100.0%) |
Housing Structure by Heating Type in West Bend
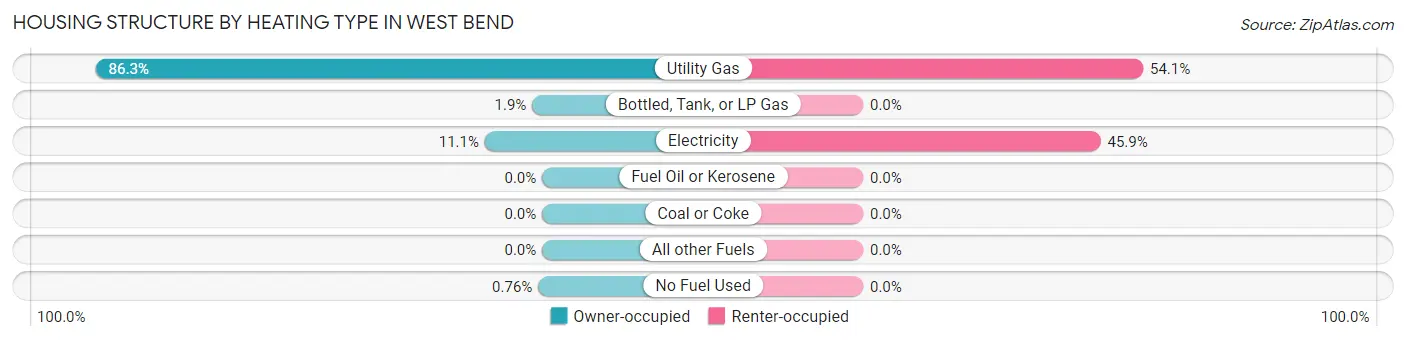
| Heating Type | Owner-occupied | Renter-occupied |
| Utility Gas | 226 (86.3%) | 33 (54.1%) |
| Bottled, Tank, or LP Gas | 5 (1.9%) | 0 (0.0%) |
| Electricity | 29 (11.1%) | 28 (45.9%) |
| Fuel Oil or Kerosene | 0 (0.0%) | 0 (0.0%) |
| Coal or Coke | 0 (0.0%) | 0 (0.0%) |
| All other Fuels | 0 (0.0%) | 0 (0.0%) |
| No Fuel Used | 2 (0.8%) | 0 (0.0%) |
| Total | 262 (100.0%) | 61 (100.0%) |
Household Vehicle Usage in West Bend
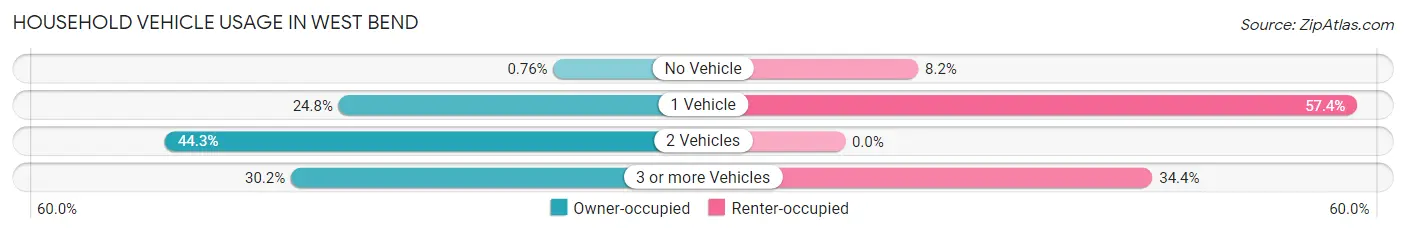
| Vehicles per Household | Owner-occupied | Renter-occupied |
| No Vehicle | 2 (0.8%) | 5 (8.2%) |
| 1 Vehicle | 65 (24.8%) | 35 (57.4%) |
| 2 Vehicles | 116 (44.3%) | 0 (0.0%) |
| 3 or more Vehicles | 79 (30.1%) | 21 (34.4%) |
| Total | 262 (100.0%) | 61 (100.0%) |
Real Estate & Mortgages in West Bend
Real Estate and Mortgage Overview in West Bend
| Characteristic | Without Mortgage | With Mortgage |
| Housing Units | 155 | 107 |
| Median Property Value | $145,700 | $140,600 |
| Median Household Income | $71,250 | $6 |
| Monthly Housing Costs | $504 | $2 |
| Real Estate Taxes | $1,750 | $2 |
Property Value by Mortgage Status in West Bend
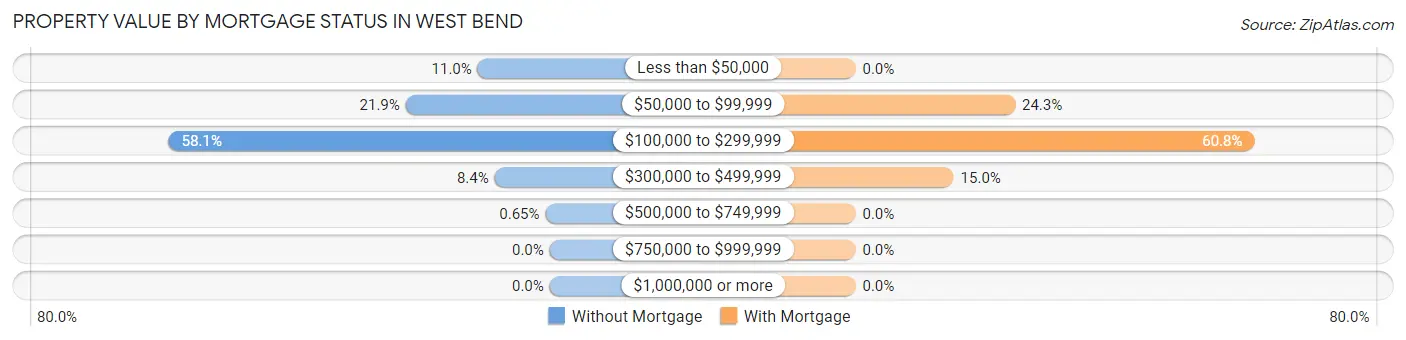
| Property Value | Without Mortgage | With Mortgage |
| Less than $50,000 | 17 (11.0%) | 0 (0.0%) |
| $50,000 to $99,999 | 34 (21.9%) | 26 (24.3%) |
| $100,000 to $299,999 | 90 (58.1%) | 65 (60.8%) |
| $300,000 to $499,999 | 13 (8.4%) | 16 (14.9%) |
| $500,000 to $749,999 | 1 (0.6%) | 0 (0.0%) |
| $750,000 to $999,999 | 0 (0.0%) | 0 (0.0%) |
| $1,000,000 or more | 0 (0.0%) | 0 (0.0%) |
| Total | 155 (100.0%) | 107 (100.0%) |
Household Income by Mortgage Status in West Bend
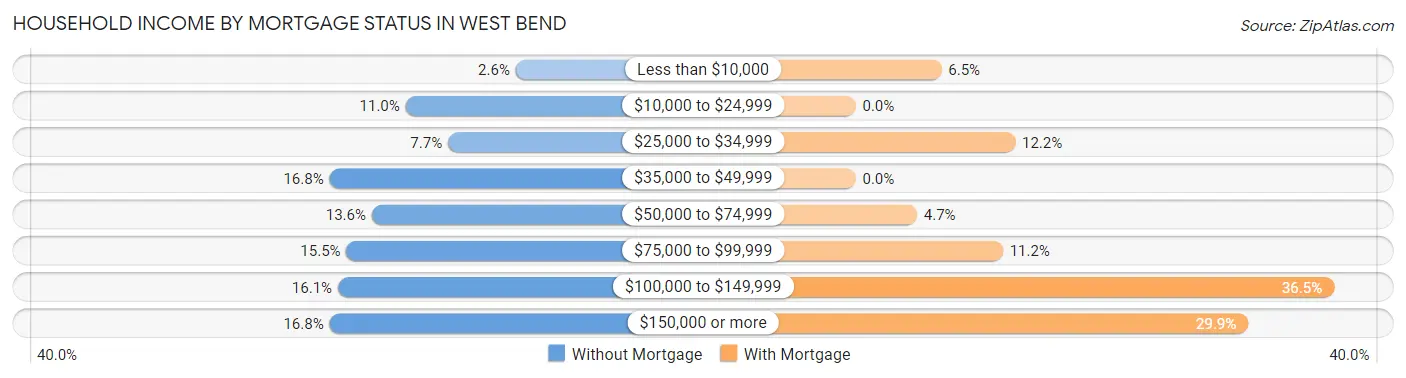
| Household Income | Without Mortgage | With Mortgage |
| Less than $10,000 | 4 (2.6%) | 7 (6.5%) |
| $10,000 to $24,999 | 17 (11.0%) | 0 (0.0%) |
| $25,000 to $34,999 | 12 (7.7%) | 13 (12.1%) |
| $35,000 to $49,999 | 26 (16.8%) | 0 (0.0%) |
| $50,000 to $74,999 | 21 (13.6%) | 5 (4.7%) |
| $75,000 to $99,999 | 24 (15.5%) | 12 (11.2%) |
| $100,000 to $149,999 | 25 (16.1%) | 39 (36.4%) |
| $150,000 or more | 26 (16.8%) | 32 (29.9%) |
| Total | 155 (100.0%) | 107 (100.0%) |
Property Value to Household Income Ratio in West Bend
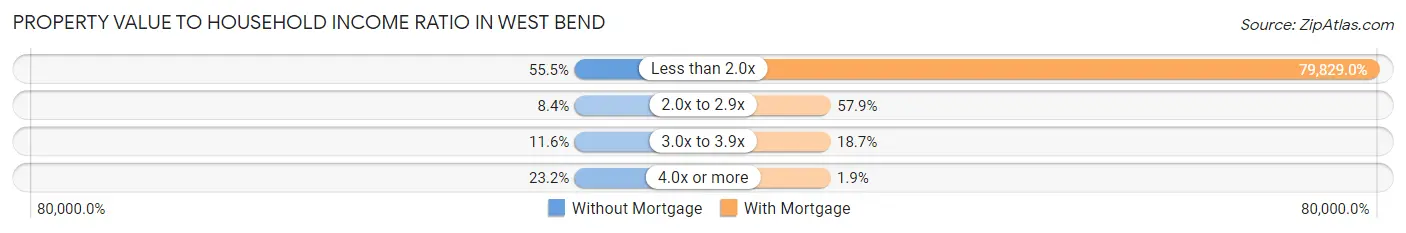
| Value-to-Income Ratio | Without Mortgage | With Mortgage |
| Less than 2.0x | 86 (55.5%) | 85,417 (79,829.0%) |
| 2.0x to 2.9x | 13 (8.4%) | 62 (57.9%) |
| 3.0x to 3.9x | 18 (11.6%) | 20 (18.7%) |
| 4.0x or more | 36 (23.2%) | 2 (1.9%) |
| Total | 155 (100.0%) | 107 (100.0%) |
Real Estate Taxes by Mortgage Status in West Bend
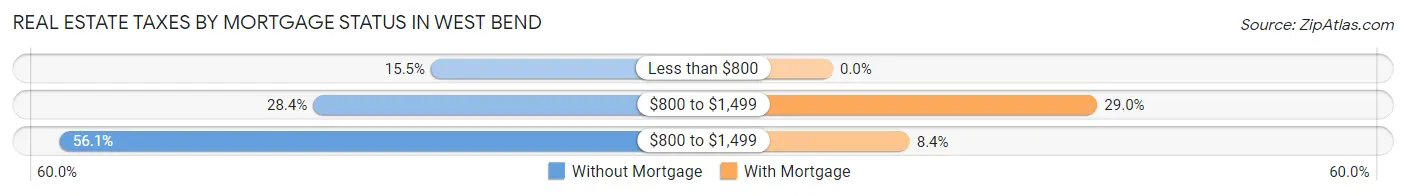
| Property Taxes | Without Mortgage | With Mortgage |
| Less than $800 | 24 (15.5%) | 0 (0.0%) |
| $800 to $1,499 | 44 (28.4%) | 31 (29.0%) |
| $800 to $1,499 | 87 (56.1%) | 9 (8.4%) |
| Total | 155 (100.0%) | 107 (100.0%) |
Health & Disability in West Bend
Health Insurance Coverage by Age in West Bend
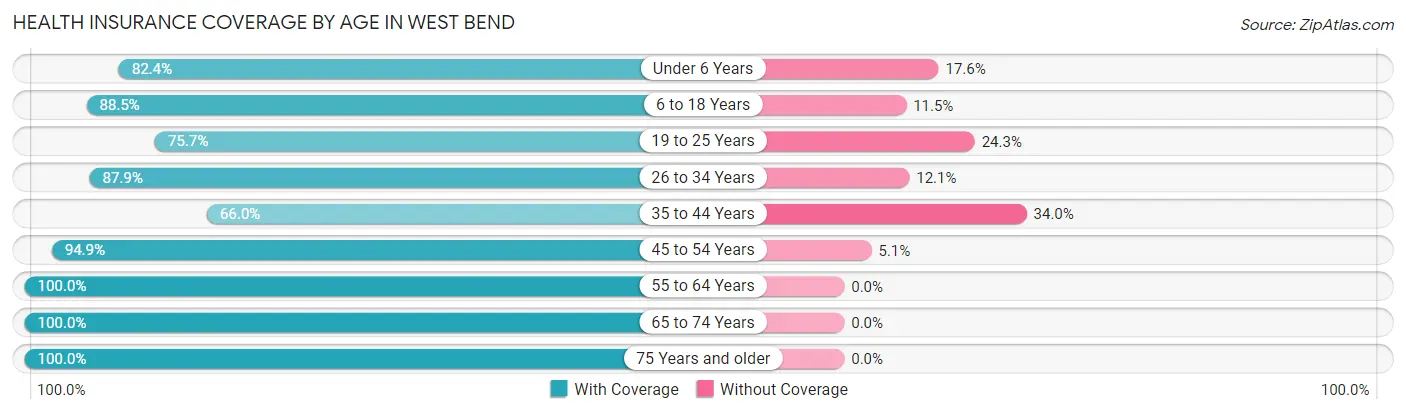
| Age Bracket | With Coverage | Without Coverage |
| Under 6 Years | 61 (82.4%) | 13 (17.6%) |
| 6 to 18 Years | 184 (88.5%) | 24 (11.5%) |
| 19 to 25 Years | 84 (75.7%) | 27 (24.3%) |
| 26 to 34 Years | 58 (87.9%) | 8 (12.1%) |
| 35 to 44 Years | 66 (66.0%) | 34 (34.0%) |
| 45 to 54 Years | 56 (94.9%) | 3 (5.1%) |
| 55 to 64 Years | 67 (100.0%) | 0 (0.0%) |
| 65 to 74 Years | 124 (100.0%) | 0 (0.0%) |
| 75 Years and older | 87 (100.0%) | 0 (0.0%) |
| Total | 787 (87.8%) | 109 (12.2%) |
Health Insurance Coverage by Citizenship Status in West Bend
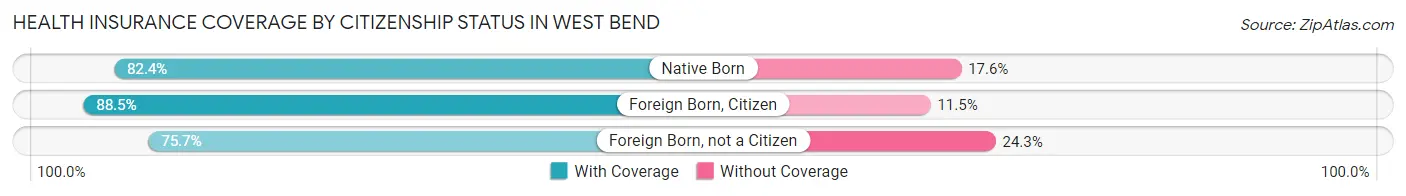
| Citizenship Status | With Coverage | Without Coverage |
| Native Born | 61 (82.4%) | 13 (17.6%) |
| Foreign Born, Citizen | 184 (88.5%) | 24 (11.5%) |
| Foreign Born, not a Citizen | 84 (75.7%) | 27 (24.3%) |
Health Insurance Coverage by Household Income in West Bend
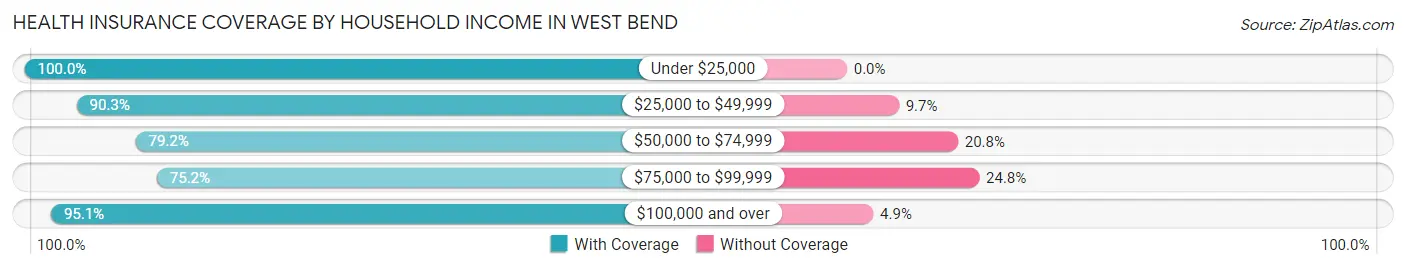
| Household Income | With Coverage | Without Coverage |
| Under $25,000 | 63 (100.0%) | 0 (0.0%) |
| $25,000 to $49,999 | 102 (90.3%) | 11 (9.7%) |
| $50,000 to $74,999 | 80 (79.2%) | 21 (20.8%) |
| $75,000 to $99,999 | 176 (75.2%) | 58 (24.8%) |
| $100,000 and over | 366 (95.1%) | 19 (4.9%) |
Public vs Private Health Insurance Coverage by Age in West Bend
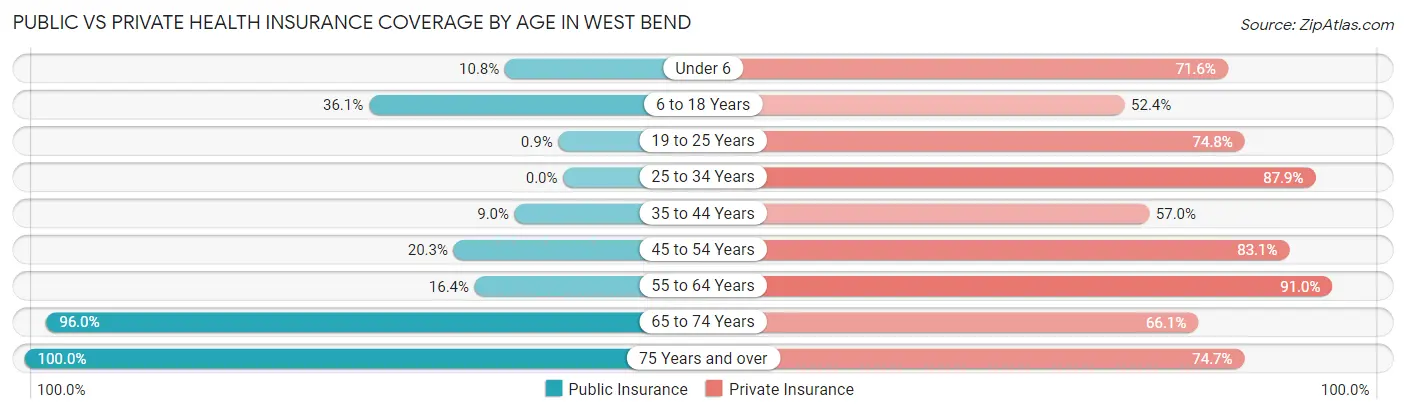
| Age Bracket | Public Insurance | Private Insurance |
| Under 6 | 8 (10.8%) | 53 (71.6%) |
| 6 to 18 Years | 75 (36.1%) | 109 (52.4%) |
| 19 to 25 Years | 1 (0.9%) | 83 (74.8%) |
| 25 to 34 Years | 0 (0.0%) | 58 (87.9%) |
| 35 to 44 Years | 9 (9.0%) | 57 (57.0%) |
| 45 to 54 Years | 12 (20.3%) | 49 (83.1%) |
| 55 to 64 Years | 11 (16.4%) | 61 (91.0%) |
| 65 to 74 Years | 119 (96.0%) | 82 (66.1%) |
| 75 Years and over | 87 (100.0%) | 65 (74.7%) |
| Total | 322 (35.9%) | 617 (68.9%) |
Disability Status by Sex by Age in West Bend
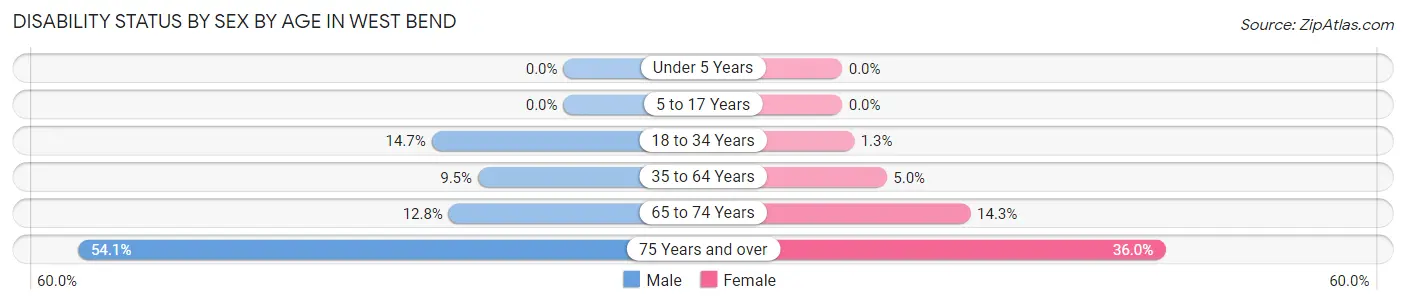
| Age Bracket | Male | Female |
| Under 5 Years | 0 (0.0%) | 0 (0.0%) |
| 5 to 17 Years | 0 (0.0%) | 0 (0.0%) |
| 18 to 34 Years | 16 (14.7%) | 1 (1.3%) |
| 35 to 64 Years | 10 (9.5%) | 6 (5.0%) |
| 65 to 74 Years | 6 (12.8%) | 11 (14.3%) |
| 75 Years and over | 20 (54.0%) | 18 (36.0%) |
Disability Class by Sex by Age in West Bend
Disability Class: Hearing Difficulty
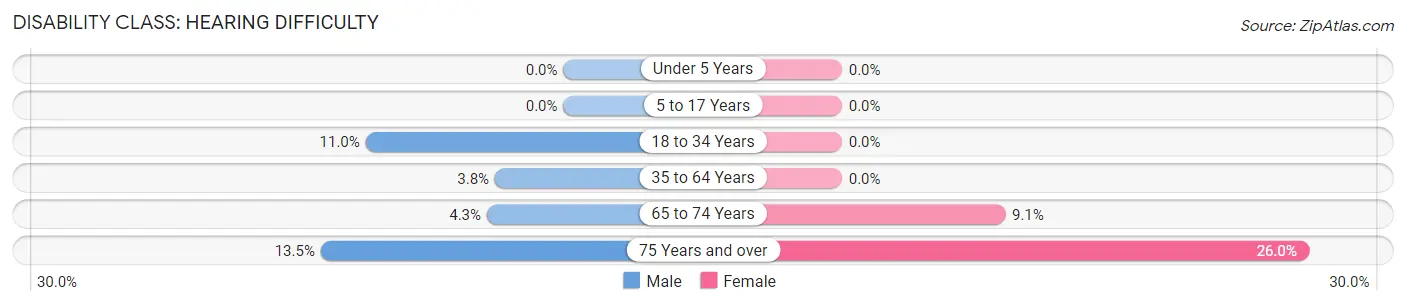
| Age Bracket | Male | Female |
| Under 5 Years | 0 (0.0%) | 0 (0.0%) |
| 5 to 17 Years | 0 (0.0%) | 0 (0.0%) |
| 18 to 34 Years | 12 (11.0%) | 0 (0.0%) |
| 35 to 64 Years | 4 (3.8%) | 0 (0.0%) |
| 65 to 74 Years | 2 (4.3%) | 7 (9.1%) |
| 75 Years and over | 5 (13.5%) | 13 (26.0%) |
Disability Class: Vision Difficulty
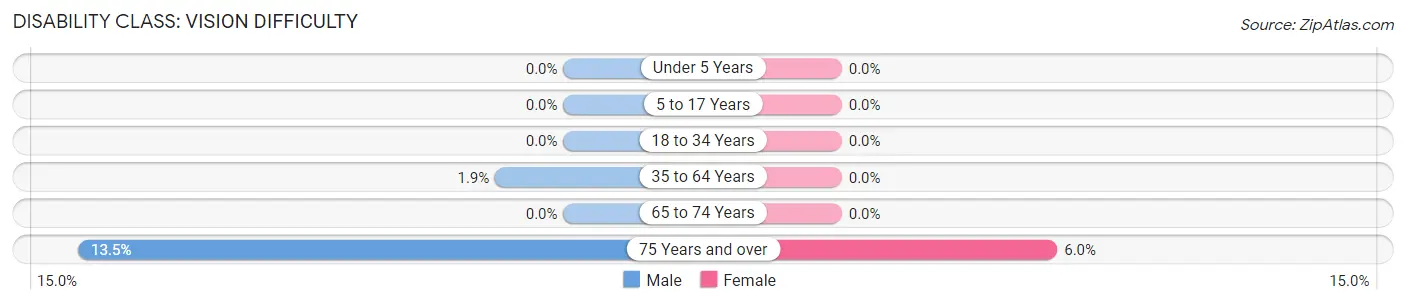
| Age Bracket | Male | Female |
| Under 5 Years | 0 (0.0%) | 0 (0.0%) |
| 5 to 17 Years | 0 (0.0%) | 0 (0.0%) |
| 18 to 34 Years | 0 (0.0%) | 0 (0.0%) |
| 35 to 64 Years | 2 (1.9%) | 0 (0.0%) |
| 65 to 74 Years | 0 (0.0%) | 0 (0.0%) |
| 75 Years and over | 5 (13.5%) | 3 (6.0%) |
Disability Class: Cognitive Difficulty
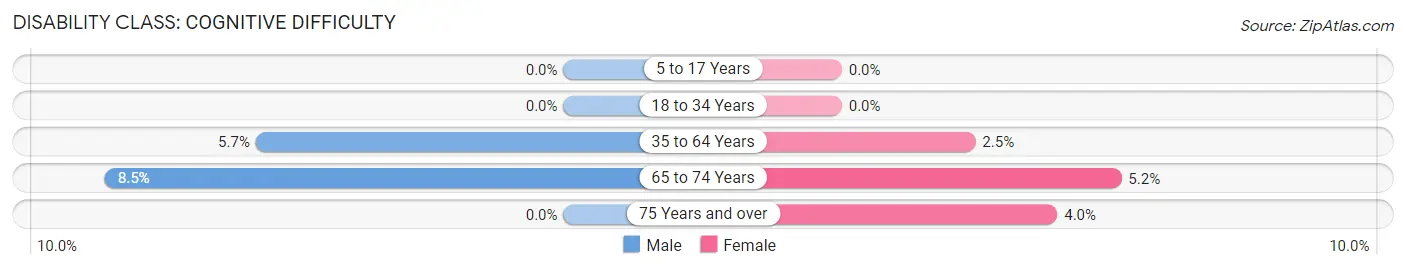
| Age Bracket | Male | Female |
| 5 to 17 Years | 0 (0.0%) | 0 (0.0%) |
| 18 to 34 Years | 0 (0.0%) | 0 (0.0%) |
| 35 to 64 Years | 6 (5.7%) | 3 (2.5%) |
| 65 to 74 Years | 4 (8.5%) | 4 (5.2%) |
| 75 Years and over | 0 (0.0%) | 2 (4.0%) |
Disability Class: Ambulatory Difficulty
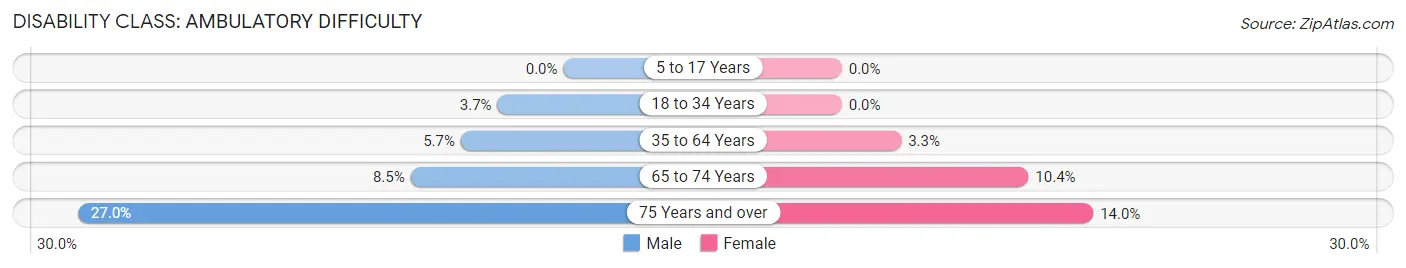
| Age Bracket | Male | Female |
| 5 to 17 Years | 0 (0.0%) | 0 (0.0%) |
| 18 to 34 Years | 4 (3.7%) | 0 (0.0%) |
| 35 to 64 Years | 6 (5.7%) | 4 (3.3%) |
| 65 to 74 Years | 4 (8.5%) | 8 (10.4%) |
| 75 Years and over | 10 (27.0%) | 7 (14.0%) |
Disability Class: Self-Care Difficulty
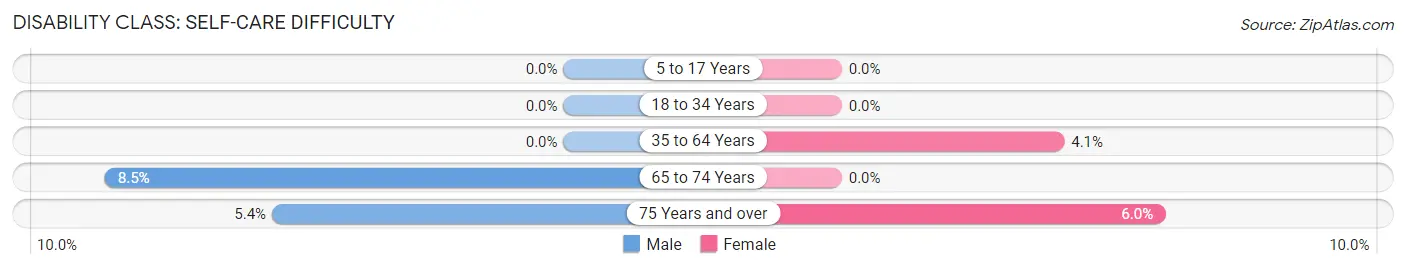
| Age Bracket | Male | Female |
| 5 to 17 Years | 0 (0.0%) | 0 (0.0%) |
| 18 to 34 Years | 0 (0.0%) | 0 (0.0%) |
| 35 to 64 Years | 0 (0.0%) | 5 (4.1%) |
| 65 to 74 Years | 4 (8.5%) | 0 (0.0%) |
| 75 Years and over | 2 (5.4%) | 3 (6.0%) |
Technology Access in West Bend
Computing Device Access in West Bend
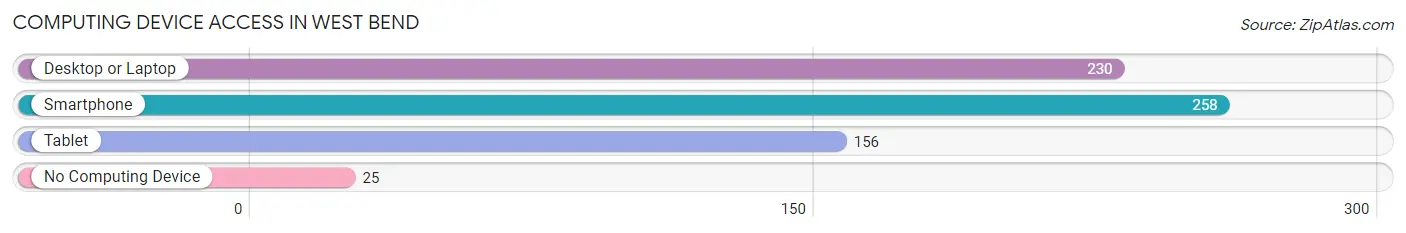
| Device Type | # Households | % Households |
| Desktop or Laptop | 230 | 71.2% |
| Smartphone | 258 | 79.9% |
| Tablet | 156 | 48.3% |
| No Computing Device | 25 | 7.7% |
| Total | 323 | 100.0% |
Internet Access in West Bend
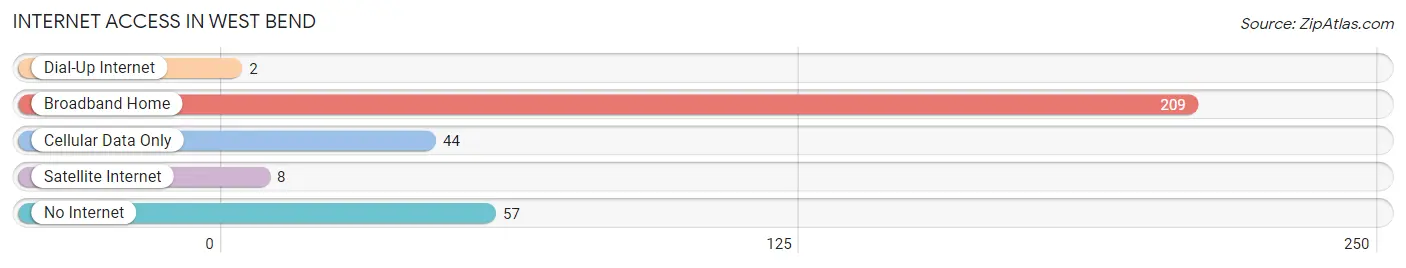
| Internet Type | # Households | % Households |
| Dial-Up Internet | 2 | 0.6% |
| Broadband Home | 209 | 64.7% |
| Cellular Data Only | 44 | 13.6% |
| Satellite Internet | 8 | 2.5% |
| No Internet | 57 | 17.6% |
| Total | 323 | 100.0% |
West Bend Summary
Introduction
West Bend is a small city located in Palo Alto County, Iowa. It is situated in the northwest corner of the state, near the Minnesota border. The city has a population of 1,845 people, according to the 2010 census. West Bend is a rural community with a strong agricultural base. It is also home to a variety of businesses, including manufacturing, retail, and service industries.
History
West Bend was founded in 1856 by a group of German immigrants. The city was named after the nearby West Bend of the Des Moines River. The first settlers were primarily farmers, and the city quickly grew to become a thriving agricultural center.
In the late 19th century, West Bend became a popular destination for tourists. The city was known for its scenic beauty and its many recreational activities, such as fishing, hunting, and boating.
In the early 20th century, West Bend experienced a period of industrial growth. Several factories were built in the city, including a creamery, a flour mill, and a furniture factory. These industries provided jobs for many of the city’s residents.
Geography
West Bend is located in the northwest corner of Iowa, near the Minnesota border. The city is situated in the Des Moines River Valley, which is part of the larger Iowa River Valley. The city is surrounded by rolling hills and farmland.
The climate in West Bend is typical of the Midwest. Summers are hot and humid, while winters are cold and snowy. The average annual temperature is around 50 degrees Fahrenheit.
Economy
West Bend’s economy is primarily based on agriculture. The city is home to several large farms, which produce corn, soybeans, and other crops. The city also has a strong manufacturing sector, which includes a furniture factory, a flour mill, and a creamery.
In addition to agriculture and manufacturing, West Bend also has a thriving retail sector. The city is home to several small businesses, including restaurants, shops, and other services.
Demographics
According to the 2010 census, West Bend has a population of 1,845 people. The city is predominantly white, with a small Hispanic population. The median household income is $41,000, and the median age is 43.
Conclusion
West Bend is a small city located in Palo Alto County, Iowa. It is a rural community with a strong agricultural base and a variety of businesses. The city has a population of 1,845 people, and the median household income is $41,000. West Bend is a popular destination for tourists, and it is known for its scenic beauty and recreational activities.
Common Questions
What is Per Capita Income in West Bend?
Per Capita income in West Bend is $30,222.
What is the Median Family Income in West Bend?
Median Family Income in West Bend is $85,898.
What is the Median Household income in West Bend?
Median Household Income in West Bend is $80,337.
What is Income or Wage Gap in West Bend?
Income or Wage Gap in West Bend is 24.6%.
Women in West Bend earn 75.4 cents for every dollar earned by a man.
What is Inequality or Gini Index in West Bend?
Inequality or Gini Index in West Bend is 0.39.
What is the Total Population of West Bend?
Total Population of West Bend is 936.
What is the Total Male Population of West Bend?
Total Male Population of West Bend is 423.
What is the Total Female Population of West Bend?
Total Female Population of West Bend is 513.
What is the Ratio of Males per 100 Females in West Bend?
There are 82.46 Males per 100 Females in West Bend.
What is the Ratio of Females per 100 Males in West Bend?
There are 121.28 Females per 100 Males in West Bend.
What is the Median Population Age in West Bend?
Median Population Age in West Bend is 35.6 Years.
What is the Average Family Size in West Bend
Average Family Size in West Bend is 3.5 People.
What is the Average Household Size in West Bend
Average Household Size in West Bend is 2.8 People.
How Large is the Labor Force in West Bend?
There are 421 People in the Labor Forcein in West Bend.
What is the Percentage of People in the Labor Force in West Bend?
58.2% of People are in the Labor Force in West Bend.
What is the Unemployment Rate in West Bend?
Unemployment Rate in West Bend is 4.0%.