Miles, IA Map & Demographics
Miles Map
Miles Overview
$32,895
PER CAPITA INCOME
$77,188
AVG FAMILY INCOME
$63,125
AVG HOUSEHOLD INCOME
34.5%
WAGE / INCOME GAP [ % ]
65.5¢/ $1
WAGE / INCOME GAP [ $ ]
0.40
INEQUALITY / GINI INDEX
398
TOTAL POPULATION
208
MALE POPULATION
190
FEMALE POPULATION
109.47
MALES / 100 FEMALES
91.35
FEMALES / 100 MALES
43.9
MEDIAN AGE
2.7
AVG FAMILY SIZE
2.2
AVG HOUSEHOLD SIZE
199
LABOR FORCE [ PEOPLE ]
59.8%
PERCENT IN LABOR FORCE
1.5%
UNEMPLOYMENT RATE
Miles Zip Codes
Miles Area Codes
Income in Miles
Income Overview in Miles
Per Capita Income in Miles is $32,895, while median incomes of families and households are $77,188 and $63,125 respectively.
| Characteristic | Number | Measure |
| Per Capita Income | 398 | $32,895 |
| Median Family Income | 113 | $77,188 |
| Mean Family Income | 113 | $86,328 |
| Median Household Income | 184 | $63,125 |
| Mean Household Income | 184 | $72,668 |
| Income Deficit | 113 | $0 |
| Wage / Income Gap (%) | 398 | 34.47% |
| Wage / Income Gap ($) | 398 | 65.53¢ per $1 |
| Gini / Inequality Index | 398 | 0.40 |
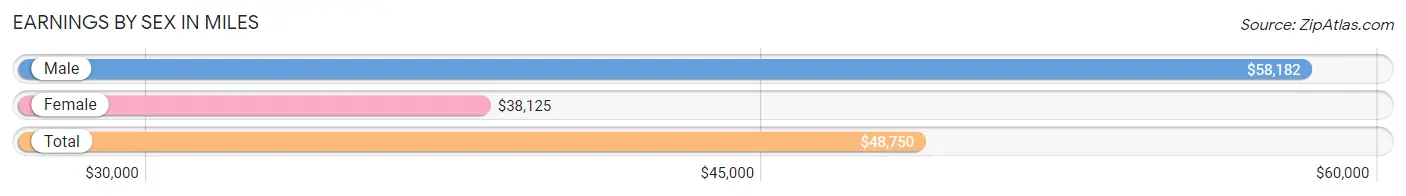
Earnings by Sex in Miles
Average Earnings in Miles are $48,750, $58,182 for men and $38,125 for women, a difference of 34.5%.
| Sex | Number | Average Earnings |
| Male | 110 (55.0%) | $58,182 |
| Female | 90 (45.0%) | $38,125 |
| Total | 200 (100.0%) | $48,750 |
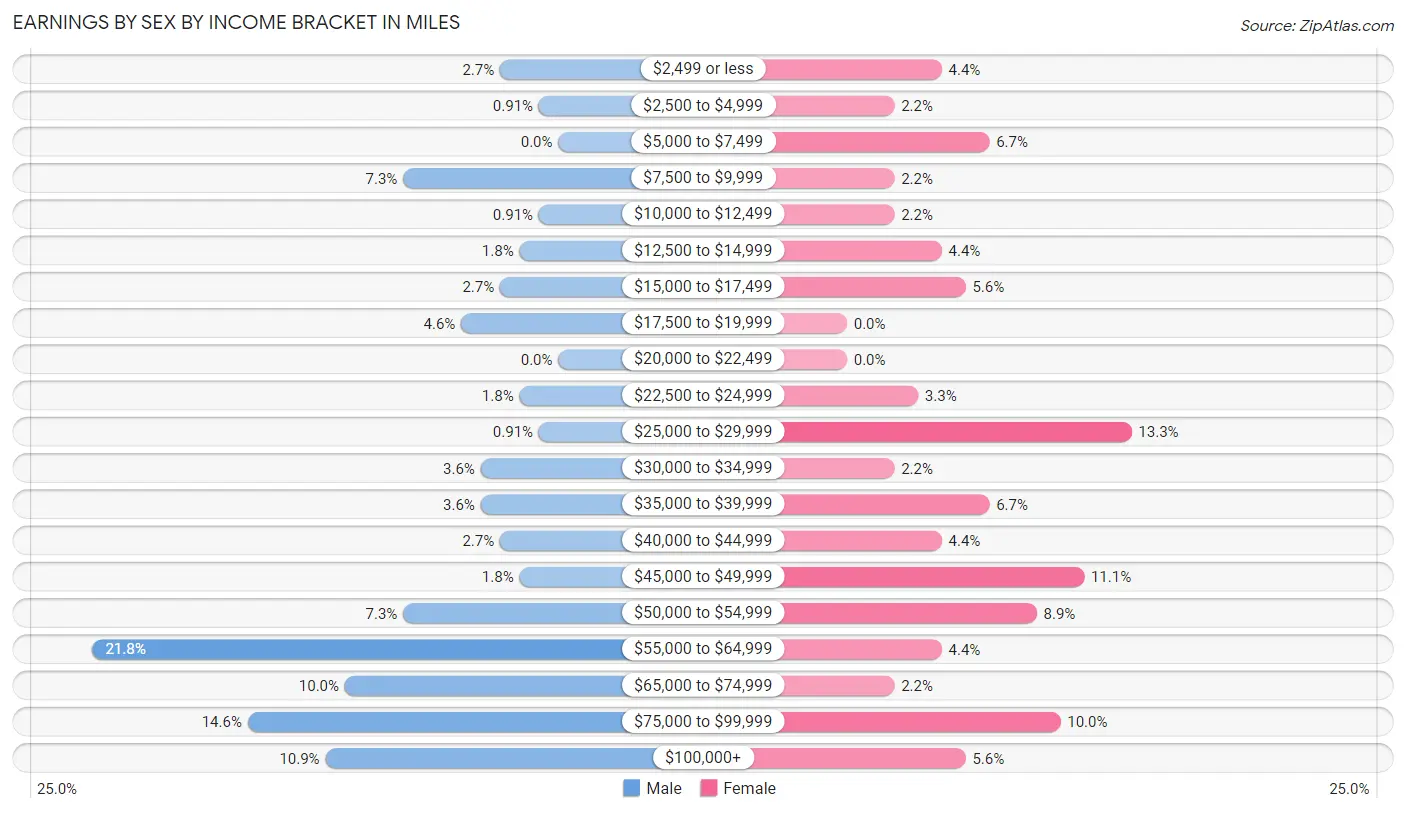
Earnings by Sex by Income Bracket in Miles
The most common earnings brackets in Miles are $55,000 to $64,999 for men (24 | 21.8%) and $25,000 to $29,999 for women (12 | 13.3%).
| Income | Male | Female |
| $2,499 or less | 3 (2.7%) | 4 (4.4%) |
| $2,500 to $4,999 | 1 (0.9%) | 2 (2.2%) |
| $5,000 to $7,499 | 0 (0.0%) | 6 (6.7%) |
| $7,500 to $9,999 | 8 (7.3%) | 2 (2.2%) |
| $10,000 to $12,499 | 1 (0.9%) | 2 (2.2%) |
| $12,500 to $14,999 | 2 (1.8%) | 4 (4.4%) |
| $15,000 to $17,499 | 3 (2.7%) | 5 (5.6%) |
| $17,500 to $19,999 | 5 (4.5%) | 0 (0.0%) |
| $20,000 to $22,499 | 0 (0.0%) | 0 (0.0%) |
| $22,500 to $24,999 | 2 (1.8%) | 3 (3.3%) |
| $25,000 to $29,999 | 1 (0.9%) | 12 (13.3%) |
| $30,000 to $34,999 | 4 (3.6%) | 2 (2.2%) |
| $35,000 to $39,999 | 4 (3.6%) | 6 (6.7%) |
| $40,000 to $44,999 | 3 (2.7%) | 4 (4.4%) |
| $45,000 to $49,999 | 2 (1.8%) | 10 (11.1%) |
| $50,000 to $54,999 | 8 (7.3%) | 8 (8.9%) |
| $55,000 to $64,999 | 24 (21.8%) | 4 (4.4%) |
| $65,000 to $74,999 | 11 (10.0%) | 2 (2.2%) |
| $75,000 to $99,999 | 16 (14.5%) | 9 (10.0%) |
| $100,000+ | 12 (10.9%) | 5 (5.6%) |
| Total | 110 (100.0%) | 90 (100.0%) |
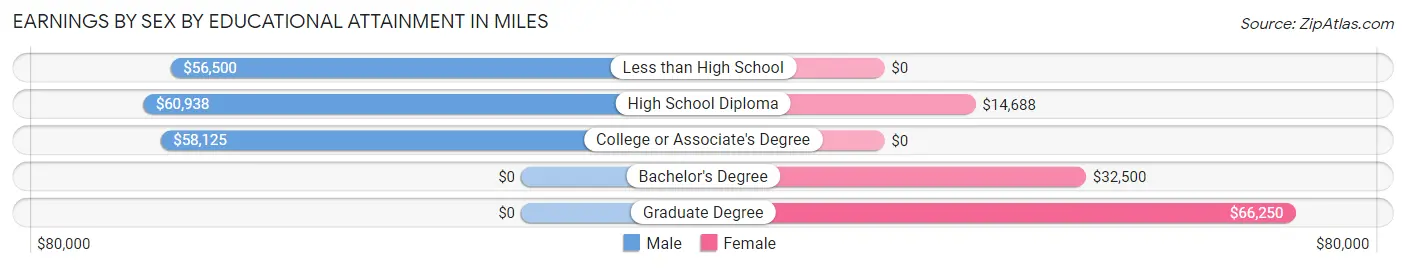
Earnings by Sex by Educational Attainment in Miles
Average earnings in Miles are $57,614 for men and $29,773 for women, a difference of 48.3%. Men with an educational attainment of high school diploma enjoy the highest average annual earnings of $60,938, while those with less than high school education earn the least with $56,500. Women with an educational attainment of graduate degree earn the most with the average annual earnings of $66,250, while those with high school diploma education have the smallest earnings of $14,688.
| Educational Attainment | Male Income | Female Income |
| Less than High School | $56,500 | $0 |
| High School Diploma | $60,938 | $14,688 |
| College or Associate's Degree | $58,125 | $0 |
| Bachelor's Degree | - | - |
| Graduate Degree | - | - |
| Total | $57,614 | $29,773 |
Family Income in Miles
Family Income Brackets in Miles
According to the Miles family income data, there are 29 families falling into the $100,000 to $149,999 income range, which is the most common income bracket and makes up 25.7% of all families.
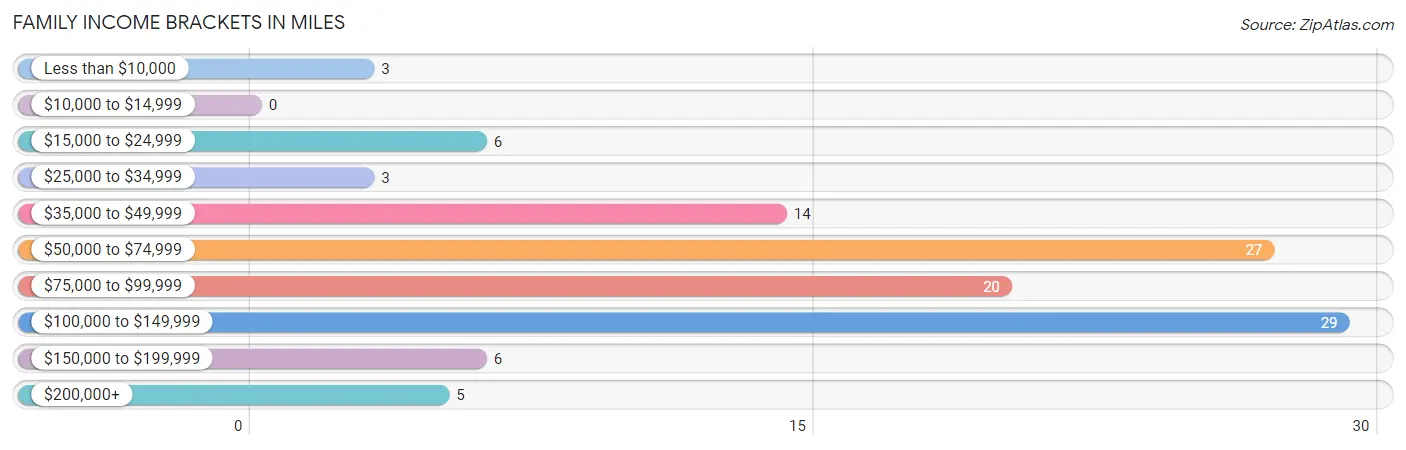
| Income Bracket | # Families | % Families |
| Less than $10,000 | 3 | 2.7% |
| $10,000 to $14,999 | 0 | 0.0% |
| $15,000 to $24,999 | 6 | 5.3% |
| $25,000 to $34,999 | 3 | 2.7% |
| $35,000 to $49,999 | 14 | 12.4% |
| $50,000 to $74,999 | 27 | 23.9% |
| $75,000 to $99,999 | 20 | 17.7% |
| $100,000 to $149,999 | 29 | 25.7% |
| $150,000 to $199,999 | 6 | 5.3% |
| $200,000+ | 5 | 4.4% |
Family Income by Famaliy Size in Miles
5-person families (10 | 8.8%) account for the highest median family income in Miles with $143,750 per family, while 3-person families (21 | 18.6%) have the highest median income of $35,694 per family member.
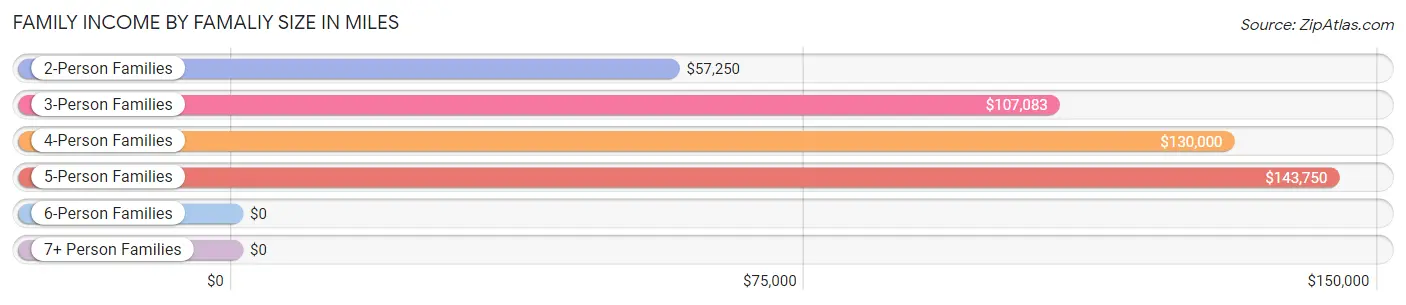
| Income Bracket | # Families | Median Income |
| 2-Person Families | 70 (62.0%) | $57,250 |
| 3-Person Families | 21 (18.6%) | $107,083 |
| 4-Person Families | 10 (8.8%) | $130,000 |
| 5-Person Families | 10 (8.8%) | $143,750 |
| 6-Person Families | 2 (1.8%) | $0 |
| 7+ Person Families | 0 (0.0%) | $0 |
| Total | 113 (100.0%) | $77,188 |
Family Income by Number of Earners in Miles
The median family income in Miles is $77,188, with families comprising 3+ earners (4) having the highest median family income of $115,000, while families with no earners (22) have the lowest median family income of $36,563, accounting for 3.5% and 19.5% of families, respectively.
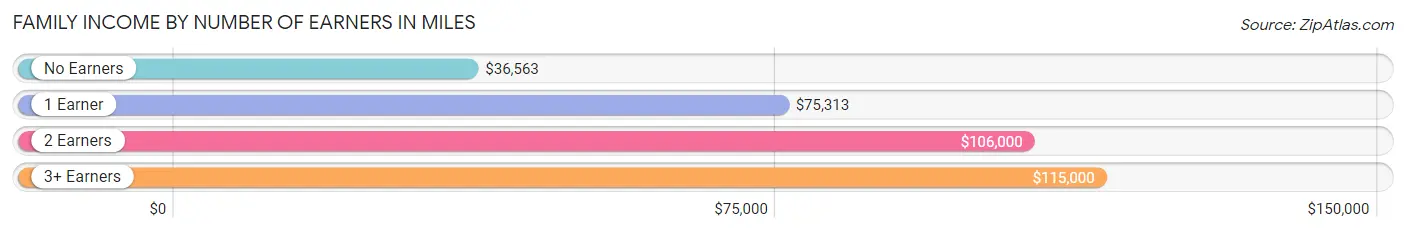
| Number of Earners | # Families | Median Income |
| No Earners | 22 (19.5%) | $36,563 |
| 1 Earner | 33 (29.2%) | $75,313 |
| 2 Earners | 54 (47.8%) | $106,000 |
| 3+ Earners | 4 (3.5%) | $115,000 |
| Total | 113 (100.0%) | $77,188 |
Household Income in Miles
Household Income Brackets in Miles
With 43 households falling in the category, the $100,000 to $149,999 income range is the most frequent in Miles, accounting for 23.4% of all households. In contrast, only 5 households (2.7%) fall into the $200,000+ income bracket, making it the least populous group.
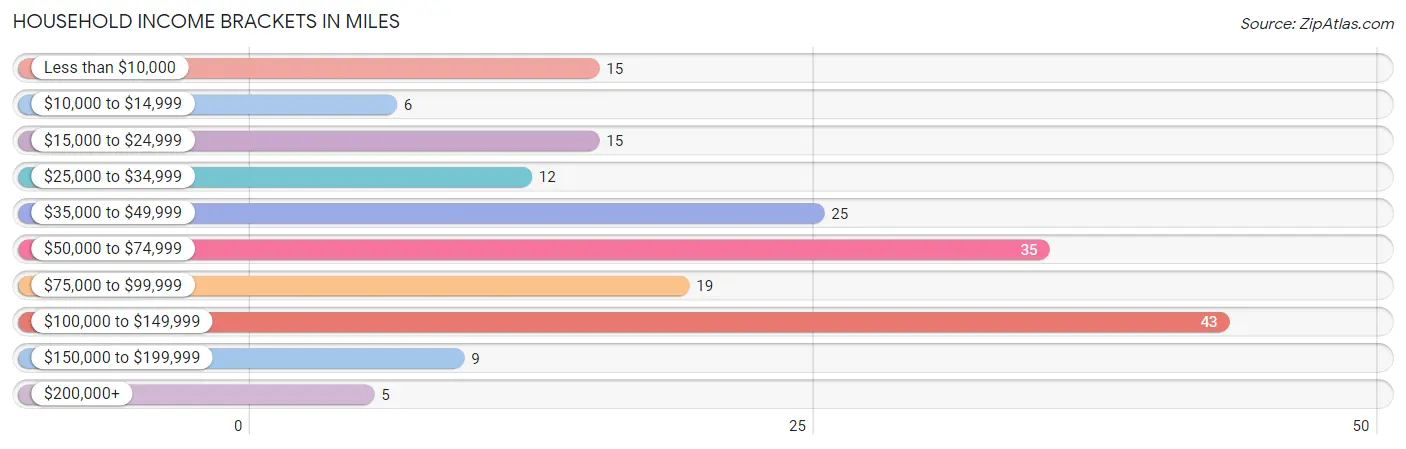
| Income Bracket | # Households | % Households |
| Less than $10,000 | 15 | 8.2% |
| $10,000 to $14,999 | 6 | 3.3% |
| $15,000 to $24,999 | 15 | 8.2% |
| $25,000 to $34,999 | 12 | 6.5% |
| $35,000 to $49,999 | 25 | 13.6% |
| $50,000 to $74,999 | 35 | 19.0% |
| $75,000 to $99,999 | 19 | 10.3% |
| $100,000 to $149,999 | 43 | 23.4% |
| $150,000 to $199,999 | 9 | 4.9% |
| $200,000+ | 5 | 2.7% |
Household Income by Householder Age in Miles
The median household income in Miles is $63,125, with the highest median household income of $115,313 found in the 15 to 24 years age bracket for the primary householder. A total of 14 households (7.6%) fall into this category. Meanwhile, the 65+ years age bracket for the primary householder has the lowest median household income of $38,750, with 57 households (31.0%) in this group.
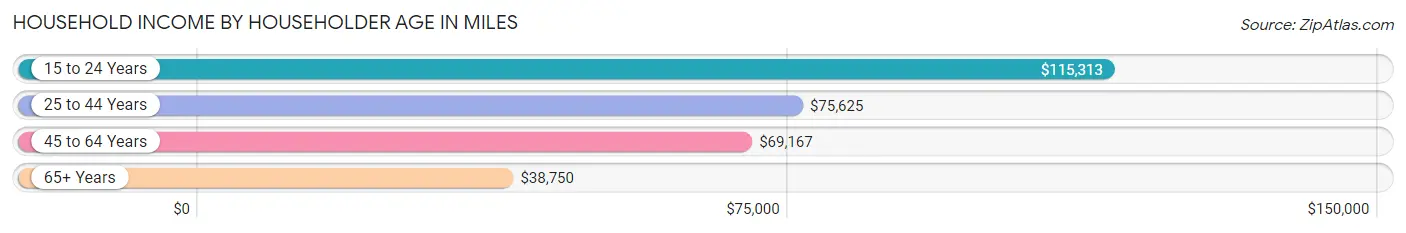
| Income Bracket | # Households | Median Income |
| 15 to 24 Years | 14 (7.6%) | $115,313 |
| 25 to 44 Years | 59 (32.1%) | $75,625 |
| 45 to 64 Years | 54 (29.3%) | $69,167 |
| 65+ Years | 57 (31.0%) | $38,750 |
| Total | 184 (100.0%) | $63,125 |
Poverty in Miles
Income Below Poverty by Sex and Age in Miles
With 12.5% poverty level for males and 13.2% for females among the residents of Miles, 5 year old males and 6 to 11 year old females are the most vulnerable to poverty, with 1 males (100.0%) and 1 females (33.3%) in their respective age groups living below the poverty level.
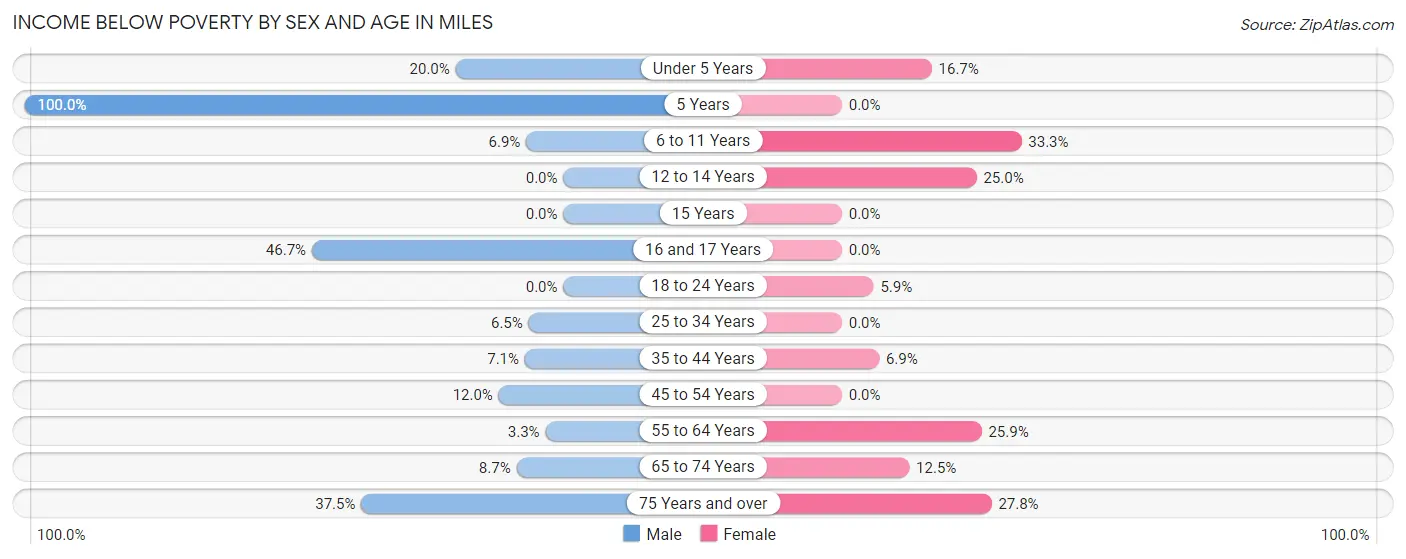
| Age Bracket | Male | Female |
| Under 5 Years | 1 (20.0%) | 2 (16.7%) |
| 5 Years | 1 (100.0%) | 0 (0.0%) |
| 6 to 11 Years | 2 (6.9%) | 1 (33.3%) |
| 12 to 14 Years | 0 (0.0%) | 2 (25.0%) |
| 15 Years | 0 (0.0%) | 0 (0.0%) |
| 16 and 17 Years | 7 (46.7%) | 0 (0.0%) |
| 18 to 24 Years | 0 (0.0%) | 1 (5.9%) |
| 25 to 34 Years | 2 (6.5%) | 0 (0.0%) |
| 35 to 44 Years | 1 (7.1%) | 2 (6.9%) |
| 45 to 54 Years | 3 (12.0%) | 0 (0.0%) |
| 55 to 64 Years | 1 (3.3%) | 7 (25.9%) |
| 65 to 74 Years | 2 (8.7%) | 5 (12.5%) |
| 75 Years and over | 6 (37.5%) | 5 (27.8%) |
| Total | 26 (12.5%) | 25 (13.2%) |
Income Above Poverty by Sex and Age in Miles
According to the poverty statistics in Miles, males aged 12 to 14 years and females aged 15 years are the age groups that are most secure financially, with 100.0% of males and 100.0% of females in these age groups living above the poverty line.
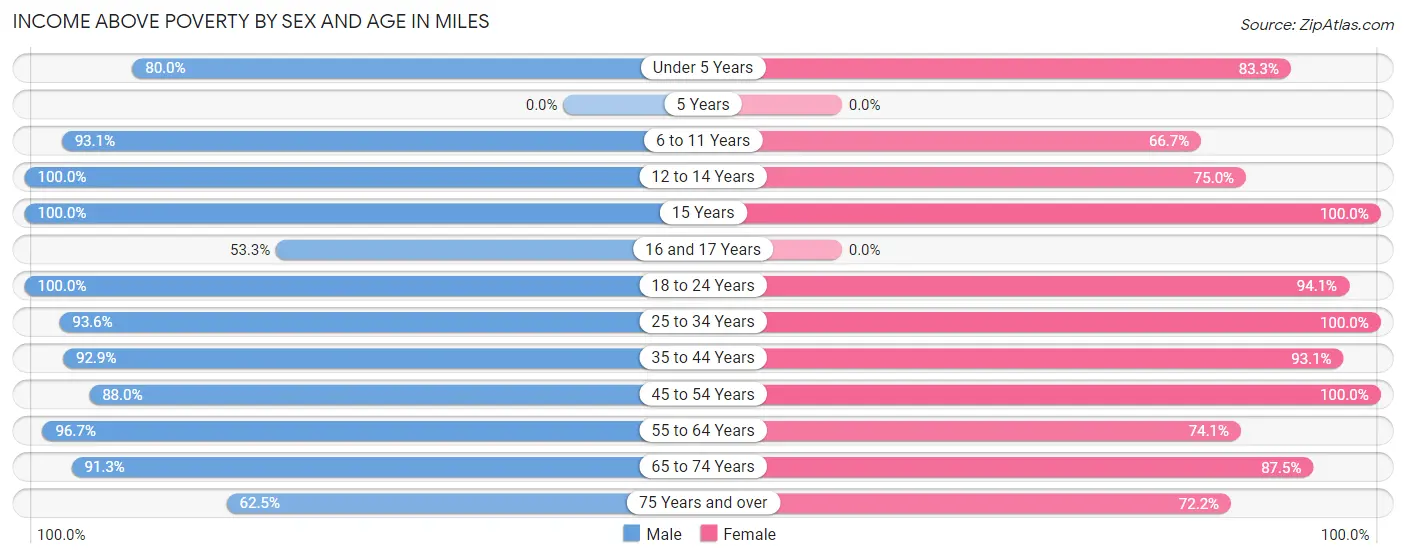
| Age Bracket | Male | Female |
| Under 5 Years | 4 (80.0%) | 10 (83.3%) |
| 5 Years | 0 (0.0%) | 0 (0.0%) |
| 6 to 11 Years | 27 (93.1%) | 2 (66.7%) |
| 12 to 14 Years | 4 (100.0%) | 6 (75.0%) |
| 15 Years | 1 (100.0%) | 2 (100.0%) |
| 16 and 17 Years | 8 (53.3%) | 0 (0.0%) |
| 18 to 24 Years | 14 (100.0%) | 16 (94.1%) |
| 25 to 34 Years | 29 (93.5%) | 19 (100.0%) |
| 35 to 44 Years | 13 (92.9%) | 27 (93.1%) |
| 45 to 54 Years | 22 (88.0%) | 15 (100.0%) |
| 55 to 64 Years | 29 (96.7%) | 20 (74.1%) |
| 65 to 74 Years | 21 (91.3%) | 35 (87.5%) |
| 75 Years and over | 10 (62.5%) | 13 (72.2%) |
| Total | 182 (87.5%) | 165 (86.8%) |
Income Below Poverty Among Married-Couple Families in Miles
The poverty statistics for married-couple families in Miles show that 3.9% or 4 of the total 103 families live below the poverty line. Families with no children have the highest poverty rate of 5.5%, comprising of 4 families. On the other hand, families with 1 or 2 children have the lowest poverty rate of 0.0%, which includes 0 families.
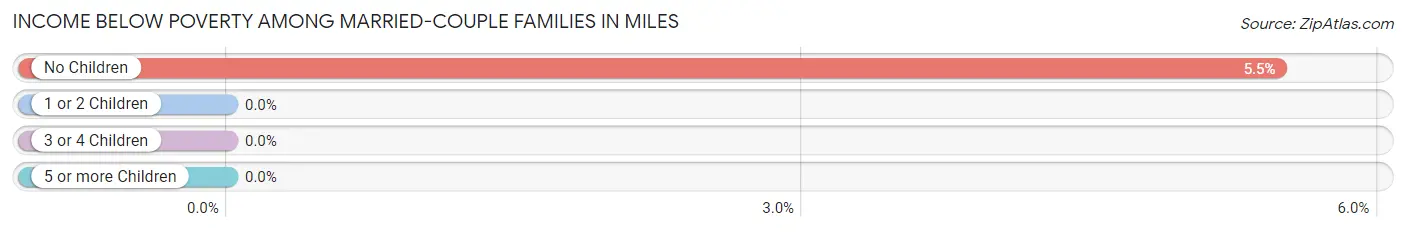
| Children | Above Poverty | Below Poverty |
| No Children | 69 (94.5%) | 4 (5.5%) |
| 1 or 2 Children | 20 (100.0%) | 0 (0.0%) |
| 3 or 4 Children | 10 (100.0%) | 0 (0.0%) |
| 5 or more Children | 0 (0.0%) | 0 (0.0%) |
| Total | 99 (96.1%) | 4 (3.9%) |
Income Below Poverty Among Single-Parent Households in Miles
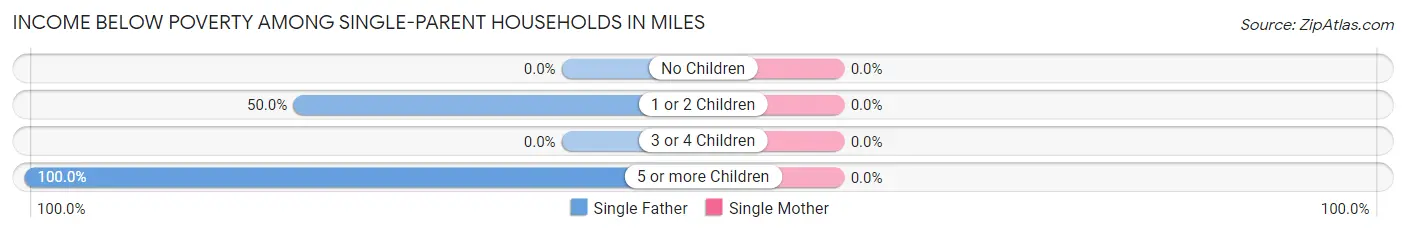
| Children | Single Father | Single Mother |
| No Children | 0 (0.0%) | 0 (0.0%) |
| 1 or 2 Children | 1 (50.0%) | 0 (0.0%) |
| 3 or 4 Children | 0 (0.0%) | 0 (0.0%) |
| 5 or more Children | 2 (100.0%) | 0 (0.0%) |
| Total | 3 (75.0%) | 0 (0.0%) |
Income Below Poverty Among Married-Couple vs Single-Parent Households in Miles
The poverty data for Miles shows that 4 of the married-couple family households (3.9%) and 3 of the single-parent households (30.0%) are living below the poverty level. Within the married-couple family households, those with no children have the highest poverty rate, with 4 households (5.5%) falling below the poverty line. Among the single-parent households, those with 5 or more children have the highest poverty rate, with 2 household (100.0%) living below poverty.
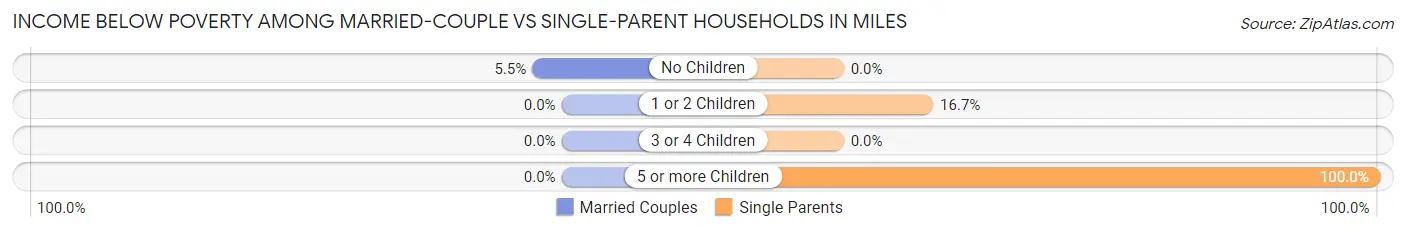
| Children | Married-Couple Families | Single-Parent Households |
| No Children | 4 (5.5%) | 0 (0.0%) |
| 1 or 2 Children | 0 (0.0%) | 1 (16.7%) |
| 3 or 4 Children | 0 (0.0%) | 0 (0.0%) |
| 5 or more Children | 0 (0.0%) | 2 (100.0%) |
| Total | 4 (3.9%) | 3 (30.0%) |
Race in Miles
The most populous races in Miles are White / Caucasian (376 | 94.5%), Two or more Races (19 | 4.8%), and Hispanic or Latino (3 | 0.7%).
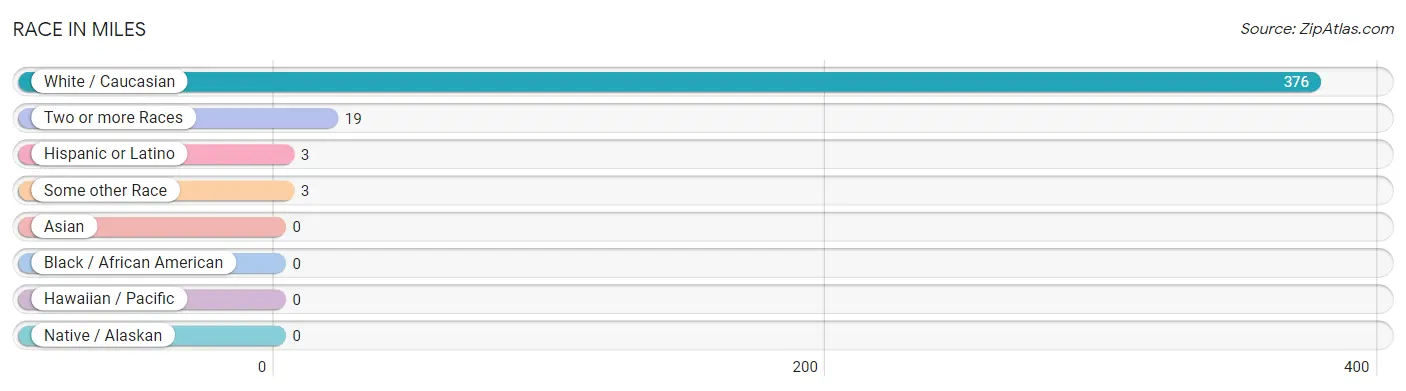
| Race | # Population | % Population |
| Asian | 0 | 0.0% |
| Black / African American | 0 | 0.0% |
| Hawaiian / Pacific | 0 | 0.0% |
| Hispanic or Latino | 3 | 0.7% |
| Native / Alaskan | 0 | 0.0% |
| White / Caucasian | 376 | 94.5% |
| Two or more Races | 19 | 4.8% |
| Some other Race | 3 | 0.7% |
| Total | 398 | 100.0% |
Ancestry in Miles
The most populous ancestries reported in Miles are German (236 | 59.3%), Irish (70 | 17.6%), Dutch (27 | 6.8%), English (22 | 5.5%), and European (11 | 2.8%), together accounting for 92.0% of all Miles residents.
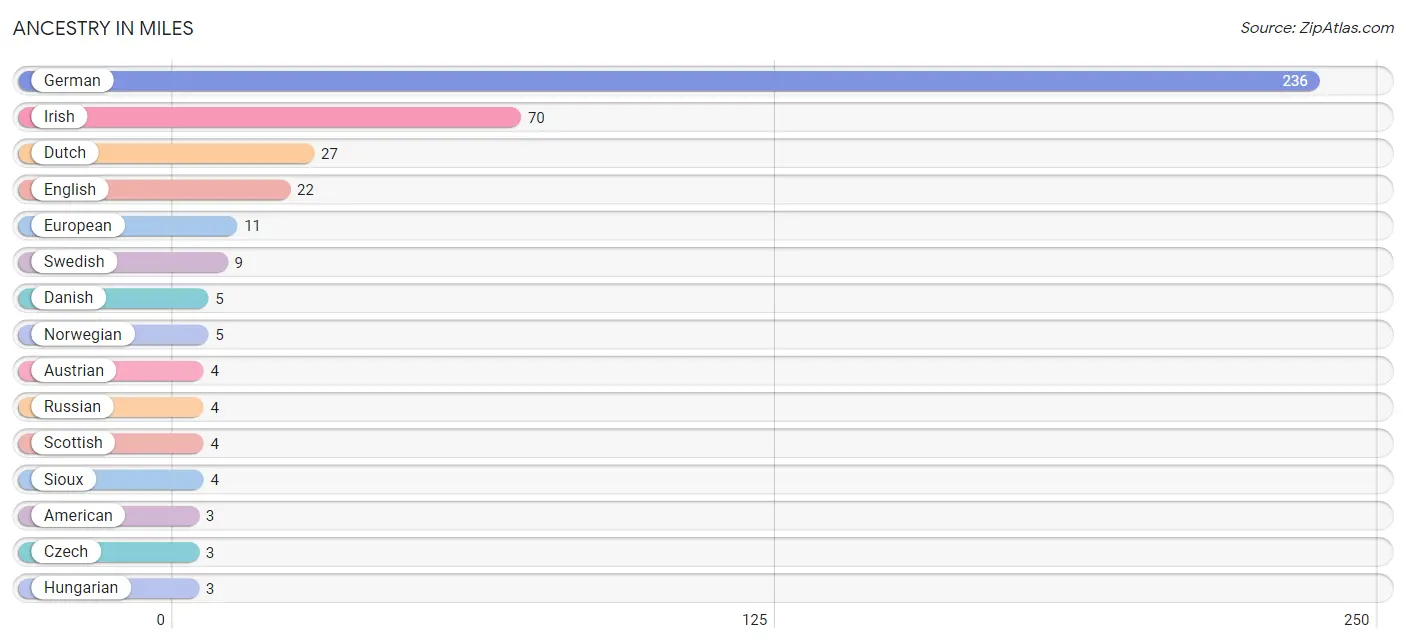
| Ancestry | # Population | % Population |
| American | 3 | 0.7% |
| Austrian | 4 | 1.0% |
| Czech | 3 | 0.7% |
| Danish | 5 | 1.3% |
| Dutch | 27 | 6.8% |
| English | 22 | 5.5% |
| European | 11 | 2.8% |
| French Canadian | 1 | 0.3% |
| German | 236 | 59.3% |
| Hungarian | 3 | 0.7% |
| Irish | 70 | 17.6% |
| Mexican | 3 | 0.7% |
| Northern European | 2 | 0.5% |
| Norwegian | 5 | 1.3% |
| Polish | 1 | 0.3% |
| Russian | 4 | 1.0% |
| Scottish | 4 | 1.0% |
| Sioux | 4 | 1.0% |
| Swedish | 9 | 2.3% |
| Welsh | 3 | 0.7% | View All 20 Rows |
Immigrants in Miles
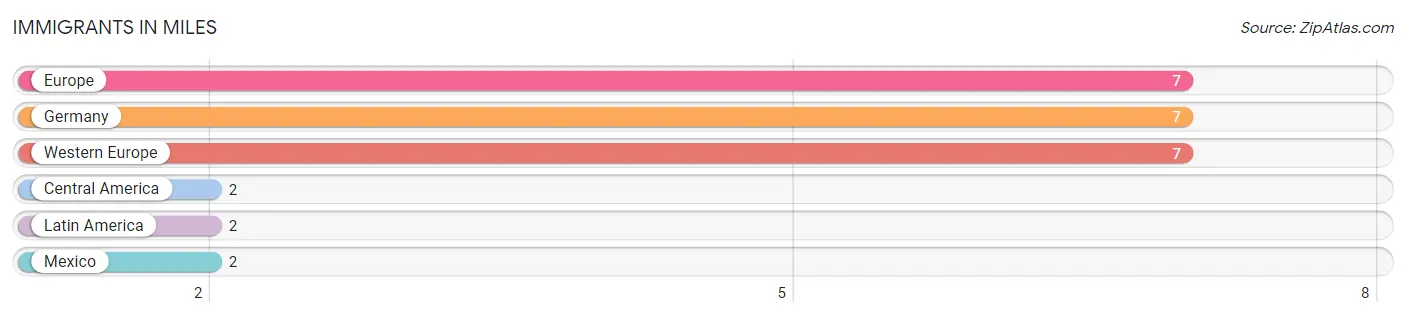
The most numerous immigrant groups reported in Miles came from Europe (7 | 1.8%), Germany (7 | 1.8%), Western Europe (7 | 1.8%), Central America (2 | 0.5%), and Latin America (2 | 0.5%), together accounting for 6.3% of all Miles residents.
| Immigration Origin | # Population | % Population |
| Central America | 2 | 0.5% |
| Europe | 7 | 1.8% |
| Germany | 7 | 1.8% |
| Latin America | 2 | 0.5% |
| Mexico | 2 | 0.5% |
| Western Europe | 7 | 1.8% | View All 6 Rows |
Sex and Age in Miles
Sex and Age in Miles
The most populous age groups in Miles are 45 to 49 Years (24 | 11.5%) for men and 70 to 74 Years (26 | 13.7%) for women.
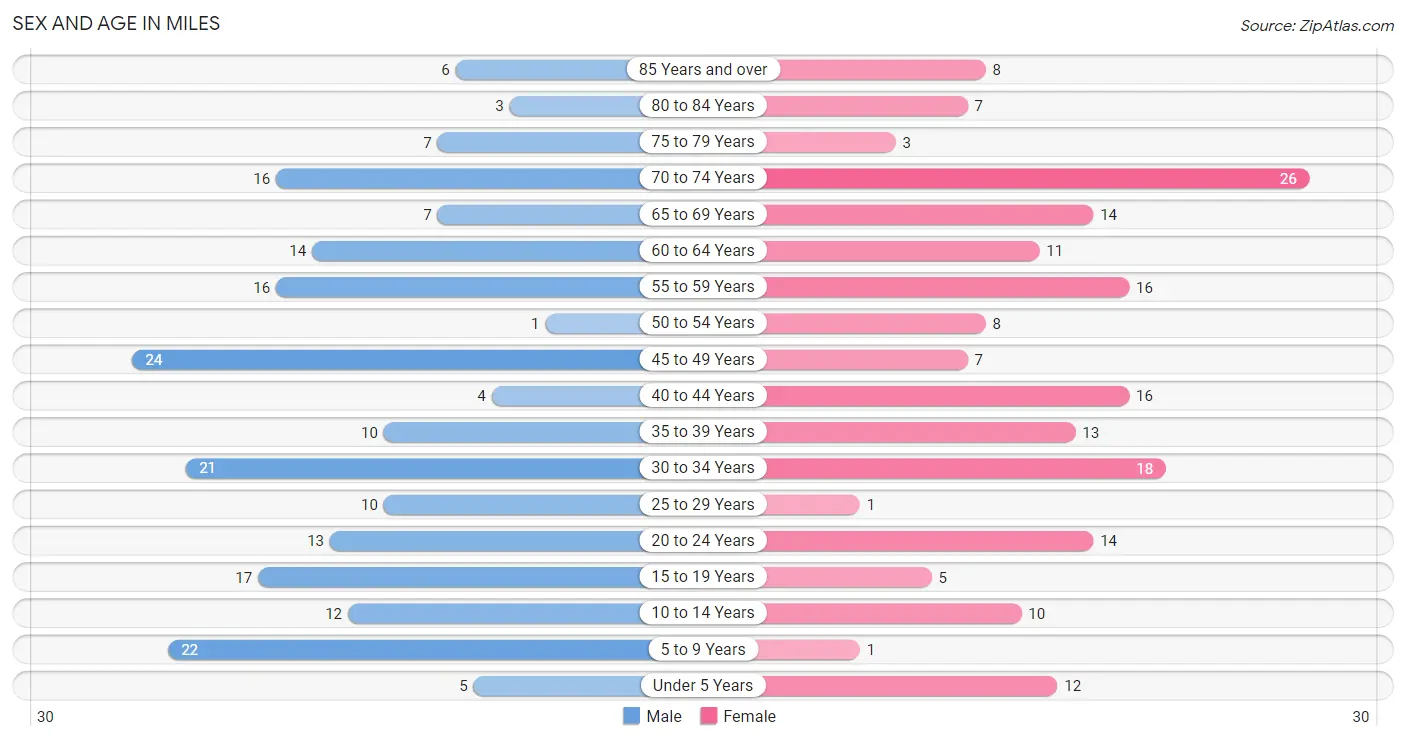
| Age Bracket | Male | Female |
| Under 5 Years | 5 (2.4%) | 12 (6.3%) |
| 5 to 9 Years | 22 (10.6%) | 1 (0.5%) |
| 10 to 14 Years | 12 (5.8%) | 10 (5.3%) |
| 15 to 19 Years | 17 (8.2%) | 5 (2.6%) |
| 20 to 24 Years | 13 (6.2%) | 14 (7.4%) |
| 25 to 29 Years | 10 (4.8%) | 1 (0.5%) |
| 30 to 34 Years | 21 (10.1%) | 18 (9.5%) |
| 35 to 39 Years | 10 (4.8%) | 13 (6.8%) |
| 40 to 44 Years | 4 (1.9%) | 16 (8.4%) |
| 45 to 49 Years | 24 (11.5%) | 7 (3.7%) |
| 50 to 54 Years | 1 (0.5%) | 8 (4.2%) |
| 55 to 59 Years | 16 (7.7%) | 16 (8.4%) |
| 60 to 64 Years | 14 (6.7%) | 11 (5.8%) |
| 65 to 69 Years | 7 (3.4%) | 14 (7.4%) |
| 70 to 74 Years | 16 (7.7%) | 26 (13.7%) |
| 75 to 79 Years | 7 (3.4%) | 3 (1.6%) |
| 80 to 84 Years | 3 (1.4%) | 7 (3.7%) |
| 85 Years and over | 6 (2.9%) | 8 (4.2%) |
| Total | 208 (100.0%) | 190 (100.0%) |
Families and Households in Miles
Median Family Size in Miles
The median family size in Miles is 2.67 persons per family, with single male/father families (4 | 3.5%) accounting for the largest median family size of 3.5 persons per family. On the other hand, single female/mother families (6 | 5.3%) represent the smallest median family size with 1.83 persons per family.
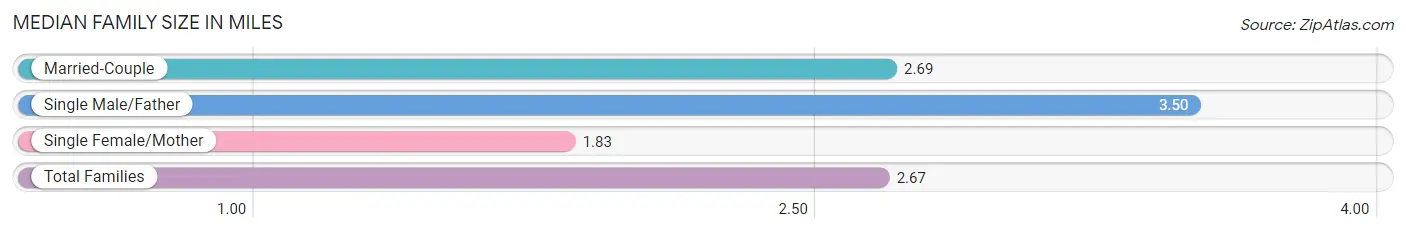
| Family Type | # Families | Family Size |
| Married-Couple | 103 (91.1%) | 2.69 |
| Single Male/Father | 4 (3.5%) | 3.50 |
| Single Female/Mother | 6 (5.3%) | 1.83 |
| Total Families | 113 (100.0%) | 2.67 |
Median Household Size in Miles
The median household size in Miles is 2.16 persons per household, with single male/father households (4 | 2.2%) accounting for the largest median household size of 4 persons per household. non-family households (71 | 38.6%) represent the smallest median household size with 1.18 persons per household.
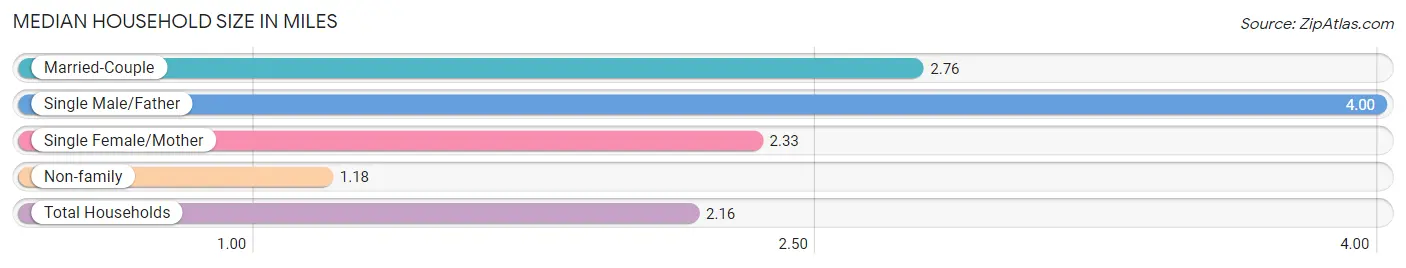
| Household Type | # Households | Household Size |
| Married-Couple | 103 (56.0%) | 2.76 |
| Single Male/Father | 4 (2.2%) | 4.00 |
| Single Female/Mother | 6 (3.3%) | 2.33 |
| Non-family | 71 (38.6%) | 1.18 |
| Total Households | 184 (100.0%) | 2.16 |
Household Size by Marriage Status in Miles
Out of a total of 184 households in Miles, 113 (61.4%) are family households, while 71 (38.6%) are nonfamily households. The most numerous type of family households are 2-person households, comprising 66, and the most common type of nonfamily households are 1-person households, comprising 58.
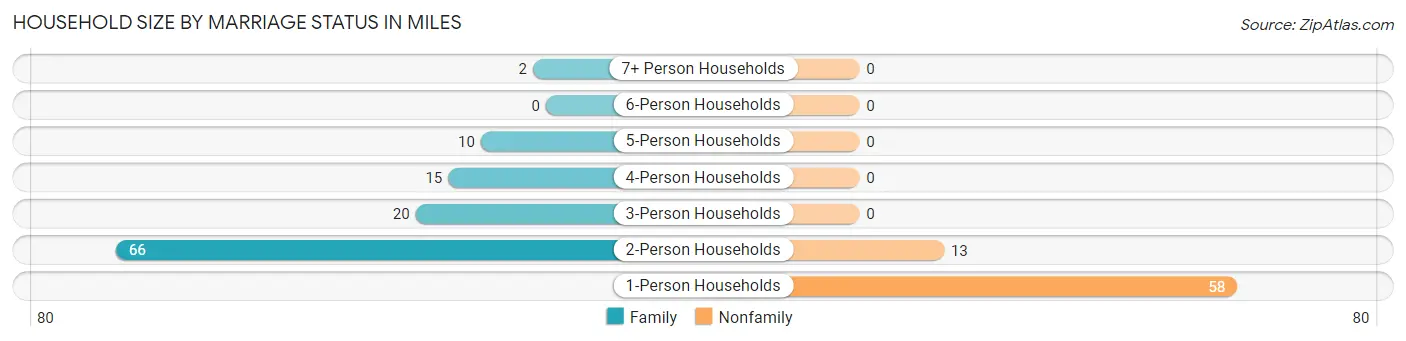
| Household Size | Family Households | Nonfamily Households |
| 1-Person Households | - | 58 (31.5%) |
| 2-Person Households | 66 (35.9%) | 13 (7.1%) |
| 3-Person Households | 20 (10.9%) | 0 (0.0%) |
| 4-Person Households | 15 (8.2%) | 0 (0.0%) |
| 5-Person Households | 10 (5.4%) | 0 (0.0%) |
| 6-Person Households | 0 (0.0%) | 0 (0.0%) |
| 7+ Person Households | 2 (1.1%) | 0 (0.0%) |
| Total | 113 (61.4%) | 71 (38.6%) |
Female Fertility in Miles
Fertility by Age in Miles
Average fertility rate in Miles is 26.0 births per 1,000 women. Women in the age bracket of 20 to 34 years have the highest fertility rate with 61.0 births per 1,000 women. Women in the age bracket of 20 to 34 years acount for 100.0% of all women with births.
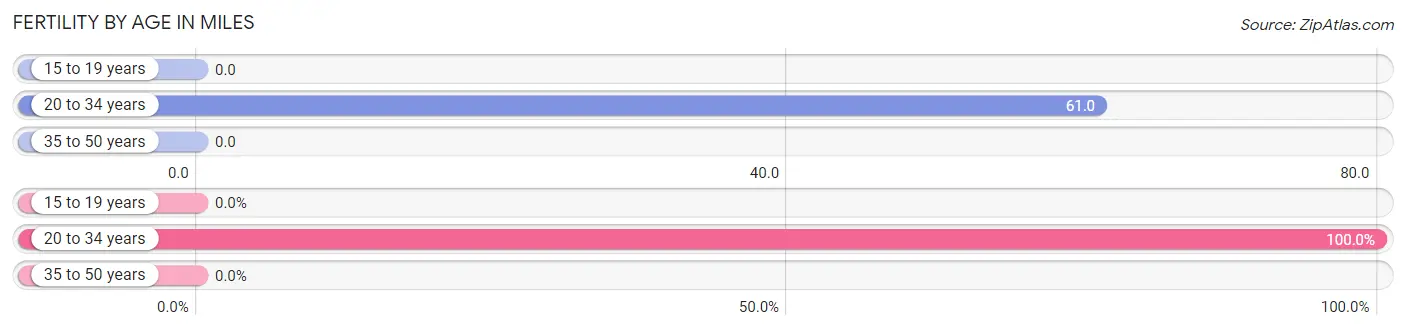
| Age Bracket | Women with Births | Births / 1,000 Women |
| 15 to 19 years | 0 (0.0%) | 0.0 |
| 20 to 34 years | 2 (100.0%) | 61.0 |
| 35 to 50 years | 0 (0.0%) | 0.0 |
| Total | 2 (100.0%) | 26.0 |
Fertility by Age by Marriage Status in Miles
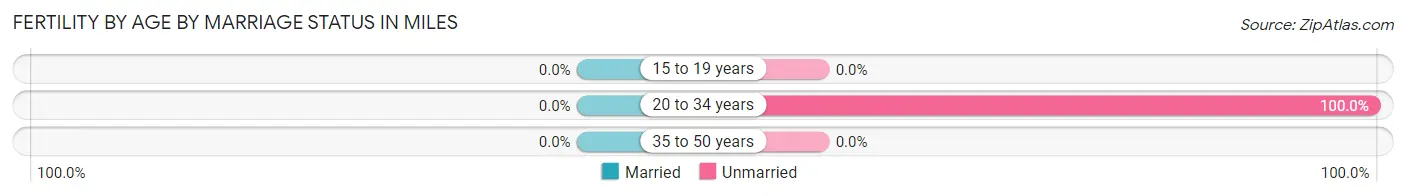
| Age Bracket | Married | Unmarried |
| 15 to 19 years | 0 (0.0%) | 0 (0.0%) |
| 20 to 34 years | 0 (0.0%) | 2 (100.0%) |
| 35 to 50 years | 0 (0.0%) | 0 (0.0%) |
| Total | 0 (0.0%) | 2 (100.0%) |
Fertility by Education in Miles
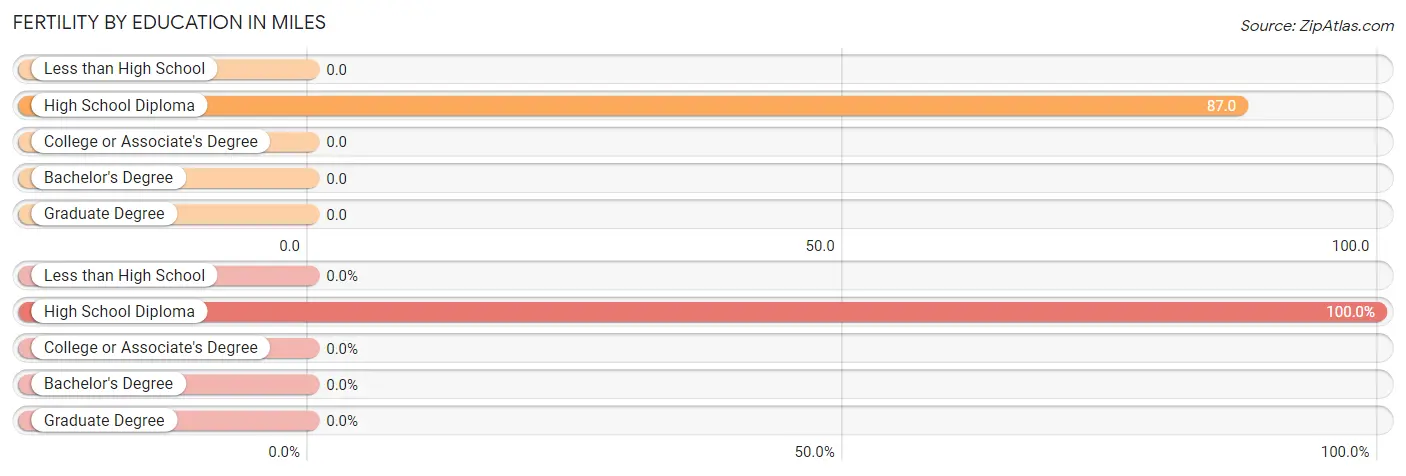
| Educational Attainment | Women with Births | Births / 1,000 Women |
| Less than High School | 0 (0.0%) | 0.0 |
| High School Diploma | 2 (100.0%) | 87.0 |
| College or Associate's Degree | 0 (0.0%) | 0.0 |
| Bachelor's Degree | 0 (0.0%) | 0.0 |
| Graduate Degree | 0 (0.0%) | 0.0 |
| Total | 2 (100.0%) | 26.0 |
Fertility by Education by Marriage Status in Miles
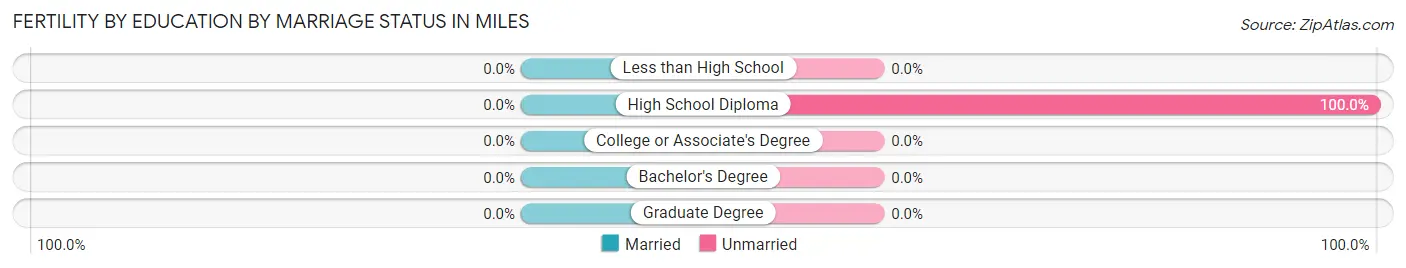
| Educational Attainment | Married | Unmarried |
| Less than High School | 0 (0.0%) | 0 (0.0%) |
| High School Diploma | 0 (0.0%) | 2 (100.0%) |
| College or Associate's Degree | 0 (0.0%) | 0 (0.0%) |
| Bachelor's Degree | 0 (0.0%) | 0 (0.0%) |
| Graduate Degree | 0 (0.0%) | 0 (0.0%) |
| Total | 0 (0.0%) | 2 (100.0%) |
Employment Characteristics in Miles
Employment by Class of Employer in Miles
Among the 192 employed individuals in Miles, private company employees (132 | 68.8%), local government employees (17 | 8.8%), and self-employed (not incorporated) (11 | 5.7%) make up the most common classes of employment.
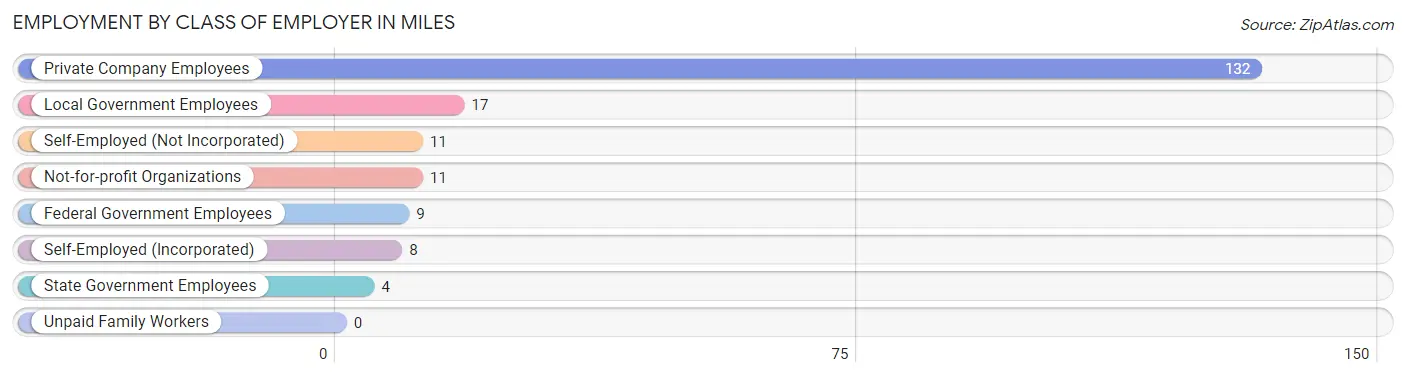
| Employer Class | # Employees | % Employees |
| Private Company Employees | 132 | 68.8% |
| Self-Employed (Incorporated) | 8 | 4.2% |
| Self-Employed (Not Incorporated) | 11 | 5.7% |
| Not-for-profit Organizations | 11 | 5.7% |
| Local Government Employees | 17 | 8.8% |
| State Government Employees | 4 | 2.1% |
| Federal Government Employees | 9 | 4.7% |
| Unpaid Family Workers | 0 | 0.0% |
| Total | 192 | 100.0% |
Employment Status by Age in Miles
According to the labor force statistics for Miles, out of the total population over 16 years of age (333), 59.8% or 199 individuals are in the labor force, with 1.5% or 3 of them unemployed. The age group with the highest labor force participation rate is 20 to 24 years, with 100.0% or 27 individuals in the labor force. Within the labor force, the 16 to 19 years age range has the highest percentage of unemployed individuals, with 20.0% or 1 of them being unemployed.
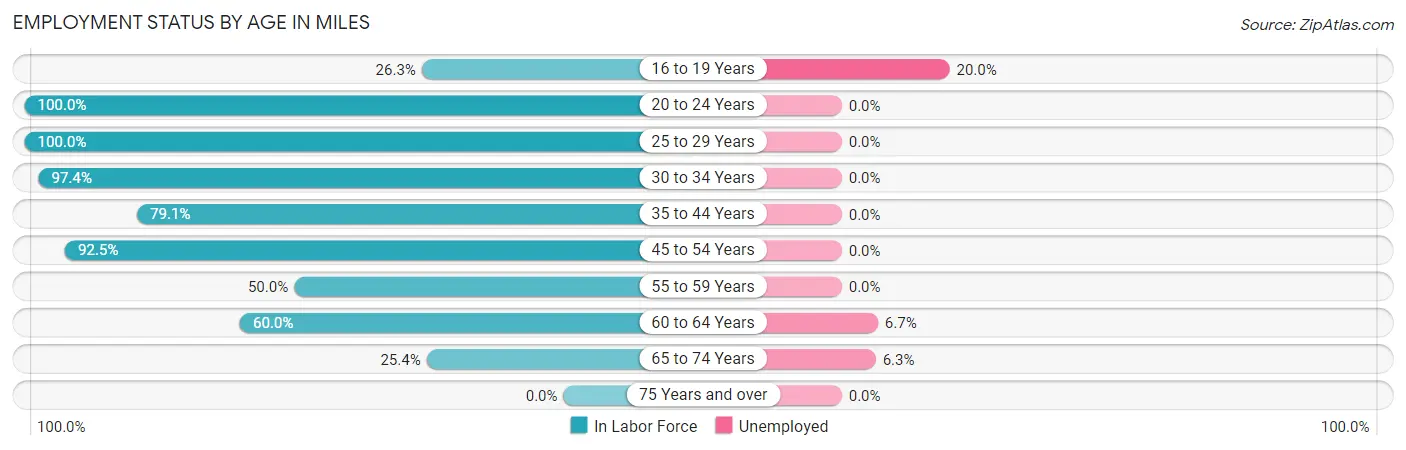
| Age Bracket | In Labor Force | Unemployed |
| 16 to 19 Years | 5 (26.3%) | 1 (20.0%) |
| 20 to 24 Years | 27 (100.0%) | 0 (0.0%) |
| 25 to 29 Years | 11 (100.0%) | 0 (0.0%) |
| 30 to 34 Years | 38 (97.4%) | 0 (0.0%) |
| 35 to 44 Years | 34 (79.1%) | 0 (0.0%) |
| 45 to 54 Years | 37 (92.5%) | 0 (0.0%) |
| 55 to 59 Years | 16 (50.0%) | 0 (0.0%) |
| 60 to 64 Years | 15 (60.0%) | 1 (6.7%) |
| 65 to 74 Years | 16 (25.4%) | 1 (6.3%) |
| 75 Years and over | 0 (0.0%) | 0 (0.0%) |
| Total | 199 (59.8%) | 3 (1.5%) |
Employment Status by Educational Attainment in Miles
According to labor force statistics for Miles, 79.5% of individuals (151) out of the total population between 25 and 64 years of age (190) are in the labor force, with 0.7% or 1 of them being unemployed. The group with the highest labor force participation rate are those with the educational attainment of less than high school, with 91.7% or 11 individuals in the labor force. Within the labor force, individuals with less than high school education have the highest percentage of unemployment, with 9.1% or 1 of them being unemployed.
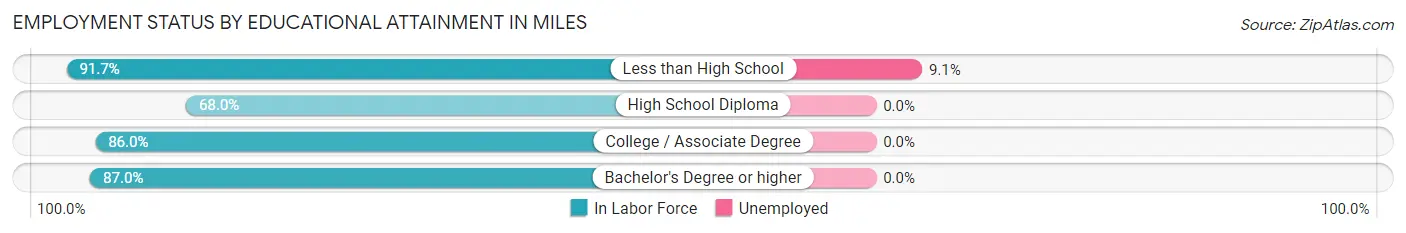
| Educational Attainment | In Labor Force | Unemployed |
| Less than High School | 11 (91.7%) | 1 (9.1%) |
| High School Diploma | 51 (68.0%) | 0 (0.0%) |
| College / Associate Degree | 49 (86.0%) | 0 (0.0%) |
| Bachelor's Degree or higher | 40 (87.0%) | 0 (0.0%) |
| Total | 151 (79.5%) | 1 (0.7%) |
Employment Occupations by Sex in Miles
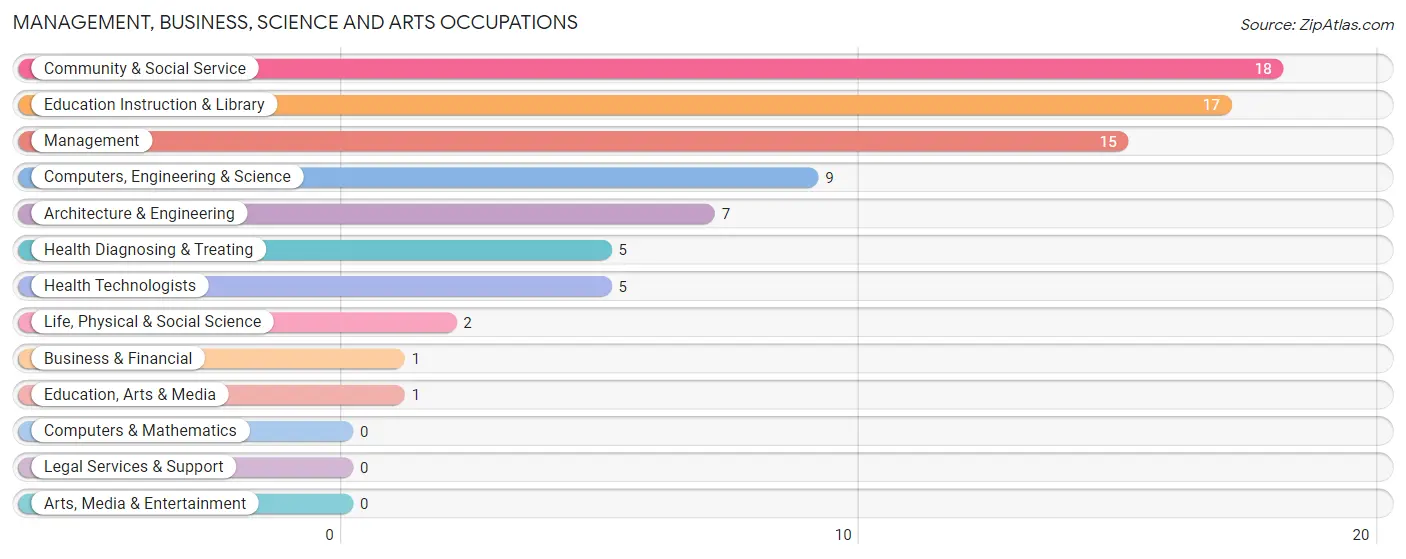
Management, Business, Science and Arts Occupations
The most common Management, Business, Science and Arts occupations in Miles are Community & Social Service (18 | 9.2%), Education Instruction & Library (17 | 8.7%), Management (15 | 7.6%), Computers, Engineering & Science (9 | 4.6%), and Architecture & Engineering (7 | 3.6%).
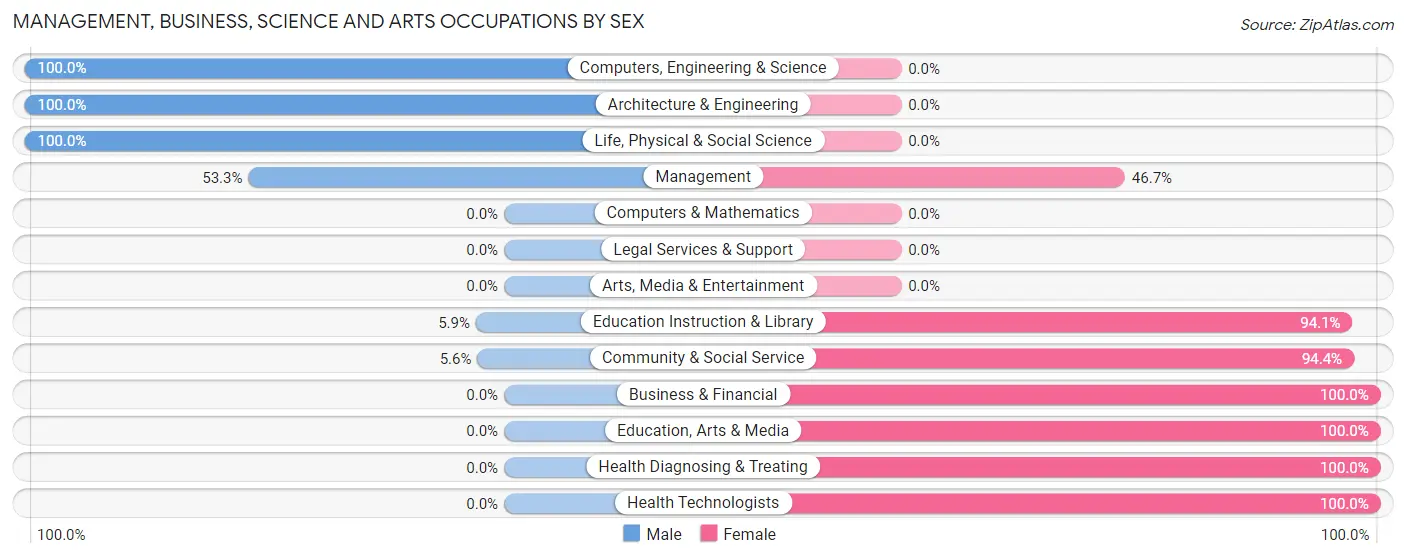
Management, Business, Science and Arts Occupations by Sex
Within the Management, Business, Science and Arts occupations in Miles, the most male-oriented occupations are Computers, Engineering & Science (100.0%), Architecture & Engineering (100.0%), and Life, Physical & Social Science (100.0%), while the most female-oriented occupations are Business & Financial (100.0%), Education, Arts & Media (100.0%), and Health Diagnosing & Treating (100.0%).
| Occupation | Male | Female |
| Management | 8 (53.3%) | 7 (46.7%) |
| Business & Financial | 0 (0.0%) | 1 (100.0%) |
| Computers, Engineering & Science | 9 (100.0%) | 0 (0.0%) |
| Computers & Mathematics | 0 (0.0%) | 0 (0.0%) |
| Architecture & Engineering | 7 (100.0%) | 0 (0.0%) |
| Life, Physical & Social Science | 2 (100.0%) | 0 (0.0%) |
| Community & Social Service | 1 (5.6%) | 17 (94.4%) |
| Education, Arts & Media | 0 (0.0%) | 1 (100.0%) |
| Legal Services & Support | 0 (0.0%) | 0 (0.0%) |
| Education Instruction & Library | 1 (5.9%) | 16 (94.1%) |
| Arts, Media & Entertainment | 0 (0.0%) | 0 (0.0%) |
| Health Diagnosing & Treating | 0 (0.0%) | 5 (100.0%) |
| Health Technologists | 0 (0.0%) | 5 (100.0%) |
| Total (Category) | 18 (37.5%) | 30 (62.5%) |
| Total (Overall) | 110 (56.1%) | 86 (43.9%) |
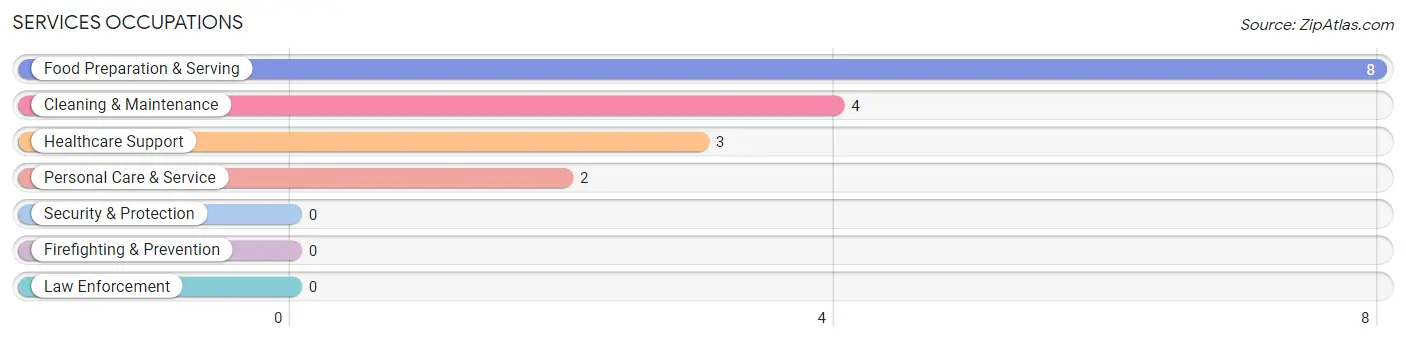
Services Occupations
The most common Services occupations in Miles are Food Preparation & Serving (8 | 4.1%), Cleaning & Maintenance (4 | 2.0%), Healthcare Support (3 | 1.5%), and Personal Care & Service (2 | 1.0%).
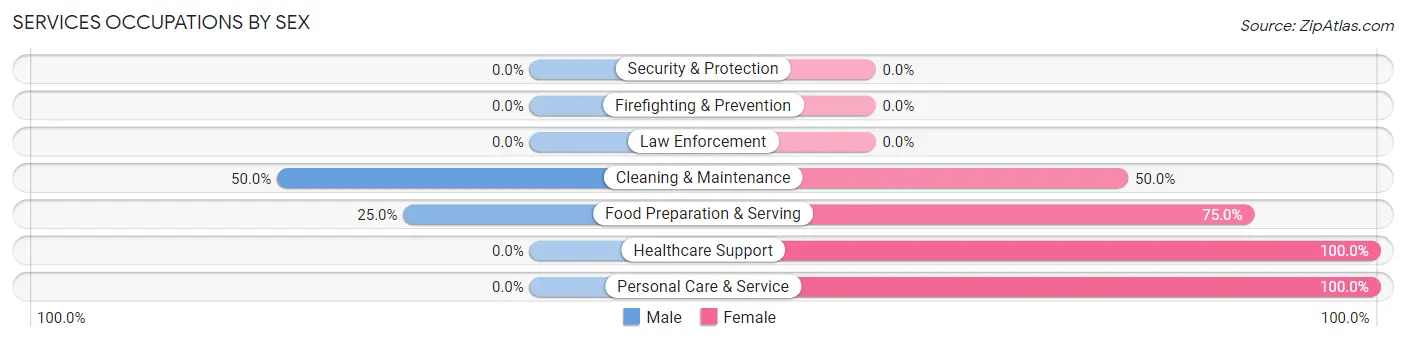
Services Occupations by Sex
Within the Services occupations in Miles, the most male-oriented occupations are Cleaning & Maintenance (50.0%), and Food Preparation & Serving (25.0%), while the most female-oriented occupations are Healthcare Support (100.0%), Personal Care & Service (100.0%), and Food Preparation & Serving (75.0%).
| Occupation | Male | Female |
| Healthcare Support | 0 (0.0%) | 3 (100.0%) |
| Security & Protection | 0 (0.0%) | 0 (0.0%) |
| Firefighting & Prevention | 0 (0.0%) | 0 (0.0%) |
| Law Enforcement | 0 (0.0%) | 0 (0.0%) |
| Food Preparation & Serving | 2 (25.0%) | 6 (75.0%) |
| Cleaning & Maintenance | 2 (50.0%) | 2 (50.0%) |
| Personal Care & Service | 0 (0.0%) | 2 (100.0%) |
| Total (Category) | 4 (23.5%) | 13 (76.5%) |
| Total (Overall) | 110 (56.1%) | 86 (43.9%) |
Sales and Office Occupations
The most common Sales and Office occupations in Miles are Office & Administration (22 | 11.2%), and Sales & Related (13 | 6.6%).
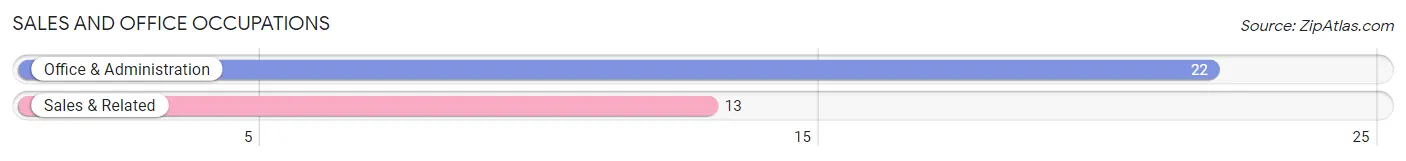
Sales and Office Occupations by Sex
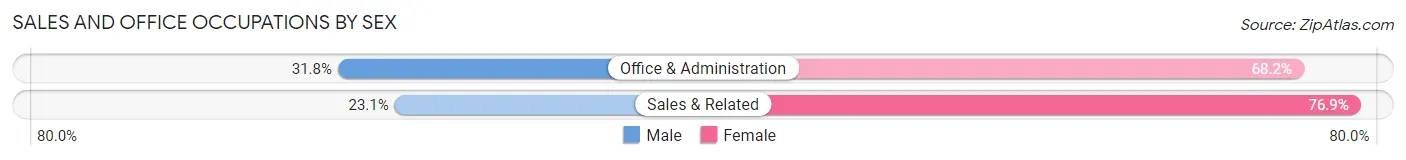
| Occupation | Male | Female |
| Sales & Related | 3 (23.1%) | 10 (76.9%) |
| Office & Administration | 7 (31.8%) | 15 (68.2%) |
| Total (Category) | 10 (28.6%) | 25 (71.4%) |
| Total (Overall) | 110 (56.1%) | 86 (43.9%) |
Natural Resources, Construction and Maintenance Occupations
The most common Natural Resources, Construction and Maintenance occupations in Miles are Construction & Extraction (27 | 13.8%), and Installation, Maintenance & Repair (11 | 5.6%).
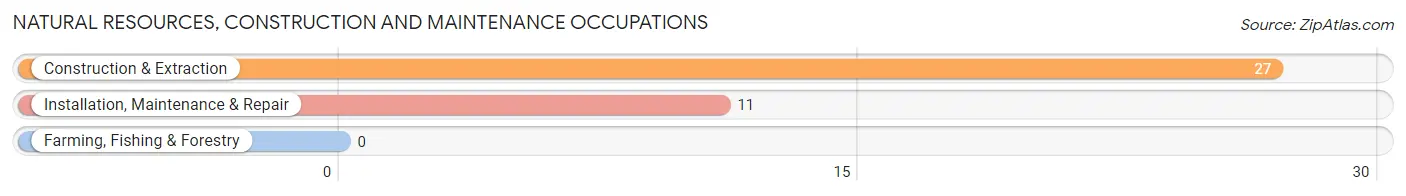
Natural Resources, Construction and Maintenance Occupations by Sex
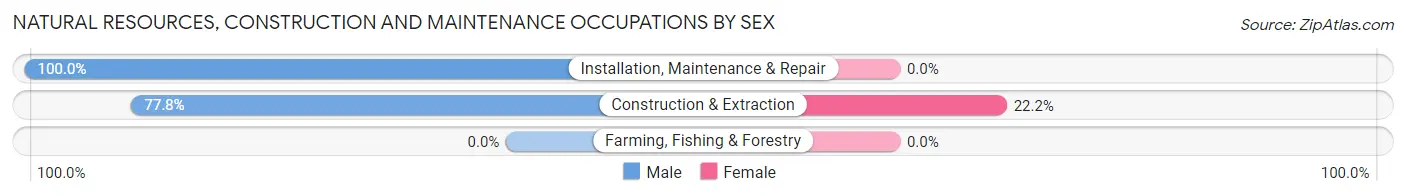
| Occupation | Male | Female |
| Farming, Fishing & Forestry | 0 (0.0%) | 0 (0.0%) |
| Construction & Extraction | 21 (77.8%) | 6 (22.2%) |
| Installation, Maintenance & Repair | 11 (100.0%) | 0 (0.0%) |
| Total (Category) | 32 (84.2%) | 6 (15.8%) |
| Total (Overall) | 110 (56.1%) | 86 (43.9%) |
Production, Transportation and Moving Occupations
The most common Production, Transportation and Moving occupations in Miles are Production (33 | 16.8%), Transportation (17 | 8.7%), and Material Moving (8 | 4.1%).
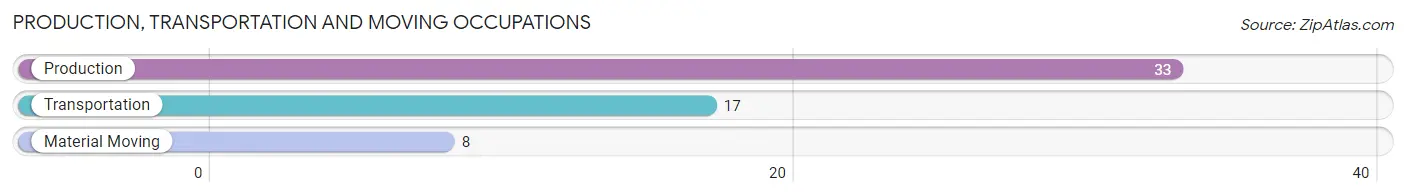
Production, Transportation and Moving Occupations by Sex
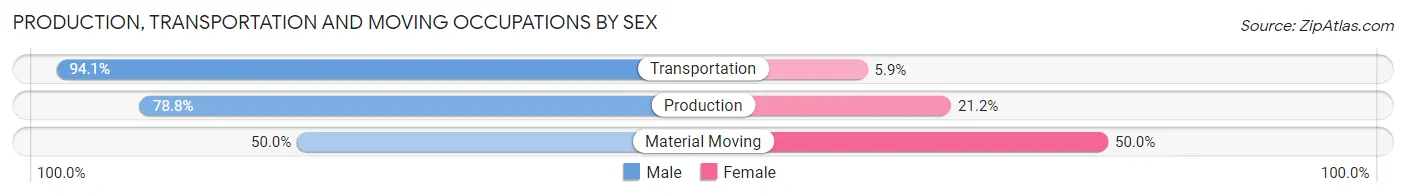
| Occupation | Male | Female |
| Production | 26 (78.8%) | 7 (21.2%) |
| Transportation | 16 (94.1%) | 1 (5.9%) |
| Material Moving | 4 (50.0%) | 4 (50.0%) |
| Total (Category) | 46 (79.3%) | 12 (20.7%) |
| Total (Overall) | 110 (56.1%) | 86 (43.9%) |
Employment Industries by Sex in Miles
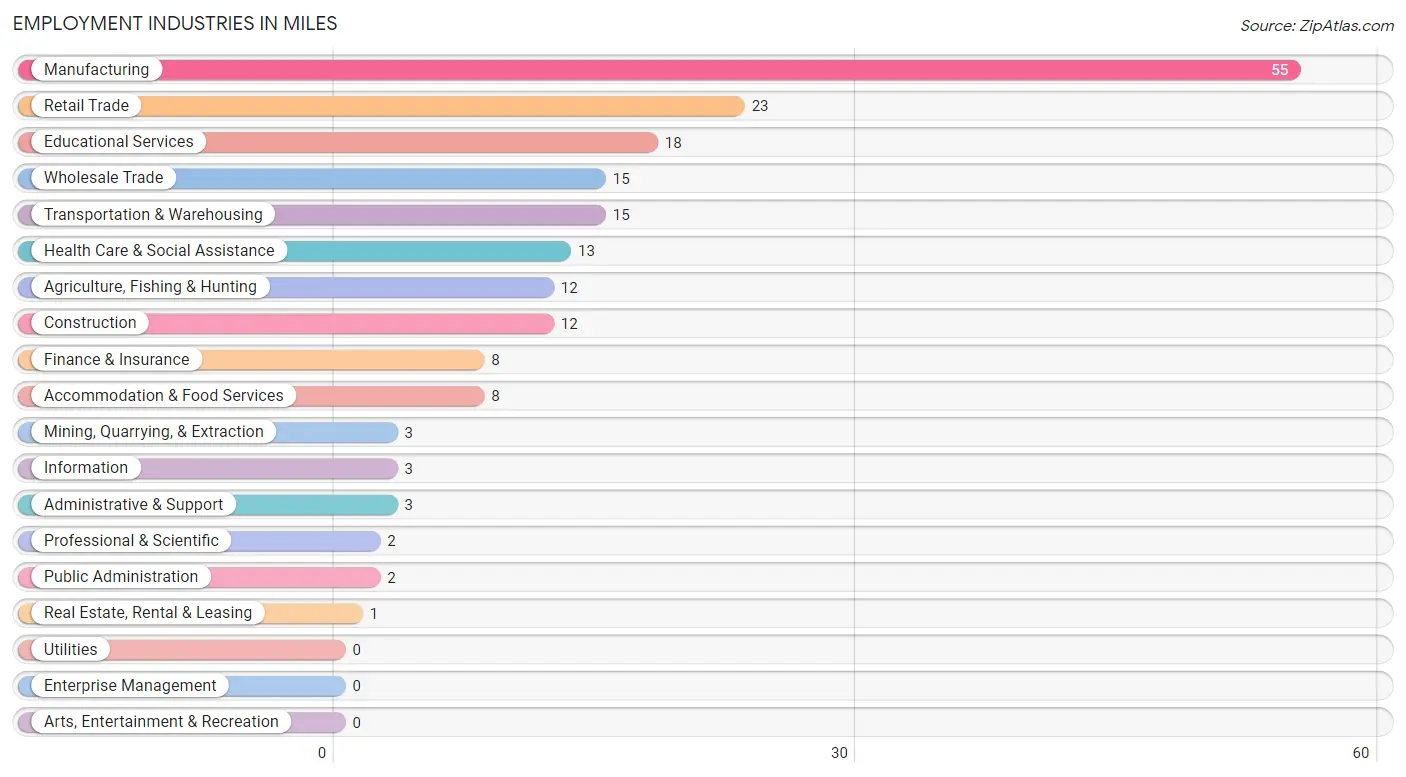
Employment Industries in Miles
The major employment industries in Miles include Manufacturing (55 | 28.1%), Retail Trade (23 | 11.7%), Educational Services (18 | 9.2%), Wholesale Trade (15 | 7.6%), and Transportation & Warehousing (15 | 7.6%).
Employment Industries by Sex in Miles
The Miles industries that see more men than women are Agriculture, Fishing & Hunting (100.0%), Mining, Quarrying, & Extraction (100.0%), and Construction (100.0%), whereas the industries that tend to have a higher number of women are Information (100.0%), Finance & Insurance (100.0%), and Real Estate, Rental & Leasing (100.0%).
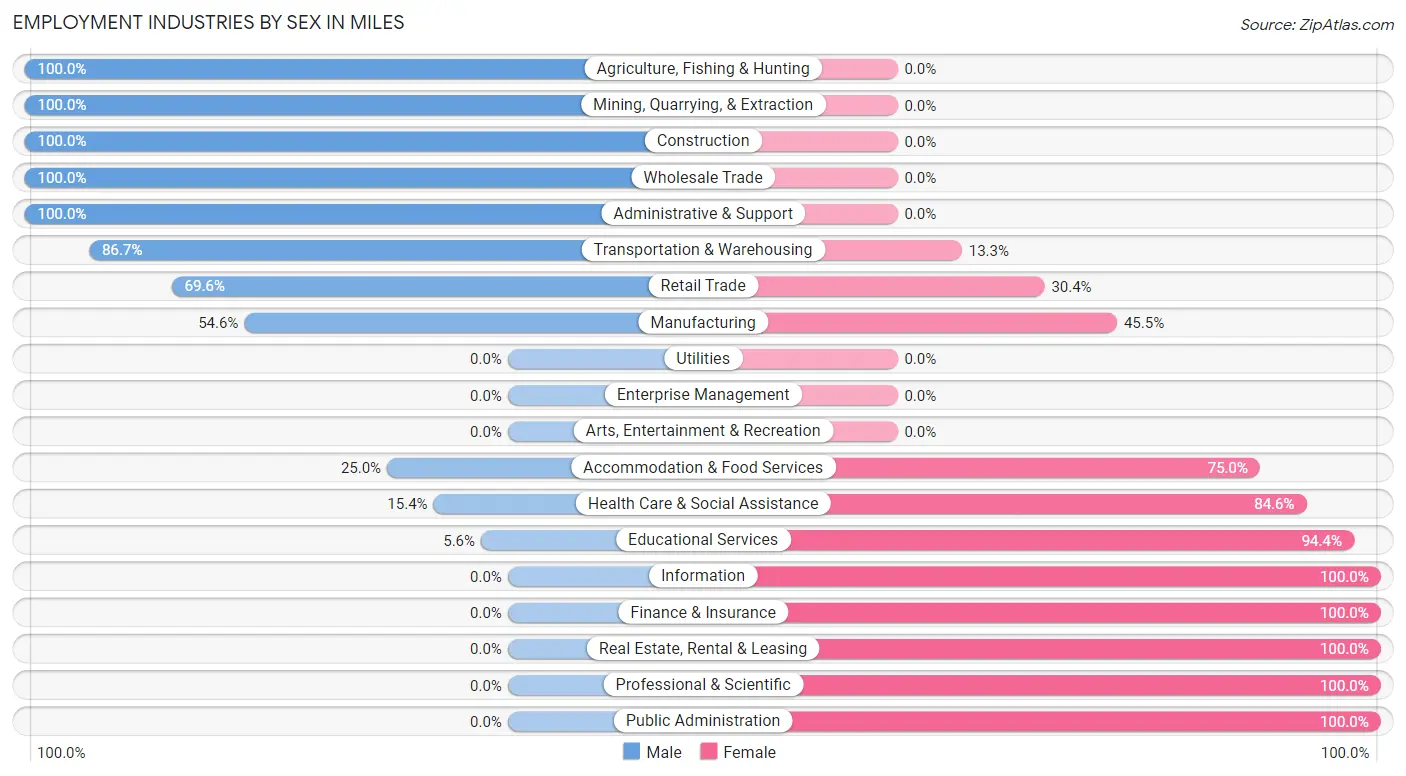
| Industry | Male | Female |
| Agriculture, Fishing & Hunting | 12 (100.0%) | 0 (0.0%) |
| Mining, Quarrying, & Extraction | 3 (100.0%) | 0 (0.0%) |
| Construction | 12 (100.0%) | 0 (0.0%) |
| Manufacturing | 30 (54.5%) | 25 (45.5%) |
| Wholesale Trade | 15 (100.0%) | 0 (0.0%) |
| Retail Trade | 16 (69.6%) | 7 (30.4%) |
| Transportation & Warehousing | 13 (86.7%) | 2 (13.3%) |
| Utilities | 0 (0.0%) | 0 (0.0%) |
| Information | 0 (0.0%) | 3 (100.0%) |
| Finance & Insurance | 0 (0.0%) | 8 (100.0%) |
| Real Estate, Rental & Leasing | 0 (0.0%) | 1 (100.0%) |
| Professional & Scientific | 0 (0.0%) | 2 (100.0%) |
| Enterprise Management | 0 (0.0%) | 0 (0.0%) |
| Administrative & Support | 3 (100.0%) | 0 (0.0%) |
| Educational Services | 1 (5.6%) | 17 (94.4%) |
| Health Care & Social Assistance | 2 (15.4%) | 11 (84.6%) |
| Arts, Entertainment & Recreation | 0 (0.0%) | 0 (0.0%) |
| Accommodation & Food Services | 2 (25.0%) | 6 (75.0%) |
| Public Administration | 0 (0.0%) | 2 (100.0%) |
| Total | 110 (56.1%) | 86 (43.9%) |
Education in Miles
School Enrollment in Miles
The most common levels of schooling among the 84 students in Miles are elementary school (23 | 27.4%), high school (21 | 25.0%), and middle school (18 | 21.4%).
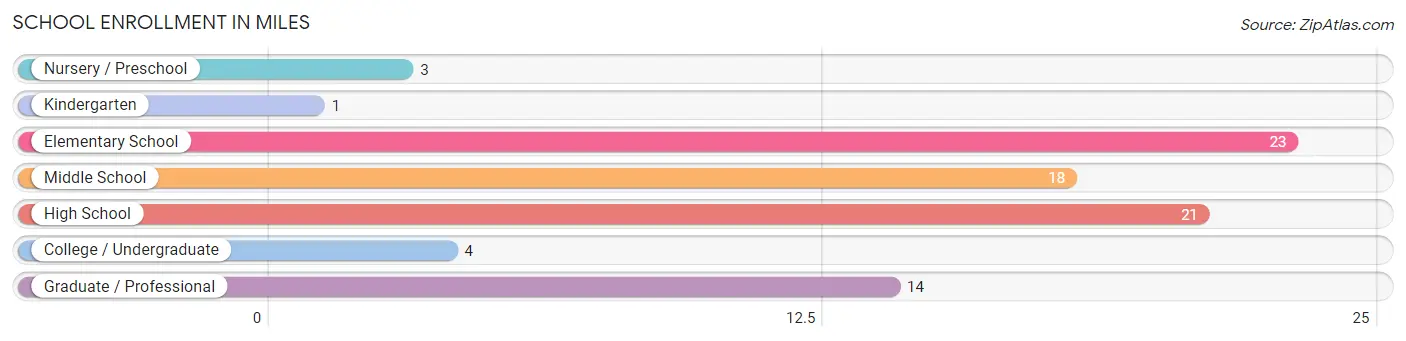
| School Level | # Students | % Students |
| Nursery / Preschool | 3 | 3.6% |
| Kindergarten | 1 | 1.2% |
| Elementary School | 23 | 27.4% |
| Middle School | 18 | 21.4% |
| High School | 21 | 25.0% |
| College / Undergraduate | 4 | 4.8% |
| Graduate / Professional | 14 | 16.7% |
| Total | 84 | 100.0% |
School Enrollment by Age by Funding Source in Miles
Out of a total of 84 students who are enrolled in schools in Miles, 14 (16.7%) attend a private institution, while the remaining 70 (83.3%) are enrolled in public schools. The age group of 20 to 24 year olds has the highest likelihood of being enrolled in private schools, with 4 (100.0% in the age bracket) enrolled. Conversely, the age group of 3 to 4 year olds has the lowest likelihood of being enrolled in a private school, with 3 (100.0% in the age bracket) attending a public institution.
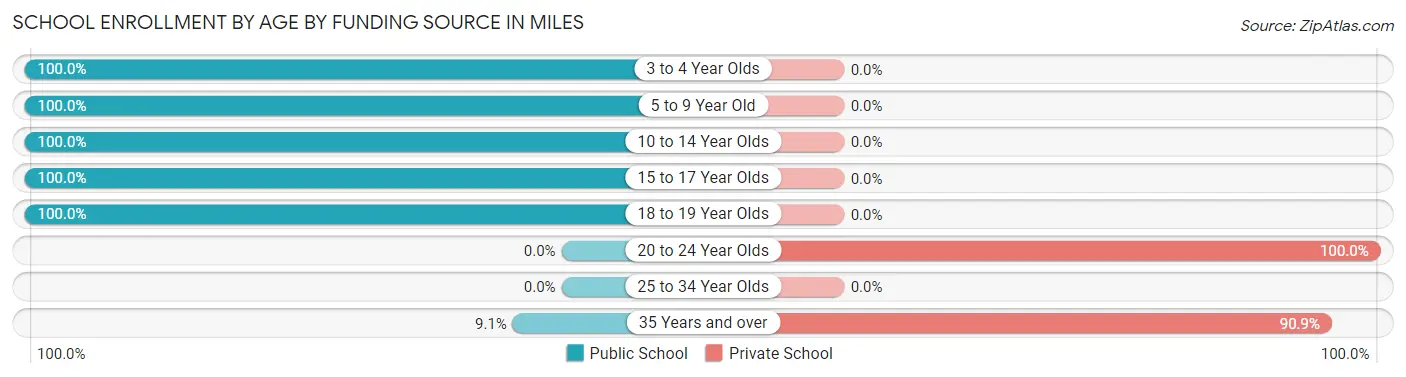
| Age Bracket | Public School | Private School |
| 3 to 4 Year Olds | 3 (100.0%) | 0 (0.0%) |
| 5 to 9 Year Old | 23 (100.0%) | 0 (0.0%) |
| 10 to 14 Year Olds | 22 (100.0%) | 0 (0.0%) |
| 15 to 17 Year Olds | 18 (100.0%) | 0 (0.0%) |
| 18 to 19 Year Olds | 3 (100.0%) | 0 (0.0%) |
| 20 to 24 Year Olds | 0 (0.0%) | 4 (100.0%) |
| 25 to 34 Year Olds | 0 (0.0%) | 0 (0.0%) |
| 35 Years and over | 1 (9.1%) | 10 (90.9%) |
| Total | 70 (83.3%) | 14 (16.7%) |
Educational Attainment by Field of Study in Miles
Business (16 | 27.1%), education (14 | 23.7%), science & technology (10 | 17.0%), arts & humanities (9 | 15.2%), and social sciences (5 | 8.5%) are the most common fields of study among 59 individuals in Miles who have obtained a bachelor's degree or higher.
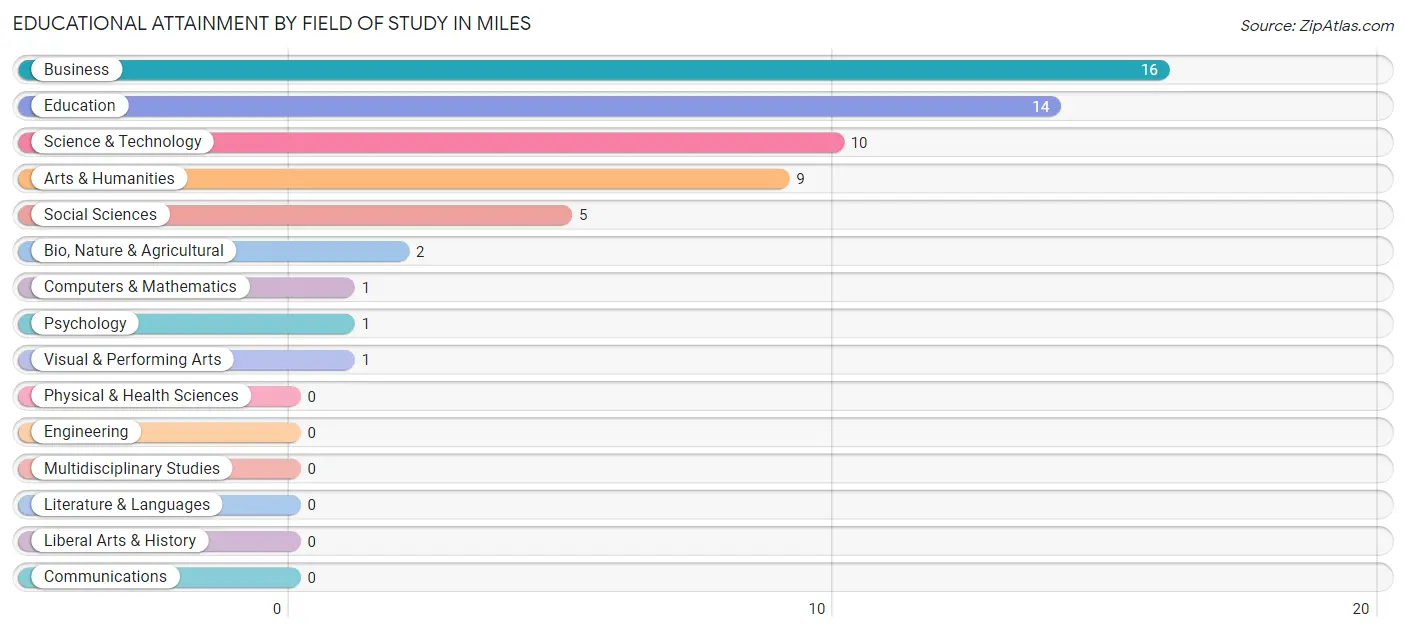
| Field of Study | # Graduates | % Graduates |
| Computers & Mathematics | 1 | 1.7% |
| Bio, Nature & Agricultural | 2 | 3.4% |
| Physical & Health Sciences | 0 | 0.0% |
| Psychology | 1 | 1.7% |
| Social Sciences | 5 | 8.5% |
| Engineering | 0 | 0.0% |
| Multidisciplinary Studies | 0 | 0.0% |
| Science & Technology | 10 | 17.0% |
| Business | 16 | 27.1% |
| Education | 14 | 23.7% |
| Literature & Languages | 0 | 0.0% |
| Liberal Arts & History | 0 | 0.0% |
| Visual & Performing Arts | 1 | 1.7% |
| Communications | 0 | 0.0% |
| Arts & Humanities | 9 | 15.2% |
| Total | 59 | 100.0% |
Transportation & Commute in Miles
Vehicle Availability by Sex in Miles
The most prevalent vehicle ownership categories in Miles are males with 3 vehicles (50, accounting for 45.5%) and females with 3 vehicles (32, making up 61.0%).
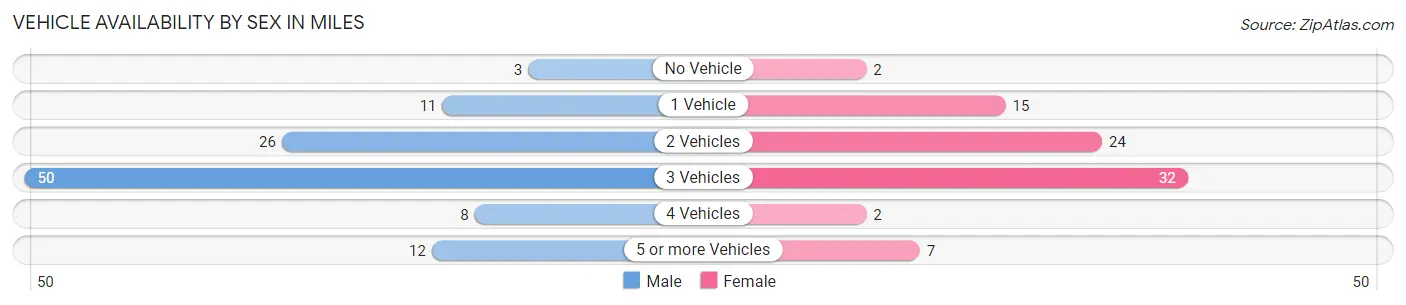
| Vehicles Available | Male | Female |
| No Vehicle | 3 (2.7%) | 2 (2.4%) |
| 1 Vehicle | 11 (10.0%) | 15 (18.3%) |
| 2 Vehicles | 26 (23.6%) | 24 (29.3%) |
| 3 Vehicles | 50 (45.5%) | 32 (39.0%) |
| 4 Vehicles | 8 (7.3%) | 2 (2.4%) |
| 5 or more Vehicles | 12 (10.9%) | 7 (8.5%) |
| Total | 110 (100.0%) | 82 (100.0%) |
Commute Time in Miles
The most frequently occuring commute durations in Miles are 30 to 34 minutes (39 commuters, 21.4%), 25 to 29 minutes (36 commuters, 19.8%), and 35 to 39 minutes (21 commuters, 11.5%).
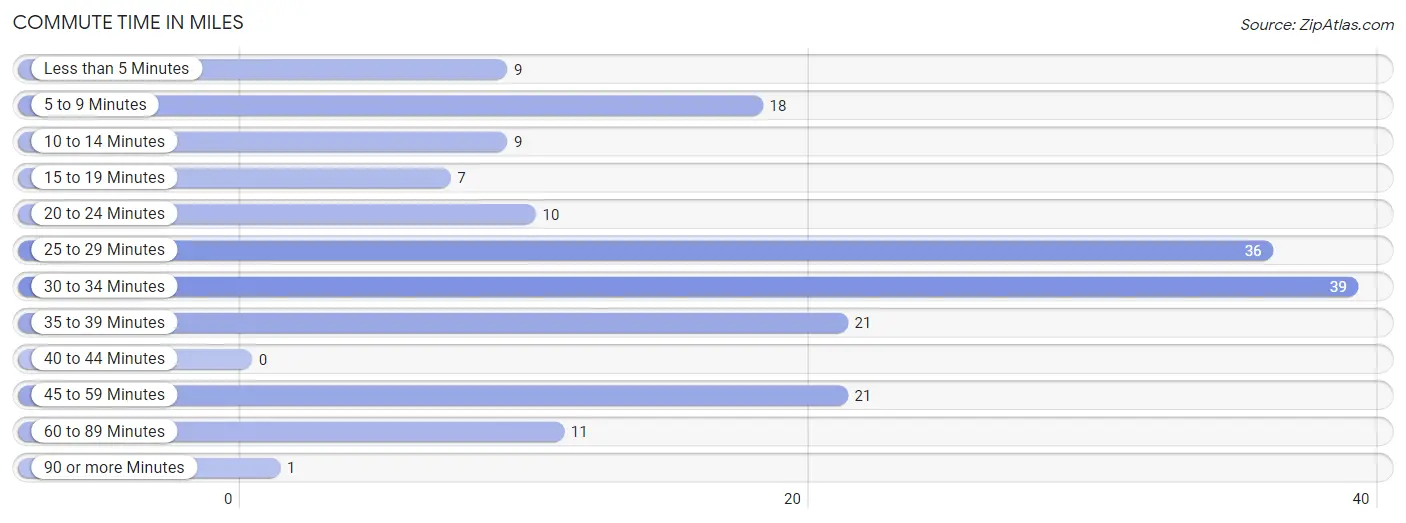
| Commute Time | # Commuters | % Commuters |
| Less than 5 Minutes | 9 | 5.0% |
| 5 to 9 Minutes | 18 | 9.9% |
| 10 to 14 Minutes | 9 | 5.0% |
| 15 to 19 Minutes | 7 | 3.8% |
| 20 to 24 Minutes | 10 | 5.5% |
| 25 to 29 Minutes | 36 | 19.8% |
| 30 to 34 Minutes | 39 | 21.4% |
| 35 to 39 Minutes | 21 | 11.5% |
| 40 to 44 Minutes | 0 | 0.0% |
| 45 to 59 Minutes | 21 | 11.5% |
| 60 to 89 Minutes | 11 | 6.0% |
| 90 or more Minutes | 1 | 0.5% |
Commute Time by Sex in Miles
The most common commute times in Miles are 25 to 29 minutes (23 commuters, 21.7%) for males and 30 to 34 minutes (16 commuters, 21.0%) for females.
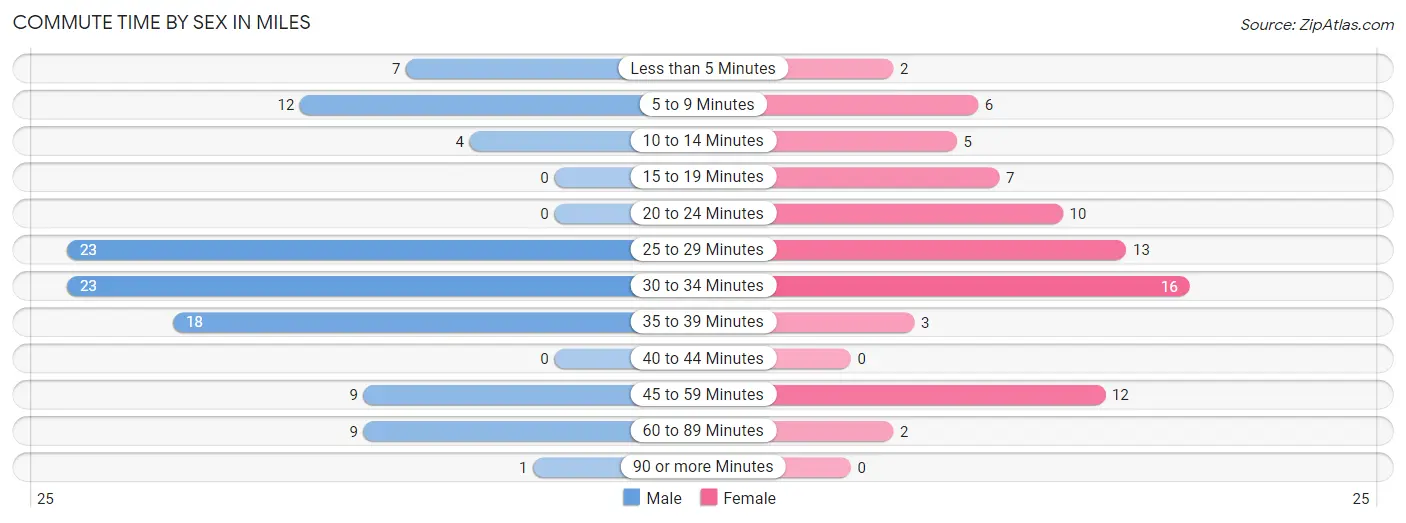
| Commute Time | Male | Female |
| Less than 5 Minutes | 7 (6.6%) | 2 (2.6%) |
| 5 to 9 Minutes | 12 (11.3%) | 6 (7.9%) |
| 10 to 14 Minutes | 4 (3.8%) | 5 (6.6%) |
| 15 to 19 Minutes | 0 (0.0%) | 7 (9.2%) |
| 20 to 24 Minutes | 0 (0.0%) | 10 (13.2%) |
| 25 to 29 Minutes | 23 (21.7%) | 13 (17.1%) |
| 30 to 34 Minutes | 23 (21.7%) | 16 (21.0%) |
| 35 to 39 Minutes | 18 (17.0%) | 3 (4.0%) |
| 40 to 44 Minutes | 0 (0.0%) | 0 (0.0%) |
| 45 to 59 Minutes | 9 (8.5%) | 12 (15.8%) |
| 60 to 89 Minutes | 9 (8.5%) | 2 (2.6%) |
| 90 or more Minutes | 1 (0.9%) | 0 (0.0%) |
Time of Departure to Work by Sex in Miles
The most frequent times of departure to work in Miles are 12:00 AM to 4:59 AM (17, 16.0%) for males and 7:30 AM to 7:59 AM (15, 19.7%) for females.
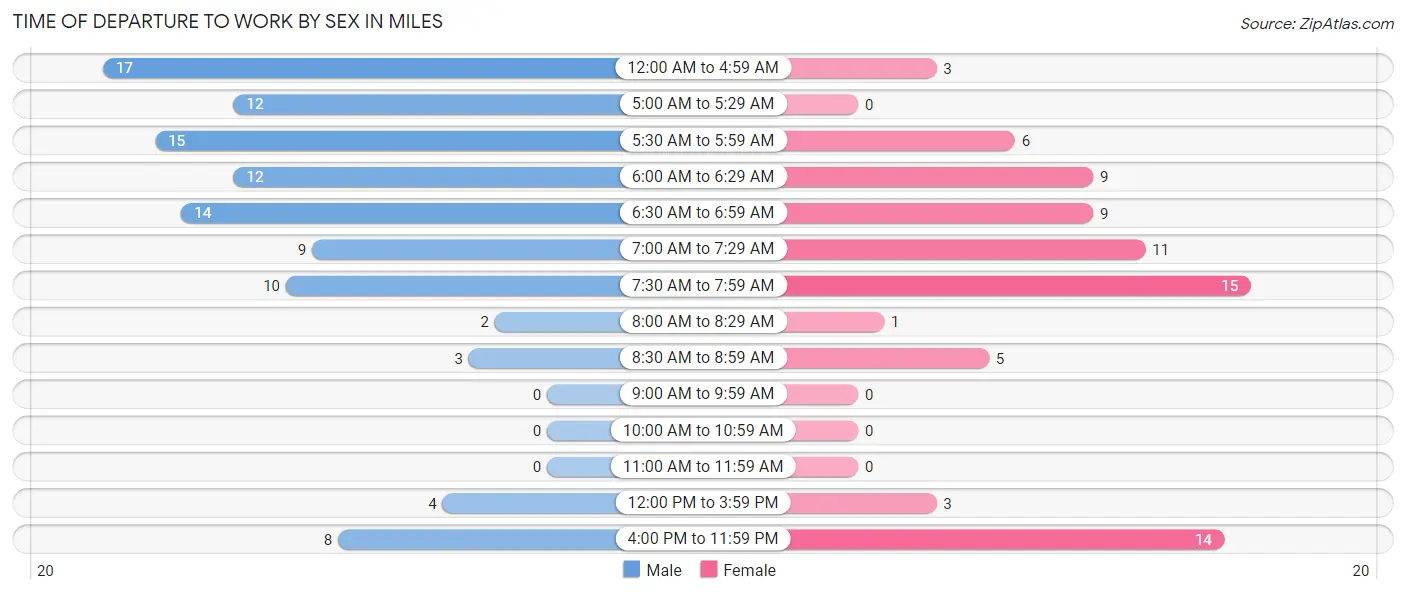
| Time of Departure | Male | Female |
| 12:00 AM to 4:59 AM | 17 (16.0%) | 3 (4.0%) |
| 5:00 AM to 5:29 AM | 12 (11.3%) | 0 (0.0%) |
| 5:30 AM to 5:59 AM | 15 (14.1%) | 6 (7.9%) |
| 6:00 AM to 6:29 AM | 12 (11.3%) | 9 (11.8%) |
| 6:30 AM to 6:59 AM | 14 (13.2%) | 9 (11.8%) |
| 7:00 AM to 7:29 AM | 9 (8.5%) | 11 (14.5%) |
| 7:30 AM to 7:59 AM | 10 (9.4%) | 15 (19.7%) |
| 8:00 AM to 8:29 AM | 2 (1.9%) | 1 (1.3%) |
| 8:30 AM to 8:59 AM | 3 (2.8%) | 5 (6.6%) |
| 9:00 AM to 9:59 AM | 0 (0.0%) | 0 (0.0%) |
| 10:00 AM to 10:59 AM | 0 (0.0%) | 0 (0.0%) |
| 11:00 AM to 11:59 AM | 0 (0.0%) | 0 (0.0%) |
| 12:00 PM to 3:59 PM | 4 (3.8%) | 3 (4.0%) |
| 4:00 PM to 11:59 PM | 8 (7.5%) | 14 (18.4%) |
| Total | 106 (100.0%) | 76 (100.0%) |
Housing Occupancy in Miles
Occupancy by Ownership in Miles
Of the total 184 dwellings in Miles, owner-occupied units account for 148 (80.4%), while renter-occupied units make up 36 (19.6%).
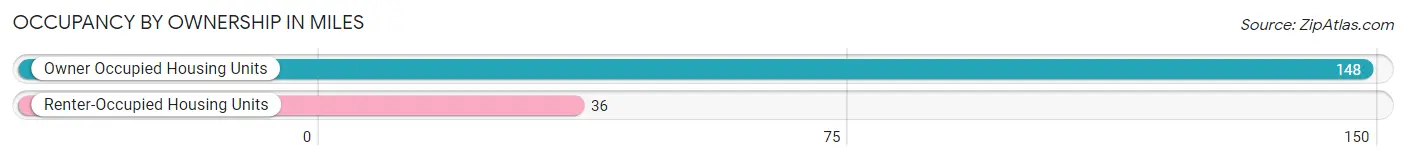
| Occupancy | # Housing Units | % Housing Units |
| Owner Occupied Housing Units | 148 | 80.4% |
| Renter-Occupied Housing Units | 36 | 19.6% |
| Total Occupied Housing Units | 184 | 100.0% |
Occupancy by Household Size in Miles
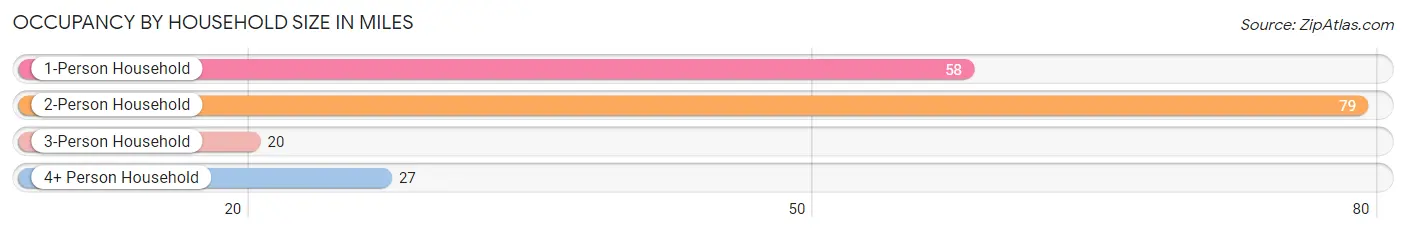
| Household Size | # Housing Units | % Housing Units |
| 1-Person Household | 58 | 31.5% |
| 2-Person Household | 79 | 42.9% |
| 3-Person Household | 20 | 10.9% |
| 4+ Person Household | 27 | 14.7% |
| Total Housing Units | 184 | 100.0% |
Occupancy by Ownership by Household Size in Miles
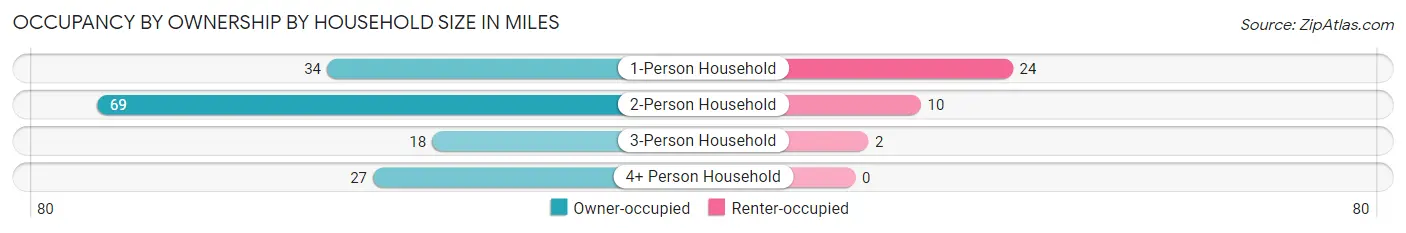
| Household Size | Owner-occupied | Renter-occupied |
| 1-Person Household | 34 (58.6%) | 24 (41.4%) |
| 2-Person Household | 69 (87.3%) | 10 (12.7%) |
| 3-Person Household | 18 (90.0%) | 2 (10.0%) |
| 4+ Person Household | 27 (100.0%) | 0 (0.0%) |
| Total Housing Units | 148 (80.4%) | 36 (19.6%) |
Occupancy by Educational Attainment in Miles
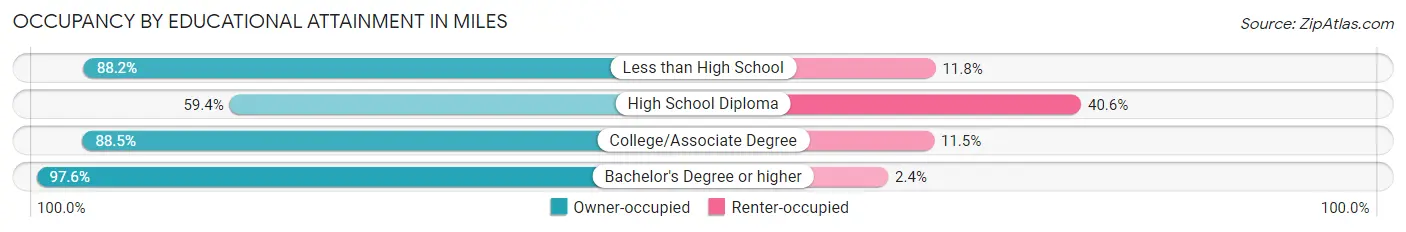
| Household Size | Owner-occupied | Renter-occupied |
| Less than High School | 15 (88.2%) | 2 (11.8%) |
| High School Diploma | 38 (59.4%) | 26 (40.6%) |
| College/Associate Degree | 54 (88.5%) | 7 (11.5%) |
| Bachelor's Degree or higher | 41 (97.6%) | 1 (2.4%) |
Occupancy by Age of Householder in Miles
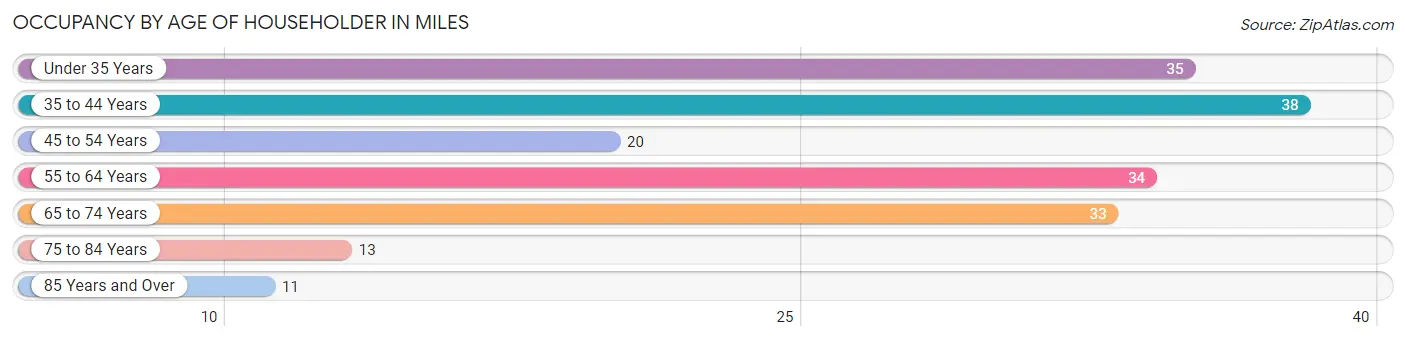
| Age Bracket | # Households | % Households |
| Under 35 Years | 35 | 19.0% |
| 35 to 44 Years | 38 | 20.6% |
| 45 to 54 Years | 20 | 10.9% |
| 55 to 64 Years | 34 | 18.5% |
| 65 to 74 Years | 33 | 17.9% |
| 75 to 84 Years | 13 | 7.1% |
| 85 Years and Over | 11 | 6.0% |
| Total | 184 | 100.0% |
Housing Finances in Miles
Median Income by Occupancy in Miles
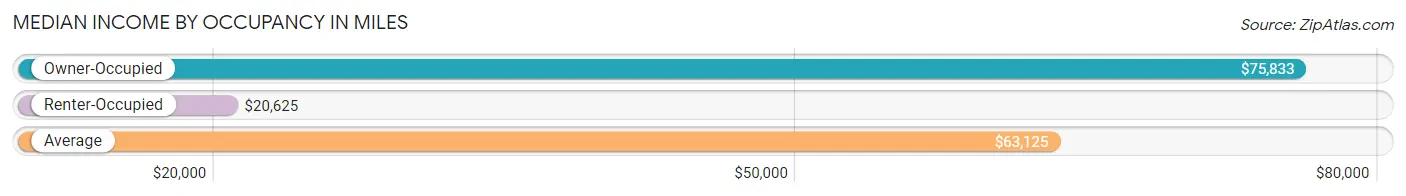
| Occupancy Type | # Households | Median Income |
| Owner-Occupied | 148 (80.4%) | $75,833 |
| Renter-Occupied | 36 (19.6%) | $20,625 |
| Average | 184 (100.0%) | $63,125 |
Occupancy by Householder Income Bracket in Miles
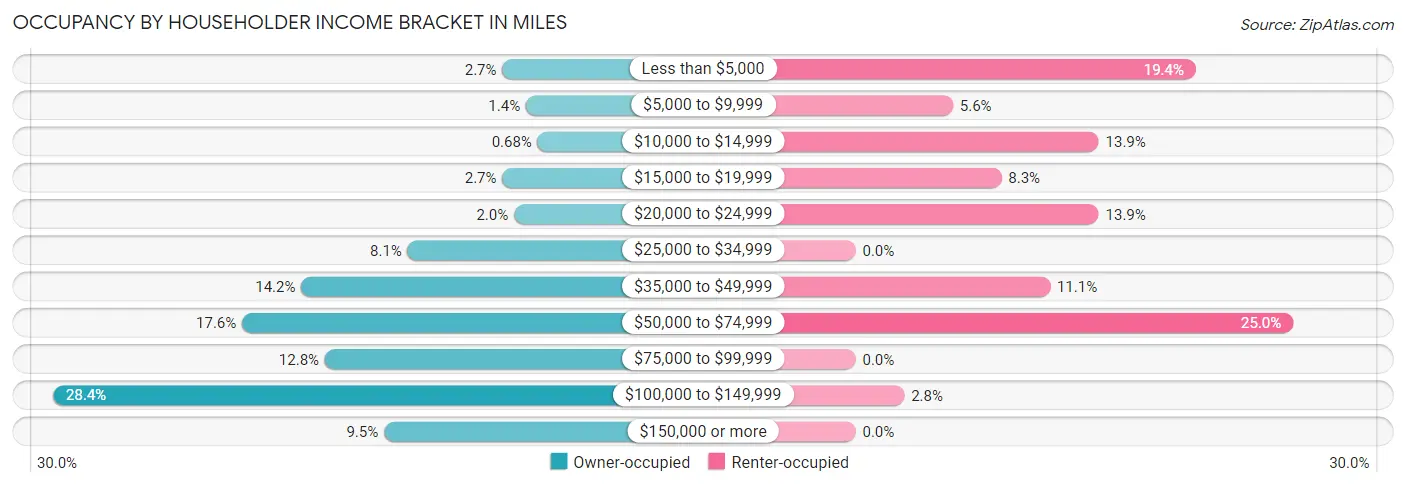
| Income Bracket | Owner-occupied | Renter-occupied |
| Less than $5,000 | 4 (2.7%) | 7 (19.4%) |
| $5,000 to $9,999 | 2 (1.3%) | 2 (5.6%) |
| $10,000 to $14,999 | 1 (0.7%) | 5 (13.9%) |
| $15,000 to $19,999 | 4 (2.7%) | 3 (8.3%) |
| $20,000 to $24,999 | 3 (2.0%) | 5 (13.9%) |
| $25,000 to $34,999 | 12 (8.1%) | 0 (0.0%) |
| $35,000 to $49,999 | 21 (14.2%) | 4 (11.1%) |
| $50,000 to $74,999 | 26 (17.6%) | 9 (25.0%) |
| $75,000 to $99,999 | 19 (12.8%) | 0 (0.0%) |
| $100,000 to $149,999 | 42 (28.4%) | 1 (2.8%) |
| $150,000 or more | 14 (9.5%) | 0 (0.0%) |
| Total | 148 (100.0%) | 36 (100.0%) |
Monthly Housing Cost Tiers in Miles
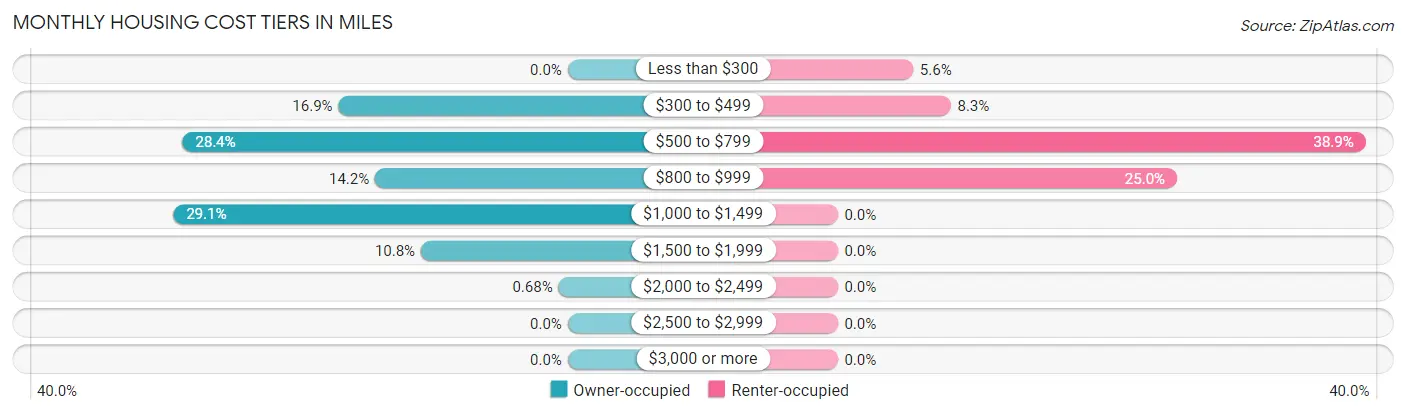
| Monthly Cost | Owner-occupied | Renter-occupied |
| Less than $300 | 0 (0.0%) | 2 (5.6%) |
| $300 to $499 | 25 (16.9%) | 3 (8.3%) |
| $500 to $799 | 42 (28.4%) | 14 (38.9%) |
| $800 to $999 | 21 (14.2%) | 9 (25.0%) |
| $1,000 to $1,499 | 43 (29.0%) | 0 (0.0%) |
| $1,500 to $1,999 | 16 (10.8%) | 0 (0.0%) |
| $2,000 to $2,499 | 1 (0.7%) | 0 (0.0%) |
| $2,500 to $2,999 | 0 (0.0%) | 0 (0.0%) |
| $3,000 or more | 0 (0.0%) | 0 (0.0%) |
| Total | 148 (100.0%) | 36 (100.0%) |
Physical Housing Characteristics in Miles
Housing Structures in Miles
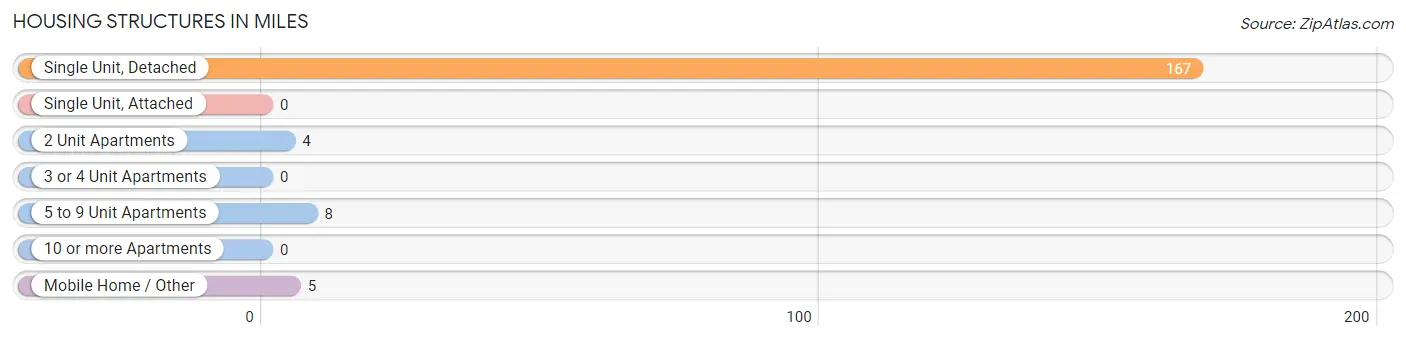
| Structure Type | # Housing Units | % Housing Units |
| Single Unit, Detached | 167 | 90.8% |
| Single Unit, Attached | 0 | 0.0% |
| 2 Unit Apartments | 4 | 2.2% |
| 3 or 4 Unit Apartments | 0 | 0.0% |
| 5 to 9 Unit Apartments | 8 | 4.3% |
| 10 or more Apartments | 0 | 0.0% |
| Mobile Home / Other | 5 | 2.7% |
| Total | 184 | 100.0% |
Housing Structures by Occupancy in Miles
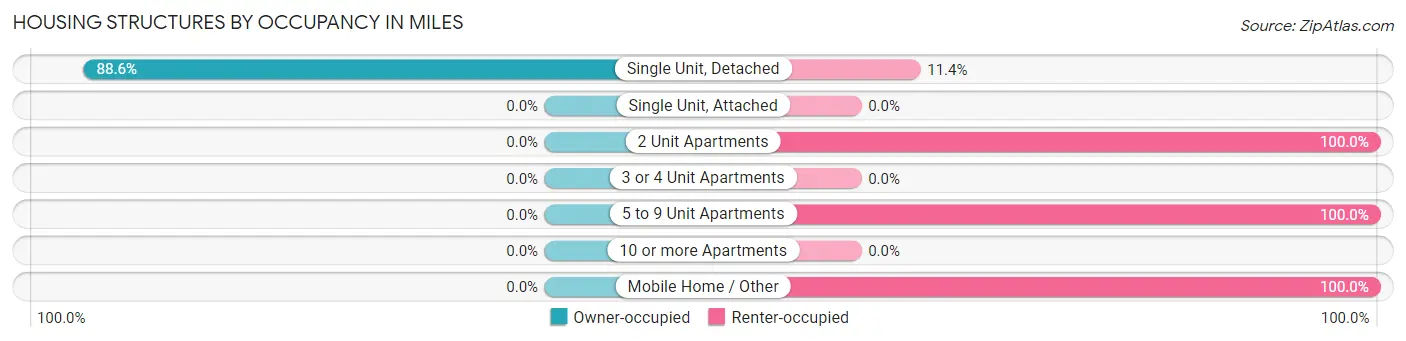
| Structure Type | Owner-occupied | Renter-occupied |
| Single Unit, Detached | 148 (88.6%) | 19 (11.4%) |
| Single Unit, Attached | 0 (0.0%) | 0 (0.0%) |
| 2 Unit Apartments | 0 (0.0%) | 4 (100.0%) |
| 3 or 4 Unit Apartments | 0 (0.0%) | 0 (0.0%) |
| 5 to 9 Unit Apartments | 0 (0.0%) | 8 (100.0%) |
| 10 or more Apartments | 0 (0.0%) | 0 (0.0%) |
| Mobile Home / Other | 0 (0.0%) | 5 (100.0%) |
| Total | 148 (80.4%) | 36 (19.6%) |
Housing Structures by Number of Rooms in Miles
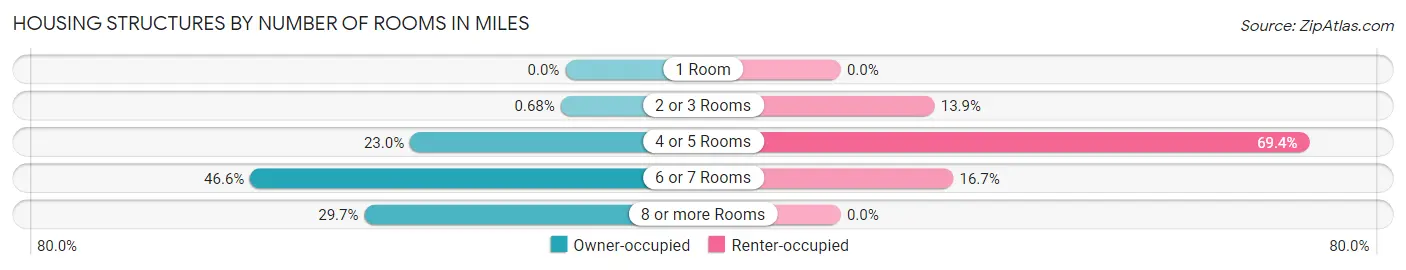
| Number of Rooms | Owner-occupied | Renter-occupied |
| 1 Room | 0 (0.0%) | 0 (0.0%) |
| 2 or 3 Rooms | 1 (0.7%) | 5 (13.9%) |
| 4 or 5 Rooms | 34 (23.0%) | 25 (69.4%) |
| 6 or 7 Rooms | 69 (46.6%) | 6 (16.7%) |
| 8 or more Rooms | 44 (29.7%) | 0 (0.0%) |
| Total | 148 (100.0%) | 36 (100.0%) |
Housing Structure by Heating Type in Miles
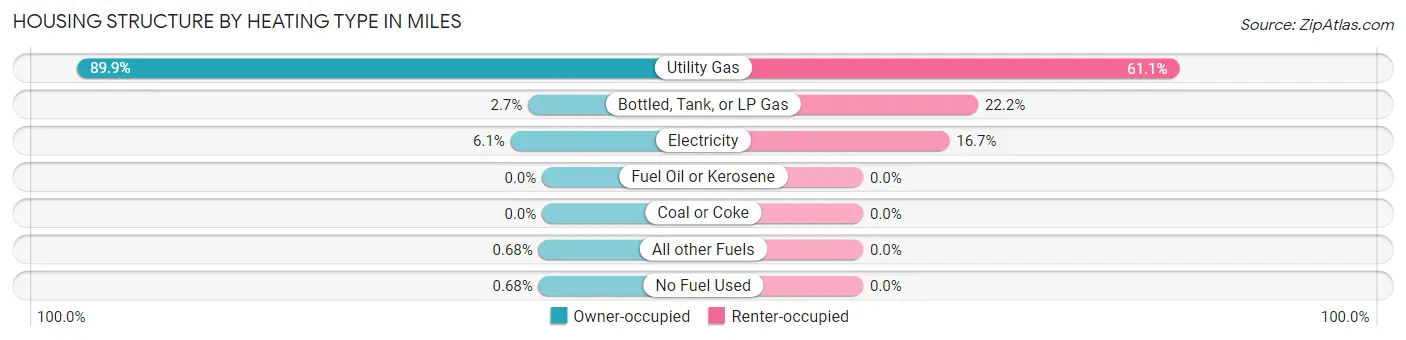
| Heating Type | Owner-occupied | Renter-occupied |
| Utility Gas | 133 (89.9%) | 22 (61.1%) |
| Bottled, Tank, or LP Gas | 4 (2.7%) | 8 (22.2%) |
| Electricity | 9 (6.1%) | 6 (16.7%) |
| Fuel Oil or Kerosene | 0 (0.0%) | 0 (0.0%) |
| Coal or Coke | 0 (0.0%) | 0 (0.0%) |
| All other Fuels | 1 (0.7%) | 0 (0.0%) |
| No Fuel Used | 1 (0.7%) | 0 (0.0%) |
| Total | 148 (100.0%) | 36 (100.0%) |
Household Vehicle Usage in Miles
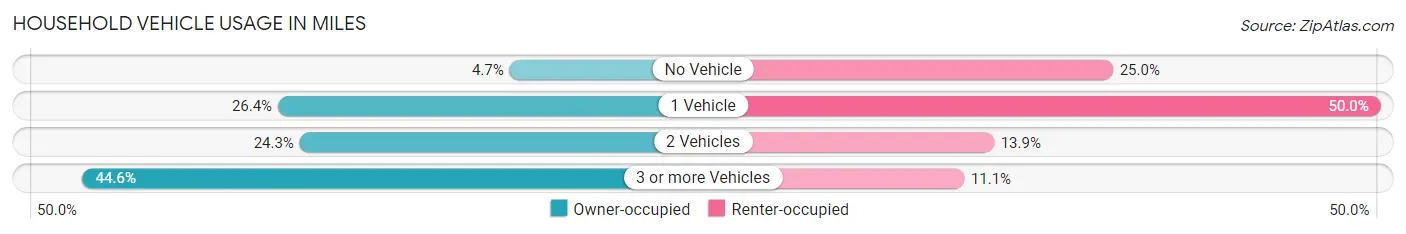
| Vehicles per Household | Owner-occupied | Renter-occupied |
| No Vehicle | 7 (4.7%) | 9 (25.0%) |
| 1 Vehicle | 39 (26.4%) | 18 (50.0%) |
| 2 Vehicles | 36 (24.3%) | 5 (13.9%) |
| 3 or more Vehicles | 66 (44.6%) | 4 (11.1%) |
| Total | 148 (100.0%) | 36 (100.0%) |
Real Estate & Mortgages in Miles
Real Estate and Mortgage Overview in Miles
| Characteristic | Without Mortgage | With Mortgage |
| Housing Units | 54 | 94 |
| Median Property Value | $131,300 | $129,200 |
| Median Household Income | $53,750 | $12 |
| Monthly Housing Costs | $515 | $0 |
| Real Estate Taxes | $1,417 | $0 |
Property Value by Mortgage Status in Miles
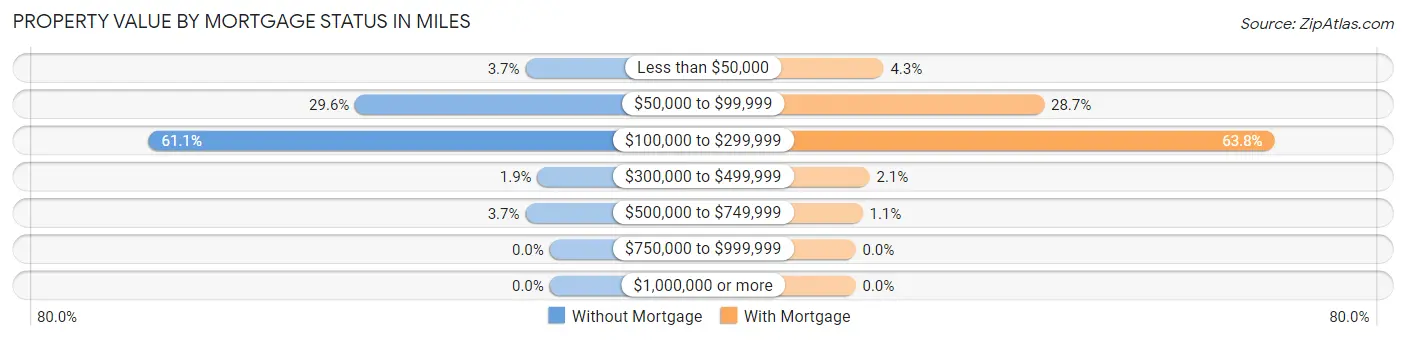
| Property Value | Without Mortgage | With Mortgage |
| Less than $50,000 | 2 (3.7%) | 4 (4.3%) |
| $50,000 to $99,999 | 16 (29.6%) | 27 (28.7%) |
| $100,000 to $299,999 | 33 (61.1%) | 60 (63.8%) |
| $300,000 to $499,999 | 1 (1.8%) | 2 (2.1%) |
| $500,000 to $749,999 | 2 (3.7%) | 1 (1.1%) |
| $750,000 to $999,999 | 0 (0.0%) | 0 (0.0%) |
| $1,000,000 or more | 0 (0.0%) | 0 (0.0%) |
| Total | 54 (100.0%) | 94 (100.0%) |
Household Income by Mortgage Status in Miles
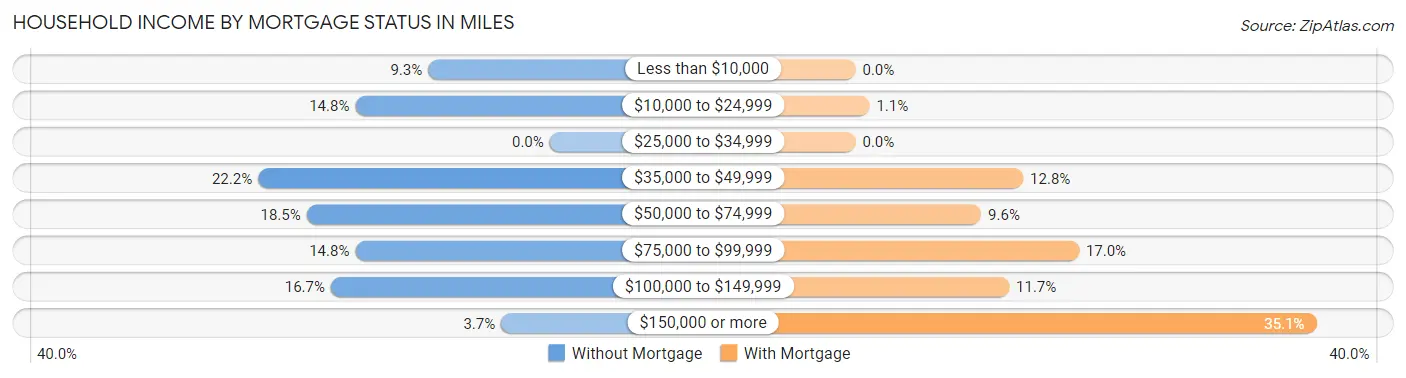
| Household Income | Without Mortgage | With Mortgage |
| Less than $10,000 | 5 (9.3%) | 0 (0.0%) |
| $10,000 to $24,999 | 8 (14.8%) | 1 (1.1%) |
| $25,000 to $34,999 | 0 (0.0%) | 0 (0.0%) |
| $35,000 to $49,999 | 12 (22.2%) | 12 (12.8%) |
| $50,000 to $74,999 | 10 (18.5%) | 9 (9.6%) |
| $75,000 to $99,999 | 8 (14.8%) | 16 (17.0%) |
| $100,000 to $149,999 | 9 (16.7%) | 11 (11.7%) |
| $150,000 or more | 2 (3.7%) | 33 (35.1%) |
| Total | 54 (100.0%) | 94 (100.0%) |
Property Value to Household Income Ratio in Miles
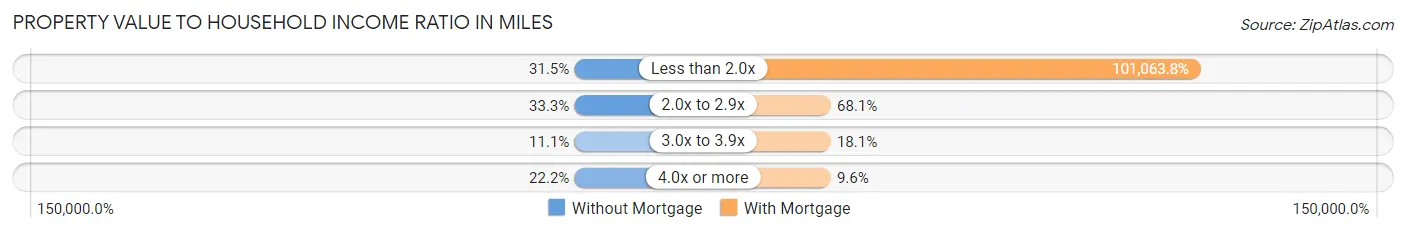
| Value-to-Income Ratio | Without Mortgage | With Mortgage |
| Less than 2.0x | 17 (31.5%) | 95,000 (101,063.8%) |
| 2.0x to 2.9x | 18 (33.3%) | 64 (68.1%) |
| 3.0x to 3.9x | 6 (11.1%) | 17 (18.1%) |
| 4.0x or more | 12 (22.2%) | 9 (9.6%) |
| Total | 54 (100.0%) | 94 (100.0%) |
Real Estate Taxes by Mortgage Status in Miles
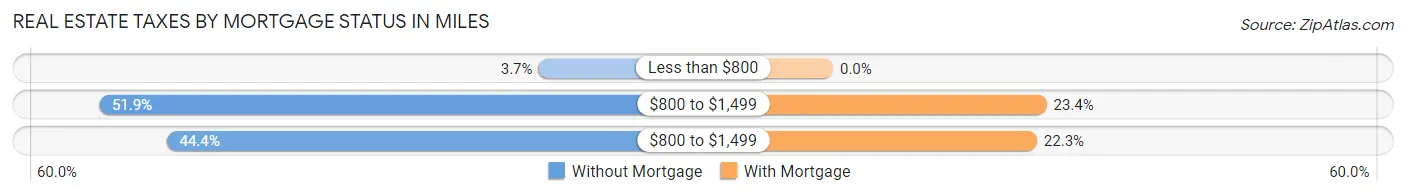
| Property Taxes | Without Mortgage | With Mortgage |
| Less than $800 | 2 (3.7%) | 0 (0.0%) |
| $800 to $1,499 | 28 (51.8%) | 22 (23.4%) |
| $800 to $1,499 | 24 (44.4%) | 21 (22.3%) |
| Total | 54 (100.0%) | 94 (100.0%) |
Health & Disability in Miles
Health Insurance Coverage by Age in Miles
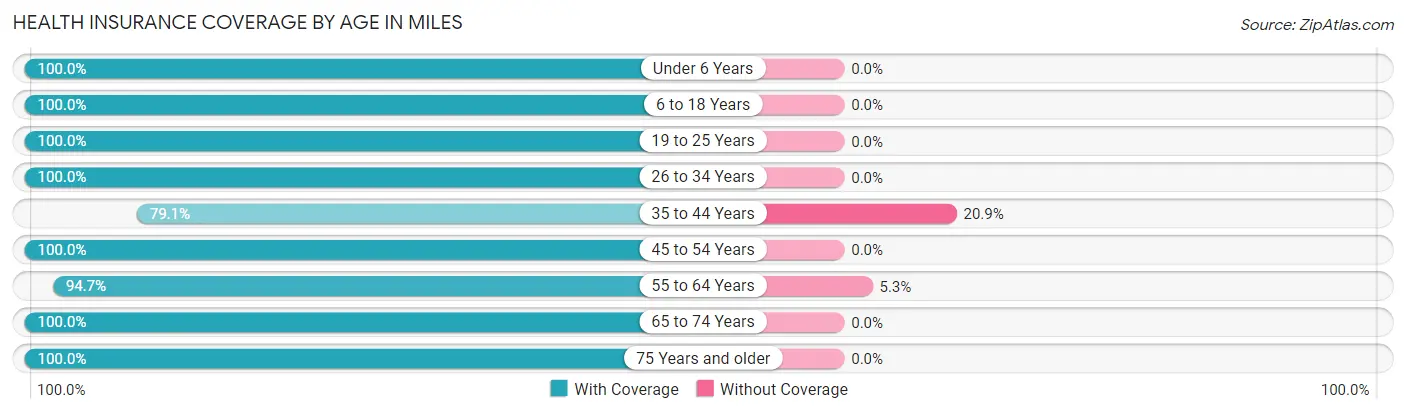
| Age Bracket | With Coverage | Without Coverage |
| Under 6 Years | 18 (100.0%) | 0 (0.0%) |
| 6 to 18 Years | 65 (100.0%) | 0 (0.0%) |
| 19 to 25 Years | 30 (100.0%) | 0 (0.0%) |
| 26 to 34 Years | 48 (100.0%) | 0 (0.0%) |
| 35 to 44 Years | 34 (79.1%) | 9 (20.9%) |
| 45 to 54 Years | 40 (100.0%) | 0 (0.0%) |
| 55 to 64 Years | 54 (94.7%) | 3 (5.3%) |
| 65 to 74 Years | 63 (100.0%) | 0 (0.0%) |
| 75 Years and older | 34 (100.0%) | 0 (0.0%) |
| Total | 386 (97.0%) | 12 (3.0%) |
Health Insurance Coverage by Citizenship Status in Miles
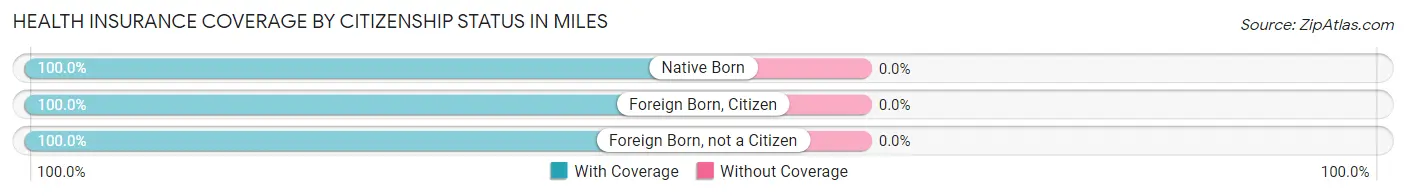
| Citizenship Status | With Coverage | Without Coverage |
| Native Born | 18 (100.0%) | 0 (0.0%) |
| Foreign Born, Citizen | 65 (100.0%) | 0 (0.0%) |
| Foreign Born, not a Citizen | 30 (100.0%) | 0 (0.0%) |
Health Insurance Coverage by Household Income in Miles
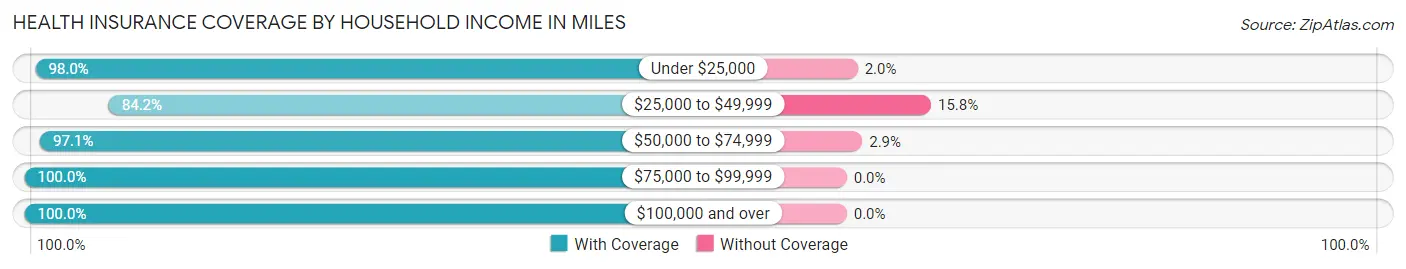
| Household Income | With Coverage | Without Coverage |
| Under $25,000 | 48 (98.0%) | 1 (2.0%) |
| $25,000 to $49,999 | 48 (84.2%) | 9 (15.8%) |
| $50,000 to $74,999 | 67 (97.1%) | 2 (2.9%) |
| $75,000 to $99,999 | 44 (100.0%) | 0 (0.0%) |
| $100,000 and over | 179 (100.0%) | 0 (0.0%) |
Public vs Private Health Insurance Coverage by Age in Miles
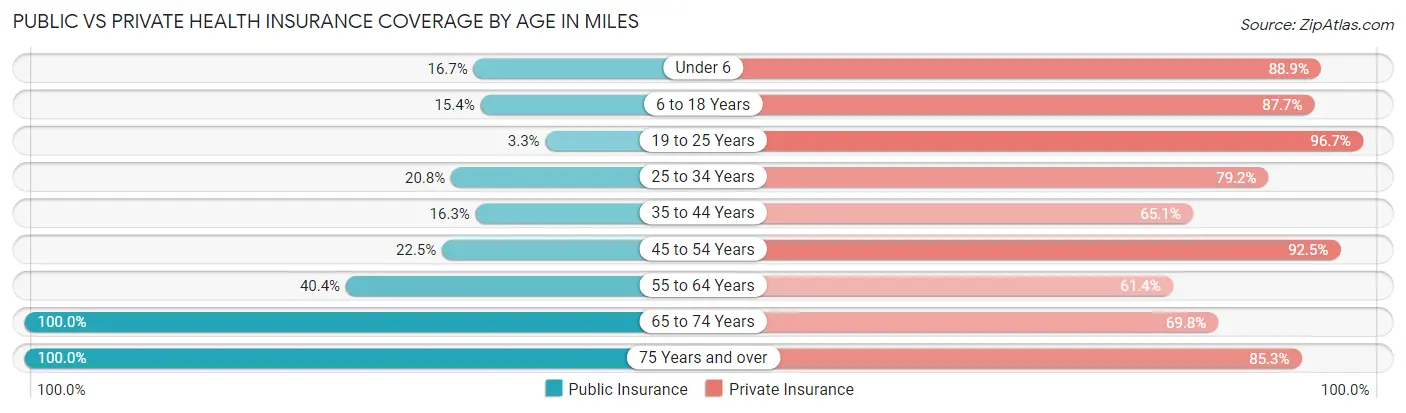
| Age Bracket | Public Insurance | Private Insurance |
| Under 6 | 3 (16.7%) | 16 (88.9%) |
| 6 to 18 Years | 10 (15.4%) | 57 (87.7%) |
| 19 to 25 Years | 1 (3.3%) | 29 (96.7%) |
| 25 to 34 Years | 10 (20.8%) | 38 (79.2%) |
| 35 to 44 Years | 7 (16.3%) | 28 (65.1%) |
| 45 to 54 Years | 9 (22.5%) | 37 (92.5%) |
| 55 to 64 Years | 23 (40.4%) | 35 (61.4%) |
| 65 to 74 Years | 63 (100.0%) | 44 (69.8%) |
| 75 Years and over | 34 (100.0%) | 29 (85.3%) |
| Total | 160 (40.2%) | 313 (78.6%) |
Disability Status by Sex by Age in Miles
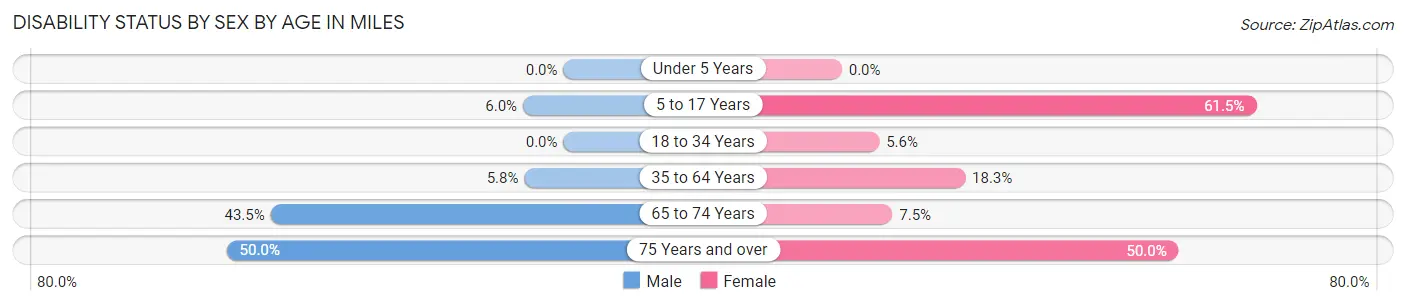
| Age Bracket | Male | Female |
| Under 5 Years | 0 (0.0%) | 0 (0.0%) |
| 5 to 17 Years | 3 (6.0%) | 8 (61.5%) |
| 18 to 34 Years | 0 (0.0%) | 2 (5.6%) |
| 35 to 64 Years | 4 (5.8%) | 13 (18.3%) |
| 65 to 74 Years | 10 (43.5%) | 3 (7.5%) |
| 75 Years and over | 8 (50.0%) | 9 (50.0%) |
Disability Class by Sex by Age in Miles
Disability Class: Hearing Difficulty
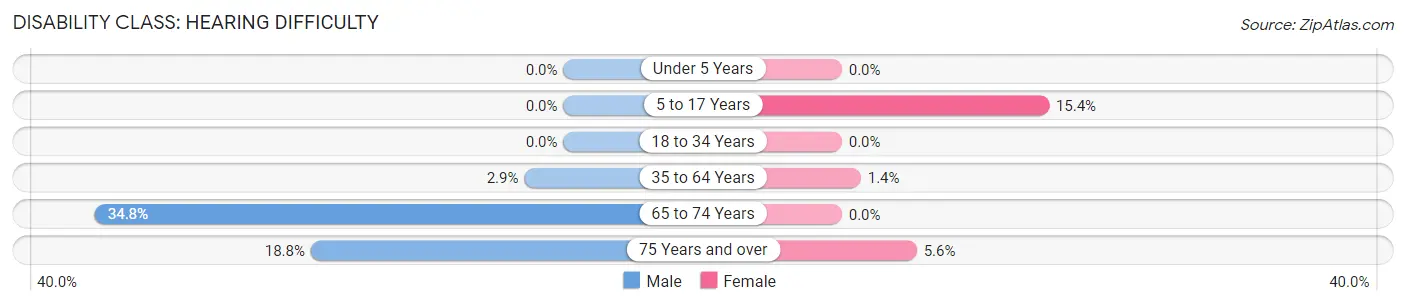
| Age Bracket | Male | Female |
| Under 5 Years | 0 (0.0%) | 0 (0.0%) |
| 5 to 17 Years | 0 (0.0%) | 2 (15.4%) |
| 18 to 34 Years | 0 (0.0%) | 0 (0.0%) |
| 35 to 64 Years | 2 (2.9%) | 1 (1.4%) |
| 65 to 74 Years | 8 (34.8%) | 0 (0.0%) |
| 75 Years and over | 3 (18.8%) | 1 (5.6%) |
Disability Class: Vision Difficulty
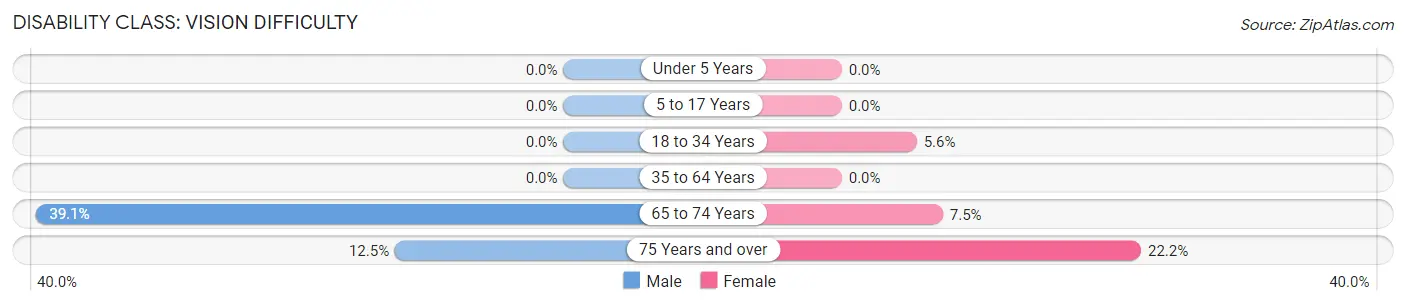
| Age Bracket | Male | Female |
| Under 5 Years | 0 (0.0%) | 0 (0.0%) |
| 5 to 17 Years | 0 (0.0%) | 0 (0.0%) |
| 18 to 34 Years | 0 (0.0%) | 2 (5.6%) |
| 35 to 64 Years | 0 (0.0%) | 0 (0.0%) |
| 65 to 74 Years | 9 (39.1%) | 3 (7.5%) |
| 75 Years and over | 2 (12.5%) | 4 (22.2%) |
Disability Class: Cognitive Difficulty
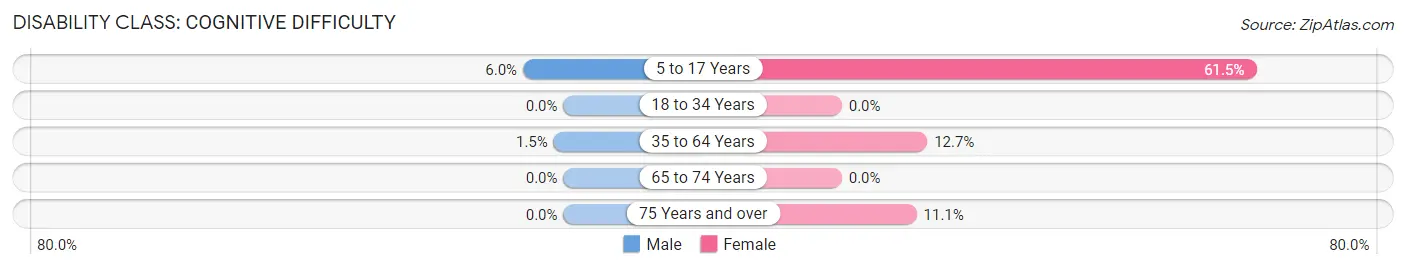
| Age Bracket | Male | Female |
| 5 to 17 Years | 3 (6.0%) | 8 (61.5%) |
| 18 to 34 Years | 0 (0.0%) | 0 (0.0%) |
| 35 to 64 Years | 1 (1.5%) | 9 (12.7%) |
| 65 to 74 Years | 0 (0.0%) | 0 (0.0%) |
| 75 Years and over | 0 (0.0%) | 2 (11.1%) |
Disability Class: Ambulatory Difficulty
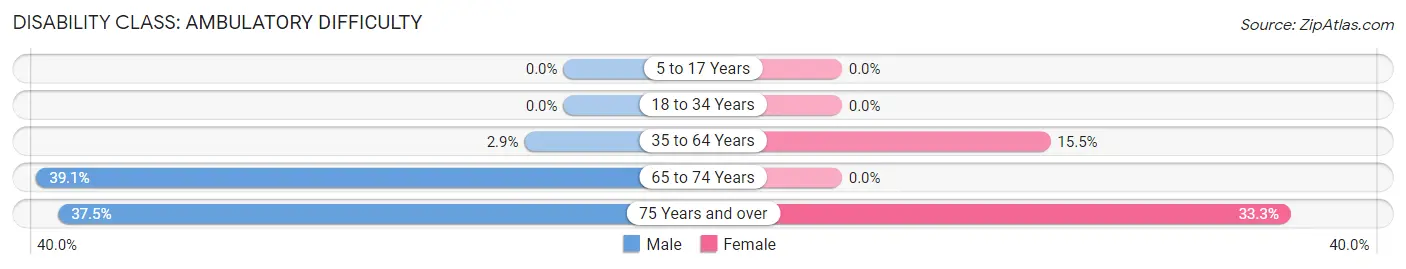
| Age Bracket | Male | Female |
| 5 to 17 Years | 0 (0.0%) | 0 (0.0%) |
| 18 to 34 Years | 0 (0.0%) | 0 (0.0%) |
| 35 to 64 Years | 2 (2.9%) | 11 (15.5%) |
| 65 to 74 Years | 9 (39.1%) | 0 (0.0%) |
| 75 Years and over | 6 (37.5%) | 6 (33.3%) |
Disability Class: Self-Care Difficulty
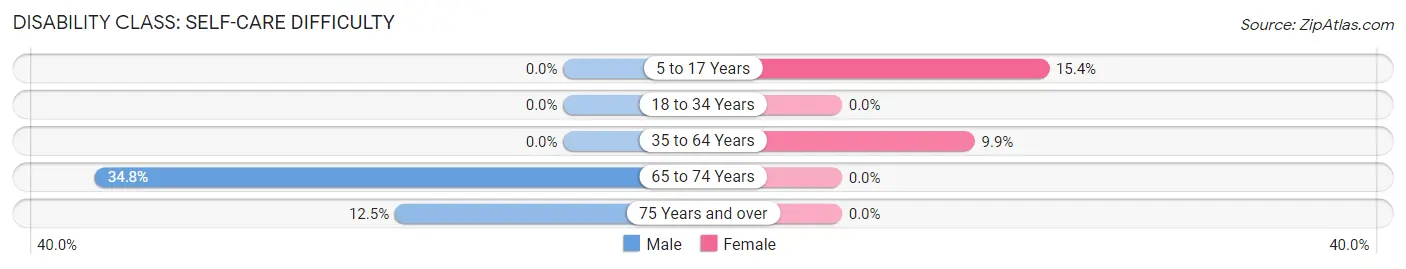
| Age Bracket | Male | Female |
| 5 to 17 Years | 0 (0.0%) | 2 (15.4%) |
| 18 to 34 Years | 0 (0.0%) | 0 (0.0%) |
| 35 to 64 Years | 0 (0.0%) | 7 (9.9%) |
| 65 to 74 Years | 8 (34.8%) | 0 (0.0%) |
| 75 Years and over | 2 (12.5%) | 0 (0.0%) |
Technology Access in Miles
Computing Device Access in Miles
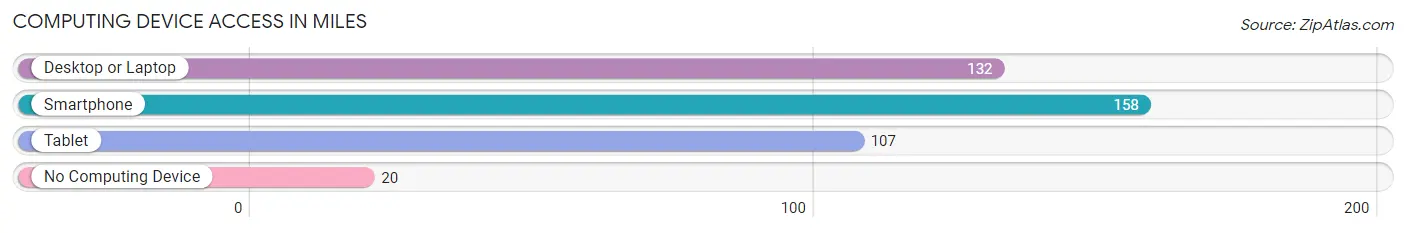
| Device Type | # Households | % Households |
| Desktop or Laptop | 132 | 71.7% |
| Smartphone | 158 | 85.9% |
| Tablet | 107 | 58.2% |
| No Computing Device | 20 | 10.9% |
| Total | 184 | 100.0% |
Internet Access in Miles
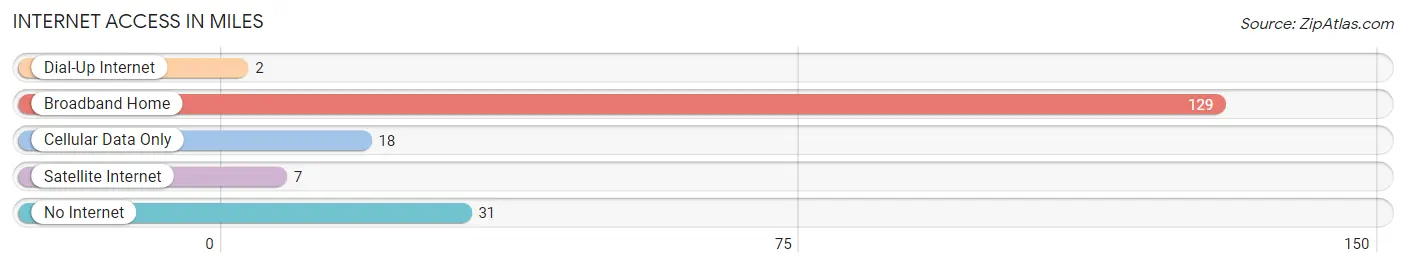
| Internet Type | # Households | % Households |
| Dial-Up Internet | 2 | 1.1% |
| Broadband Home | 129 | 70.1% |
| Cellular Data Only | 18 | 9.8% |
| Satellite Internet | 7 | 3.8% |
| No Internet | 31 | 16.9% |
| Total | 184 | 100.0% |
Miles Summary
Miles, Iowa is a small town located in the southwestern corner of the state, in the county of Montgomery. It is situated on the banks of the North Raccoon River, and is home to a population of just over 500 people. The town was founded in 1856, and has a rich history of farming and industry.
Geography
Miles is located in the rolling hills of southwestern Iowa, and is surrounded by lush farmland. The town is situated on the banks of the North Raccoon River, and is bordered by the towns of Red Oak, Villisca, and Stanton. The town is located at an elevation of 1,068 feet above sea level, and has a total area of 0.6 square miles.
Economy
Miles has a strong agricultural economy, with many of its residents employed in farming and related industries. The town is home to several grain elevators, and is a major producer of corn, soybeans, and hay. In addition, Miles is home to several small businesses, including a grocery store, a hardware store, and a restaurant.
Demographics
As of the 2010 census, Miles had a population of 514 people. The racial makeup of the town was 97.3% White, 0.4% African American, 0.2% Native American, 0.2% Asian, 0.2% from other races, and 1.6% from two or more races. The median household income was $41,250, and the median family income was $48,750.
History
Miles was founded in 1856 by a group of settlers from Ohio. The town was named after Miles Montgomery, a prominent local landowner. The town quickly grew, and by the late 19th century, it was a thriving agricultural center. In the early 20th century, Miles was home to several factories, including a flour mill, a creamery, and a brickyard.
Today, Miles is a small, rural town with a strong agricultural economy. The town is home to several small businesses, and is a popular destination for outdoor recreation. Miles is also home to a historic downtown district, which features several historic buildings and monuments.
Common Questions
What is Per Capita Income in Miles?
Per Capita income in Miles is $32,895.
What is the Median Family Income in Miles?
Median Family Income in Miles is $77,188.
What is the Median Household income in Miles?
Median Household Income in Miles is $63,125.
What is Income or Wage Gap in Miles?
Income or Wage Gap in Miles is 34.5%.
Women in Miles earn 65.5 cents for every dollar earned by a man.
What is Inequality or Gini Index in Miles?
Inequality or Gini Index in Miles is 0.40.
What is the Total Population of Miles?
Total Population of Miles is 398.
What is the Total Male Population of Miles?
Total Male Population of Miles is 208.
What is the Total Female Population of Miles?
Total Female Population of Miles is 190.
What is the Ratio of Males per 100 Females in Miles?
There are 109.47 Males per 100 Females in Miles.
What is the Ratio of Females per 100 Males in Miles?
There are 91.35 Females per 100 Males in Miles.
What is the Median Population Age in Miles?
Median Population Age in Miles is 43.9 Years.
What is the Average Family Size in Miles
Average Family Size in Miles is 2.7 People.
What is the Average Household Size in Miles
Average Household Size in Miles is 2.2 People.
How Large is the Labor Force in Miles?
There are 199 People in the Labor Forcein in Miles.
What is the Percentage of People in the Labor Force in Miles?
59.8% of People are in the Labor Force in Miles.
What is the Unemployment Rate in Miles?
Unemployment Rate in Miles is 1.5%.