Panama, IA Map & Demographics
Panama Map
Panama Overview
$36,077
PER CAPITA INCOME
$122,000
AVG FAMILY INCOME
$69,250
AVG HOUSEHOLD INCOME
22.7%
WAGE / INCOME GAP [ % ]
77.3¢/ $1
WAGE / INCOME GAP [ $ ]
0.42
INEQUALITY / GINI INDEX
247
TOTAL POPULATION
90
MALE POPULATION
157
FEMALE POPULATION
57.32
MALES / 100 FEMALES
174.44
FEMALES / 100 MALES
38.2
MEDIAN AGE
3.3
AVG FAMILY SIZE
2.5
AVG HOUSEHOLD SIZE
135
LABOR FORCE [ PEOPLE ]
65.2%
PERCENT IN LABOR FORCE
Panama Zip Codes
Panama Area Codes
Income in Panama
Income Overview in Panama
Per Capita Income in Panama is $36,077, while median incomes of families and households are $122,000 and $69,250 respectively.
| Characteristic | Number | Measure |
| Per Capita Income | 247 | $36,077 |
| Median Family Income | 58 | $122,000 |
| Mean Family Income | 58 | $128,498 |
| Median Household Income | 97 | $69,250 |
| Mean Household Income | 97 | $96,510 |
| Income Deficit | 58 | $0 |
| Wage / Income Gap (%) | 247 | 22.66% |
| Wage / Income Gap ($) | 247 | 77.34¢ per $1 |
| Gini / Inequality Index | 247 | 0.42 |
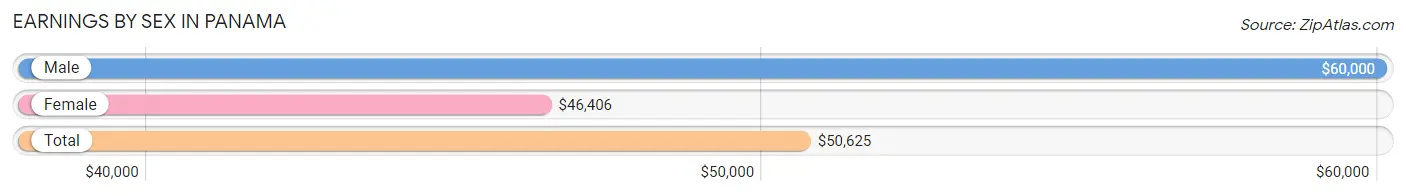
Earnings by Sex in Panama
Average Earnings in Panama are $50,625, $60,000 for men and $46,406 for women, a difference of 22.7%.
| Sex | Number | Average Earnings |
| Male | 62 (45.3%) | $60,000 |
| Female | 75 (54.7%) | $46,406 |
| Total | 137 (100.0%) | $50,625 |
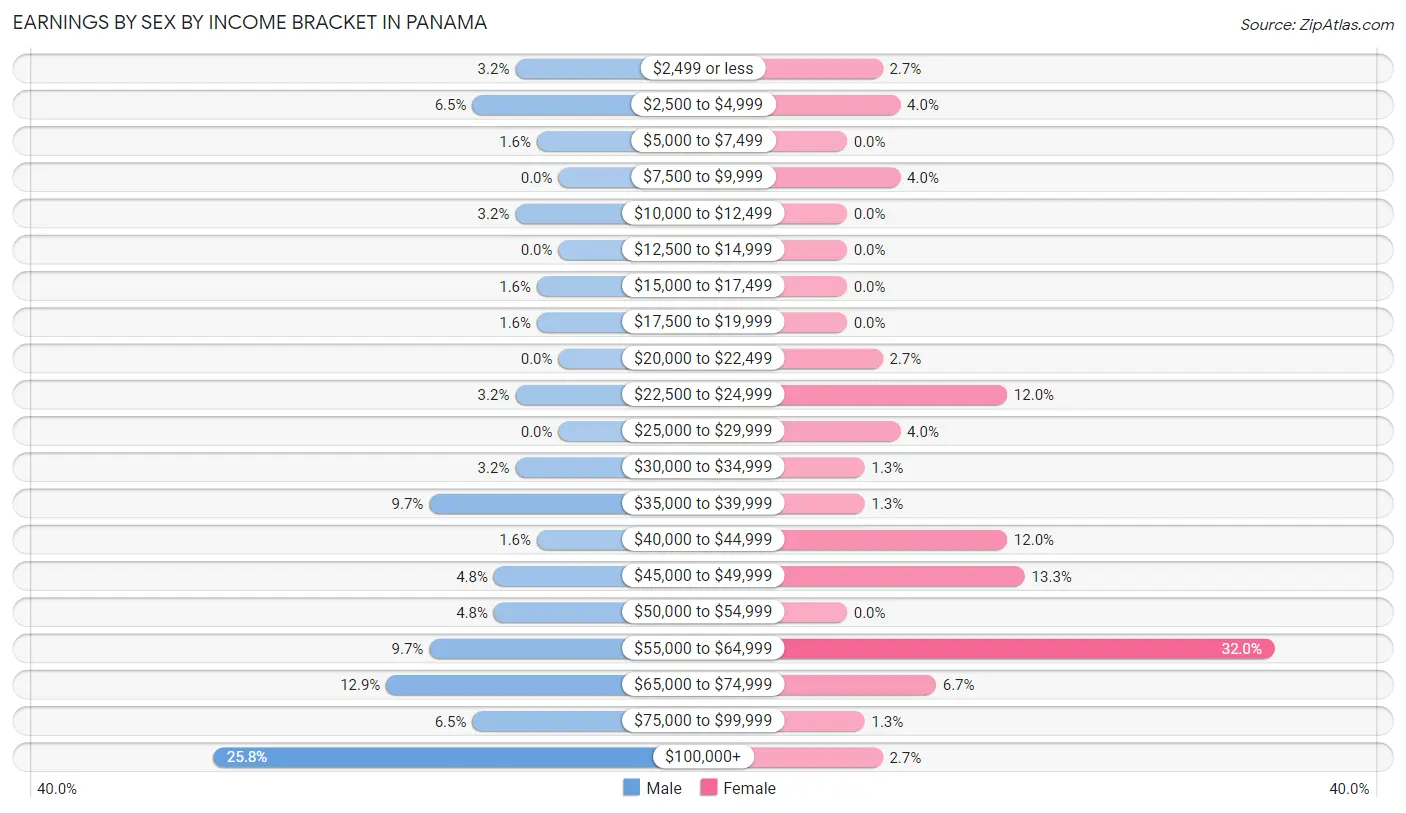
Earnings by Sex by Income Bracket in Panama
The most common earnings brackets in Panama are $100,000+ for men (16 | 25.8%) and $55,000 to $64,999 for women (24 | 32.0%).
| Income | Male | Female |
| $2,499 or less | 2 (3.2%) | 2 (2.7%) |
| $2,500 to $4,999 | 4 (6.5%) | 3 (4.0%) |
| $5,000 to $7,499 | 1 (1.6%) | 0 (0.0%) |
| $7,500 to $9,999 | 0 (0.0%) | 3 (4.0%) |
| $10,000 to $12,499 | 2 (3.2%) | 0 (0.0%) |
| $12,500 to $14,999 | 0 (0.0%) | 0 (0.0%) |
| $15,000 to $17,499 | 1 (1.6%) | 0 (0.0%) |
| $17,500 to $19,999 | 1 (1.6%) | 0 (0.0%) |
| $20,000 to $22,499 | 0 (0.0%) | 2 (2.7%) |
| $22,500 to $24,999 | 2 (3.2%) | 9 (12.0%) |
| $25,000 to $29,999 | 0 (0.0%) | 3 (4.0%) |
| $30,000 to $34,999 | 2 (3.2%) | 1 (1.3%) |
| $35,000 to $39,999 | 6 (9.7%) | 1 (1.3%) |
| $40,000 to $44,999 | 1 (1.6%) | 9 (12.0%) |
| $45,000 to $49,999 | 3 (4.8%) | 10 (13.3%) |
| $50,000 to $54,999 | 3 (4.8%) | 0 (0.0%) |
| $55,000 to $64,999 | 6 (9.7%) | 24 (32.0%) |
| $65,000 to $74,999 | 8 (12.9%) | 5 (6.7%) |
| $75,000 to $99,999 | 4 (6.5%) | 1 (1.3%) |
| $100,000+ | 16 (25.8%) | 2 (2.7%) |
| Total | 62 (100.0%) | 75 (100.0%) |
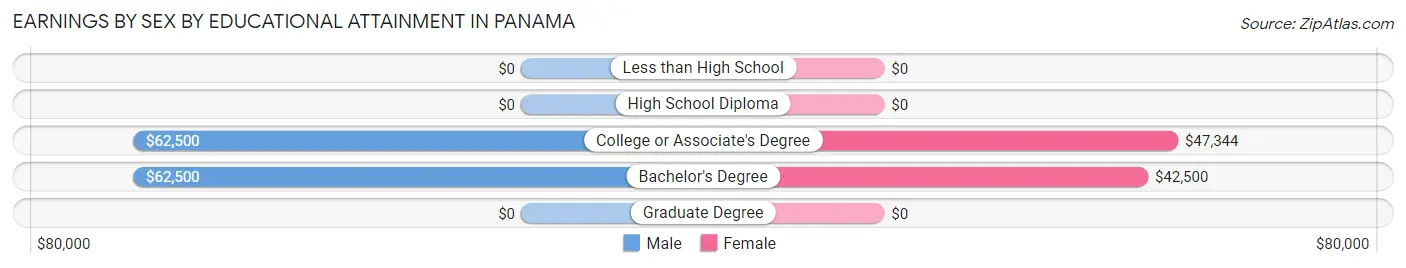
Earnings by Sex by Educational Attainment in Panama
Average earnings in Panama are $67,656 for men and $49,375 for women, a difference of 27.0%. Men with an educational attainment of college or associate's degree enjoy the highest average annual earnings of $62,500, while those with college or associate's degree education earn the least with $62,500. Women with an educational attainment of college or associate's degree earn the most with the average annual earnings of $47,344, while those with bachelor's degree education have the smallest earnings of $42,500.
| Educational Attainment | Male Income | Female Income |
| Less than High School | - | - |
| High School Diploma | - | - |
| College or Associate's Degree | $62,500 | $47,344 |
| Bachelor's Degree | $62,500 | $42,500 |
| Graduate Degree | - | - |
| Total | $67,656 | $49,375 |
Family Income in Panama
Family Income Brackets in Panama
According to the Panama family income data, there are 20 families falling into the $200,000+ income range, which is the most common income bracket and makes up 34.5% of all families.
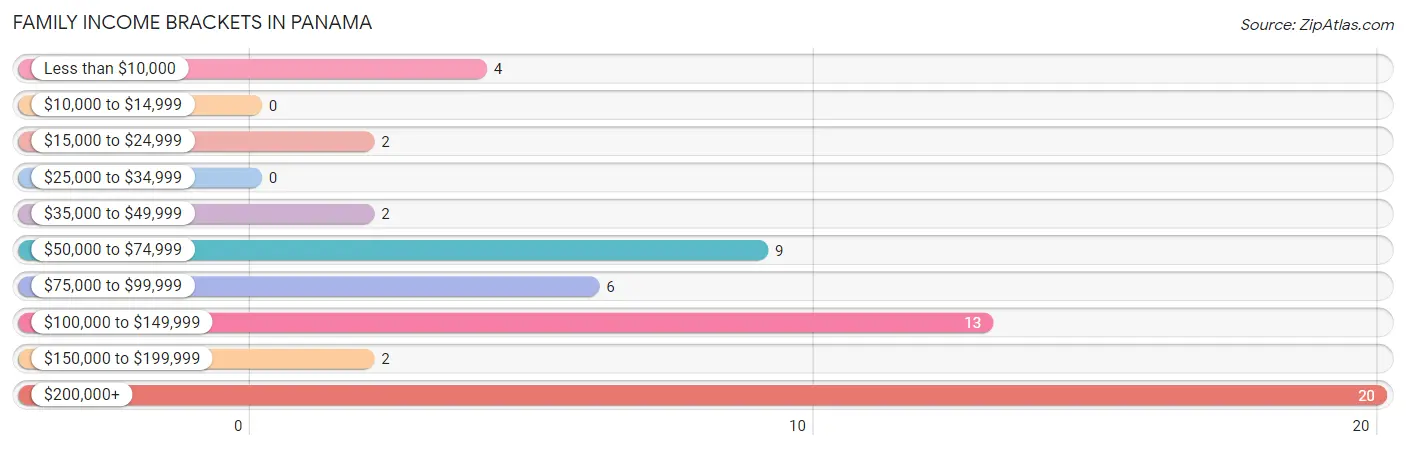
| Income Bracket | # Families | % Families |
| Less than $10,000 | 4 | 6.9% |
| $10,000 to $14,999 | 0 | 0.0% |
| $15,000 to $24,999 | 2 | 3.4% |
| $25,000 to $34,999 | 0 | 0.0% |
| $35,000 to $49,999 | 2 | 3.4% |
| $50,000 to $74,999 | 9 | 15.5% |
| $75,000 to $99,999 | 6 | 10.3% |
| $100,000 to $149,999 | 13 | 22.4% |
| $150,000 to $199,999 | 2 | 3.4% |
| $200,000+ | 20 | 34.5% |
Family Income by Famaliy Size in Panama
4-person families (22 | 37.9%) account for the highest median family income in Panama with $205,972 per family, while 4-person families (22 | 37.9%) have the highest median income of $51,493 per family member.
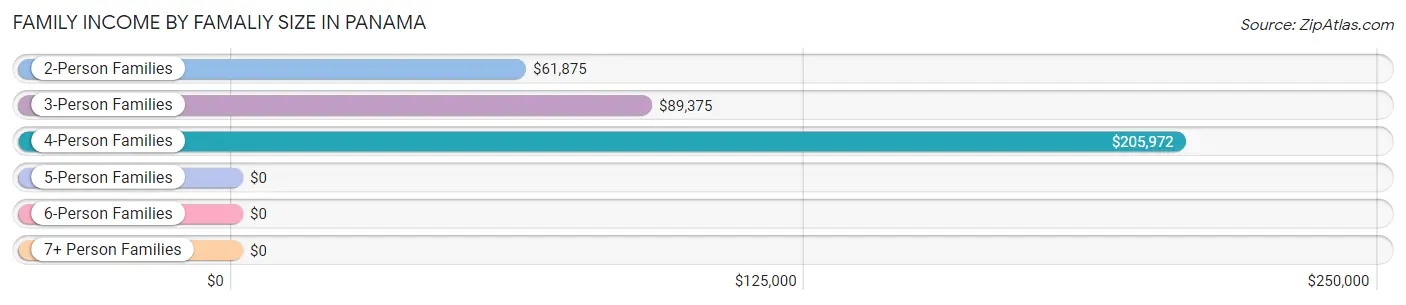
| Income Bracket | # Families | Median Income |
| 2-Person Families | 21 (36.2%) | $61,875 |
| 3-Person Families | 9 (15.5%) | $89,375 |
| 4-Person Families | 22 (37.9%) | $205,972 |
| 5-Person Families | 1 (1.7%) | $0 |
| 6-Person Families | 0 (0.0%) | $0 |
| 7+ Person Families | 5 (8.6%) | $0 |
| Total | 58 (100.0%) | $122,000 |
Family Income by Number of Earners in Panama
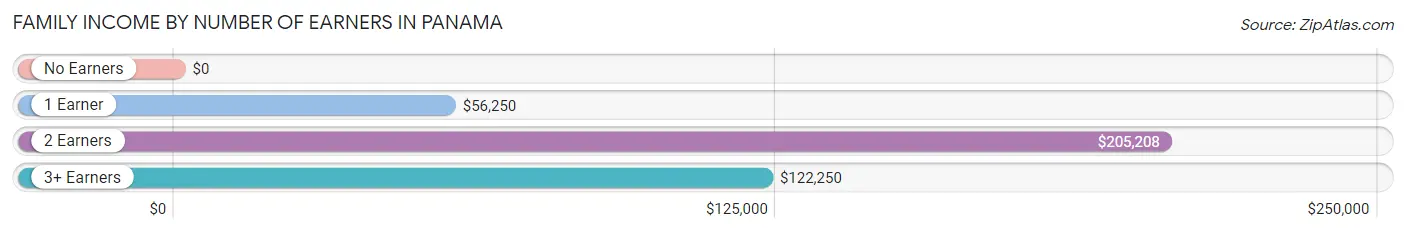
| Number of Earners | # Families | Median Income |
| No Earners | 10 (17.2%) | $0 |
| 1 Earner | 4 (6.9%) | $56,250 |
| 2 Earners | 35 (60.3%) | $205,208 |
| 3+ Earners | 9 (15.5%) | $122,250 |
| Total | 58 (100.0%) | $122,000 |
Household Income in Panama
Household Income Brackets in Panama
With 21 households falling in the category, the $50,000 to $74,999 income range is the most frequent in Panama, accounting for 21.6% of all households. In contrast, only 3 households (3.1%) fall into the $25,000 to $34,999 income bracket, making it the least populous group.
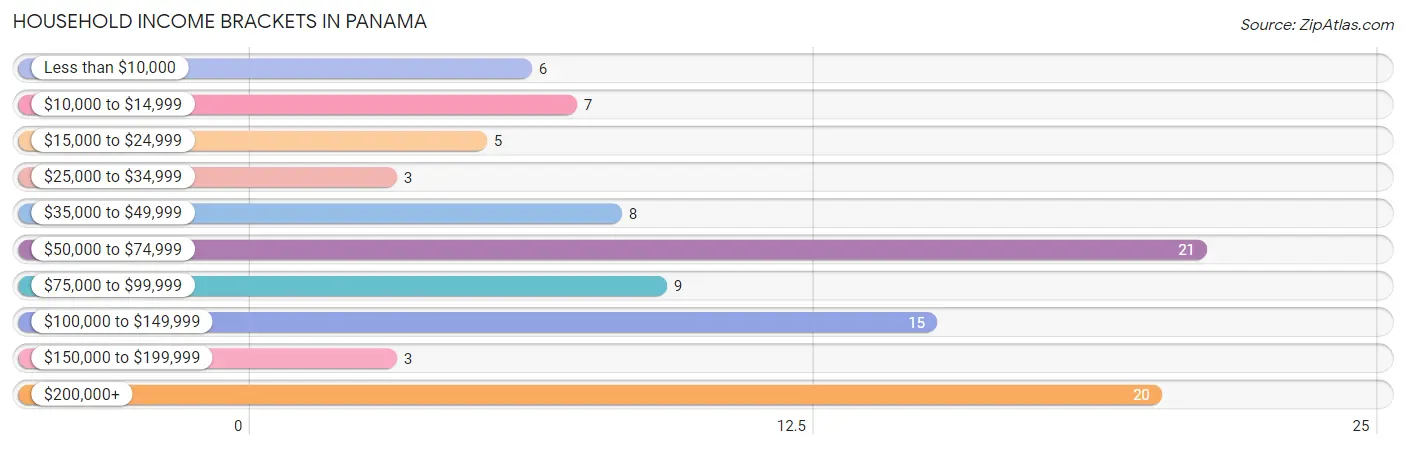
| Income Bracket | # Households | % Households |
| Less than $10,000 | 6 | 6.2% |
| $10,000 to $14,999 | 7 | 7.2% |
| $15,000 to $24,999 | 5 | 5.2% |
| $25,000 to $34,999 | 3 | 3.1% |
| $35,000 to $49,999 | 8 | 8.2% |
| $50,000 to $74,999 | 21 | 21.6% |
| $75,000 to $99,999 | 9 | 9.3% |
| $100,000 to $149,999 | 15 | 15.5% |
| $150,000 to $199,999 | 3 | 3.1% |
| $200,000+ | 20 | 20.6% |
Household Income by Householder Age in Panama
The median household income in Panama is $69,250, with the highest median household income of $88,125 found in the 45 to 64 years age bracket for the primary householder. A total of 29 households (29.9%) fall into this category. Meanwhile, the 15 to 24 years age bracket for the primary householder has the lowest median household income of $0, with 3 households (3.1%) in this group.
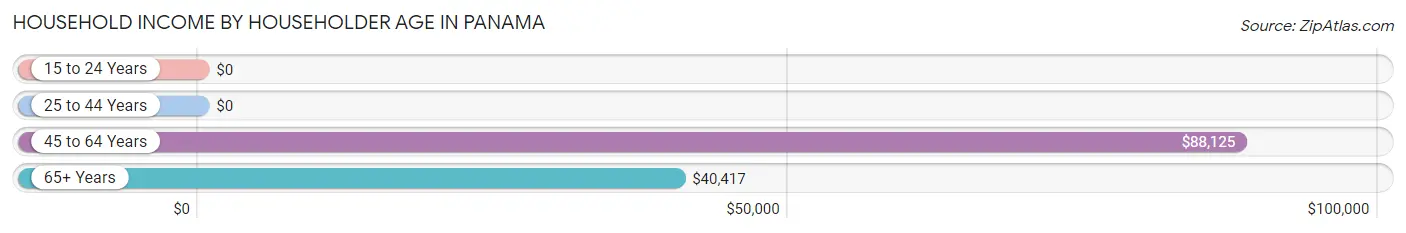
| Income Bracket | # Households | Median Income |
| 15 to 24 Years | 3 (3.1%) | $0 |
| 25 to 44 Years | 38 (39.2%) | $0 |
| 45 to 64 Years | 29 (29.9%) | $88,125 |
| 65+ Years | 27 (27.8%) | $40,417 |
| Total | 97 (100.0%) | $69,250 |
Poverty in Panama
Income Below Poverty by Sex and Age in Panama
With 8.9% poverty level for males and 4.5% for females among the residents of Panama, 65 to 74 year old males and 18 to 24 year old females are the most vulnerable to poverty, with 4 males (33.3%) and 2 females (25.0%) in their respective age groups living below the poverty level.
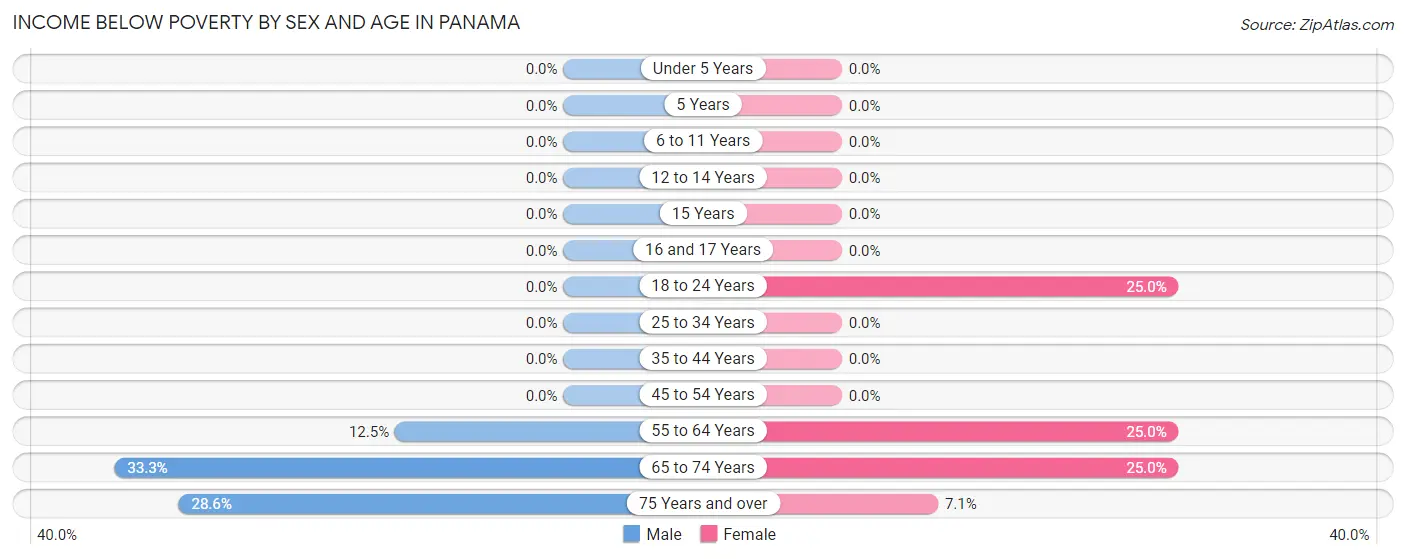
| Age Bracket | Male | Female |
| Under 5 Years | 0 (0.0%) | 0 (0.0%) |
| 5 Years | 0 (0.0%) | 0 (0.0%) |
| 6 to 11 Years | 0 (0.0%) | 0 (0.0%) |
| 12 to 14 Years | 0 (0.0%) | 0 (0.0%) |
| 15 Years | 0 (0.0%) | 0 (0.0%) |
| 16 and 17 Years | 0 (0.0%) | 0 (0.0%) |
| 18 to 24 Years | 0 (0.0%) | 2 (25.0%) |
| 25 to 34 Years | 0 (0.0%) | 0 (0.0%) |
| 35 to 44 Years | 0 (0.0%) | 0 (0.0%) |
| 45 to 54 Years | 0 (0.0%) | 0 (0.0%) |
| 55 to 64 Years | 2 (12.5%) | 2 (25.0%) |
| 65 to 74 Years | 4 (33.3%) | 2 (25.0%) |
| 75 Years and over | 2 (28.6%) | 1 (7.1%) |
| Total | 8 (8.9%) | 7 (4.5%) |
Income Above Poverty by Sex and Age in Panama
According to the poverty statistics in Panama, males aged under 5 years and females aged under 5 years are the age groups that are most secure financially, with 100.0% of males and 100.0% of females in these age groups living above the poverty line.
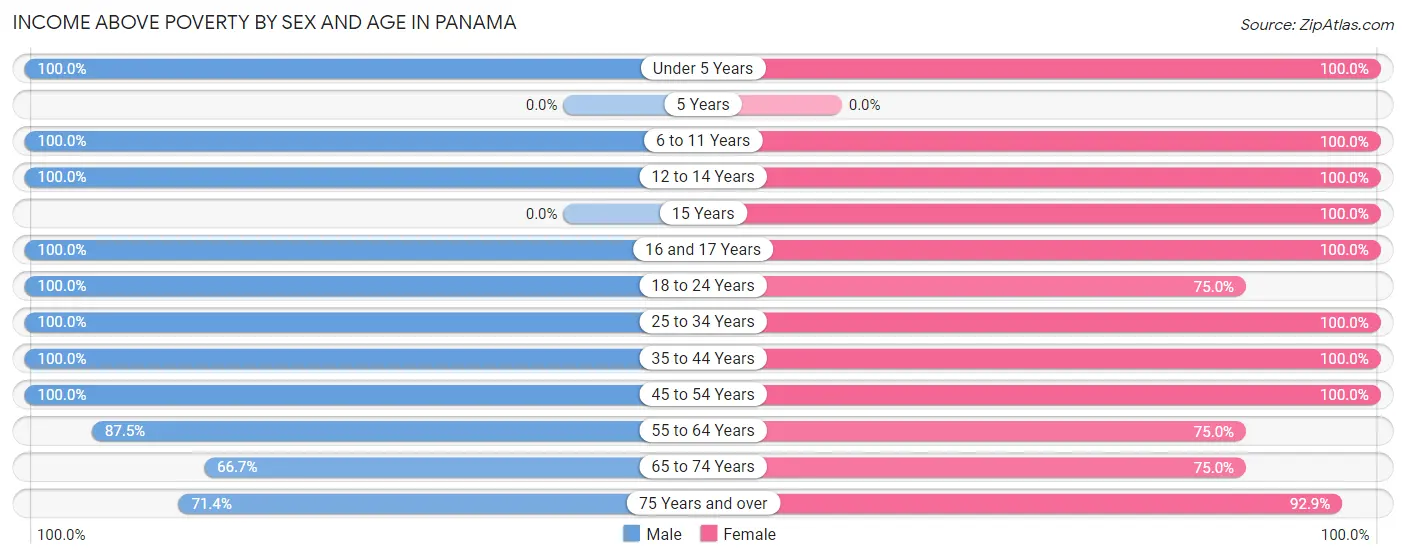
| Age Bracket | Male | Female |
| Under 5 Years | 2 (100.0%) | 2 (100.0%) |
| 5 Years | 0 (0.0%) | 0 (0.0%) |
| 6 to 11 Years | 2 (100.0%) | 6 (100.0%) |
| 12 to 14 Years | 3 (100.0%) | 22 (100.0%) |
| 15 Years | 0 (0.0%) | 2 (100.0%) |
| 16 and 17 Years | 10 (100.0%) | 29 (100.0%) |
| 18 to 24 Years | 3 (100.0%) | 6 (75.0%) |
| 25 to 34 Years | 8 (100.0%) | 10 (100.0%) |
| 35 to 44 Years | 16 (100.0%) | 27 (100.0%) |
| 45 to 54 Years | 11 (100.0%) | 20 (100.0%) |
| 55 to 64 Years | 14 (87.5%) | 6 (75.0%) |
| 65 to 74 Years | 8 (66.7%) | 6 (75.0%) |
| 75 Years and over | 5 (71.4%) | 13 (92.9%) |
| Total | 82 (91.1%) | 149 (95.5%) |
Income Below Poverty Among Married-Couple Families in Panama
The poverty statistics for married-couple families in Panama show that 7.0% or 4 of the total 57 families live below the poverty line. Families with no children have the highest poverty rate of 18.2%, comprising of 4 families. On the other hand, families with 1 or 2 children have the lowest poverty rate of 0.0%, which includes 0 families.
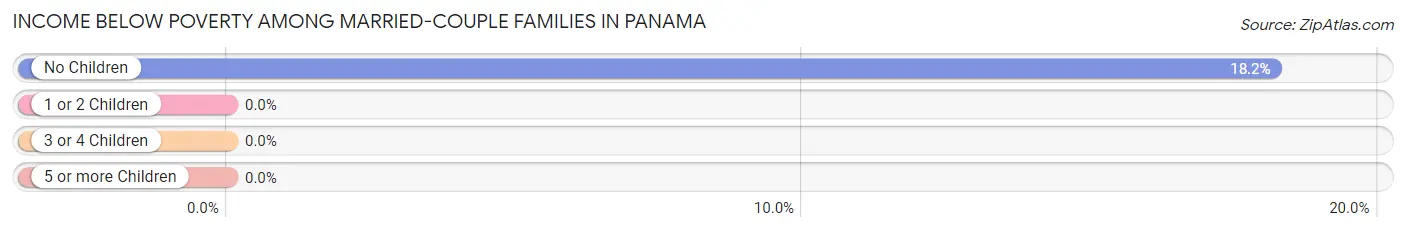
| Children | Above Poverty | Below Poverty |
| No Children | 18 (81.8%) | 4 (18.2%) |
| 1 or 2 Children | 29 (100.0%) | 0 (0.0%) |
| 3 or 4 Children | 1 (100.0%) | 0 (0.0%) |
| 5 or more Children | 5 (100.0%) | 0 (0.0%) |
| Total | 53 (93.0%) | 4 (7.0%) |
Income Below Poverty Among Single-Parent Households in Panama
| Children | Single Father | Single Mother |
| No Children | 0 (0.0%) | 0 (0.0%) |
| 1 or 2 Children | 0 (0.0%) | 0 (0.0%) |
| 3 or 4 Children | 0 (0.0%) | 0 (0.0%) |
| 5 or more Children | 0 (0.0%) | 0 (0.0%) |
| Total | 0 (0.0%) | 0 (0.0%) |
Income Below Poverty Among Married-Couple vs Single-Parent Households in Panama
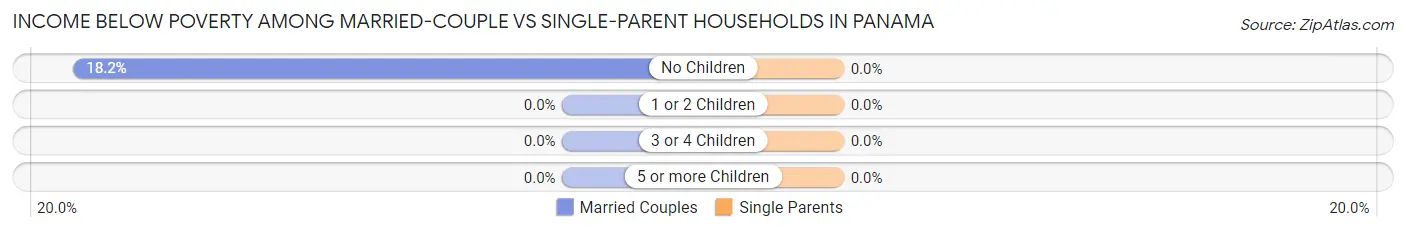
| Children | Married-Couple Families | Single-Parent Households |
| No Children | 4 (18.2%) | 0 (0.0%) |
| 1 or 2 Children | 0 (0.0%) | 0 (0.0%) |
| 3 or 4 Children | 0 (0.0%) | 0 (0.0%) |
| 5 or more Children | 0 (0.0%) | 0 (0.0%) |
| Total | 4 (7.0%) | 0 (0.0%) |
Race in Panama
The most populous races in Panama are White / Caucasian (237 | 96.0%), Some other Race (6 | 2.4%), and Native / Alaskan (2 | 0.8%).
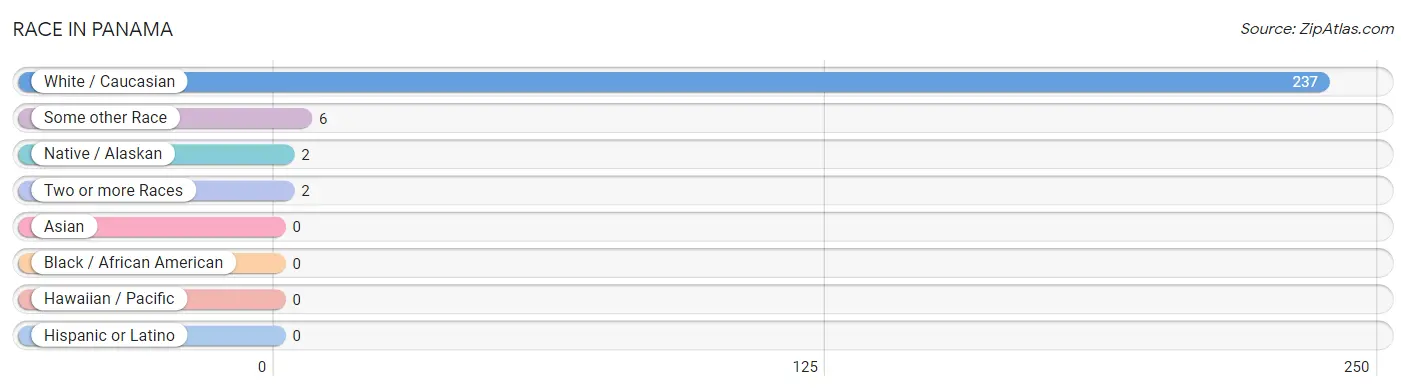
| Race | # Population | % Population |
| Asian | 0 | 0.0% |
| Black / African American | 0 | 0.0% |
| Hawaiian / Pacific | 0 | 0.0% |
| Hispanic or Latino | 0 | 0.0% |
| Native / Alaskan | 2 | 0.8% |
| White / Caucasian | 237 | 96.0% |
| Two or more Races | 2 | 0.8% |
| Some other Race | 6 | 2.4% |
| Total | 247 | 100.0% |
Ancestry in Panama
The most populous ancestries reported in Panama are German (157 | 63.6%), Irish (23 | 9.3%), Danish (18 | 7.3%), American (13 | 5.3%), and English (11 | 4.4%), together accounting for 89.9% of all Panama residents.
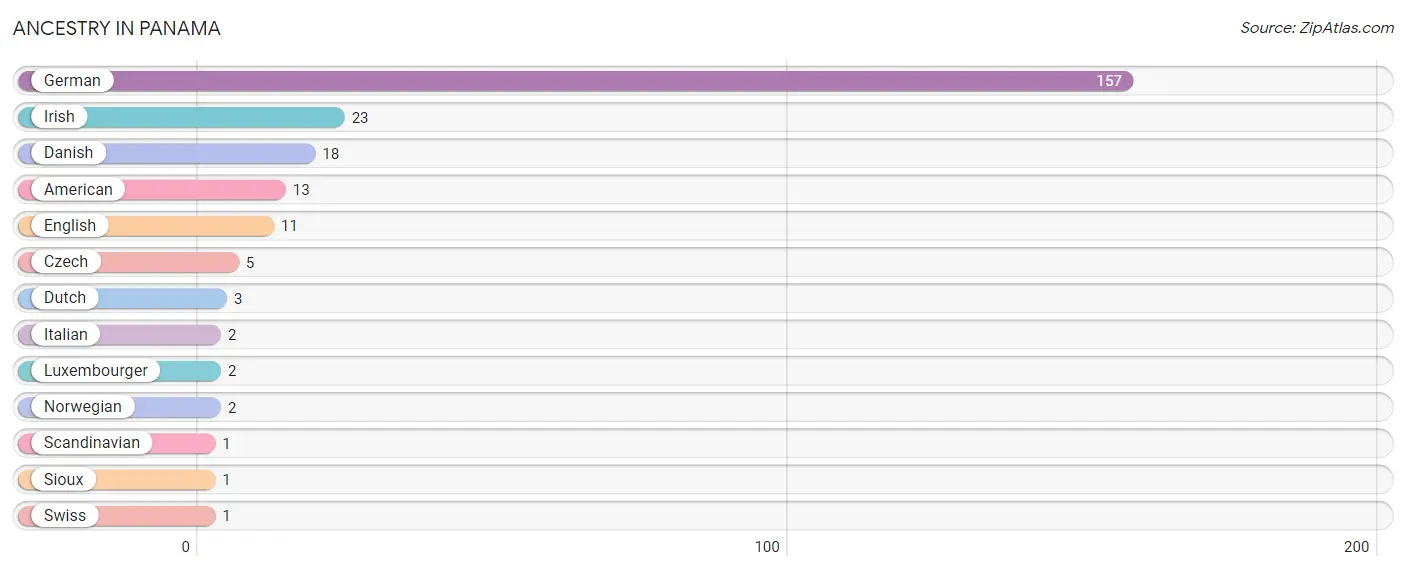
| Ancestry | # Population | % Population |
| American | 13 | 5.3% |
| Czech | 5 | 2.0% |
| Danish | 18 | 7.3% |
| Dutch | 3 | 1.2% |
| English | 11 | 4.4% |
| German | 157 | 63.6% |
| Irish | 23 | 9.3% |
| Italian | 2 | 0.8% |
| Luxembourger | 2 | 0.8% |
| Norwegian | 2 | 0.8% |
| Scandinavian | 1 | 0.4% |
| Sioux | 1 | 0.4% |
| Swiss | 1 | 0.4% | View All 13 Rows |
Immigrants in Panama

| Immigration Origin | # Population | % Population | View All 0 Rows |
Sex and Age in Panama
Sex and Age in Panama
The most populous age groups in Panama are 35 to 39 Years (13 | 14.4%) for men and 15 to 19 Years (31 | 19.8%) for women.
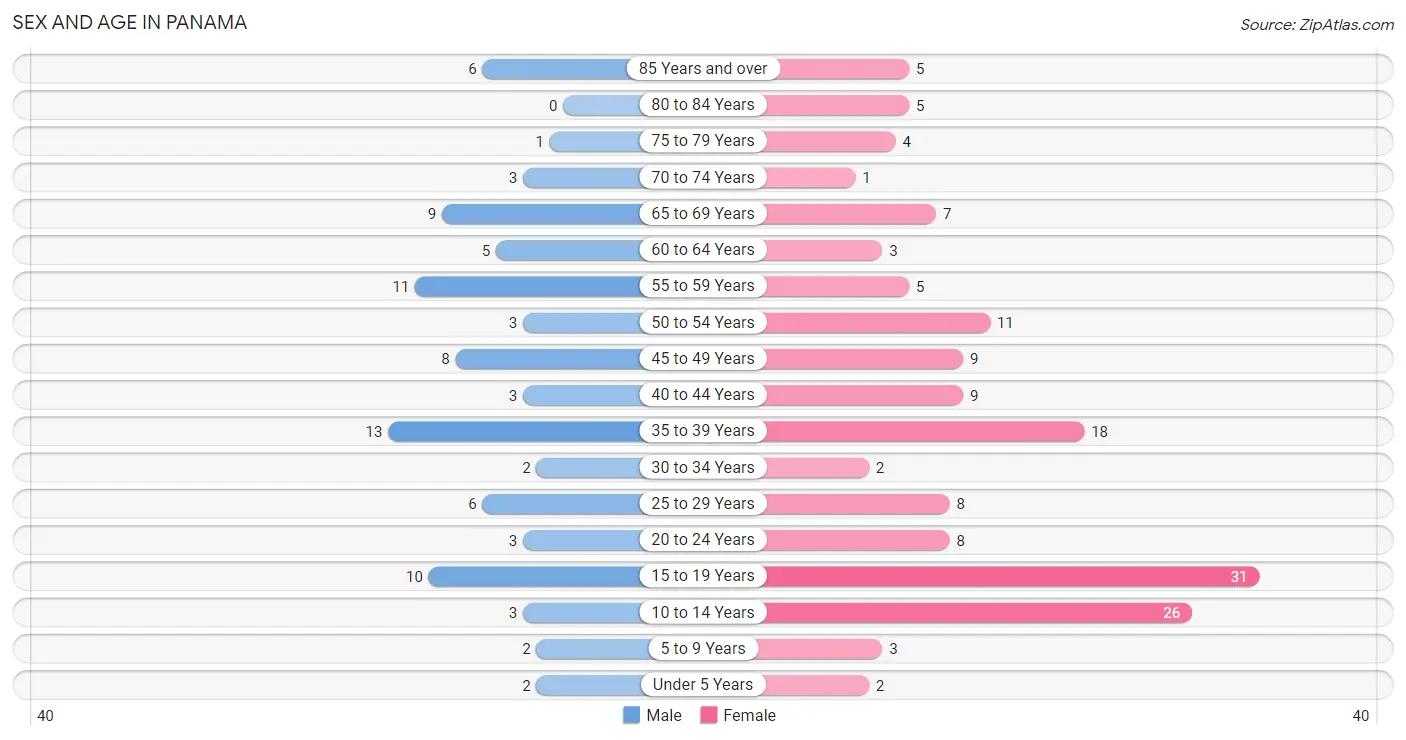
| Age Bracket | Male | Female |
| Under 5 Years | 2 (2.2%) | 2 (1.3%) |
| 5 to 9 Years | 2 (2.2%) | 3 (1.9%) |
| 10 to 14 Years | 3 (3.3%) | 26 (16.6%) |
| 15 to 19 Years | 10 (11.1%) | 31 (19.8%) |
| 20 to 24 Years | 3 (3.3%) | 8 (5.1%) |
| 25 to 29 Years | 6 (6.7%) | 8 (5.1%) |
| 30 to 34 Years | 2 (2.2%) | 2 (1.3%) |
| 35 to 39 Years | 13 (14.4%) | 18 (11.5%) |
| 40 to 44 Years | 3 (3.3%) | 9 (5.7%) |
| 45 to 49 Years | 8 (8.9%) | 9 (5.7%) |
| 50 to 54 Years | 3 (3.3%) | 11 (7.0%) |
| 55 to 59 Years | 11 (12.2%) | 5 (3.2%) |
| 60 to 64 Years | 5 (5.6%) | 3 (1.9%) |
| 65 to 69 Years | 9 (10.0%) | 7 (4.5%) |
| 70 to 74 Years | 3 (3.3%) | 1 (0.6%) |
| 75 to 79 Years | 1 (1.1%) | 4 (2.5%) |
| 80 to 84 Years | 0 (0.0%) | 5 (3.2%) |
| 85 Years and over | 6 (6.7%) | 5 (3.2%) |
| Total | 90 (100.0%) | 157 (100.0%) |
Families and Households in Panama
Median Family Size in Panama
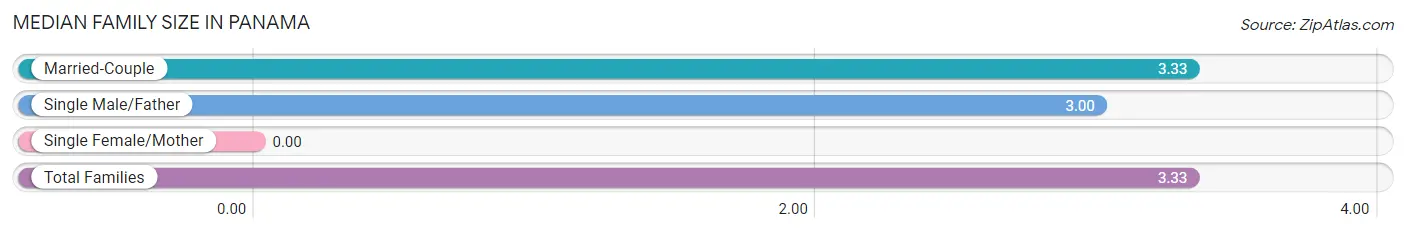
| Family Type | # Families | Family Size |
| Married-Couple | 57 (98.3%) | 3.33 |
| Single Male/Father | 1 (1.7%) | 3.00 |
| Single Female/Mother | 0 (0.0%) | - |
| Total Families | 58 (100.0%) | 3.33 |
Median Household Size in Panama
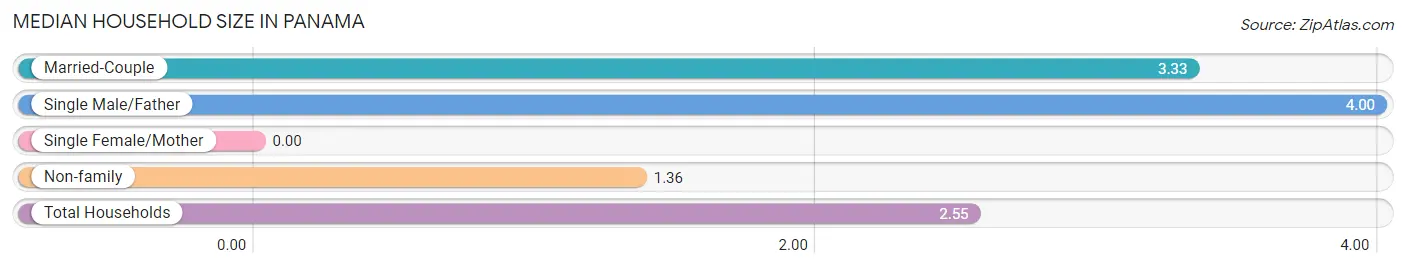
| Household Type | # Households | Household Size |
| Married-Couple | 57 (58.8%) | 3.33 |
| Single Male/Father | 1 (1.0%) | 4.00 |
| Single Female/Mother | 0 (0.0%) | - |
| Non-family | 39 (40.2%) | 1.36 |
| Total Households | 97 (100.0%) | 2.55 |
Household Size by Marriage Status in Panama
Out of a total of 97 households in Panama, 58 (59.8%) are family households, while 39 (40.2%) are nonfamily households. The most numerous type of family households are 4-person households, comprising 23, and the most common type of nonfamily households are 1-person households, comprising 28.
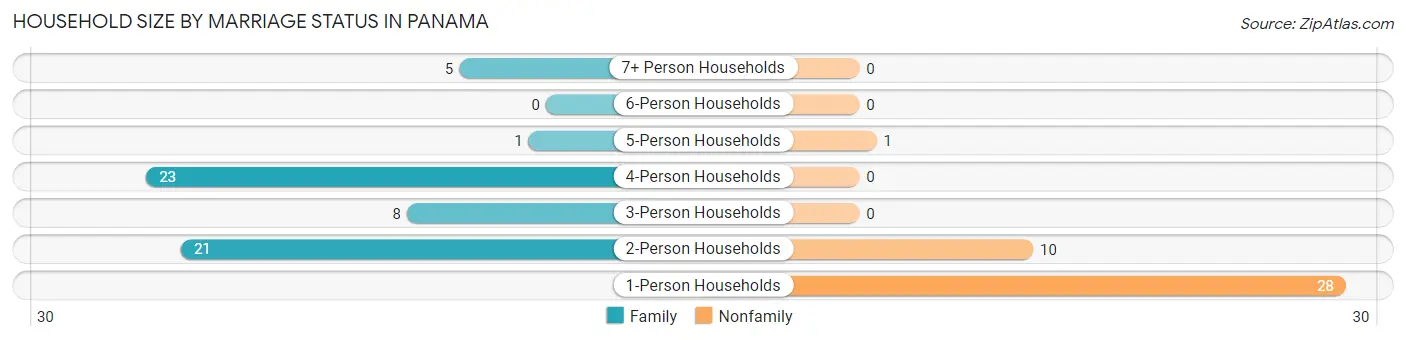
| Household Size | Family Households | Nonfamily Households |
| 1-Person Households | - | 28 (28.9%) |
| 2-Person Households | 21 (21.6%) | 10 (10.3%) |
| 3-Person Households | 8 (8.3%) | 0 (0.0%) |
| 4-Person Households | 23 (23.7%) | 0 (0.0%) |
| 5-Person Households | 1 (1.0%) | 1 (1.0%) |
| 6-Person Households | 0 (0.0%) | 0 (0.0%) |
| 7+ Person Households | 5 (5.1%) | 0 (0.0%) |
| Total | 58 (59.8%) | 39 (40.2%) |
Female Fertility in Panama
Fertility by Age in Panama
| Age Bracket | Women with Births | Births / 1,000 Women |
| 15 to 19 years | 0 (0.0%) | 0.0 |
| 20 to 34 years | 0 (0.0%) | 0.0 |
| 35 to 50 years | 0 (0.0%) | 0.0 |
| Total | 0 (0.0%) | 0.0 |
Fertility by Age by Marriage Status in Panama
| Age Bracket | Married | Unmarried |
| 15 to 19 years | 0 (0.0%) | 0 (0.0%) |
| 20 to 34 years | 0 (0.0%) | 0 (0.0%) |
| 35 to 50 years | 0 (0.0%) | 0 (0.0%) |
| Total | 0 (0.0%) | 0 (0.0%) |
Fertility by Education in Panama
| Educational Attainment | Women with Births | Births / 1,000 Women |
| Less than High School | 0 (0.0%) | 0.0 |
| High School Diploma | 0 (0.0%) | 0.0 |
| College or Associate's Degree | 0 (0.0%) | 0.0 |
| Bachelor's Degree | 0 (0.0%) | 0.0 |
| Graduate Degree | 0 (0.0%) | 0.0 |
| Total | 0 (0.0%) | 0.0 |
Fertility by Education by Marriage Status in Panama
| Educational Attainment | Married | Unmarried |
| Less than High School | 0 (0.0%) | 0 (0.0%) |
| High School Diploma | 0 (0.0%) | 0 (0.0%) |
| College or Associate's Degree | 0 (0.0%) | 0 (0.0%) |
| Bachelor's Degree | 0 (0.0%) | 0 (0.0%) |
| Graduate Degree | 0 (0.0%) | 0 (0.0%) |
| Total | 0 (0.0%) | 0 (0.0%) |
Employment Characteristics in Panama
Employment by Class of Employer in Panama
Among the 135 employed individuals in Panama, private company employees (94 | 69.6%), self-employed (not incorporated) (12 | 8.9%), and self-employed (incorporated) (10 | 7.4%) make up the most common classes of employment.
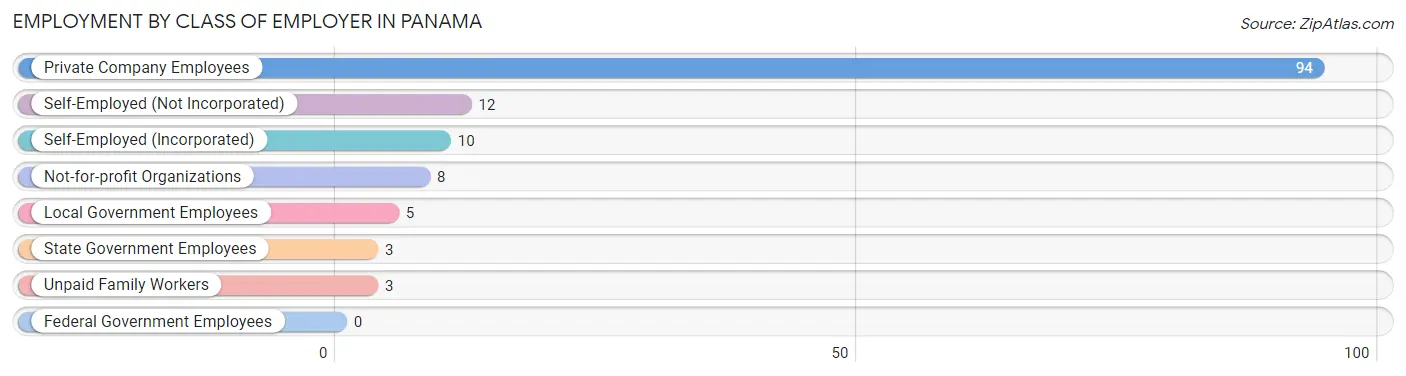
| Employer Class | # Employees | % Employees |
| Private Company Employees | 94 | 69.6% |
| Self-Employed (Incorporated) | 10 | 7.4% |
| Self-Employed (Not Incorporated) | 12 | 8.9% |
| Not-for-profit Organizations | 8 | 5.9% |
| Local Government Employees | 5 | 3.7% |
| State Government Employees | 3 | 2.2% |
| Federal Government Employees | 0 | 0.0% |
| Unpaid Family Workers | 3 | 2.2% |
| Total | 135 | 100.0% |
Employment Status by Age in Panama
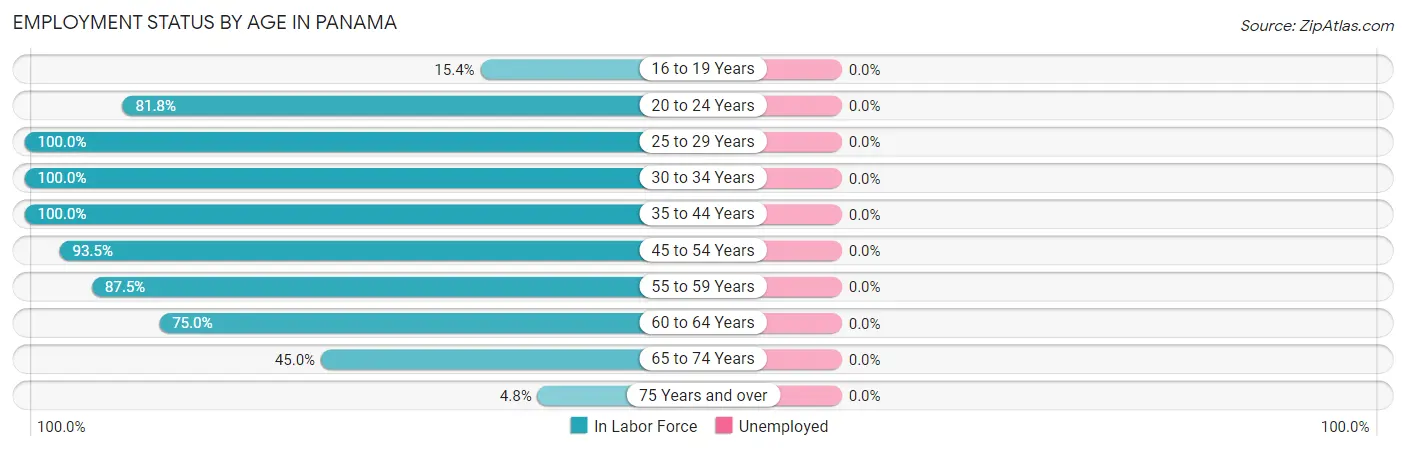
| Age Bracket | In Labor Force | Unemployed |
| 16 to 19 Years | 6 (15.4%) | 0 (0.0%) |
| 20 to 24 Years | 9 (81.8%) | 0 (0.0%) |
| 25 to 29 Years | 14 (100.0%) | 0 (0.0%) |
| 30 to 34 Years | 4 (100.0%) | 0 (0.0%) |
| 35 to 44 Years | 43 (100.0%) | 0 (0.0%) |
| 45 to 54 Years | 29 (93.5%) | 0 (0.0%) |
| 55 to 59 Years | 14 (87.5%) | 0 (0.0%) |
| 60 to 64 Years | 6 (75.0%) | 0 (0.0%) |
| 65 to 74 Years | 9 (45.0%) | 0 (0.0%) |
| 75 Years and over | 1 (4.8%) | 0 (0.0%) |
| Total | 135 (65.2%) | 0 (0.0%) |
Employment Status by Educational Attainment in Panama
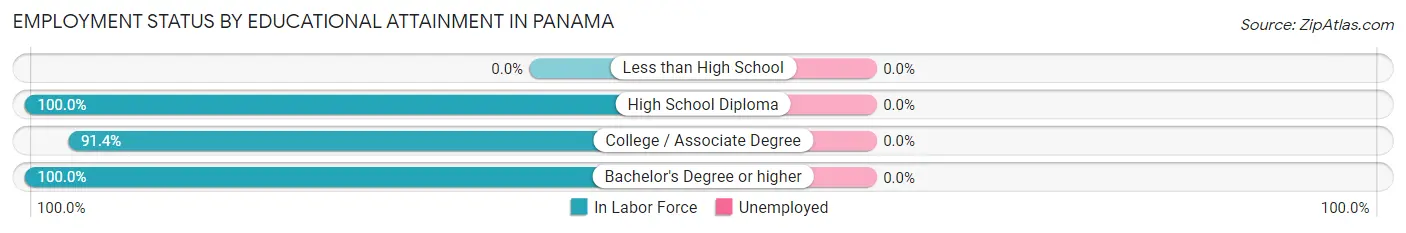
| Educational Attainment | In Labor Force | Unemployed |
| Less than High School | 0 (0.0%) | 0 (0.0%) |
| High School Diploma | 28 (100.0%) | 0 (0.0%) |
| College / Associate Degree | 64 (91.4%) | 0 (0.0%) |
| Bachelor's Degree or higher | 18 (100.0%) | 0 (0.0%) |
| Total | 110 (94.8%) | 0 (0.0%) |
Employment Occupations by Sex in Panama
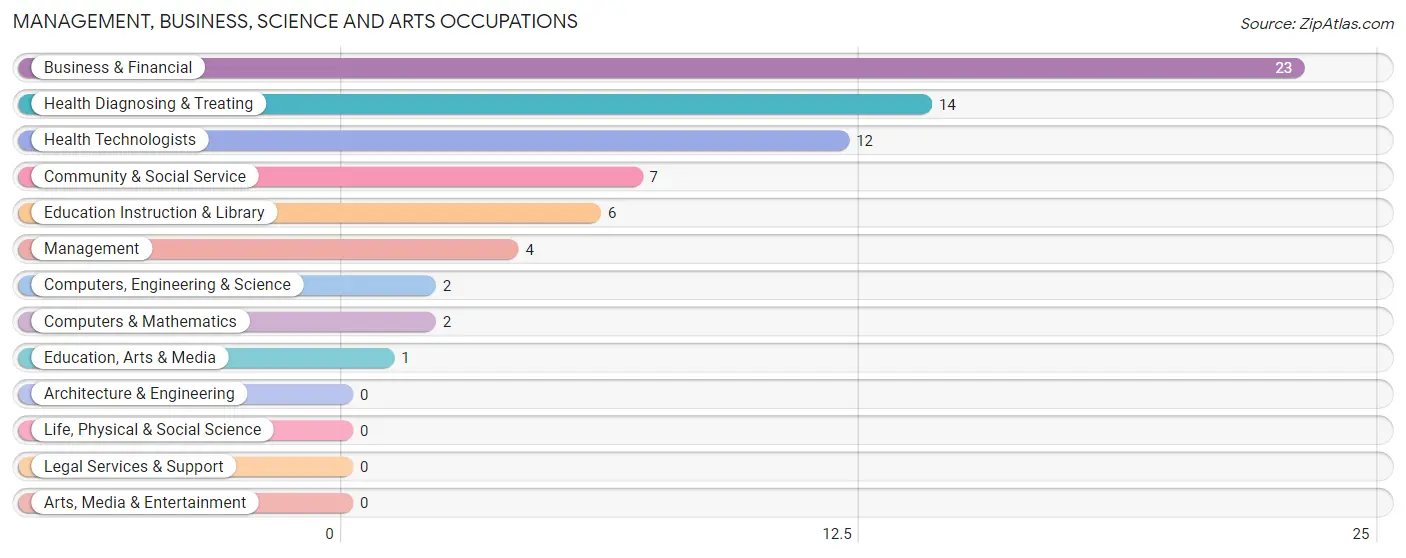
Management, Business, Science and Arts Occupations
The most common Management, Business, Science and Arts occupations in Panama are Business & Financial (23 | 17.0%), Health Diagnosing & Treating (14 | 10.4%), Health Technologists (12 | 8.9%), Community & Social Service (7 | 5.2%), and Education Instruction & Library (6 | 4.4%).
Management, Business, Science and Arts Occupations by Sex
Within the Management, Business, Science and Arts occupations in Panama, the most male-oriented occupations are Management (100.0%), Education, Arts & Media (100.0%), and Computers, Engineering & Science (50.0%), while the most female-oriented occupations are Health Diagnosing & Treating (100.0%), Health Technologists (100.0%), and Business & Financial (95.7%).
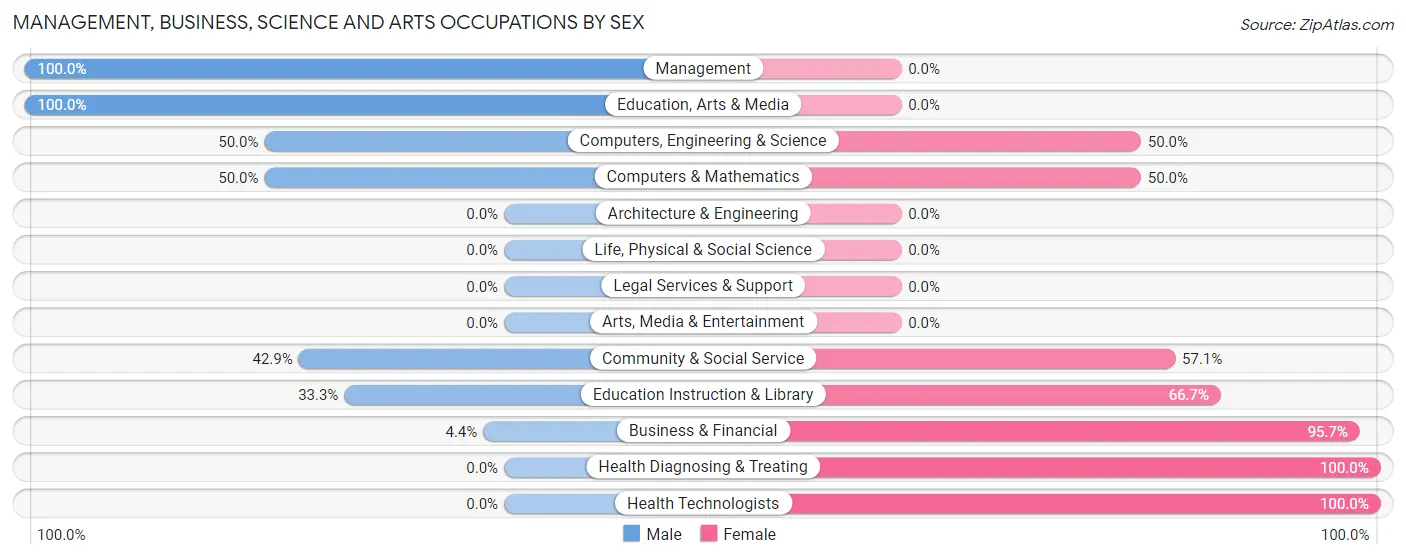
| Occupation | Male | Female |
| Management | 4 (100.0%) | 0 (0.0%) |
| Business & Financial | 1 (4.3%) | 22 (95.7%) |
| Computers, Engineering & Science | 1 (50.0%) | 1 (50.0%) |
| Computers & Mathematics | 1 (50.0%) | 1 (50.0%) |
| Architecture & Engineering | 0 (0.0%) | 0 (0.0%) |
| Life, Physical & Social Science | 0 (0.0%) | 0 (0.0%) |
| Community & Social Service | 3 (42.9%) | 4 (57.1%) |
| Education, Arts & Media | 1 (100.0%) | 0 (0.0%) |
| Legal Services & Support | 0 (0.0%) | 0 (0.0%) |
| Education Instruction & Library | 2 (33.3%) | 4 (66.7%) |
| Arts, Media & Entertainment | 0 (0.0%) | 0 (0.0%) |
| Health Diagnosing & Treating | 0 (0.0%) | 14 (100.0%) |
| Health Technologists | 0 (0.0%) | 12 (100.0%) |
| Total (Category) | 9 (18.0%) | 41 (82.0%) |
| Total (Overall) | 62 (45.9%) | 73 (54.1%) |
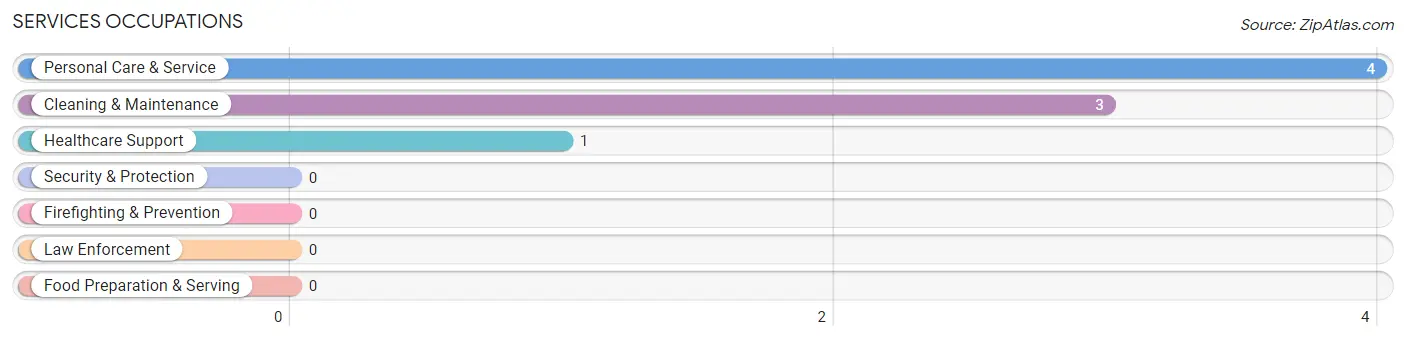
Services Occupations
The most common Services occupations in Panama are Personal Care & Service (4 | 3.0%), Cleaning & Maintenance (3 | 2.2%), and Healthcare Support (1 | 0.7%).
Services Occupations by Sex
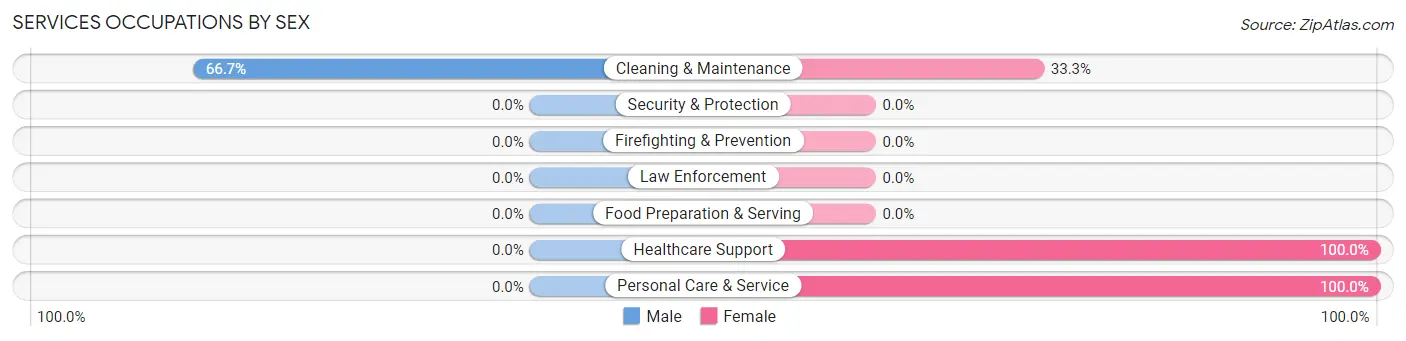
| Occupation | Male | Female |
| Healthcare Support | 0 (0.0%) | 1 (100.0%) |
| Security & Protection | 0 (0.0%) | 0 (0.0%) |
| Firefighting & Prevention | 0 (0.0%) | 0 (0.0%) |
| Law Enforcement | 0 (0.0%) | 0 (0.0%) |
| Food Preparation & Serving | 0 (0.0%) | 0 (0.0%) |
| Cleaning & Maintenance | 2 (66.7%) | 1 (33.3%) |
| Personal Care & Service | 0 (0.0%) | 4 (100.0%) |
| Total (Category) | 2 (25.0%) | 6 (75.0%) |
| Total (Overall) | 62 (45.9%) | 73 (54.1%) |
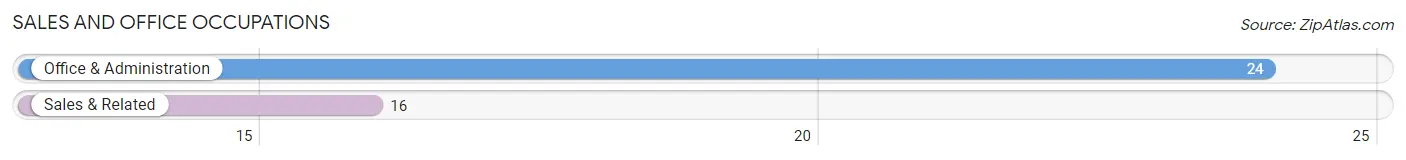
Sales and Office Occupations
The most common Sales and Office occupations in Panama are Office & Administration (24 | 17.8%), and Sales & Related (16 | 11.8%).
Sales and Office Occupations by Sex
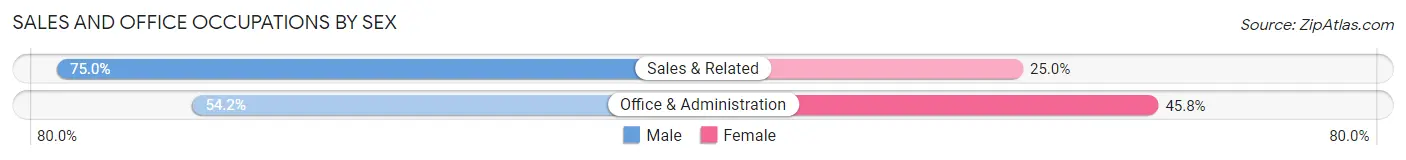
| Occupation | Male | Female |
| Sales & Related | 12 (75.0%) | 4 (25.0%) |
| Office & Administration | 13 (54.2%) | 11 (45.8%) |
| Total (Category) | 25 (62.5%) | 15 (37.5%) |
| Total (Overall) | 62 (45.9%) | 73 (54.1%) |
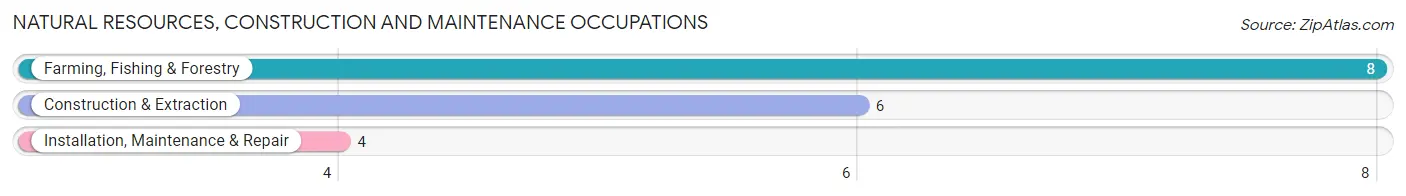
Natural Resources, Construction and Maintenance Occupations
The most common Natural Resources, Construction and Maintenance occupations in Panama are Farming, Fishing & Forestry (8 | 5.9%), Construction & Extraction (6 | 4.4%), and Installation, Maintenance & Repair (4 | 3.0%).
Natural Resources, Construction and Maintenance Occupations by Sex
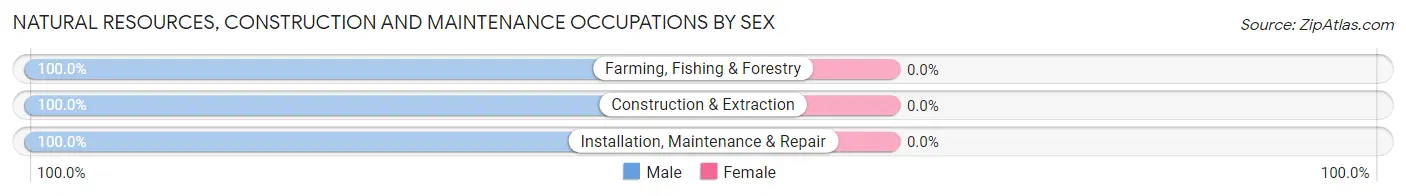
| Occupation | Male | Female |
| Farming, Fishing & Forestry | 8 (100.0%) | 0 (0.0%) |
| Construction & Extraction | 6 (100.0%) | 0 (0.0%) |
| Installation, Maintenance & Repair | 4 (100.0%) | 0 (0.0%) |
| Total (Category) | 18 (100.0%) | 0 (0.0%) |
| Total (Overall) | 62 (45.9%) | 73 (54.1%) |
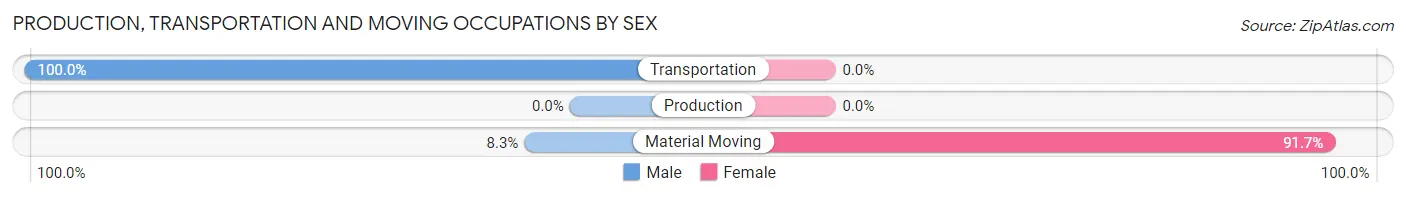
Production, Transportation and Moving Occupations
The most common Production, Transportation and Moving occupations in Panama are Material Moving (12 | 8.9%), and Transportation (7 | 5.2%).
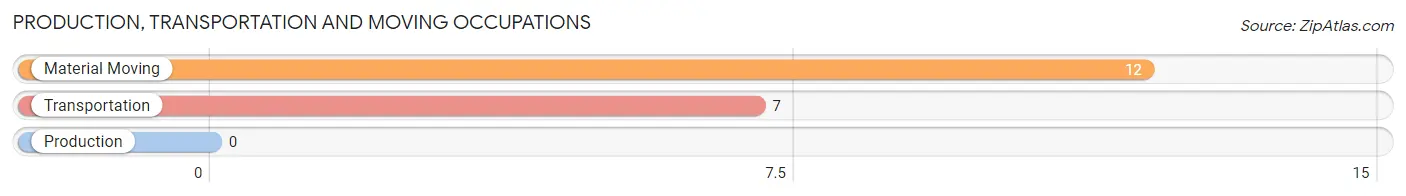
Production, Transportation and Moving Occupations by Sex
| Occupation | Male | Female |
| Production | 0 (0.0%) | 0 (0.0%) |
| Transportation | 7 (100.0%) | 0 (0.0%) |
| Material Moving | 1 (8.3%) | 11 (91.7%) |
| Total (Category) | 8 (42.1%) | 11 (57.9%) |
| Total (Overall) | 62 (45.9%) | 73 (54.1%) |
Employment Industries by Sex in Panama
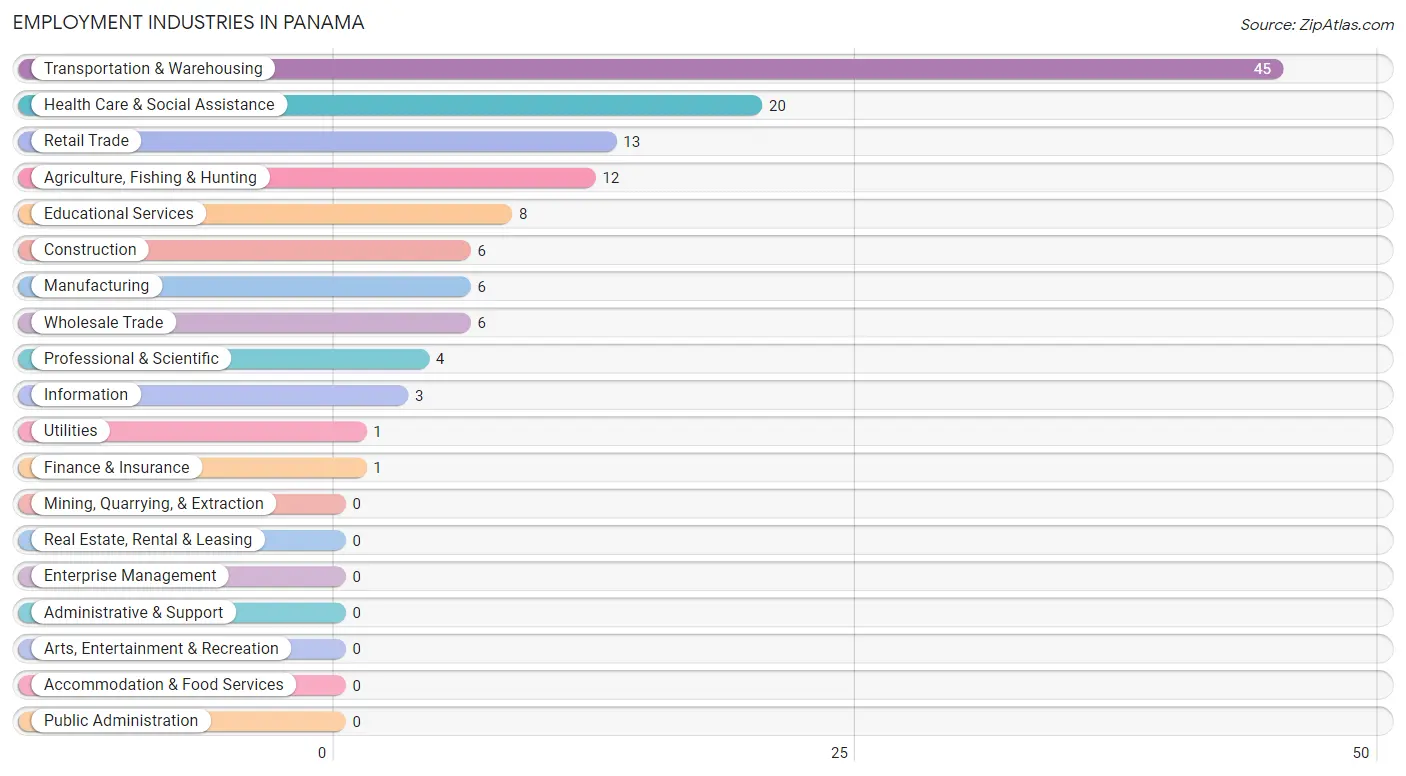
Employment Industries in Panama
The major employment industries in Panama include Transportation & Warehousing (45 | 33.3%), Health Care & Social Assistance (20 | 14.8%), Retail Trade (13 | 9.6%), Agriculture, Fishing & Hunting (12 | 8.9%), and Educational Services (8 | 5.9%).
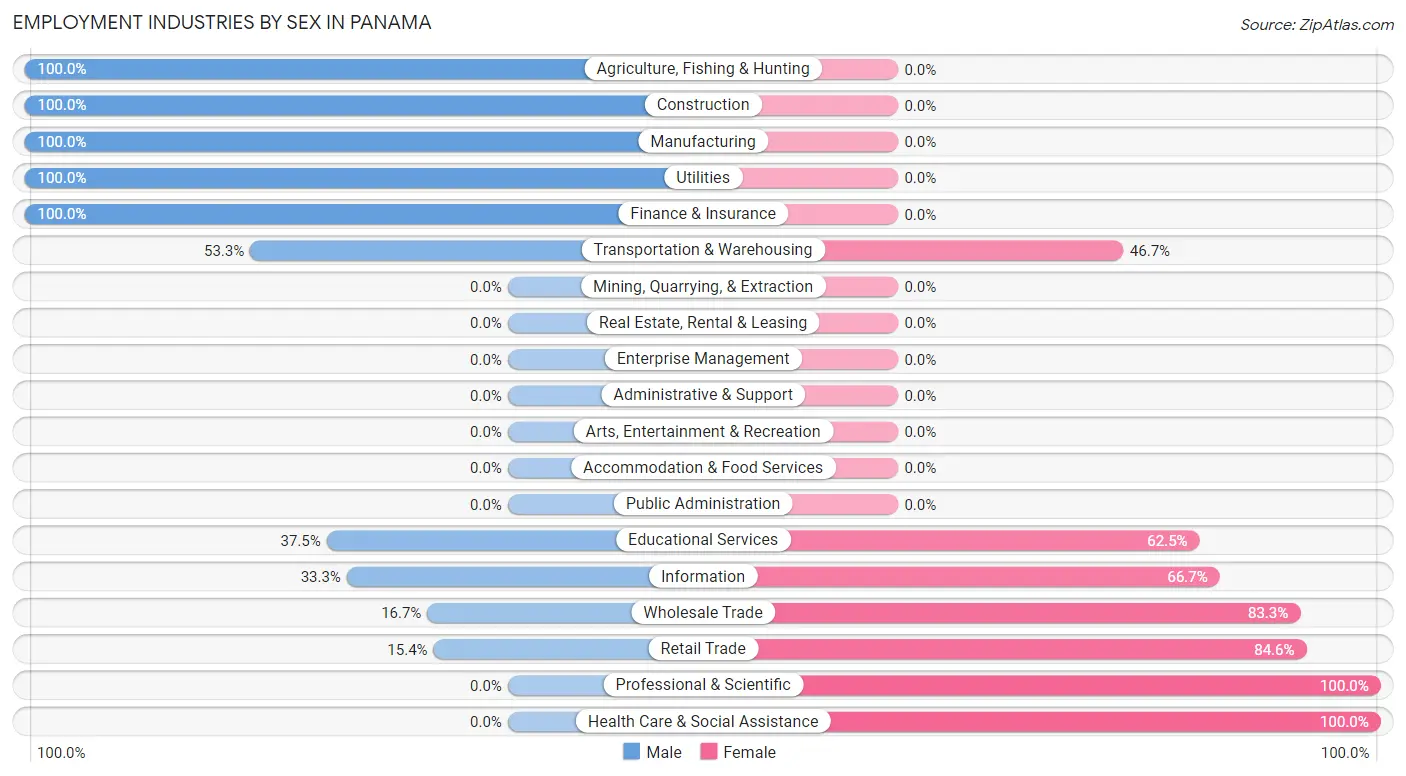
Employment Industries by Sex in Panama
The Panama industries that see more men than women are Agriculture, Fishing & Hunting (100.0%), Construction (100.0%), and Manufacturing (100.0%), whereas the industries that tend to have a higher number of women are Professional & Scientific (100.0%), Health Care & Social Assistance (100.0%), and Retail Trade (84.6%).
| Industry | Male | Female |
| Agriculture, Fishing & Hunting | 12 (100.0%) | 0 (0.0%) |
| Mining, Quarrying, & Extraction | 0 (0.0%) | 0 (0.0%) |
| Construction | 6 (100.0%) | 0 (0.0%) |
| Manufacturing | 6 (100.0%) | 0 (0.0%) |
| Wholesale Trade | 1 (16.7%) | 5 (83.3%) |
| Retail Trade | 2 (15.4%) | 11 (84.6%) |
| Transportation & Warehousing | 24 (53.3%) | 21 (46.7%) |
| Utilities | 1 (100.0%) | 0 (0.0%) |
| Information | 1 (33.3%) | 2 (66.7%) |
| Finance & Insurance | 1 (100.0%) | 0 (0.0%) |
| Real Estate, Rental & Leasing | 0 (0.0%) | 0 (0.0%) |
| Professional & Scientific | 0 (0.0%) | 4 (100.0%) |
| Enterprise Management | 0 (0.0%) | 0 (0.0%) |
| Administrative & Support | 0 (0.0%) | 0 (0.0%) |
| Educational Services | 3 (37.5%) | 5 (62.5%) |
| Health Care & Social Assistance | 0 (0.0%) | 20 (100.0%) |
| Arts, Entertainment & Recreation | 0 (0.0%) | 0 (0.0%) |
| Accommodation & Food Services | 0 (0.0%) | 0 (0.0%) |
| Public Administration | 0 (0.0%) | 0 (0.0%) |
| Total | 62 (45.9%) | 73 (54.1%) |
Education in Panama
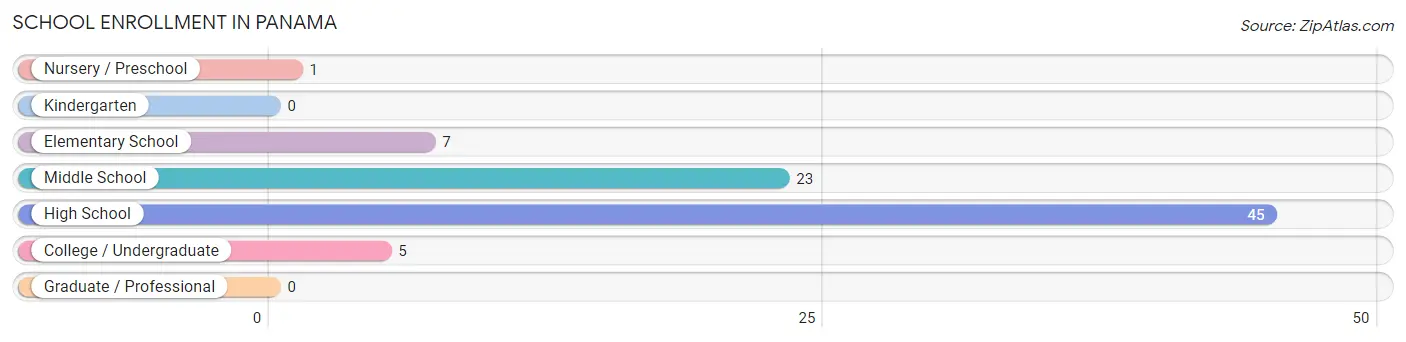
School Enrollment in Panama
The most common levels of schooling among the 81 students in Panama are high school (45 | 55.6%), middle school (23 | 28.4%), and elementary school (7 | 8.6%).
| School Level | # Students | % Students |
| Nursery / Preschool | 1 | 1.2% |
| Kindergarten | 0 | 0.0% |
| Elementary School | 7 | 8.6% |
| Middle School | 23 | 28.4% |
| High School | 45 | 55.6% |
| College / Undergraduate | 5 | 6.2% |
| Graduate / Professional | 0 | 0.0% |
| Total | 81 | 100.0% |
School Enrollment by Age by Funding Source in Panama
Out of a total of 81 students who are enrolled in schools in Panama, 1 (1.2%) attend a private institution, while the remaining 80 (98.8%) are enrolled in public schools. The age group of 5 to 9 year old has the highest likelihood of being enrolled in private schools, with 1 (20.0% in the age bracket) enrolled. Conversely, the age group of 3 to 4 year olds has the lowest likelihood of being enrolled in a private school, with 1 (100.0% in the age bracket) attending a public institution.
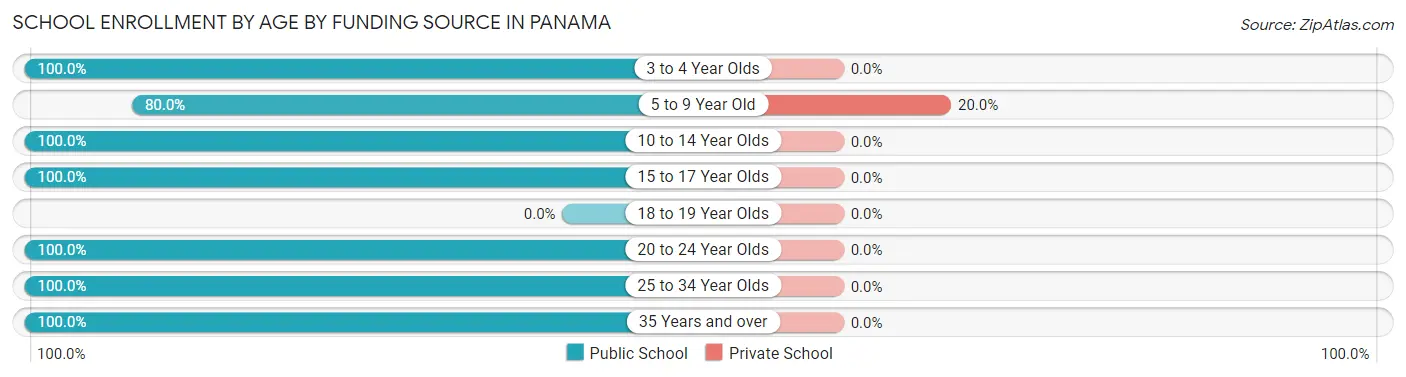
| Age Bracket | Public School | Private School |
| 3 to 4 Year Olds | 1 (100.0%) | 0 (0.0%) |
| 5 to 9 Year Old | 4 (80.0%) | 1 (20.0%) |
| 10 to 14 Year Olds | 29 (100.0%) | 0 (0.0%) |
| 15 to 17 Year Olds | 41 (100.0%) | 0 (0.0%) |
| 18 to 19 Year Olds | 0 (0.0%) | 0 (0.0%) |
| 20 to 24 Year Olds | 2 (100.0%) | 0 (0.0%) |
| 25 to 34 Year Olds | 2 (100.0%) | 0 (0.0%) |
| 35 Years and over | 1 (100.0%) | 0 (0.0%) |
| Total | 80 (98.8%) | 1 (1.2%) |
Educational Attainment by Field of Study in Panama
Science & technology (7 | 31.8%), bio, nature & agricultural (5 | 22.7%), education (5 | 22.7%), business (2 | 9.1%), and liberal arts & history (2 | 9.1%) are the most common fields of study among 22 individuals in Panama who have obtained a bachelor's degree or higher.
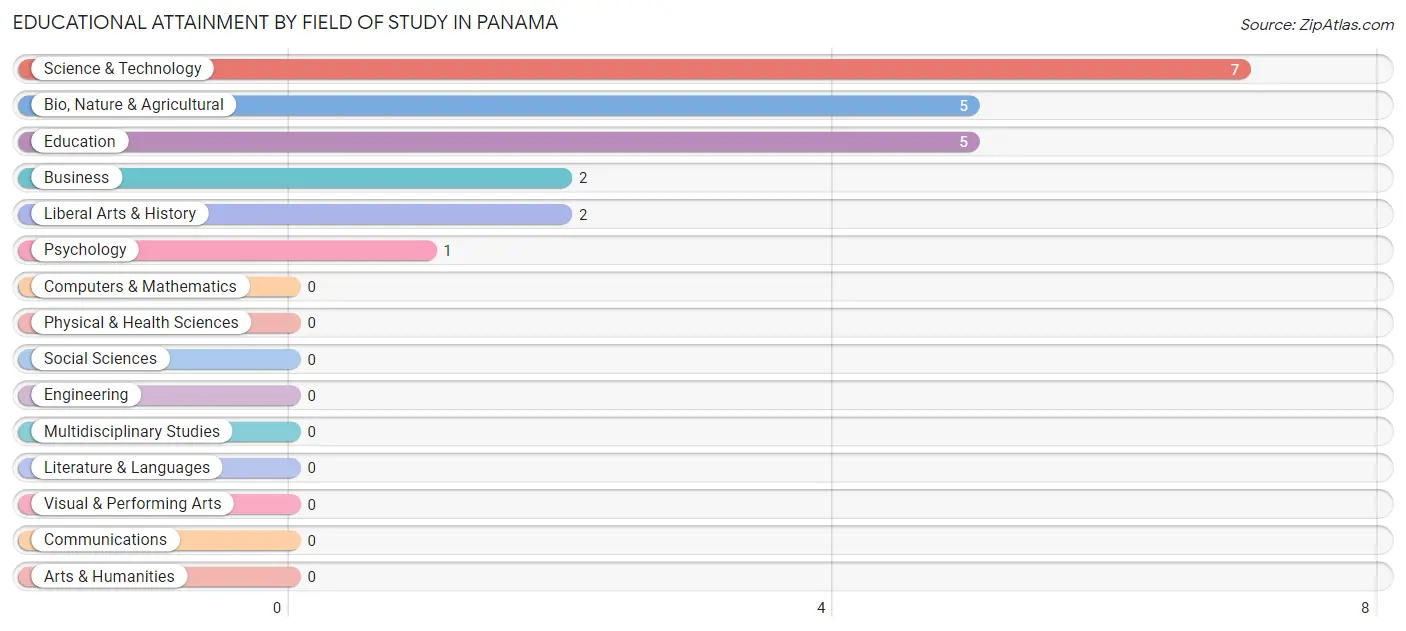
| Field of Study | # Graduates | % Graduates |
| Computers & Mathematics | 0 | 0.0% |
| Bio, Nature & Agricultural | 5 | 22.7% |
| Physical & Health Sciences | 0 | 0.0% |
| Psychology | 1 | 4.5% |
| Social Sciences | 0 | 0.0% |
| Engineering | 0 | 0.0% |
| Multidisciplinary Studies | 0 | 0.0% |
| Science & Technology | 7 | 31.8% |
| Business | 2 | 9.1% |
| Education | 5 | 22.7% |
| Literature & Languages | 0 | 0.0% |
| Liberal Arts & History | 2 | 9.1% |
| Visual & Performing Arts | 0 | 0.0% |
| Communications | 0 | 0.0% |
| Arts & Humanities | 0 | 0.0% |
| Total | 22 | 100.0% |
Transportation & Commute in Panama
Vehicle Availability by Sex in Panama
The most prevalent vehicle ownership categories in Panama are males with 5 or more vehicles (21, accounting for 33.9%) and females with 5 or more vehicles (23, making up 28.8%).
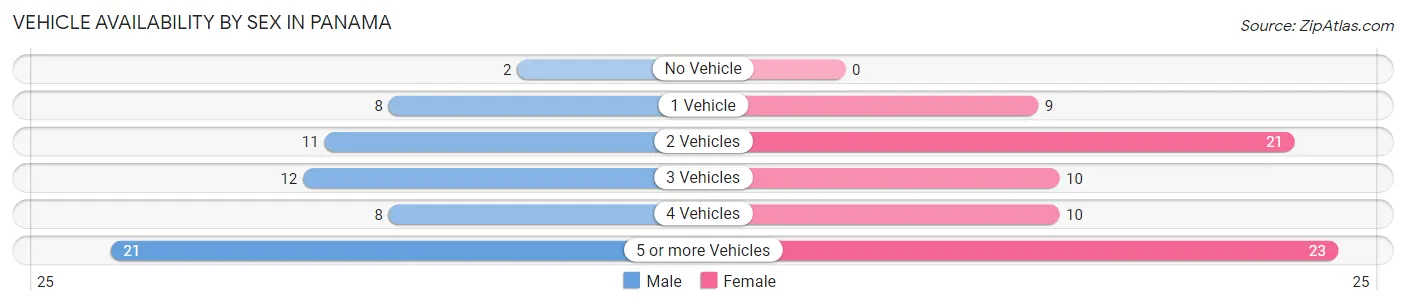
| Vehicles Available | Male | Female |
| No Vehicle | 2 (3.2%) | 0 (0.0%) |
| 1 Vehicle | 8 (12.9%) | 9 (12.3%) |
| 2 Vehicles | 11 (17.7%) | 21 (28.8%) |
| 3 Vehicles | 12 (19.4%) | 10 (13.7%) |
| 4 Vehicles | 8 (12.9%) | 10 (13.7%) |
| 5 or more Vehicles | 21 (33.9%) | 23 (31.5%) |
| Total | 62 (100.0%) | 73 (100.0%) |
Commute Time in Panama
The most frequently occuring commute durations in Panama are less than 5 minutes (50 commuters, 41.7%), 5 to 9 minutes (17 commuters, 14.2%), and 15 to 19 minutes (16 commuters, 13.3%).
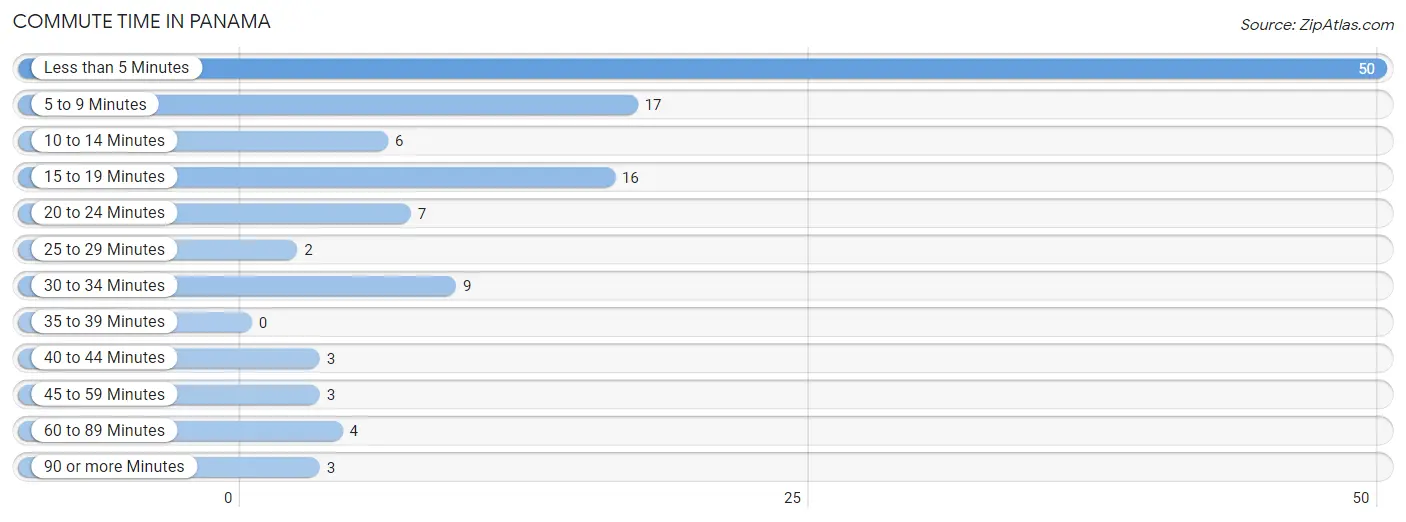
| Commute Time | # Commuters | % Commuters |
| Less than 5 Minutes | 50 | 41.7% |
| 5 to 9 Minutes | 17 | 14.2% |
| 10 to 14 Minutes | 6 | 5.0% |
| 15 to 19 Minutes | 16 | 13.3% |
| 20 to 24 Minutes | 7 | 5.8% |
| 25 to 29 Minutes | 2 | 1.7% |
| 30 to 34 Minutes | 9 | 7.5% |
| 35 to 39 Minutes | 0 | 0.0% |
| 40 to 44 Minutes | 3 | 2.5% |
| 45 to 59 Minutes | 3 | 2.5% |
| 60 to 89 Minutes | 4 | 3.3% |
| 90 or more Minutes | 3 | 2.5% |
Commute Time by Sex in Panama
The most common commute times in Panama are less than 5 minutes (23 commuters, 37.1%) for males and less than 5 minutes (27 commuters, 46.6%) for females.
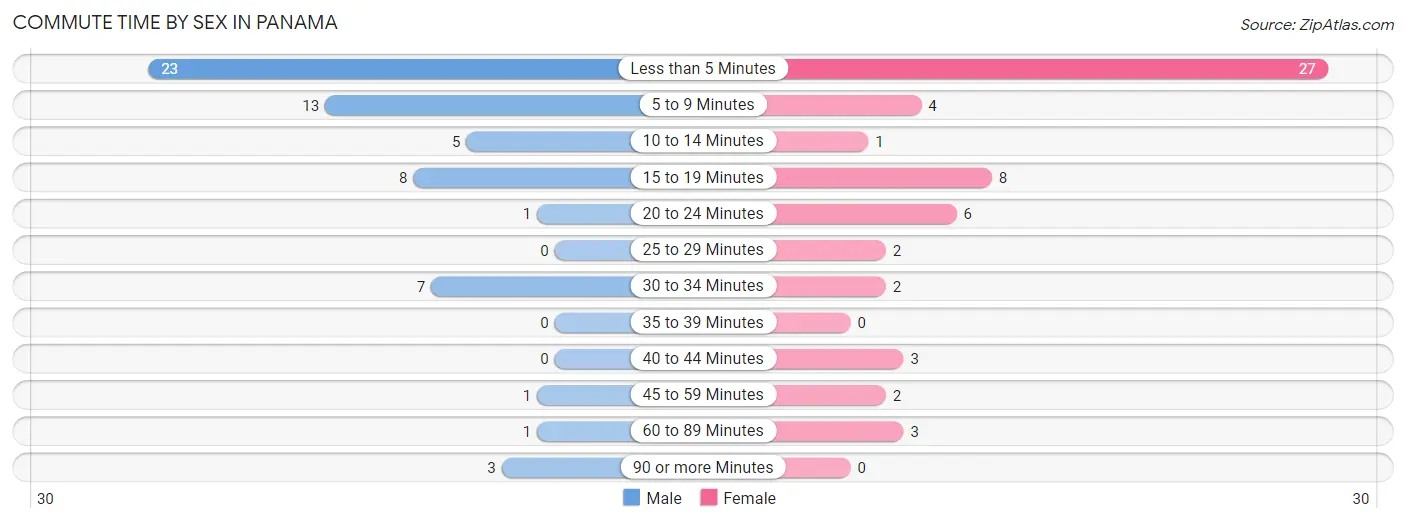
| Commute Time | Male | Female |
| Less than 5 Minutes | 23 (37.1%) | 27 (46.6%) |
| 5 to 9 Minutes | 13 (21.0%) | 4 (6.9%) |
| 10 to 14 Minutes | 5 (8.1%) | 1 (1.7%) |
| 15 to 19 Minutes | 8 (12.9%) | 8 (13.8%) |
| 20 to 24 Minutes | 1 (1.6%) | 6 (10.3%) |
| 25 to 29 Minutes | 0 (0.0%) | 2 (3.5%) |
| 30 to 34 Minutes | 7 (11.3%) | 2 (3.5%) |
| 35 to 39 Minutes | 0 (0.0%) | 0 (0.0%) |
| 40 to 44 Minutes | 0 (0.0%) | 3 (5.2%) |
| 45 to 59 Minutes | 1 (1.6%) | 2 (3.5%) |
| 60 to 89 Minutes | 1 (1.6%) | 3 (5.2%) |
| 90 or more Minutes | 3 (4.8%) | 0 (0.0%) |
Time of Departure to Work by Sex in Panama
The most frequent times of departure to work in Panama are 8:00 AM to 8:29 AM (17, 27.4%) for males and 9:00 AM to 9:59 AM (18, 31.0%) for females.
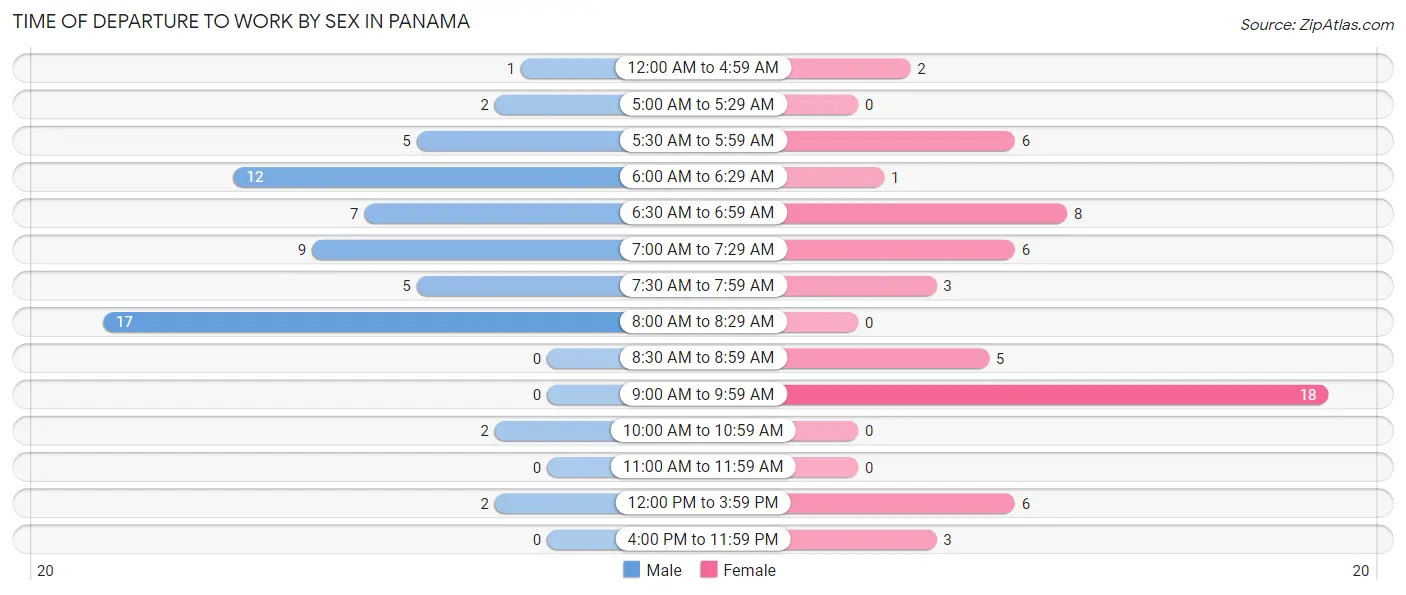
| Time of Departure | Male | Female |
| 12:00 AM to 4:59 AM | 1 (1.6%) | 2 (3.5%) |
| 5:00 AM to 5:29 AM | 2 (3.2%) | 0 (0.0%) |
| 5:30 AM to 5:59 AM | 5 (8.1%) | 6 (10.3%) |
| 6:00 AM to 6:29 AM | 12 (19.4%) | 1 (1.7%) |
| 6:30 AM to 6:59 AM | 7 (11.3%) | 8 (13.8%) |
| 7:00 AM to 7:29 AM | 9 (14.5%) | 6 (10.3%) |
| 7:30 AM to 7:59 AM | 5 (8.1%) | 3 (5.2%) |
| 8:00 AM to 8:29 AM | 17 (27.4%) | 0 (0.0%) |
| 8:30 AM to 8:59 AM | 0 (0.0%) | 5 (8.6%) |
| 9:00 AM to 9:59 AM | 0 (0.0%) | 18 (31.0%) |
| 10:00 AM to 10:59 AM | 2 (3.2%) | 0 (0.0%) |
| 11:00 AM to 11:59 AM | 0 (0.0%) | 0 (0.0%) |
| 12:00 PM to 3:59 PM | 2 (3.2%) | 6 (10.3%) |
| 4:00 PM to 11:59 PM | 0 (0.0%) | 3 (5.2%) |
| Total | 62 (100.0%) | 58 (100.0%) |
Housing Occupancy in Panama
Occupancy by Ownership in Panama
Of the total 97 dwellings in Panama, owner-occupied units account for 91 (93.8%), while renter-occupied units make up 6 (6.2%).
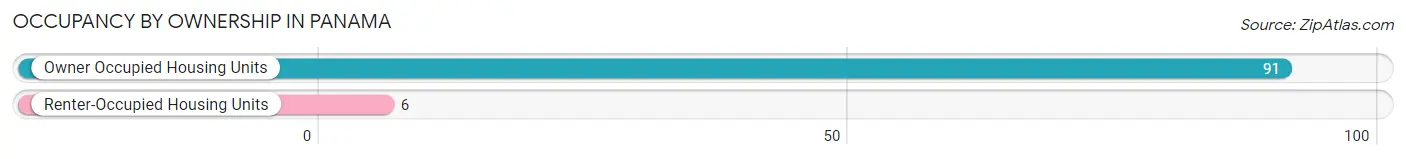
| Occupancy | # Housing Units | % Housing Units |
| Owner Occupied Housing Units | 91 | 93.8% |
| Renter-Occupied Housing Units | 6 | 6.2% |
| Total Occupied Housing Units | 97 | 100.0% |
Occupancy by Household Size in Panama
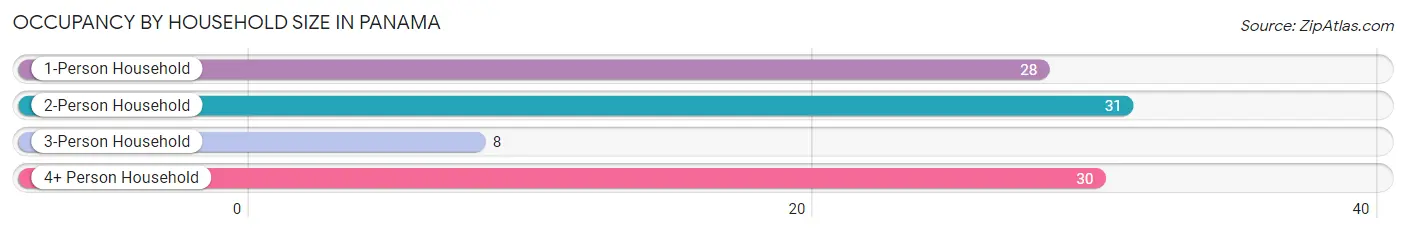
| Household Size | # Housing Units | % Housing Units |
| 1-Person Household | 28 | 28.9% |
| 2-Person Household | 31 | 32.0% |
| 3-Person Household | 8 | 8.3% |
| 4+ Person Household | 30 | 30.9% |
| Total Housing Units | 97 | 100.0% |
Occupancy by Ownership by Household Size in Panama
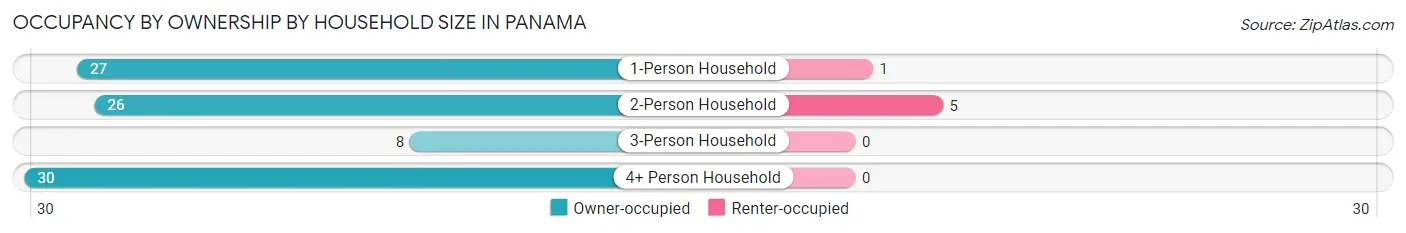
| Household Size | Owner-occupied | Renter-occupied |
| 1-Person Household | 27 (96.4%) | 1 (3.6%) |
| 2-Person Household | 26 (83.9%) | 5 (16.1%) |
| 3-Person Household | 8 (100.0%) | 0 (0.0%) |
| 4+ Person Household | 30 (100.0%) | 0 (0.0%) |
| Total Housing Units | 91 (93.8%) | 6 (6.2%) |
Occupancy by Educational Attainment in Panama
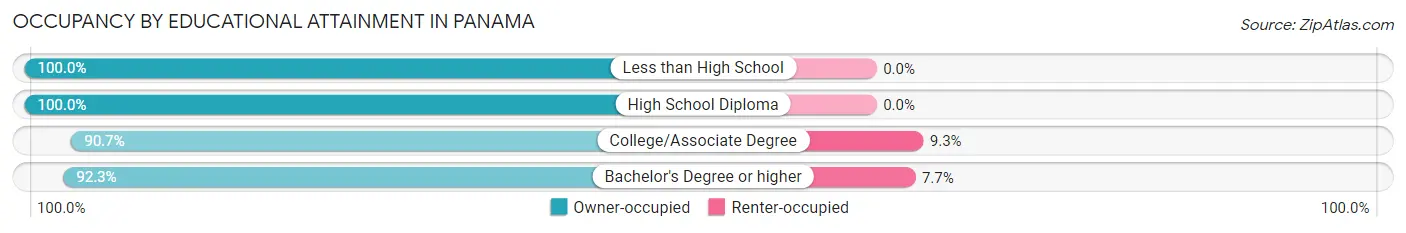
| Household Size | Owner-occupied | Renter-occupied |
| Less than High School | 6 (100.0%) | 0 (0.0%) |
| High School Diploma | 24 (100.0%) | 0 (0.0%) |
| College/Associate Degree | 49 (90.7%) | 5 (9.3%) |
| Bachelor's Degree or higher | 12 (92.3%) | 1 (7.7%) |
Occupancy by Age of Householder in Panama
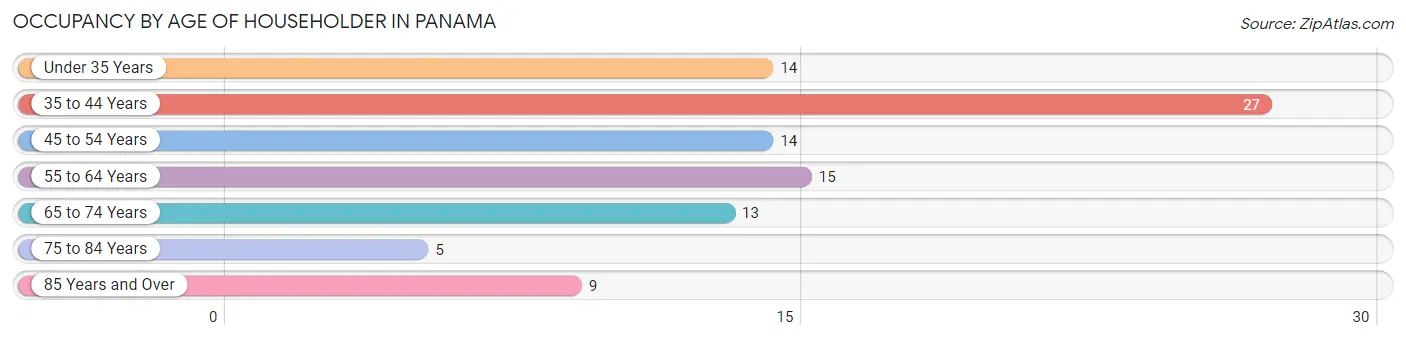
| Age Bracket | # Households | % Households |
| Under 35 Years | 14 | 14.4% |
| 35 to 44 Years | 27 | 27.8% |
| 45 to 54 Years | 14 | 14.4% |
| 55 to 64 Years | 15 | 15.5% |
| 65 to 74 Years | 13 | 13.4% |
| 75 to 84 Years | 5 | 5.1% |
| 85 Years and Over | 9 | 9.3% |
| Total | 97 | 100.0% |
Housing Finances in Panama
Median Income by Occupancy in Panama
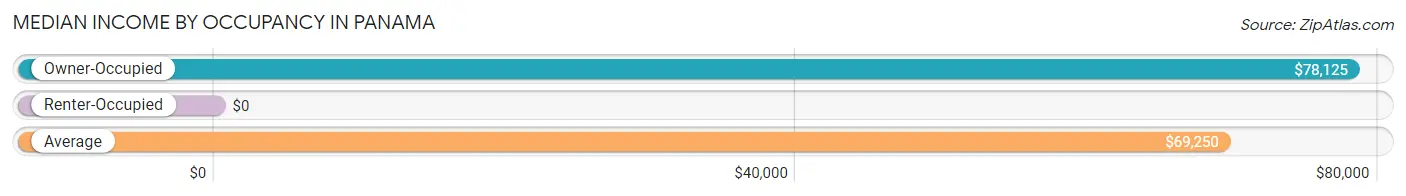
| Occupancy Type | # Households | Median Income |
| Owner-Occupied | 91 (93.8%) | $78,125 |
| Renter-Occupied | 6 (6.2%) | $0 |
| Average | 97 (100.0%) | $69,250 |
Occupancy by Householder Income Bracket in Panama
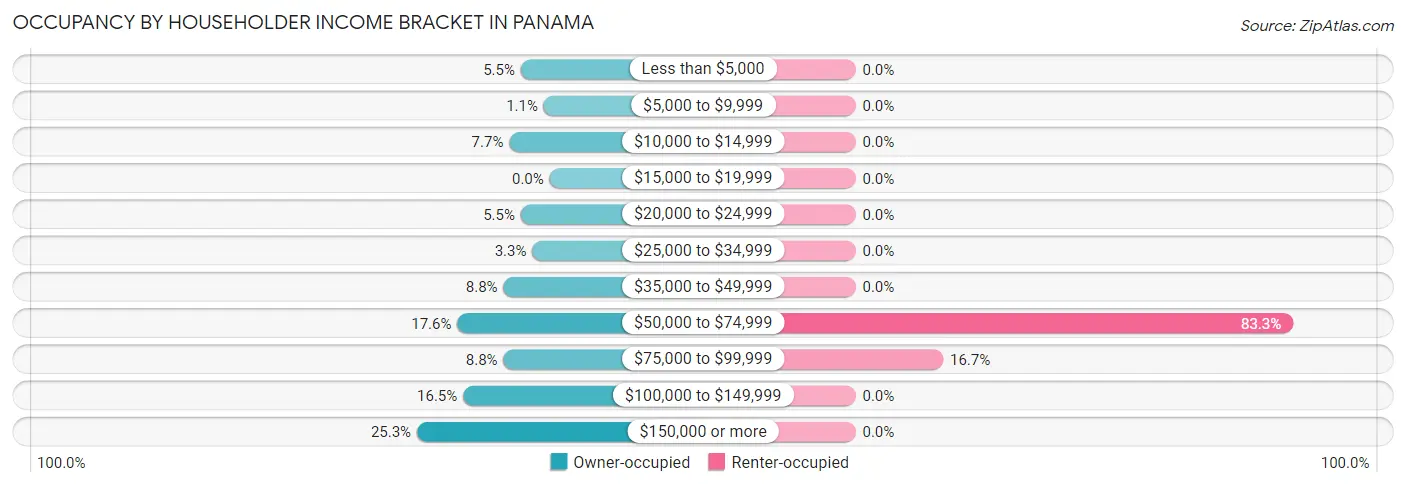
| Income Bracket | Owner-occupied | Renter-occupied |
| Less than $5,000 | 5 (5.5%) | 0 (0.0%) |
| $5,000 to $9,999 | 1 (1.1%) | 0 (0.0%) |
| $10,000 to $14,999 | 7 (7.7%) | 0 (0.0%) |
| $15,000 to $19,999 | 0 (0.0%) | 0 (0.0%) |
| $20,000 to $24,999 | 5 (5.5%) | 0 (0.0%) |
| $25,000 to $34,999 | 3 (3.3%) | 0 (0.0%) |
| $35,000 to $49,999 | 8 (8.8%) | 0 (0.0%) |
| $50,000 to $74,999 | 16 (17.6%) | 5 (83.3%) |
| $75,000 to $99,999 | 8 (8.8%) | 1 (16.7%) |
| $100,000 to $149,999 | 15 (16.5%) | 0 (0.0%) |
| $150,000 or more | 23 (25.3%) | 0 (0.0%) |
| Total | 91 (100.0%) | 6 (100.0%) |
Monthly Housing Cost Tiers in Panama
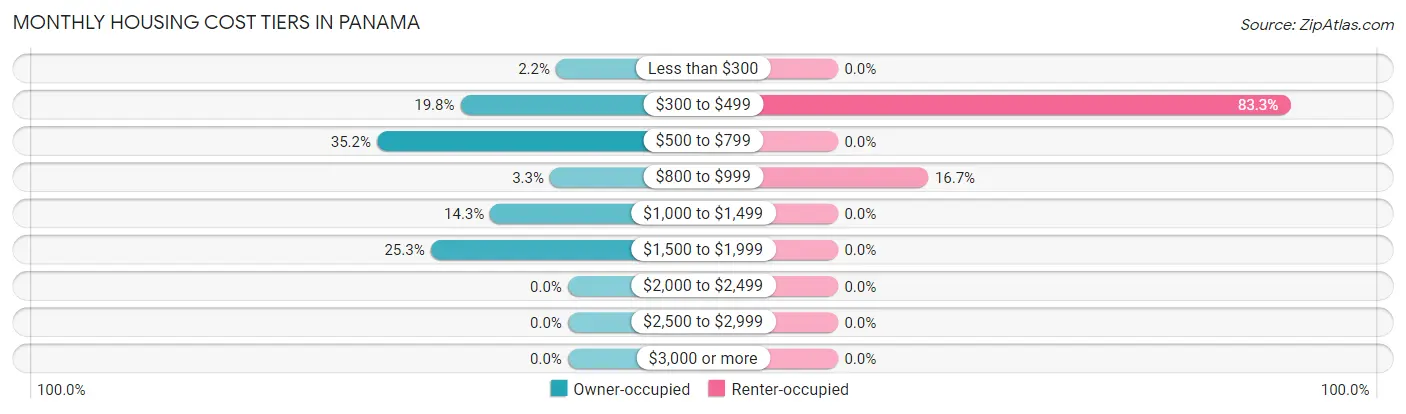
| Monthly Cost | Owner-occupied | Renter-occupied |
| Less than $300 | 2 (2.2%) | 0 (0.0%) |
| $300 to $499 | 18 (19.8%) | 5 (83.3%) |
| $500 to $799 | 32 (35.2%) | 0 (0.0%) |
| $800 to $999 | 3 (3.3%) | 1 (16.7%) |
| $1,000 to $1,499 | 13 (14.3%) | 0 (0.0%) |
| $1,500 to $1,999 | 23 (25.3%) | 0 (0.0%) |
| $2,000 to $2,499 | 0 (0.0%) | 0 (0.0%) |
| $2,500 to $2,999 | 0 (0.0%) | 0 (0.0%) |
| $3,000 or more | 0 (0.0%) | 0 (0.0%) |
| Total | 91 (100.0%) | 6 (100.0%) |
Physical Housing Characteristics in Panama
Housing Structures in Panama
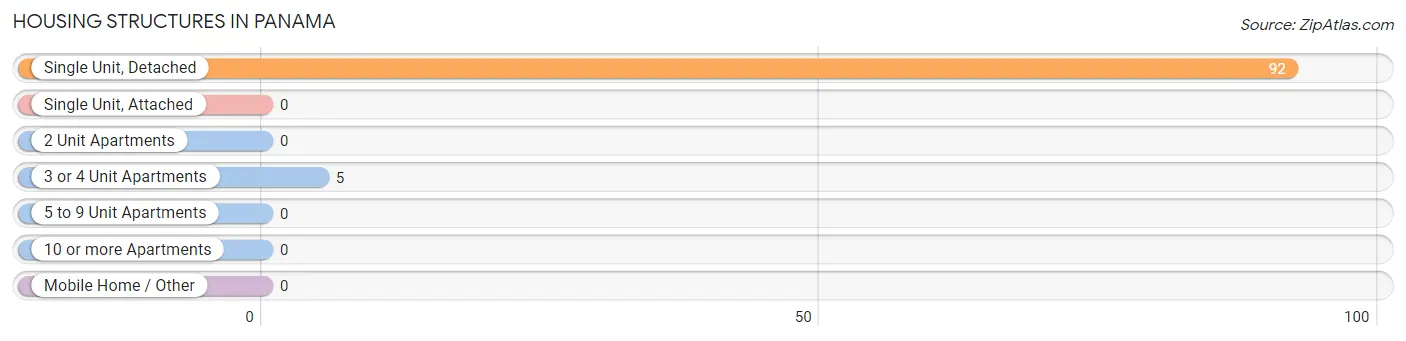
| Structure Type | # Housing Units | % Housing Units |
| Single Unit, Detached | 92 | 94.9% |
| Single Unit, Attached | 0 | 0.0% |
| 2 Unit Apartments | 0 | 0.0% |
| 3 or 4 Unit Apartments | 5 | 5.1% |
| 5 to 9 Unit Apartments | 0 | 0.0% |
| 10 or more Apartments | 0 | 0.0% |
| Mobile Home / Other | 0 | 0.0% |
| Total | 97 | 100.0% |
Housing Structures by Occupancy in Panama
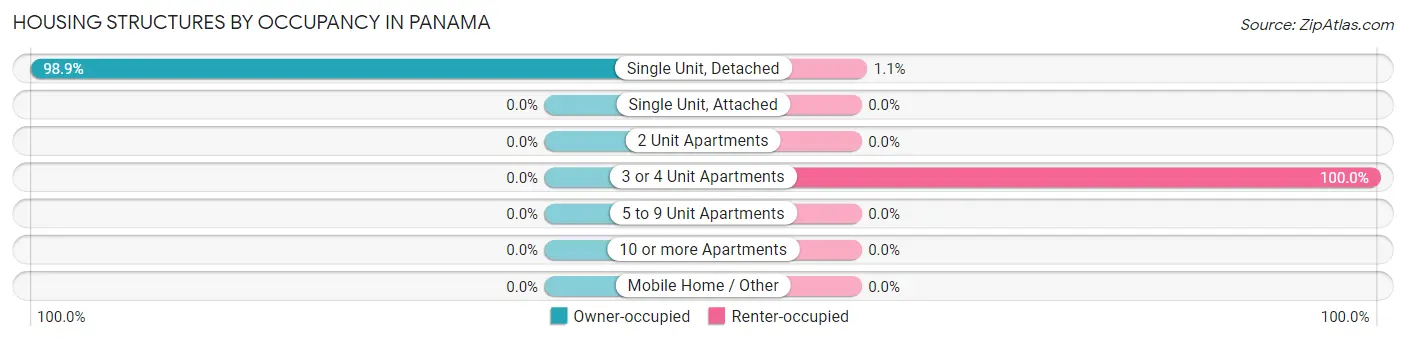
| Structure Type | Owner-occupied | Renter-occupied |
| Single Unit, Detached | 91 (98.9%) | 1 (1.1%) |
| Single Unit, Attached | 0 (0.0%) | 0 (0.0%) |
| 2 Unit Apartments | 0 (0.0%) | 0 (0.0%) |
| 3 or 4 Unit Apartments | 0 (0.0%) | 5 (100.0%) |
| 5 to 9 Unit Apartments | 0 (0.0%) | 0 (0.0%) |
| 10 or more Apartments | 0 (0.0%) | 0 (0.0%) |
| Mobile Home / Other | 0 (0.0%) | 0 (0.0%) |
| Total | 91 (93.8%) | 6 (6.2%) |
Housing Structures by Number of Rooms in Panama
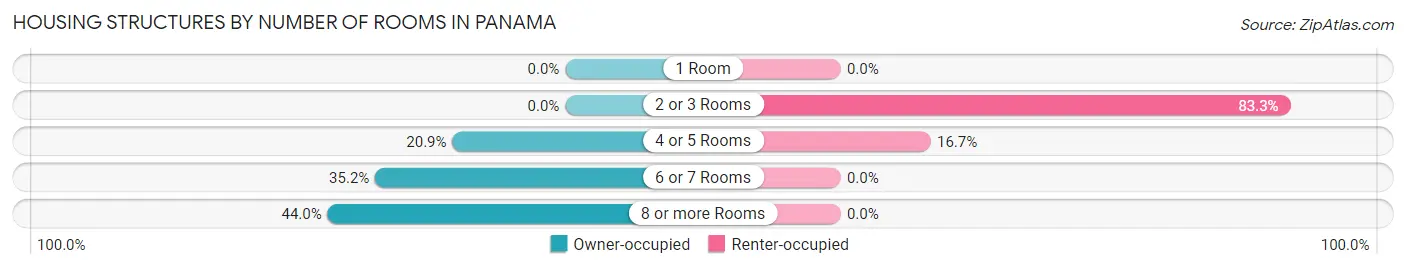
| Number of Rooms | Owner-occupied | Renter-occupied |
| 1 Room | 0 (0.0%) | 0 (0.0%) |
| 2 or 3 Rooms | 0 (0.0%) | 5 (83.3%) |
| 4 or 5 Rooms | 19 (20.9%) | 1 (16.7%) |
| 6 or 7 Rooms | 32 (35.2%) | 0 (0.0%) |
| 8 or more Rooms | 40 (44.0%) | 0 (0.0%) |
| Total | 91 (100.0%) | 6 (100.0%) |
Housing Structure by Heating Type in Panama
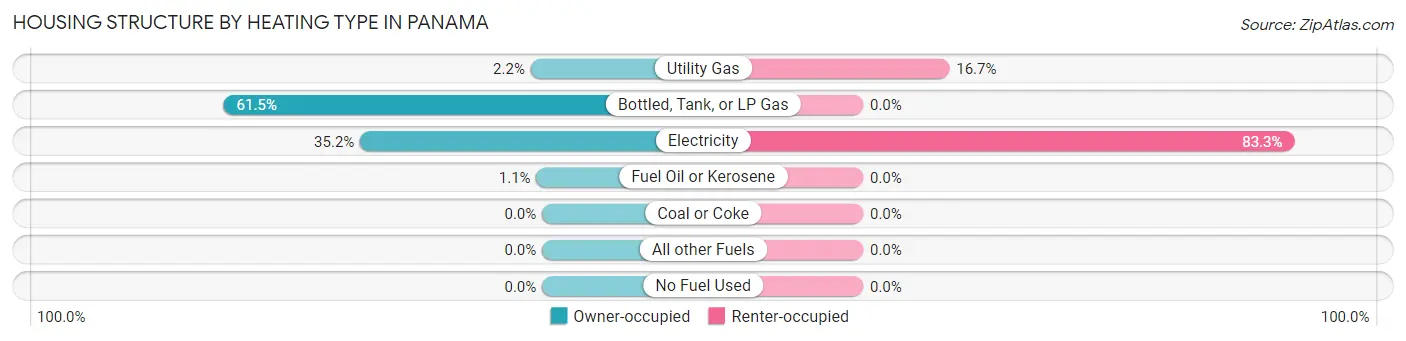
| Heating Type | Owner-occupied | Renter-occupied |
| Utility Gas | 2 (2.2%) | 1 (16.7%) |
| Bottled, Tank, or LP Gas | 56 (61.5%) | 0 (0.0%) |
| Electricity | 32 (35.2%) | 5 (83.3%) |
| Fuel Oil or Kerosene | 1 (1.1%) | 0 (0.0%) |
| Coal or Coke | 0 (0.0%) | 0 (0.0%) |
| All other Fuels | 0 (0.0%) | 0 (0.0%) |
| No Fuel Used | 0 (0.0%) | 0 (0.0%) |
| Total | 91 (100.0%) | 6 (100.0%) |
Household Vehicle Usage in Panama
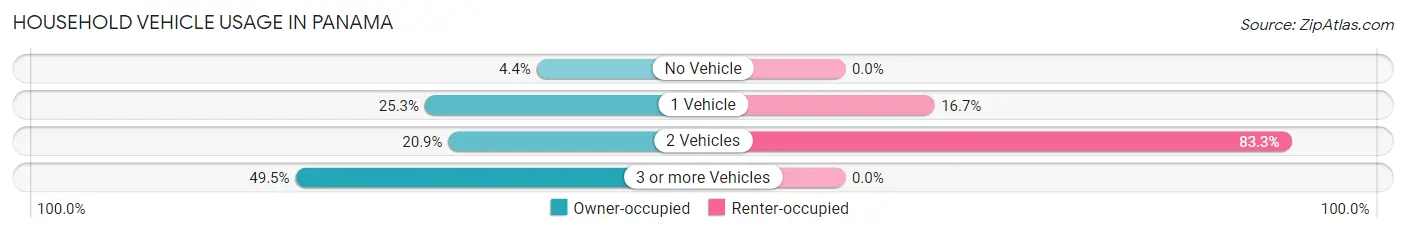
| Vehicles per Household | Owner-occupied | Renter-occupied |
| No Vehicle | 4 (4.4%) | 0 (0.0%) |
| 1 Vehicle | 23 (25.3%) | 1 (16.7%) |
| 2 Vehicles | 19 (20.9%) | 5 (83.3%) |
| 3 or more Vehicles | 45 (49.4%) | 0 (0.0%) |
| Total | 91 (100.0%) | 6 (100.0%) |
Real Estate & Mortgages in Panama
Real Estate and Mortgage Overview in Panama
| Characteristic | Without Mortgage | With Mortgage |
| Housing Units | 46 | 45 |
| Median Property Value | $90,000 | $147,900 |
| Median Household Income | $62,500 | $19 |
| Monthly Housing Costs | $525 | $0 |
| Real Estate Taxes | $1,316 | $0 |
Property Value by Mortgage Status in Panama
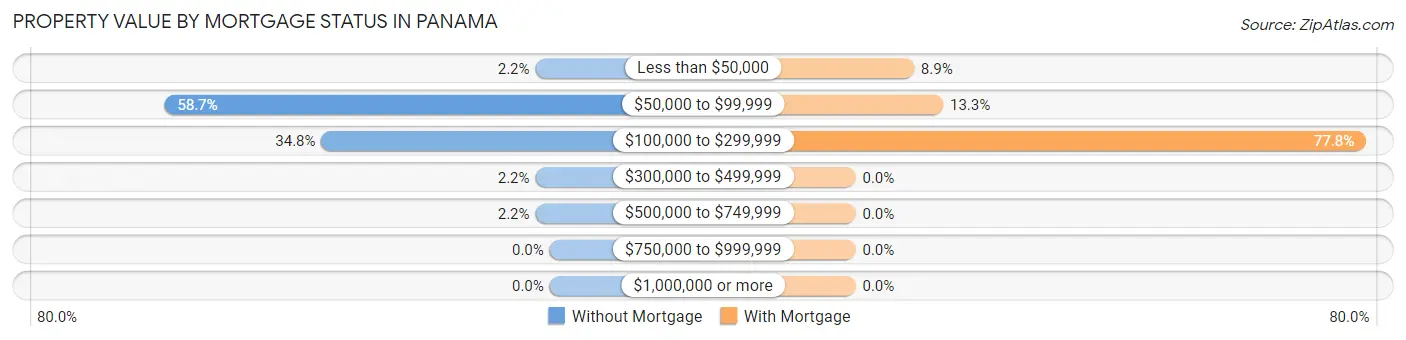
| Property Value | Without Mortgage | With Mortgage |
| Less than $50,000 | 1 (2.2%) | 4 (8.9%) |
| $50,000 to $99,999 | 27 (58.7%) | 6 (13.3%) |
| $100,000 to $299,999 | 16 (34.8%) | 35 (77.8%) |
| $300,000 to $499,999 | 1 (2.2%) | 0 (0.0%) |
| $500,000 to $749,999 | 1 (2.2%) | 0 (0.0%) |
| $750,000 to $999,999 | 0 (0.0%) | 0 (0.0%) |
| $1,000,000 or more | 0 (0.0%) | 0 (0.0%) |
| Total | 46 (100.0%) | 45 (100.0%) |
Household Income by Mortgage Status in Panama
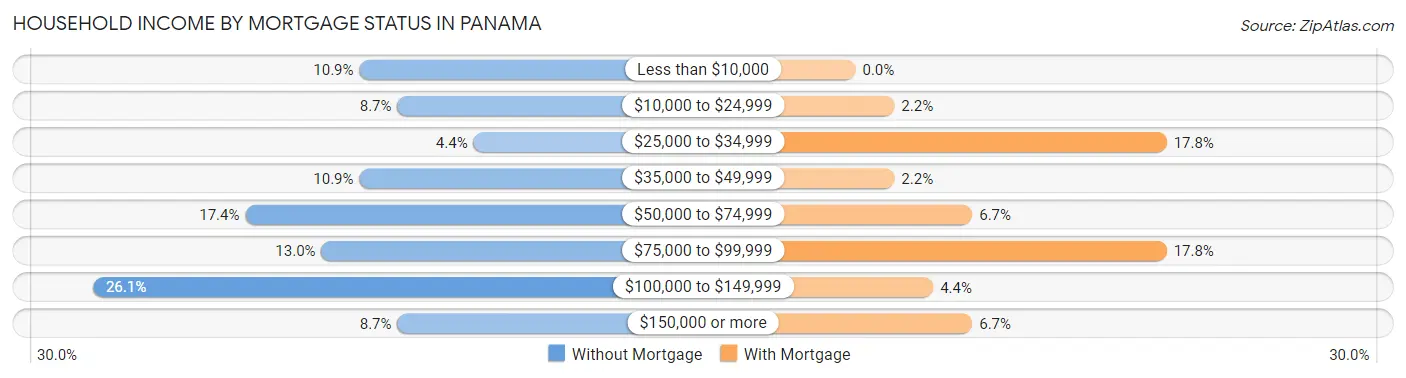
| Household Income | Without Mortgage | With Mortgage |
| Less than $10,000 | 5 (10.9%) | 0 (0.0%) |
| $10,000 to $24,999 | 4 (8.7%) | 1 (2.2%) |
| $25,000 to $34,999 | 2 (4.3%) | 8 (17.8%) |
| $35,000 to $49,999 | 5 (10.9%) | 1 (2.2%) |
| $50,000 to $74,999 | 8 (17.4%) | 3 (6.7%) |
| $75,000 to $99,999 | 6 (13.0%) | 8 (17.8%) |
| $100,000 to $149,999 | 12 (26.1%) | 2 (4.4%) |
| $150,000 or more | 4 (8.7%) | 3 (6.7%) |
| Total | 46 (100.0%) | 45 (100.0%) |
Property Value to Household Income Ratio in Panama
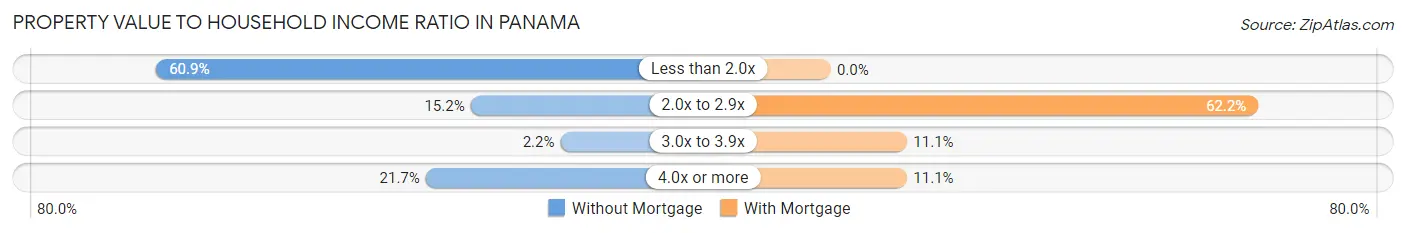
| Value-to-Income Ratio | Without Mortgage | With Mortgage |
| Less than 2.0x | 28 (60.9%) | 0 (0.0%) |
| 2.0x to 2.9x | 7 (15.2%) | 28 (62.2%) |
| 3.0x to 3.9x | 1 (2.2%) | 5 (11.1%) |
| 4.0x or more | 10 (21.7%) | 5 (11.1%) |
| Total | 46 (100.0%) | 45 (100.0%) |
Real Estate Taxes by Mortgage Status in Panama
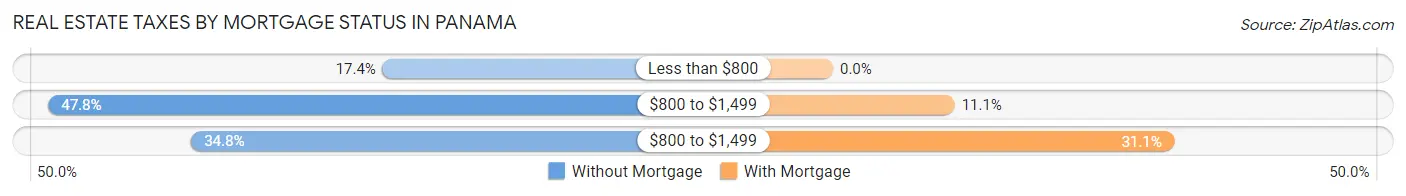
| Property Taxes | Without Mortgage | With Mortgage |
| Less than $800 | 8 (17.4%) | 0 (0.0%) |
| $800 to $1,499 | 22 (47.8%) | 5 (11.1%) |
| $800 to $1,499 | 16 (34.8%) | 14 (31.1%) |
| Total | 46 (100.0%) | 45 (100.0%) |
Health & Disability in Panama
Health Insurance Coverage by Age in Panama
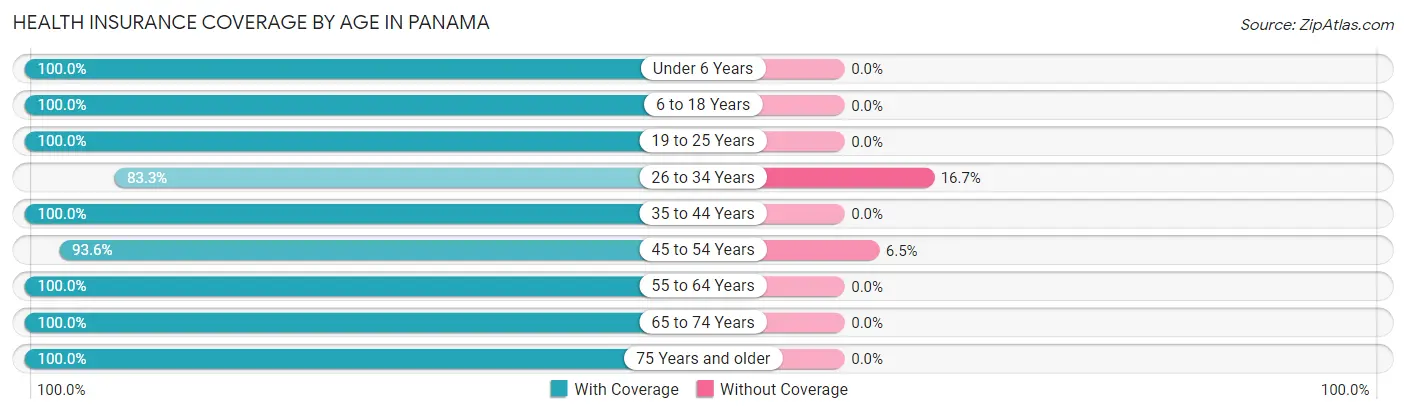
| Age Bracket | With Coverage | Without Coverage |
| Under 6 Years | 4 (100.0%) | 0 (0.0%) |
| 6 to 18 Years | 75 (100.0%) | 0 (0.0%) |
| 19 to 25 Years | 17 (100.0%) | 0 (0.0%) |
| 26 to 34 Years | 10 (83.3%) | 2 (16.7%) |
| 35 to 44 Years | 43 (100.0%) | 0 (0.0%) |
| 45 to 54 Years | 29 (93.5%) | 2 (6.5%) |
| 55 to 64 Years | 24 (100.0%) | 0 (0.0%) |
| 65 to 74 Years | 20 (100.0%) | 0 (0.0%) |
| 75 Years and older | 21 (100.0%) | 0 (0.0%) |
| Total | 243 (98.4%) | 4 (1.6%) |
Health Insurance Coverage by Citizenship Status in Panama
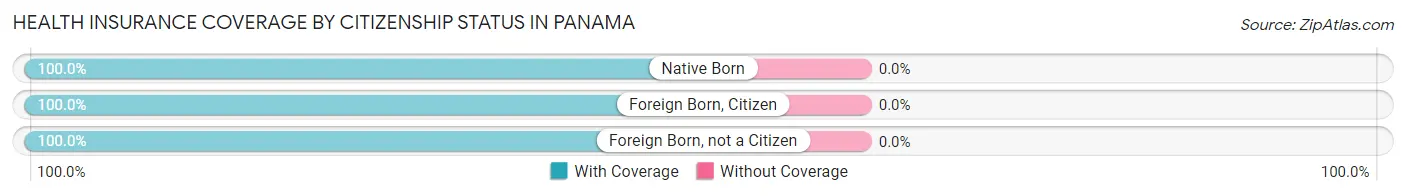
| Citizenship Status | With Coverage | Without Coverage |
| Native Born | 4 (100.0%) | 0 (0.0%) |
| Foreign Born, Citizen | 75 (100.0%) | 0 (0.0%) |
| Foreign Born, not a Citizen | 17 (100.0%) | 0 (0.0%) |
Health Insurance Coverage by Household Income in Panama
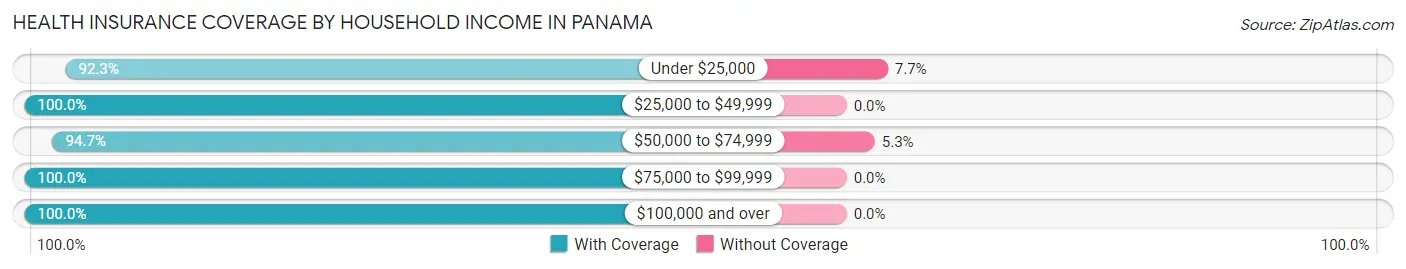
| Household Income | With Coverage | Without Coverage |
| Under $25,000 | 24 (92.3%) | 2 (7.7%) |
| $25,000 to $49,999 | 14 (100.0%) | 0 (0.0%) |
| $50,000 to $74,999 | 36 (94.7%) | 2 (5.3%) |
| $75,000 to $99,999 | 22 (100.0%) | 0 (0.0%) |
| $100,000 and over | 147 (100.0%) | 0 (0.0%) |
Public vs Private Health Insurance Coverage by Age in Panama
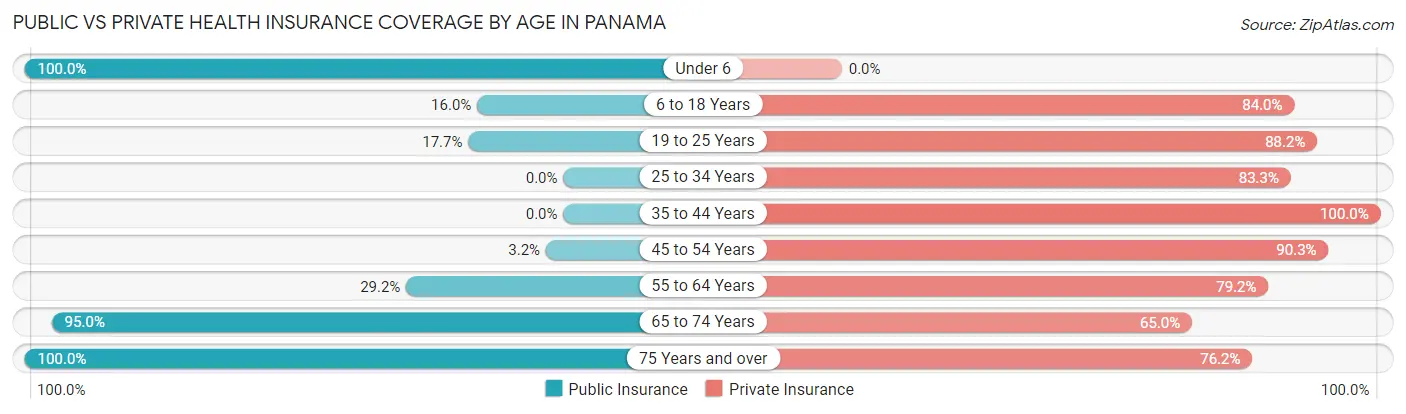
| Age Bracket | Public Insurance | Private Insurance |
| Under 6 | 4 (100.0%) | 0 (0.0%) |
| 6 to 18 Years | 12 (16.0%) | 63 (84.0%) |
| 19 to 25 Years | 3 (17.6%) | 15 (88.2%) |
| 25 to 34 Years | 0 (0.0%) | 10 (83.3%) |
| 35 to 44 Years | 0 (0.0%) | 43 (100.0%) |
| 45 to 54 Years | 1 (3.2%) | 28 (90.3%) |
| 55 to 64 Years | 7 (29.2%) | 19 (79.2%) |
| 65 to 74 Years | 19 (95.0%) | 13 (65.0%) |
| 75 Years and over | 21 (100.0%) | 16 (76.2%) |
| Total | 67 (27.1%) | 207 (83.8%) |
Disability Status by Sex by Age in Panama
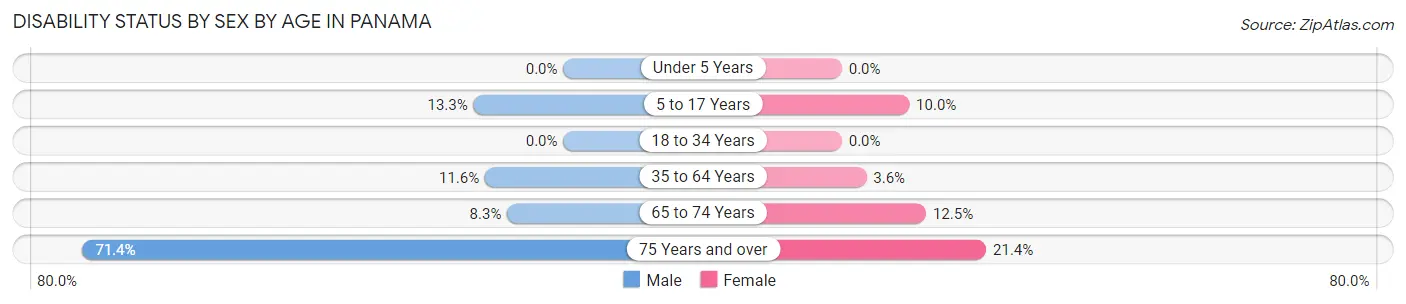
| Age Bracket | Male | Female |
| Under 5 Years | 0 (0.0%) | 0 (0.0%) |
| 5 to 17 Years | 2 (13.3%) | 6 (10.0%) |
| 18 to 34 Years | 0 (0.0%) | 0 (0.0%) |
| 35 to 64 Years | 5 (11.6%) | 2 (3.6%) |
| 65 to 74 Years | 1 (8.3%) | 1 (12.5%) |
| 75 Years and over | 5 (71.4%) | 3 (21.4%) |
Disability Class by Sex by Age in Panama
Disability Class: Hearing Difficulty
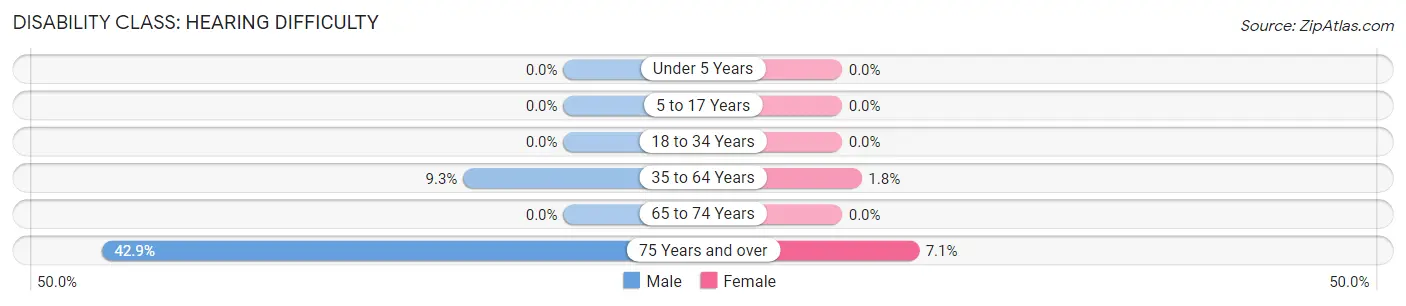
| Age Bracket | Male | Female |
| Under 5 Years | 0 (0.0%) | 0 (0.0%) |
| 5 to 17 Years | 0 (0.0%) | 0 (0.0%) |
| 18 to 34 Years | 0 (0.0%) | 0 (0.0%) |
| 35 to 64 Years | 4 (9.3%) | 1 (1.8%) |
| 65 to 74 Years | 0 (0.0%) | 0 (0.0%) |
| 75 Years and over | 3 (42.9%) | 1 (7.1%) |
Disability Class: Vision Difficulty
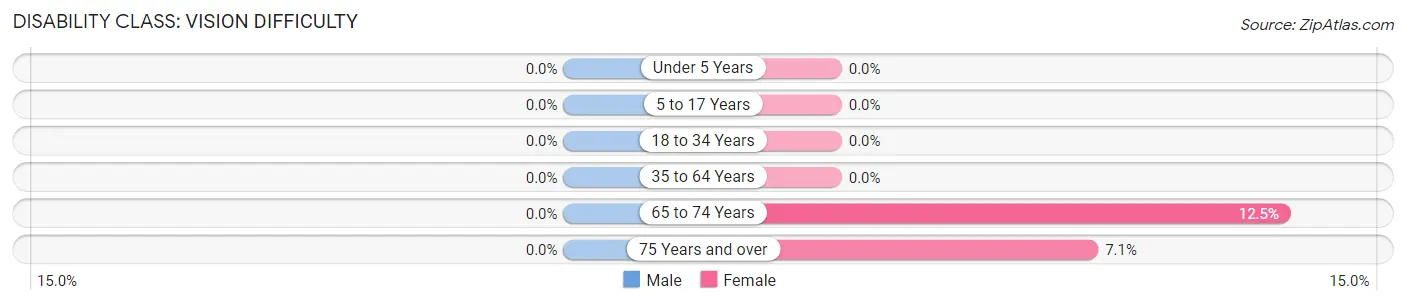
| Age Bracket | Male | Female |
| Under 5 Years | 0 (0.0%) | 0 (0.0%) |
| 5 to 17 Years | 0 (0.0%) | 0 (0.0%) |
| 18 to 34 Years | 0 (0.0%) | 0 (0.0%) |
| 35 to 64 Years | 0 (0.0%) | 0 (0.0%) |
| 65 to 74 Years | 0 (0.0%) | 1 (12.5%) |
| 75 Years and over | 0 (0.0%) | 1 (7.1%) |
Disability Class: Cognitive Difficulty
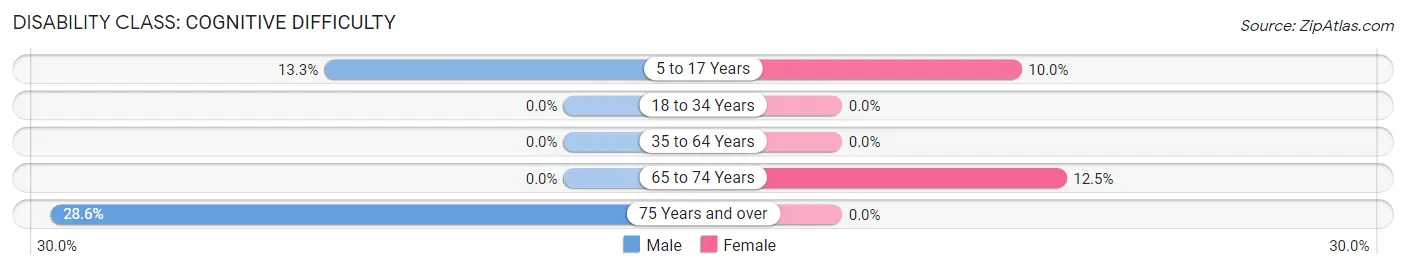
| Age Bracket | Male | Female |
| 5 to 17 Years | 2 (13.3%) | 6 (10.0%) |
| 18 to 34 Years | 0 (0.0%) | 0 (0.0%) |
| 35 to 64 Years | 0 (0.0%) | 0 (0.0%) |
| 65 to 74 Years | 0 (0.0%) | 1 (12.5%) |
| 75 Years and over | 2 (28.6%) | 0 (0.0%) |
Disability Class: Ambulatory Difficulty
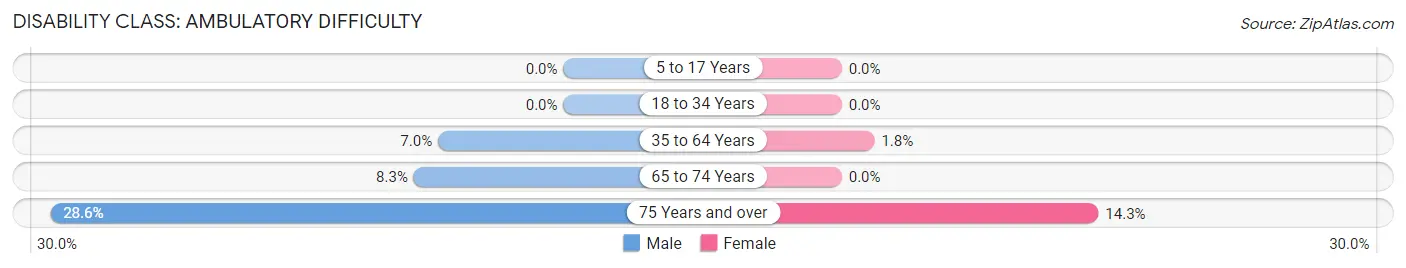
| Age Bracket | Male | Female |
| 5 to 17 Years | 0 (0.0%) | 0 (0.0%) |
| 18 to 34 Years | 0 (0.0%) | 0 (0.0%) |
| 35 to 64 Years | 3 (7.0%) | 1 (1.8%) |
| 65 to 74 Years | 1 (8.3%) | 0 (0.0%) |
| 75 Years and over | 2 (28.6%) | 2 (14.3%) |
Disability Class: Self-Care Difficulty
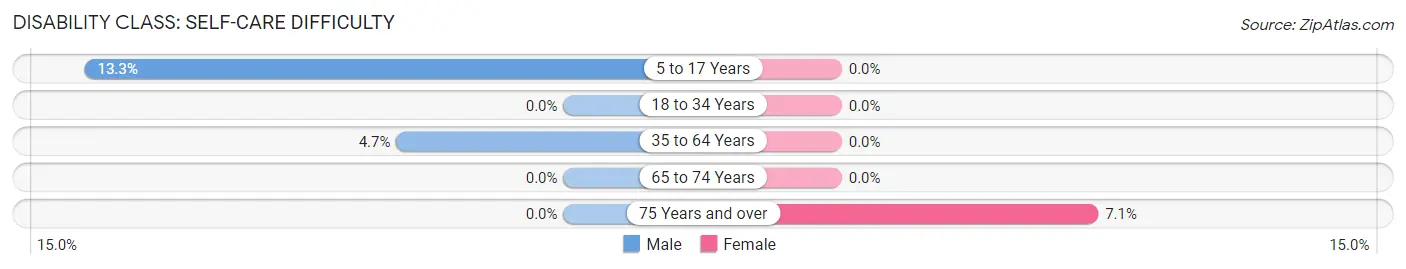
| Age Bracket | Male | Female |
| 5 to 17 Years | 2 (13.3%) | 0 (0.0%) |
| 18 to 34 Years | 0 (0.0%) | 0 (0.0%) |
| 35 to 64 Years | 2 (4.6%) | 0 (0.0%) |
| 65 to 74 Years | 0 (0.0%) | 0 (0.0%) |
| 75 Years and over | 0 (0.0%) | 1 (7.1%) |
Technology Access in Panama
Computing Device Access in Panama
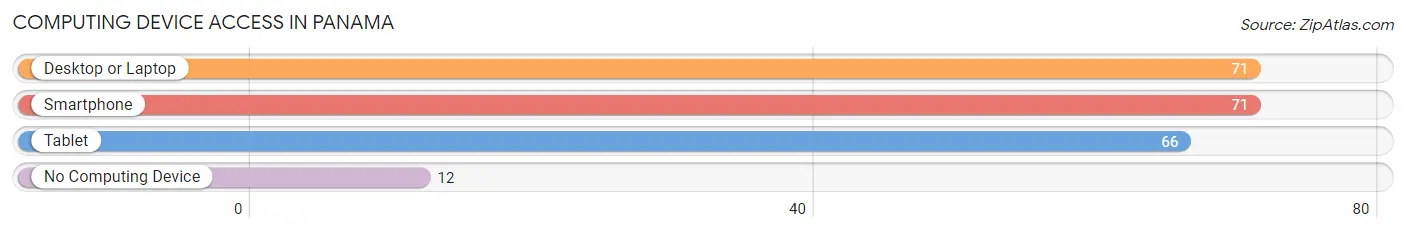
| Device Type | # Households | % Households |
| Desktop or Laptop | 71 | 73.2% |
| Smartphone | 71 | 73.2% |
| Tablet | 66 | 68.0% |
| No Computing Device | 12 | 12.4% |
| Total | 97 | 100.0% |
Internet Access in Panama
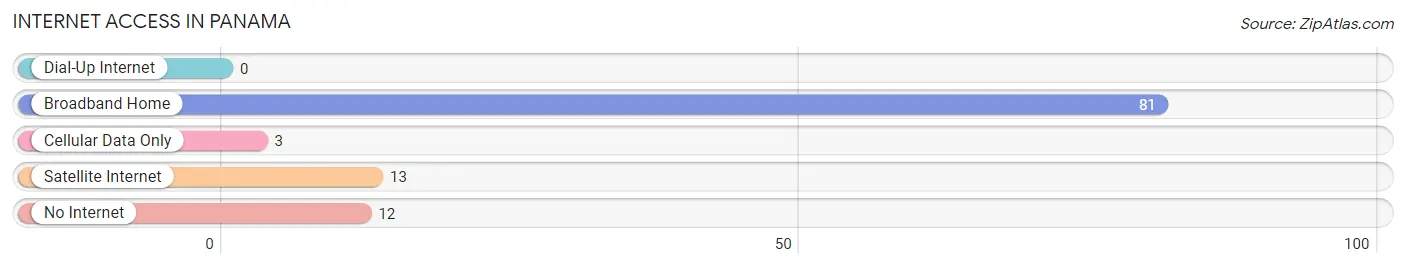
| Internet Type | # Households | % Households |
| Dial-Up Internet | 0 | 0.0% |
| Broadband Home | 81 | 83.5% |
| Cellular Data Only | 3 | 3.1% |
| Satellite Internet | 13 | 13.4% |
| No Internet | 12 | 12.4% |
| Total | 97 | 100.0% |
Panama Summary
Panama, Iowa is a small town located in the southeastern corner of Calhoun County, Iowa. It is situated on the banks of the Mississippi River, just south of the Iowa-Illinois border. The town was founded in 1854 and has a population of just over 500 people.
Geography
Panama is located in the southeastern corner of Calhoun County, Iowa, on the banks of the Mississippi River. It is situated just south of the Iowa-Illinois border. The town is located in the Central Lowland region of the United States, and is part of the Driftless Area, which is characterized by its rolling hills and valleys. The town is surrounded by agricultural land, with corn and soybeans being the primary crops. The town is also home to a variety of wildlife, including deer, wild turkeys, and a variety of birds.
History
Panama was founded in 1854 by a group of settlers from Ohio. The town was named after the Panama Canal, which was being built at the time. The town was originally a farming community, with the primary crops being corn and soybeans. In the late 19th century, the town began to grow and develop, with the construction of a railroad line and the establishment of a post office. The town also became a popular destination for tourists, who came to enjoy the scenic views of the Mississippi River.
In the early 20th century, the town experienced a period of growth and prosperity. The population increased, and the town was home to a variety of businesses, including a hotel, a bank, a general store, and a movie theater. The town also had a variety of churches, including a Methodist church, a Catholic church, and a Lutheran church.
Economy
The economy of Panama is largely based on agriculture. Corn and soybeans are the primary crops, and the town is home to a variety of agricultural businesses, including grain elevators, feed mills, and fertilizer plants. The town is also home to a variety of small businesses, including restaurants, retail stores, and service providers.
Demographics
As of the 2010 census, the population of Panama was 514. The racial makeup of the town was 97.3% White, 0.6% African American, 0.2% Native American, 0.2% Asian, 0.4% from other races, and 1.3% from two or more races. The median household income was $41,250, and the median family income was $48,750. The per capita income was $19,945.
Conclusion
Panama, Iowa is a small town located in the southeastern corner of Calhoun County, Iowa. It is situated on the banks of the Mississippi River, just south of the Iowa-Illinois border. The town was founded in 1854 and has a population of just over 500 people. The economy of Panama is largely based on agriculture, with corn and soybeans being the primary crops. The town is also home to a variety of small businesses, including restaurants, retail stores, and service providers. The racial makeup of the town is 97.3% White, 0.6% African American, 0.2% Native American, 0.2% Asian, 0.4% from other races, and 1.3% from two or more races. The median household income was $41,250, and the median family income was $48,750. The per capita income was $19,945. Panama is a small town with a rich history and a bright future.
Common Questions
What is Per Capita Income in Panama?
Per Capita income in Panama is $36,077.
What is the Median Family Income in Panama?
Median Family Income in Panama is $122,000.
What is the Median Household income in Panama?
Median Household Income in Panama is $69,250.
What is Income or Wage Gap in Panama?
Income or Wage Gap in Panama is 22.7%.
Women in Panama earn 77.3 cents for every dollar earned by a man.
What is Inequality or Gini Index in Panama?
Inequality or Gini Index in Panama is 0.42.
What is the Total Population of Panama?
Total Population of Panama is 247.
What is the Total Male Population of Panama?
Total Male Population of Panama is 90.
What is the Total Female Population of Panama?
Total Female Population of Panama is 157.
What is the Ratio of Males per 100 Females in Panama?
There are 57.32 Males per 100 Females in Panama.
What is the Ratio of Females per 100 Males in Panama?
There are 174.44 Females per 100 Males in Panama.
What is the Median Population Age in Panama?
Median Population Age in Panama is 38.2 Years.
What is the Average Family Size in Panama
Average Family Size in Panama is 3.3 People.
What is the Average Household Size in Panama
Average Household Size in Panama is 2.5 People.
How Large is the Labor Force in Panama?
There are 135 People in the Labor Forcein in Panama.
What is the Percentage of People in the Labor Force in Panama?
65.2% of People are in the Labor Force in Panama.