Breda, IA Map & Demographics
Breda Map
Breda Overview
$41,241
PER CAPITA INCOME
$86,875
AVG FAMILY INCOME
$57,426
AVG HOUSEHOLD INCOME
33.8%
WAGE / INCOME GAP [ % ]
66.2¢/ $1
WAGE / INCOME GAP [ $ ]
0.41
INEQUALITY / GINI INDEX
439
TOTAL POPULATION
241
MALE POPULATION
198
FEMALE POPULATION
121.72
MALES / 100 FEMALES
82.16
FEMALES / 100 MALES
34.3
MEDIAN AGE
2.6
AVG FAMILY SIZE
2.1
AVG HOUSEHOLD SIZE
290
LABOR FORCE [ PEOPLE ]
80.8%
PERCENT IN LABOR FORCE
2.8%
UNEMPLOYMENT RATE
Breda Zip Codes
Breda Area Codes
Income in Breda
Income Overview in Breda
Per Capita Income in Breda is $41,241, while median incomes of families and households are $86,875 and $57,426 respectively.
| Characteristic | Number | Measure |
| Per Capita Income | 439 | $41,241 |
| Median Family Income | 134 | $86,875 |
| Mean Family Income | 134 | $105,330 |
| Median Household Income | 206 | $57,426 |
| Mean Household Income | 206 | $86,772 |
| Income Deficit | 134 | $0 |
| Wage / Income Gap (%) | 439 | 33.82% |
| Wage / Income Gap ($) | 439 | 66.18¢ per $1 |
| Gini / Inequality Index | 439 | 0.41 |
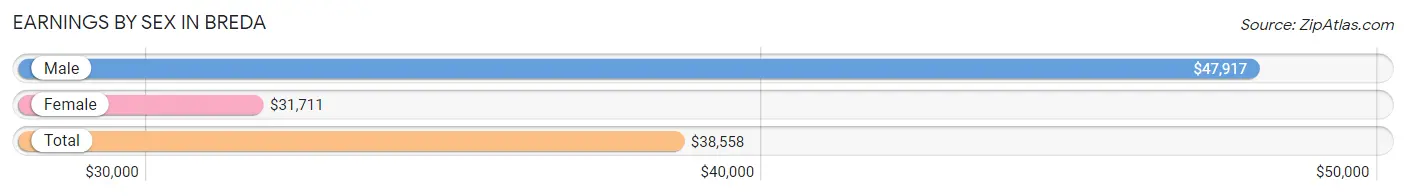
Earnings by Sex in Breda
Average Earnings in Breda are $38,558, $47,917 for men and $31,711 for women, a difference of 33.8%.
| Sex | Number | Average Earnings |
| Male | 165 (55.9%) | $47,917 |
| Female | 130 (44.1%) | $31,711 |
| Total | 295 (100.0%) | $38,558 |
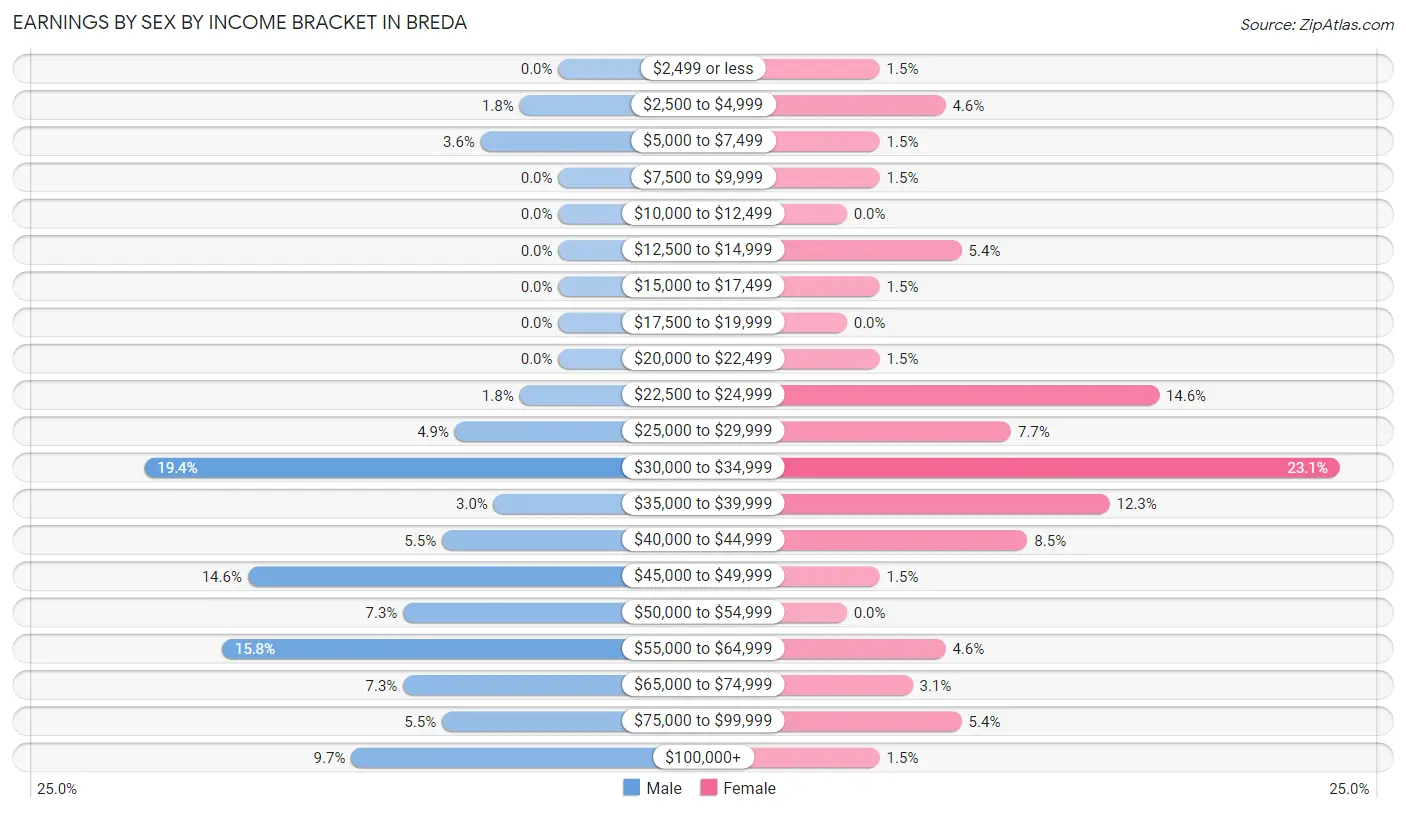
Earnings by Sex by Income Bracket in Breda
The most common earnings brackets in Breda are $30,000 to $34,999 for men (32 | 19.4%) and $30,000 to $34,999 for women (30 | 23.1%).
| Income | Male | Female |
| $2,499 or less | 0 (0.0%) | 2 (1.5%) |
| $2,500 to $4,999 | 3 (1.8%) | 6 (4.6%) |
| $5,000 to $7,499 | 6 (3.6%) | 2 (1.5%) |
| $7,500 to $9,999 | 0 (0.0%) | 2 (1.5%) |
| $10,000 to $12,499 | 0 (0.0%) | 0 (0.0%) |
| $12,500 to $14,999 | 0 (0.0%) | 7 (5.4%) |
| $15,000 to $17,499 | 0 (0.0%) | 2 (1.5%) |
| $17,500 to $19,999 | 0 (0.0%) | 0 (0.0%) |
| $20,000 to $22,499 | 0 (0.0%) | 2 (1.5%) |
| $22,500 to $24,999 | 3 (1.8%) | 19 (14.6%) |
| $25,000 to $29,999 | 8 (4.9%) | 10 (7.7%) |
| $30,000 to $34,999 | 32 (19.4%) | 30 (23.1%) |
| $35,000 to $39,999 | 5 (3.0%) | 16 (12.3%) |
| $40,000 to $44,999 | 9 (5.4%) | 11 (8.5%) |
| $45,000 to $49,999 | 24 (14.5%) | 2 (1.5%) |
| $50,000 to $54,999 | 12 (7.3%) | 0 (0.0%) |
| $55,000 to $64,999 | 26 (15.8%) | 6 (4.6%) |
| $65,000 to $74,999 | 12 (7.3%) | 4 (3.1%) |
| $75,000 to $99,999 | 9 (5.4%) | 7 (5.4%) |
| $100,000+ | 16 (9.7%) | 2 (1.5%) |
| Total | 165 (100.0%) | 130 (100.0%) |
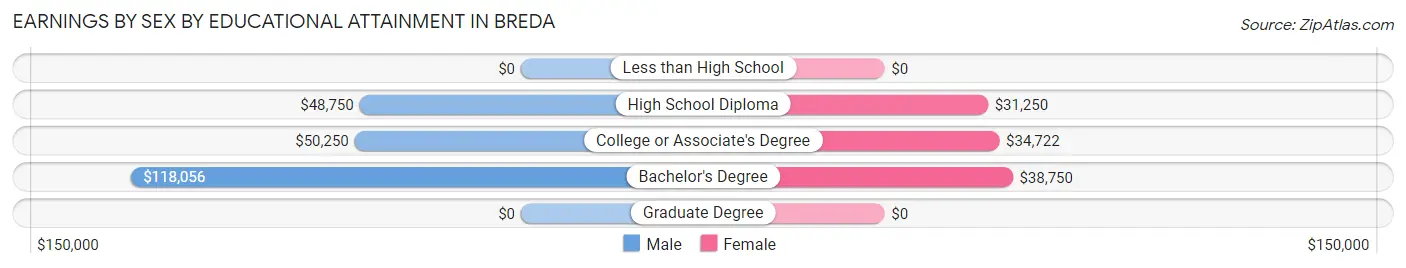
Earnings by Sex by Educational Attainment in Breda
Average earnings in Breda are $51,786 for men and $34,659 for women, a difference of 33.1%. Men with an educational attainment of bachelor's degree enjoy the highest average annual earnings of $118,056, while those with high school diploma education earn the least with $48,750. Women with an educational attainment of bachelor's degree earn the most with the average annual earnings of $38,750, while those with high school diploma education have the smallest earnings of $31,250.
| Educational Attainment | Male Income | Female Income |
| Less than High School | - | - |
| High School Diploma | $48,750 | $31,250 |
| College or Associate's Degree | $50,250 | $34,722 |
| Bachelor's Degree | $118,056 | $38,750 |
| Graduate Degree | - | - |
| Total | $51,786 | $34,659 |
Family Income in Breda
Family Income Brackets in Breda
According to the Breda family income data, there are 43 families falling into the $75,000 to $99,999 income range, which is the most common income bracket and makes up 32.1% of all families.
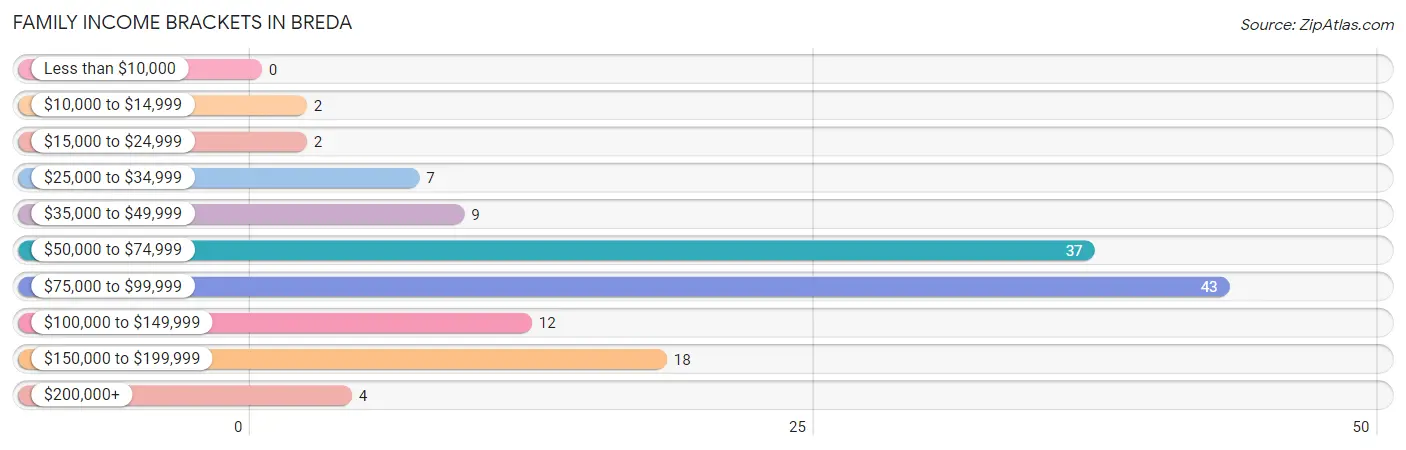
| Income Bracket | # Families | % Families |
| Less than $10,000 | 0 | 0.0% |
| $10,000 to $14,999 | 2 | 1.5% |
| $15,000 to $24,999 | 2 | 1.5% |
| $25,000 to $34,999 | 7 | 5.2% |
| $35,000 to $49,999 | 9 | 6.7% |
| $50,000 to $74,999 | 37 | 27.6% |
| $75,000 to $99,999 | 43 | 32.1% |
| $100,000 to $149,999 | 12 | 9.0% |
| $150,000 to $199,999 | 18 | 13.4% |
| $200,000+ | 4 | 3.0% |
Family Income by Famaliy Size in Breda
4-person families (19 | 14.2%) account for the highest median family income in Breda with $106,875 per family, while 3-person families (13 | 9.7%) have the highest median income of $30,208 per family member.
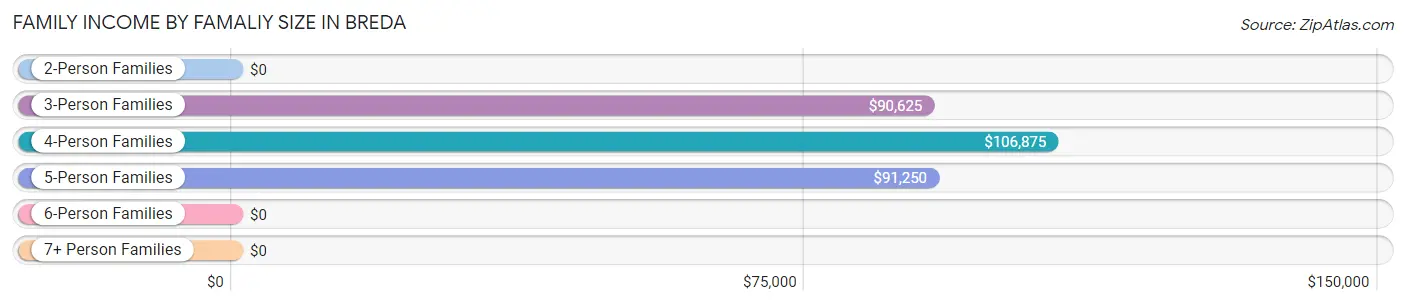
| Income Bracket | # Families | Median Income |
| 2-Person Families | 92 (68.7%) | $0 |
| 3-Person Families | 13 (9.7%) | $90,625 |
| 4-Person Families | 19 (14.2%) | $106,875 |
| 5-Person Families | 10 (7.5%) | $91,250 |
| 6-Person Families | 0 (0.0%) | $0 |
| 7+ Person Families | 0 (0.0%) | $0 |
| Total | 134 (100.0%) | $86,875 |
Family Income by Number of Earners in Breda
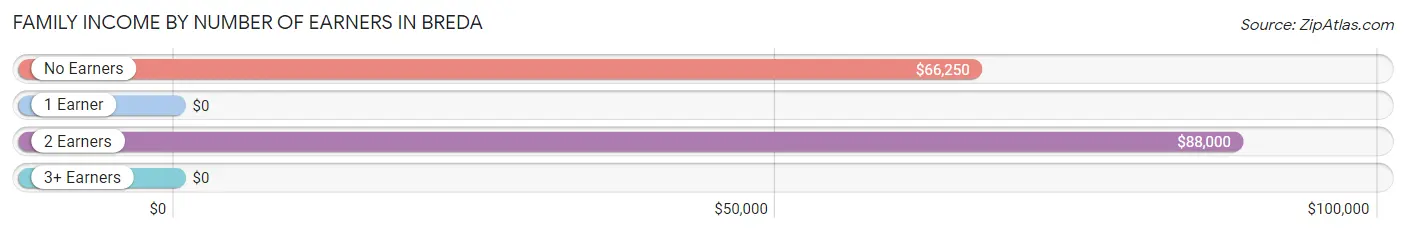
| Number of Earners | # Families | Median Income |
| No Earners | 16 (11.9%) | $66,250 |
| 1 Earner | 15 (11.2%) | $0 |
| 2 Earners | 100 (74.6%) | $88,000 |
| 3+ Earners | 3 (2.2%) | $0 |
| Total | 134 (100.0%) | $86,875 |
Household Income in Breda
Household Income Brackets in Breda
With 55 households falling in the category, the $50,000 to $74,999 income range is the most frequent in Breda, accounting for 26.7% of all households. In contrast, only 4 households (1.9%) fall into the $10,000 to $14,999 income bracket, making it the least populous group.
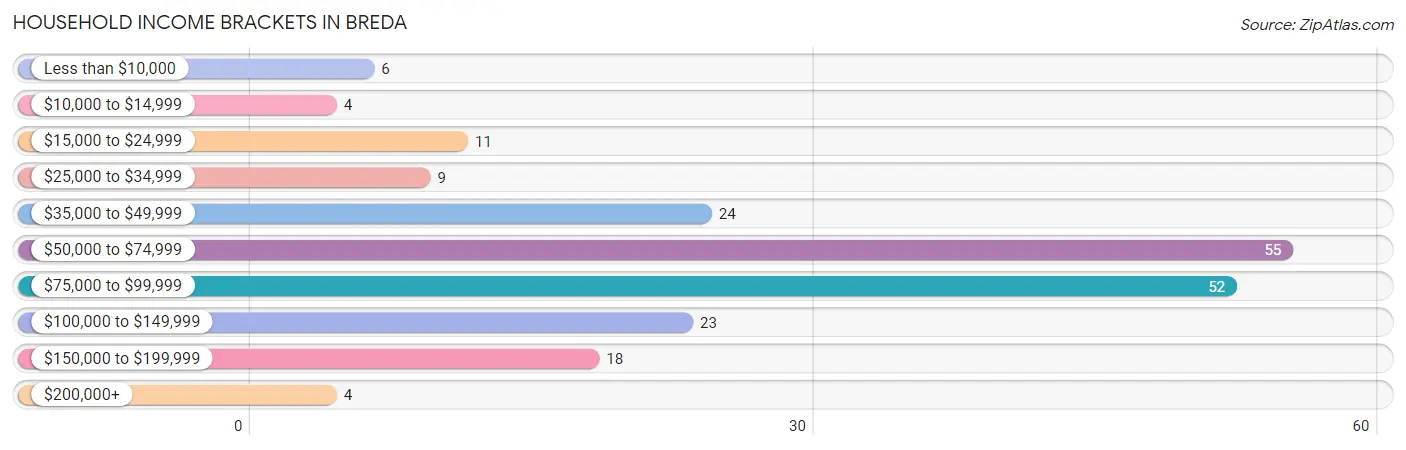
| Income Bracket | # Households | % Households |
| Less than $10,000 | 6 | 2.9% |
| $10,000 to $14,999 | 4 | 1.9% |
| $15,000 to $24,999 | 11 | 5.3% |
| $25,000 to $34,999 | 9 | 4.4% |
| $35,000 to $49,999 | 24 | 11.7% |
| $50,000 to $74,999 | 55 | 26.7% |
| $75,000 to $99,999 | 52 | 25.2% |
| $100,000 to $149,999 | 23 | 11.2% |
| $150,000 to $199,999 | 18 | 8.7% |
| $200,000+ | 4 | 1.9% |
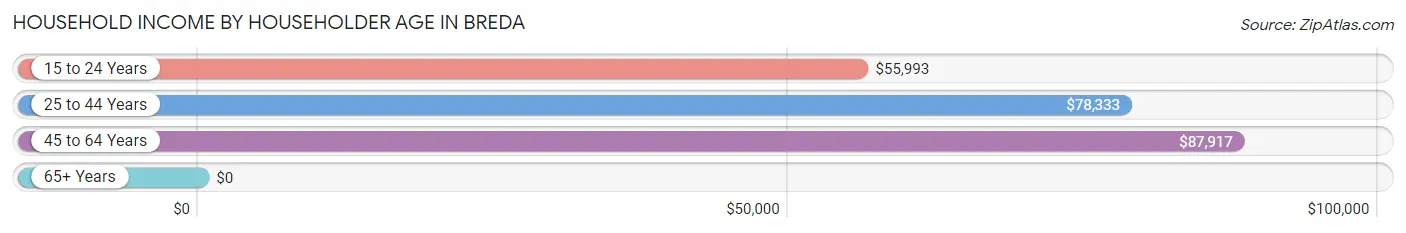
Household Income by Householder Age in Breda
The median household income in Breda is $57,426, with the highest median household income of $87,917 found in the 45 to 64 years age bracket for the primary householder. A total of 45 households (21.8%) fall into this category. Meanwhile, the 65+ years age bracket for the primary householder has the lowest median household income of $0, with 44 households (21.4%) in this group.
| Income Bracket | # Households | Median Income |
| 15 to 24 Years | 41 (19.9%) | $55,993 |
| 25 to 44 Years | 76 (36.9%) | $78,333 |
| 45 to 64 Years | 45 (21.8%) | $87,917 |
| 65+ Years | 44 (21.4%) | $0 |
| Total | 206 (100.0%) | $57,426 |
Poverty in Breda
Income Below Poverty by Sex and Age in Breda
With 5.0% poverty level for males and 2.0% for females among the residents of Breda, 6 to 11 year old males and 75 year old and over females are the most vulnerable to poverty, with 2 males (13.3%) and 2 females (16.7%) in their respective age groups living below the poverty level.
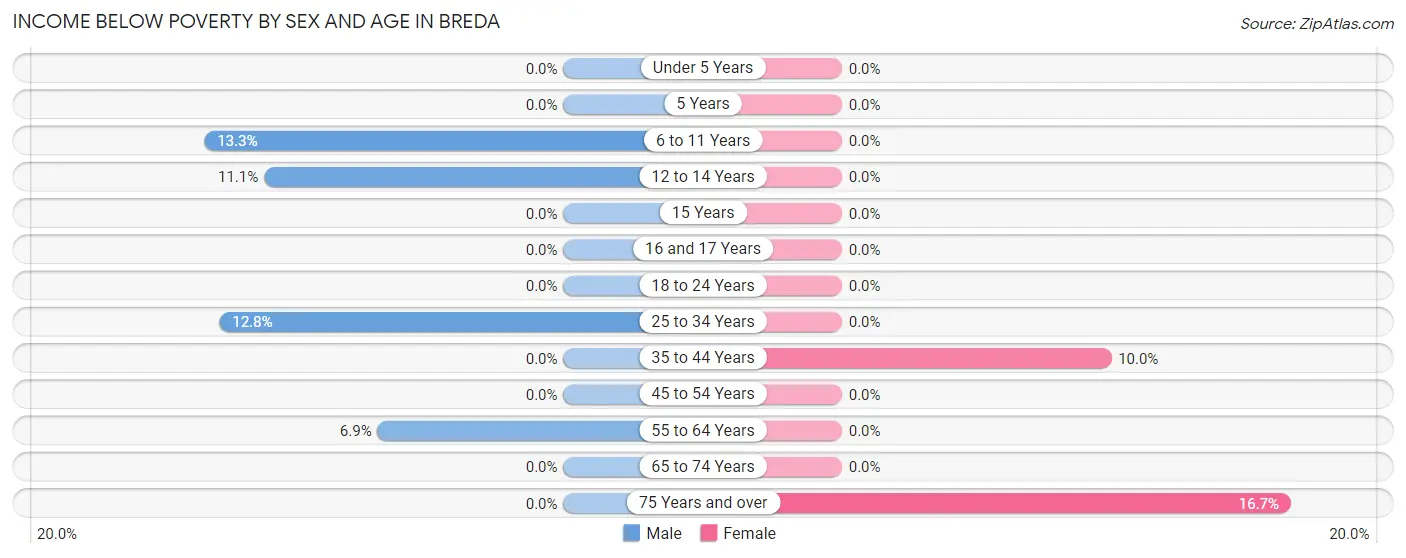
| Age Bracket | Male | Female |
| Under 5 Years | 0 (0.0%) | 0 (0.0%) |
| 5 Years | 0 (0.0%) | 0 (0.0%) |
| 6 to 11 Years | 2 (13.3%) | 0 (0.0%) |
| 12 to 14 Years | 2 (11.1%) | 0 (0.0%) |
| 15 Years | 0 (0.0%) | 0 (0.0%) |
| 16 and 17 Years | 0 (0.0%) | 0 (0.0%) |
| 18 to 24 Years | 0 (0.0%) | 0 (0.0%) |
| 25 to 34 Years | 6 (12.8%) | 0 (0.0%) |
| 35 to 44 Years | 0 (0.0%) | 2 (10.0%) |
| 45 to 54 Years | 0 (0.0%) | 0 (0.0%) |
| 55 to 64 Years | 2 (6.9%) | 0 (0.0%) |
| 65 to 74 Years | 0 (0.0%) | 0 (0.0%) |
| 75 Years and over | 0 (0.0%) | 2 (16.7%) |
| Total | 12 (5.0%) | 4 (2.0%) |
Income Above Poverty by Sex and Age in Breda
According to the poverty statistics in Breda, males aged under 5 years and females aged under 5 years are the age groups that are most secure financially, with 100.0% of males and 100.0% of females in these age groups living above the poverty line.
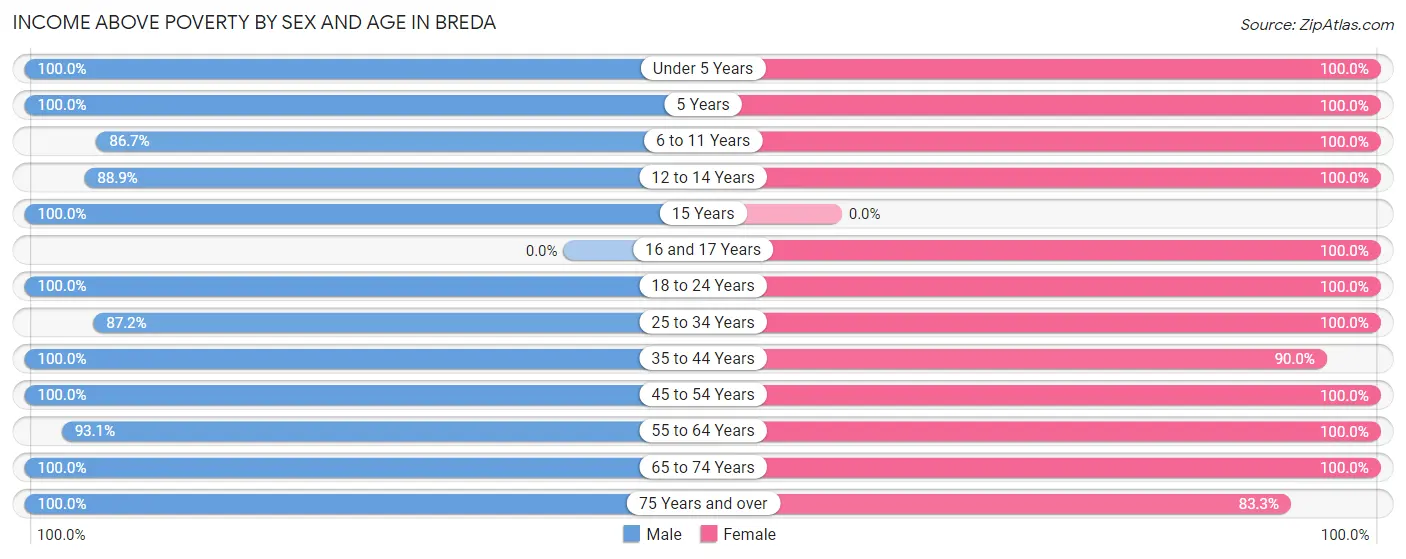
| Age Bracket | Male | Female |
| Under 5 Years | 7 (100.0%) | 12 (100.0%) |
| 5 Years | 2 (100.0%) | 5 (100.0%) |
| 6 to 11 Years | 13 (86.7%) | 14 (100.0%) |
| 12 to 14 Years | 16 (88.9%) | 5 (100.0%) |
| 15 Years | 2 (100.0%) | 0 (0.0%) |
| 16 and 17 Years | 0 (0.0%) | 8 (100.0%) |
| 18 to 24 Years | 41 (100.0%) | 27 (100.0%) |
| 25 to 34 Years | 41 (87.2%) | 28 (100.0%) |
| 35 to 44 Years | 31 (100.0%) | 18 (90.0%) |
| 45 to 54 Years | 9 (100.0%) | 15 (100.0%) |
| 55 to 64 Years | 27 (93.1%) | 36 (100.0%) |
| 65 to 74 Years | 27 (100.0%) | 16 (100.0%) |
| 75 Years and over | 13 (100.0%) | 10 (83.3%) |
| Total | 229 (95.0%) | 194 (98.0%) |
Income Below Poverty Among Married-Couple Families in Breda
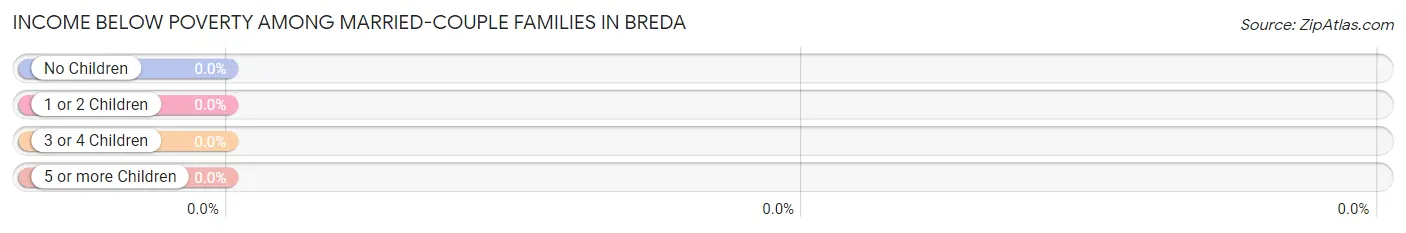
| Children | Above Poverty | Below Poverty |
| No Children | 84 (100.0%) | 0 (0.0%) |
| 1 or 2 Children | 25 (100.0%) | 0 (0.0%) |
| 3 or 4 Children | 10 (100.0%) | 0 (0.0%) |
| 5 or more Children | 0 (0.0%) | 0 (0.0%) |
| Total | 119 (100.0%) | 0 (0.0%) |
Income Below Poverty Among Single-Parent Households in Breda
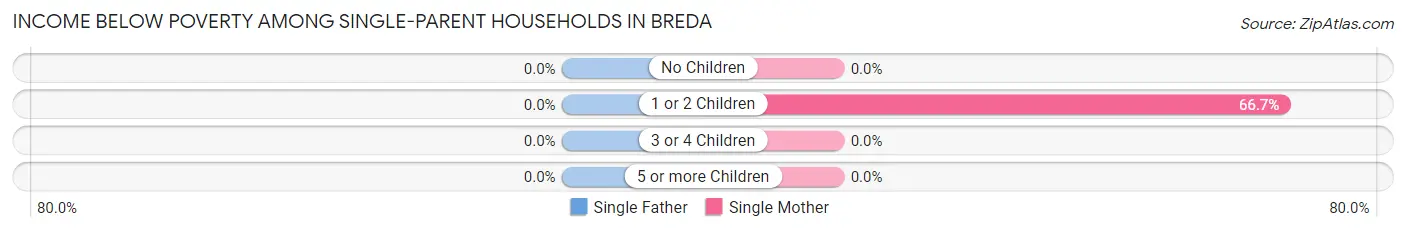
| Children | Single Father | Single Mother |
| No Children | 0 (0.0%) | 0 (0.0%) |
| 1 or 2 Children | 0 (0.0%) | 2 (66.7%) |
| 3 or 4 Children | 0 (0.0%) | 0 (0.0%) |
| 5 or more Children | 0 (0.0%) | 0 (0.0%) |
| Total | 0 (0.0%) | 2 (25.0%) |
Income Below Poverty Among Married-Couple vs Single-Parent Households in Breda
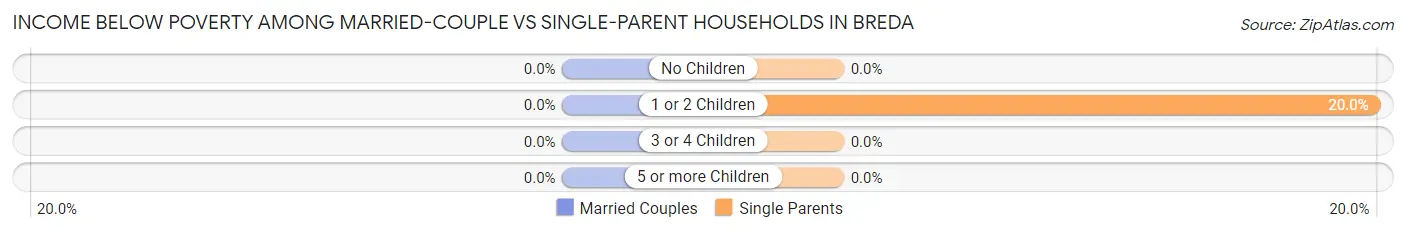
| Children | Married-Couple Families | Single-Parent Households |
| No Children | 0 (0.0%) | 0 (0.0%) |
| 1 or 2 Children | 0 (0.0%) | 2 (20.0%) |
| 3 or 4 Children | 0 (0.0%) | 0 (0.0%) |
| 5 or more Children | 0 (0.0%) | 0 (0.0%) |
| Total | 0 (0.0%) | 2 (13.3%) |
Race in Breda
The most populous races in Breda are , and White / Caucasian (439 | 100.0%).
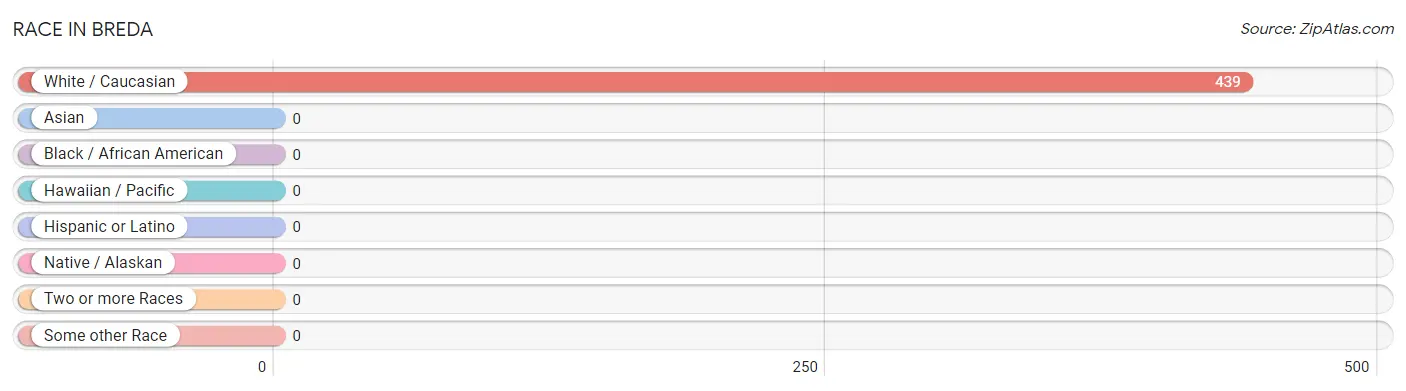
| Race | # Population | % Population |
| Asian | 0 | 0.0% |
| Black / African American | 0 | 0.0% |
| Hawaiian / Pacific | 0 | 0.0% |
| Hispanic or Latino | 0 | 0.0% |
| Native / Alaskan | 0 | 0.0% |
| White / Caucasian | 439 | 100.0% |
| Two or more Races | 0 | 0.0% |
| Some other Race | 0 | 0.0% |
| Total | 439 | 100.0% |
Ancestry in Breda
The most populous ancestries reported in Breda are German (265 | 60.4%), Dutch (45 | 10.2%), American (31 | 7.1%), Irish (27 | 6.1%), and English (11 | 2.5%), together accounting for 86.3% of all Breda residents.
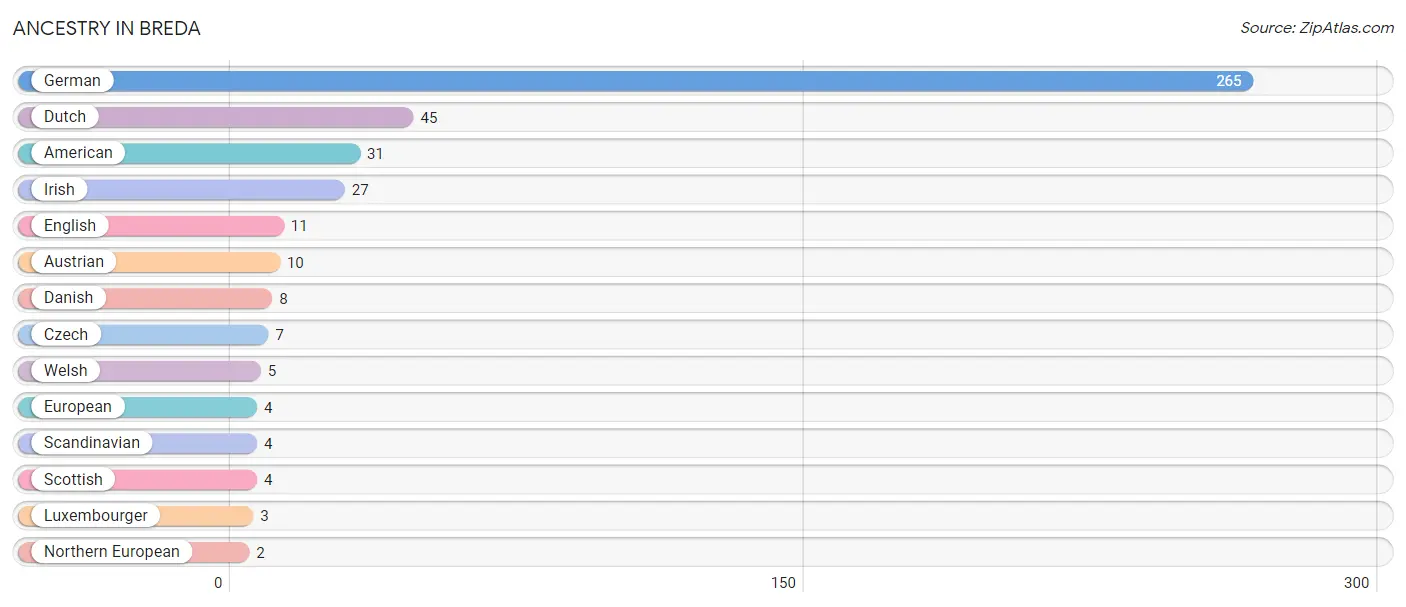
| Ancestry | # Population | % Population |
| American | 31 | 7.1% |
| Austrian | 10 | 2.3% |
| Czech | 7 | 1.6% |
| Danish | 8 | 1.8% |
| Dutch | 45 | 10.2% |
| English | 11 | 2.5% |
| European | 4 | 0.9% |
| German | 265 | 60.4% |
| Irish | 27 | 6.1% |
| Luxembourger | 3 | 0.7% |
| Northern European | 2 | 0.5% |
| Scandinavian | 4 | 0.9% |
| Scottish | 4 | 0.9% |
| Welsh | 5 | 1.1% | View All 14 Rows |
Immigrants in Breda

| Immigration Origin | # Population | % Population | View All 0 Rows |
Sex and Age in Breda
Sex and Age in Breda
The most populous age groups in Breda are 20 to 24 Years (41 | 17.0%) for men and 60 to 64 Years (24 | 12.1%) for women.
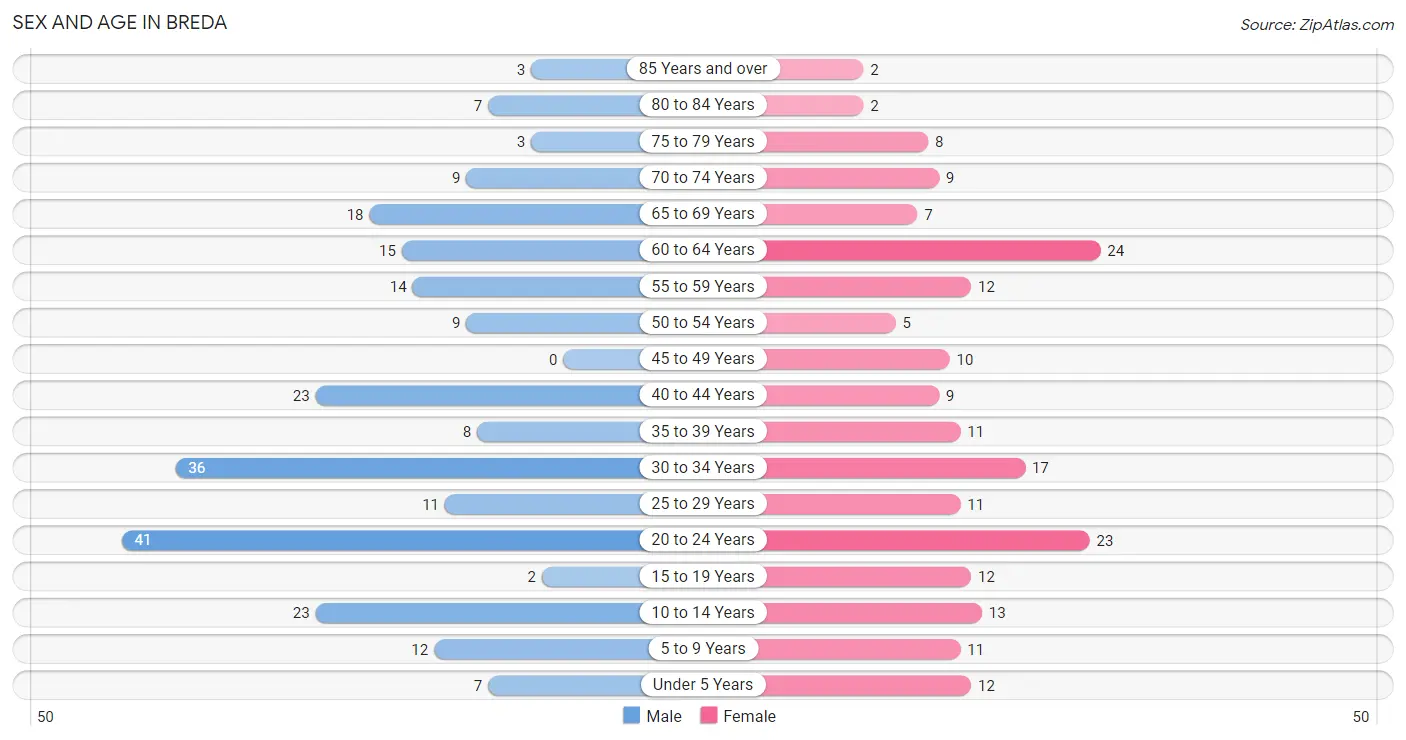
| Age Bracket | Male | Female |
| Under 5 Years | 7 (2.9%) | 12 (6.1%) |
| 5 to 9 Years | 12 (5.0%) | 11 (5.6%) |
| 10 to 14 Years | 23 (9.5%) | 13 (6.6%) |
| 15 to 19 Years | 2 (0.8%) | 12 (6.1%) |
| 20 to 24 Years | 41 (17.0%) | 23 (11.6%) |
| 25 to 29 Years | 11 (4.6%) | 11 (5.6%) |
| 30 to 34 Years | 36 (14.9%) | 17 (8.6%) |
| 35 to 39 Years | 8 (3.3%) | 11 (5.6%) |
| 40 to 44 Years | 23 (9.5%) | 9 (4.5%) |
| 45 to 49 Years | 0 (0.0%) | 10 (5.1%) |
| 50 to 54 Years | 9 (3.7%) | 5 (2.5%) |
| 55 to 59 Years | 14 (5.8%) | 12 (6.1%) |
| 60 to 64 Years | 15 (6.2%) | 24 (12.1%) |
| 65 to 69 Years | 18 (7.5%) | 7 (3.5%) |
| 70 to 74 Years | 9 (3.7%) | 9 (4.5%) |
| 75 to 79 Years | 3 (1.2%) | 8 (4.0%) |
| 80 to 84 Years | 7 (2.9%) | 2 (1.0%) |
| 85 Years and over | 3 (1.2%) | 2 (1.0%) |
| Total | 241 (100.0%) | 198 (100.0%) |
Families and Households in Breda
Median Family Size in Breda
The median family size in Breda is 2.60 persons per family, with single female/mother families (8 | 6.0%) accounting for the largest median family size of 3.13 persons per family. On the other hand, single male/father families (7 | 5.2%) represent the smallest median family size with 2.00 persons per family.
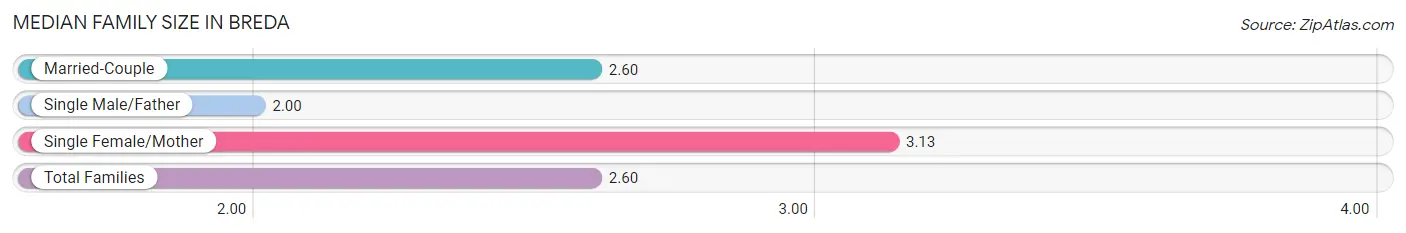
| Family Type | # Families | Family Size |
| Married-Couple | 119 (88.8%) | 2.60 |
| Single Male/Father | 7 (5.2%) | 2.00 |
| Single Female/Mother | 8 (6.0%) | 3.13 |
| Total Families | 134 (100.0%) | 2.60 |
Median Household Size in Breda
The median household size in Breda is 2.13 persons per household, with single female/mother households (8 | 3.9%) accounting for the largest median household size of 3.38 persons per household. non-family households (72 | 34.9%) represent the smallest median household size with 1.24 persons per household.
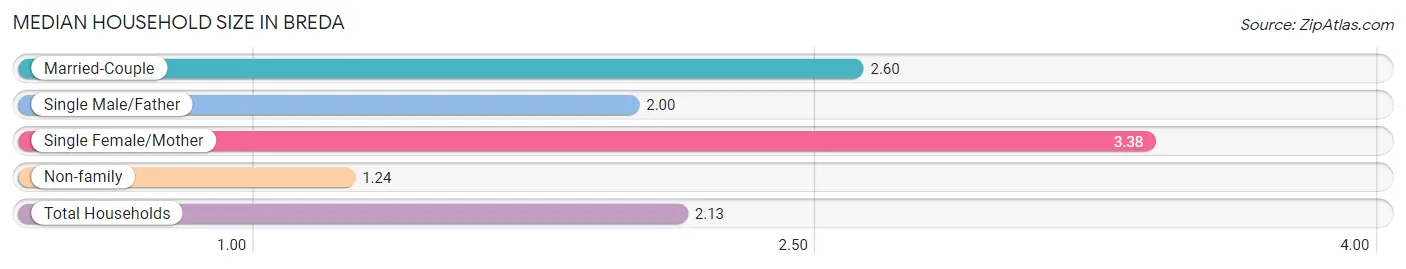
| Household Type | # Households | Household Size |
| Married-Couple | 119 (57.8%) | 2.60 |
| Single Male/Father | 7 (3.4%) | 2.00 |
| Single Female/Mother | 8 (3.9%) | 3.38 |
| Non-family | 72 (34.9%) | 1.24 |
| Total Households | 206 (100.0%) | 2.13 |
Household Size by Marriage Status in Breda
Out of a total of 206 households in Breda, 134 (65.0%) are family households, while 72 (34.9%) are nonfamily households. The most numerous type of family households are 2-person households, comprising 92, and the most common type of nonfamily households are 1-person households, comprising 57.
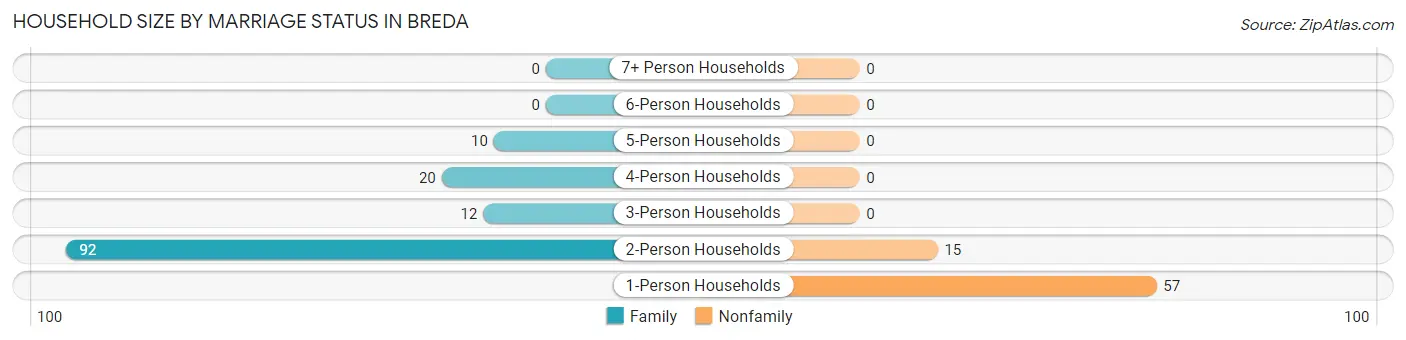
| Household Size | Family Households | Nonfamily Households |
| 1-Person Households | - | 57 (27.7%) |
| 2-Person Households | 92 (44.7%) | 15 (7.3%) |
| 3-Person Households | 12 (5.8%) | 0 (0.0%) |
| 4-Person Households | 20 (9.7%) | 0 (0.0%) |
| 5-Person Households | 10 (4.9%) | 0 (0.0%) |
| 6-Person Households | 0 (0.0%) | 0 (0.0%) |
| 7+ Person Households | 0 (0.0%) | 0 (0.0%) |
| Total | 134 (65.0%) | 72 (34.9%) |
Female Fertility in Breda
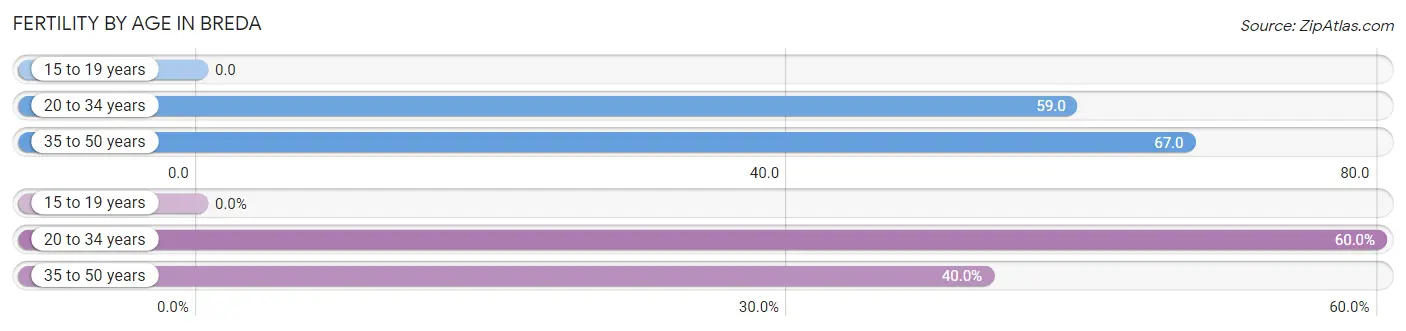
Fertility by Age in Breda
Average fertility rate in Breda is 54.0 births per 1,000 women. Women in the age bracket of 35 to 50 years have the highest fertility rate with 67.0 births per 1,000 women. Women in the age bracket of 20 to 34 years acount for 60.0% of all women with births.
| Age Bracket | Women with Births | Births / 1,000 Women |
| 15 to 19 years | 0 (0.0%) | 0.0 |
| 20 to 34 years | 3 (60.0%) | 59.0 |
| 35 to 50 years | 2 (40.0%) | 67.0 |
| Total | 5 (100.0%) | 54.0 |
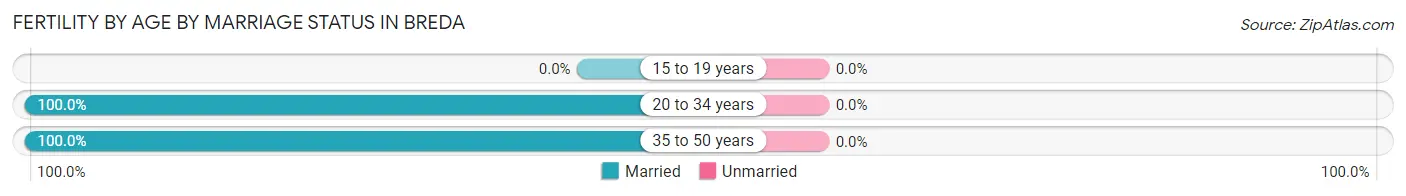
Fertility by Age by Marriage Status in Breda
| Age Bracket | Married | Unmarried |
| 15 to 19 years | 0 (0.0%) | 0 (0.0%) |
| 20 to 34 years | 3 (100.0%) | 0 (0.0%) |
| 35 to 50 years | 2 (100.0%) | 0 (0.0%) |
| Total | 5 (100.0%) | 0 (0.0%) |
Fertility by Education in Breda
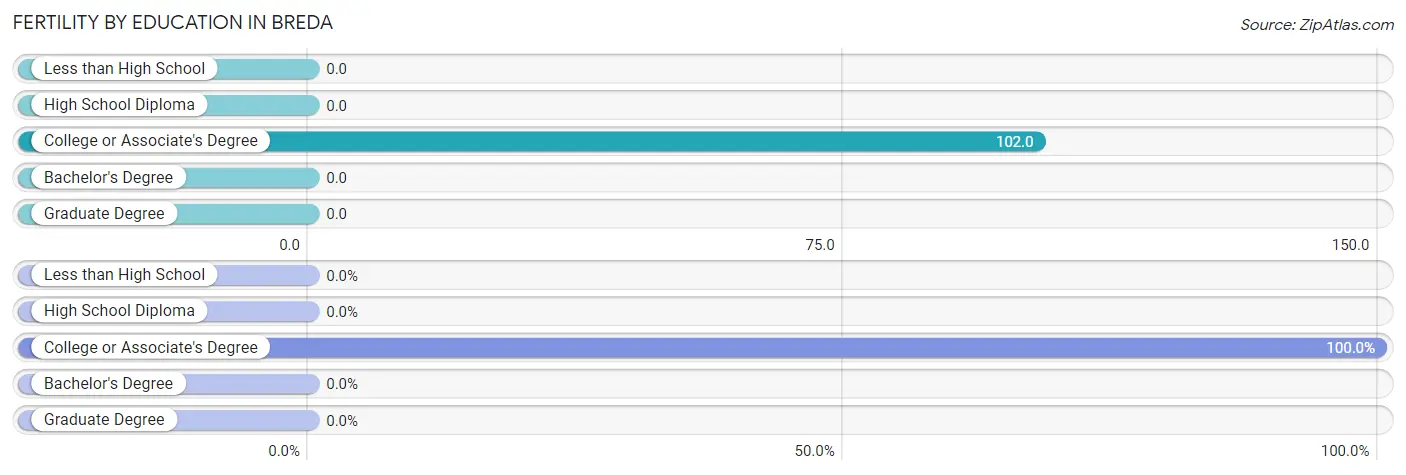
| Educational Attainment | Women with Births | Births / 1,000 Women |
| Less than High School | 0 (0.0%) | 0.0 |
| High School Diploma | 0 (0.0%) | 0.0 |
| College or Associate's Degree | 5 (100.0%) | 102.0 |
| Bachelor's Degree | 0 (0.0%) | 0.0 |
| Graduate Degree | 0 (0.0%) | 0.0 |
| Total | 5 (100.0%) | 54.0 |
Fertility by Education by Marriage Status in Breda
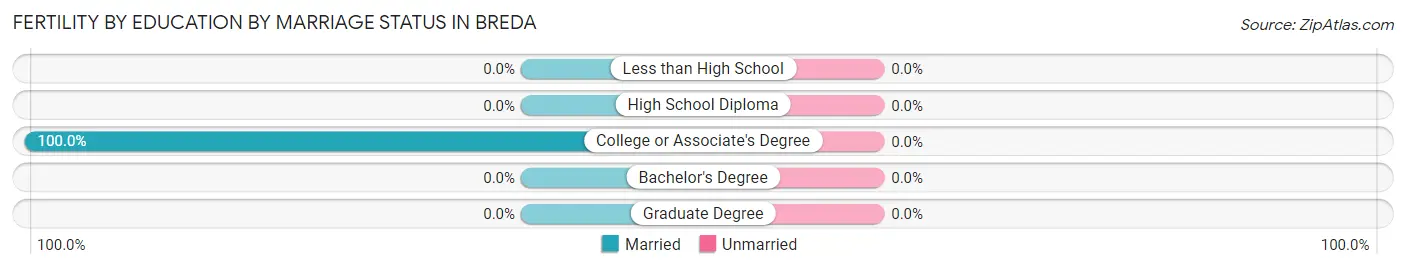
| Educational Attainment | Married | Unmarried |
| Less than High School | 0 (0.0%) | 0 (0.0%) |
| High School Diploma | 0 (0.0%) | 0 (0.0%) |
| College or Associate's Degree | 5 (100.0%) | 0 (0.0%) |
| Bachelor's Degree | 0 (0.0%) | 0 (0.0%) |
| Graduate Degree | 0 (0.0%) | 0 (0.0%) |
| Total | 5 (100.0%) | 0 (0.0%) |
Employment Characteristics in Breda
Employment by Class of Employer in Breda
Among the 282 employed individuals in Breda, private company employees (206 | 73.1%), not-for-profit organizations (37 | 13.1%), and self-employed (not incorporated) (24 | 8.5%) make up the most common classes of employment.
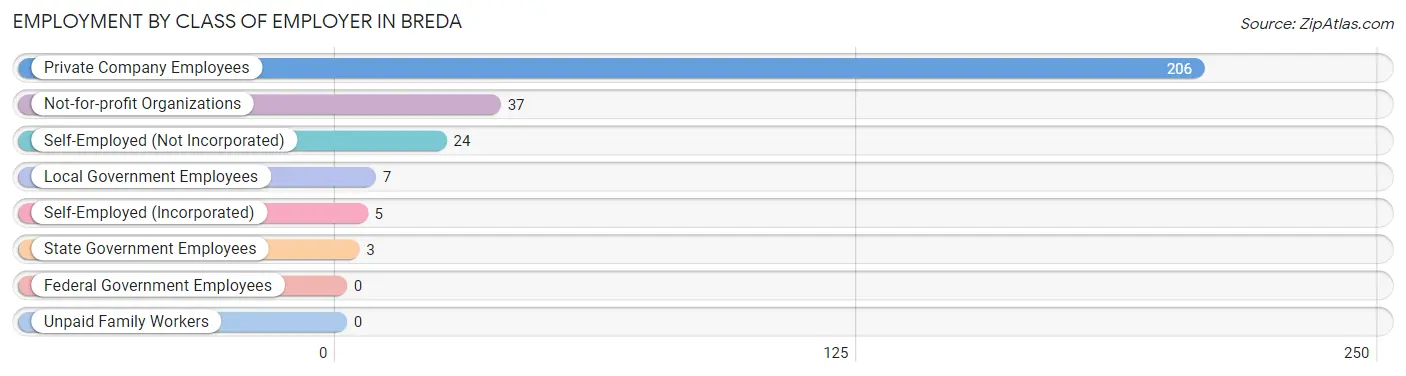
| Employer Class | # Employees | % Employees |
| Private Company Employees | 206 | 73.1% |
| Self-Employed (Incorporated) | 5 | 1.8% |
| Self-Employed (Not Incorporated) | 24 | 8.5% |
| Not-for-profit Organizations | 37 | 13.1% |
| Local Government Employees | 7 | 2.5% |
| State Government Employees | 3 | 1.1% |
| Federal Government Employees | 0 | 0.0% |
| Unpaid Family Workers | 0 | 0.0% |
| Total | 282 | 100.0% |
Employment Status by Age in Breda
According to the labor force statistics for Breda, out of the total population over 16 years of age (359), 80.8% or 290 individuals are in the labor force, with 2.8% or 8 of them unemployed. The age group with the highest labor force participation rate is 20 to 24 years, with 100.0% or 64 individuals in the labor force. Within the labor force, the 20 to 24 years age range has the highest percentage of unemployed individuals, with 12.5% or 8 of them being unemployed.
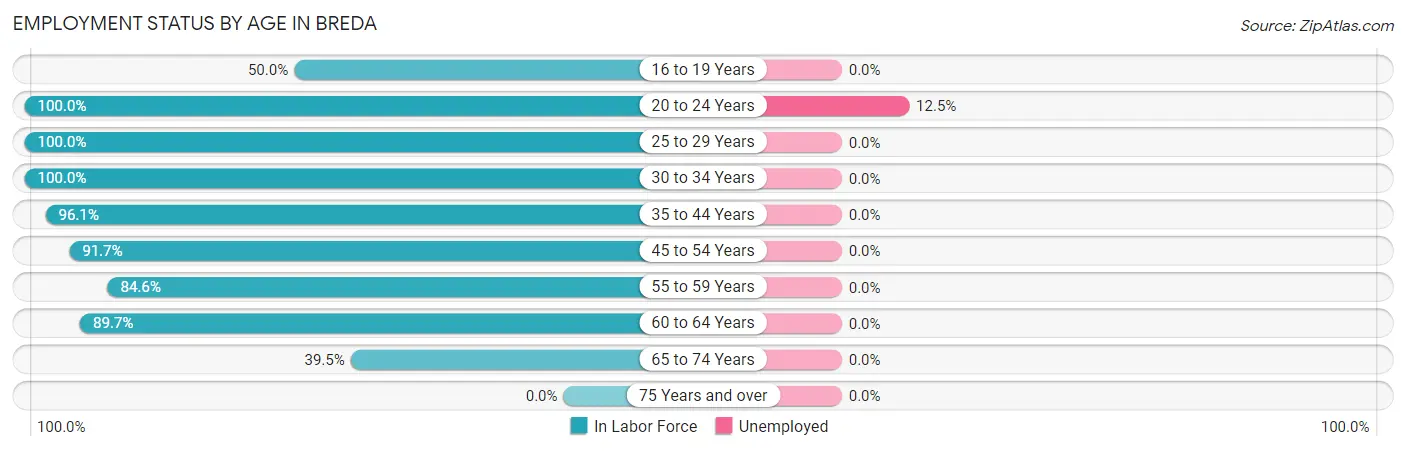
| Age Bracket | In Labor Force | Unemployed |
| 16 to 19 Years | 6 (50.0%) | 0 (0.0%) |
| 20 to 24 Years | 64 (100.0%) | 8 (12.5%) |
| 25 to 29 Years | 22 (100.0%) | 0 (0.0%) |
| 30 to 34 Years | 53 (100.0%) | 0 (0.0%) |
| 35 to 44 Years | 49 (96.1%) | 0 (0.0%) |
| 45 to 54 Years | 22 (91.7%) | 0 (0.0%) |
| 55 to 59 Years | 22 (84.6%) | 0 (0.0%) |
| 60 to 64 Years | 35 (89.7%) | 0 (0.0%) |
| 65 to 74 Years | 17 (39.5%) | 0 (0.0%) |
| 75 Years and over | 0 (0.0%) | 0 (0.0%) |
| Total | 290 (80.8%) | 8 (2.8%) |
Employment Status by Educational Attainment in Breda
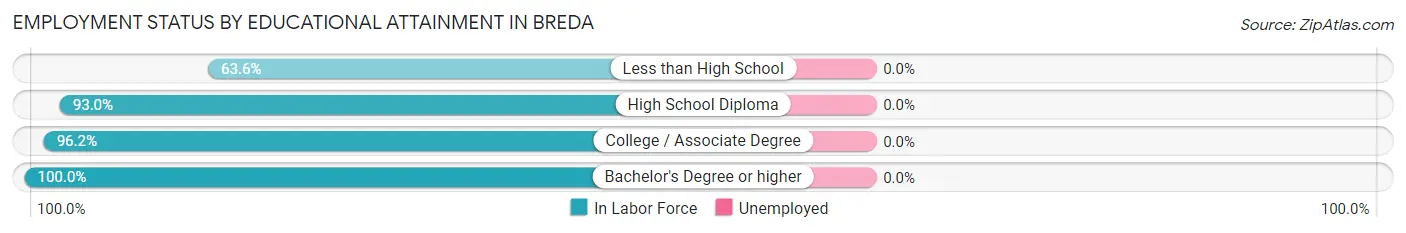
| Educational Attainment | In Labor Force | Unemployed |
| Less than High School | 7 (63.6%) | 0 (0.0%) |
| High School Diploma | 53 (93.0%) | 0 (0.0%) |
| College / Associate Degree | 101 (96.2%) | 0 (0.0%) |
| Bachelor's Degree or higher | 42 (100.0%) | 0 (0.0%) |
| Total | 203 (94.4%) | 0 (0.0%) |
Employment Occupations by Sex in Breda
Management, Business, Science and Arts Occupations
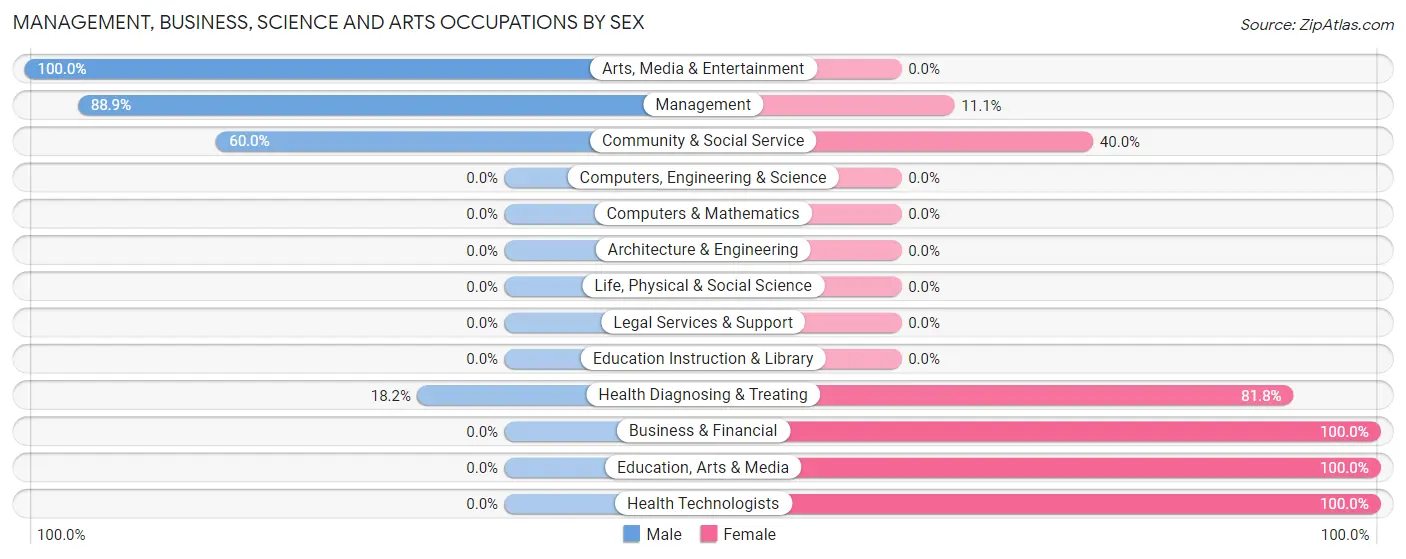
The most common Management, Business, Science and Arts occupations in Breda are Health Diagnosing & Treating (22 | 7.8%), Management (18 | 6.4%), Health Technologists (13 | 4.6%), Community & Social Service (10 | 3.5%), and Business & Financial (6 | 2.1%).
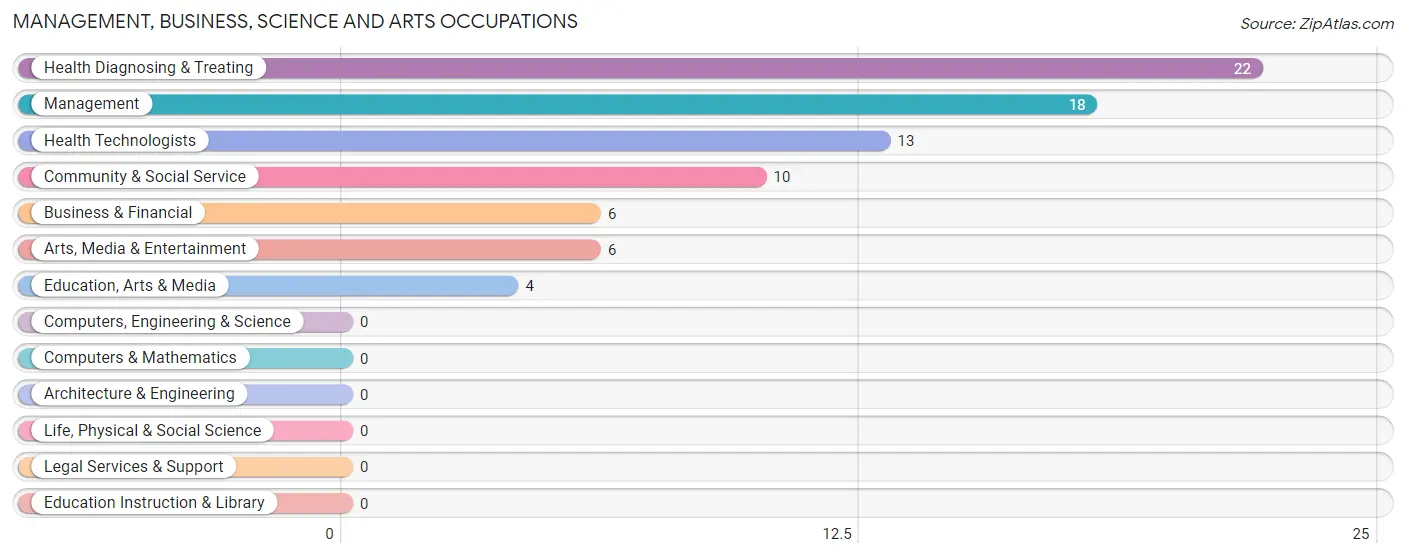
Management, Business, Science and Arts Occupations by Sex
Within the Management, Business, Science and Arts occupations in Breda, the most male-oriented occupations are Arts, Media & Entertainment (100.0%), Management (88.9%), and Community & Social Service (60.0%), while the most female-oriented occupations are Business & Financial (100.0%), Education, Arts & Media (100.0%), and Health Technologists (100.0%).
| Occupation | Male | Female |
| Management | 16 (88.9%) | 2 (11.1%) |
| Business & Financial | 0 (0.0%) | 6 (100.0%) |
| Computers, Engineering & Science | 0 (0.0%) | 0 (0.0%) |
| Computers & Mathematics | 0 (0.0%) | 0 (0.0%) |
| Architecture & Engineering | 0 (0.0%) | 0 (0.0%) |
| Life, Physical & Social Science | 0 (0.0%) | 0 (0.0%) |
| Community & Social Service | 6 (60.0%) | 4 (40.0%) |
| Education, Arts & Media | 0 (0.0%) | 4 (100.0%) |
| Legal Services & Support | 0 (0.0%) | 0 (0.0%) |
| Education Instruction & Library | 0 (0.0%) | 0 (0.0%) |
| Arts, Media & Entertainment | 6 (100.0%) | 0 (0.0%) |
| Health Diagnosing & Treating | 4 (18.2%) | 18 (81.8%) |
| Health Technologists | 0 (0.0%) | 13 (100.0%) |
| Total (Category) | 26 (46.4%) | 30 (53.6%) |
| Total (Overall) | 154 (54.6%) | 128 (45.4%) |
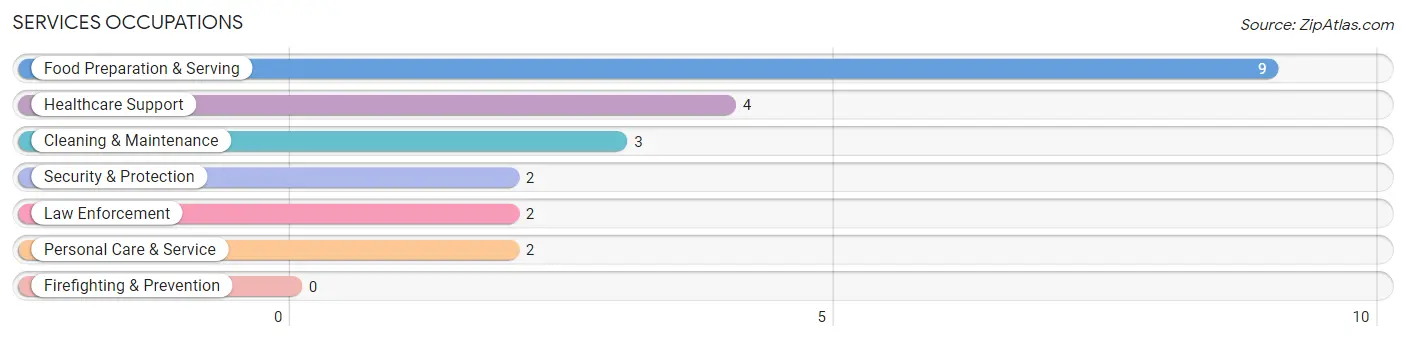
Services Occupations
The most common Services occupations in Breda are Food Preparation & Serving (9 | 3.2%), Healthcare Support (4 | 1.4%), Cleaning & Maintenance (3 | 1.1%), Security & Protection (2 | 0.7%), and Law Enforcement (2 | 0.7%).
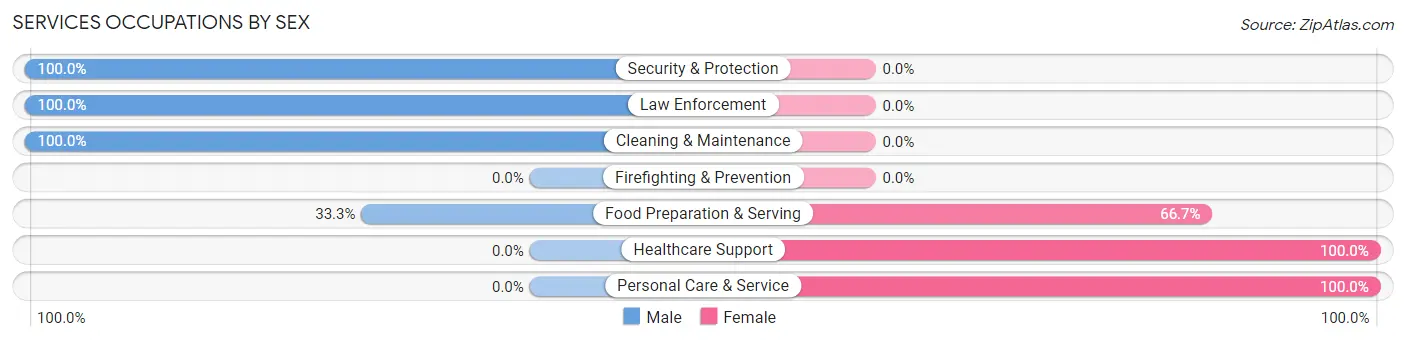
Services Occupations by Sex
Within the Services occupations in Breda, the most male-oriented occupations are Security & Protection (100.0%), Law Enforcement (100.0%), and Cleaning & Maintenance (100.0%), while the most female-oriented occupations are Healthcare Support (100.0%), Personal Care & Service (100.0%), and Food Preparation & Serving (66.7%).
| Occupation | Male | Female |
| Healthcare Support | 0 (0.0%) | 4 (100.0%) |
| Security & Protection | 2 (100.0%) | 0 (0.0%) |
| Firefighting & Prevention | 0 (0.0%) | 0 (0.0%) |
| Law Enforcement | 2 (100.0%) | 0 (0.0%) |
| Food Preparation & Serving | 3 (33.3%) | 6 (66.7%) |
| Cleaning & Maintenance | 3 (100.0%) | 0 (0.0%) |
| Personal Care & Service | 0 (0.0%) | 2 (100.0%) |
| Total (Category) | 8 (40.0%) | 12 (60.0%) |
| Total (Overall) | 154 (54.6%) | 128 (45.4%) |
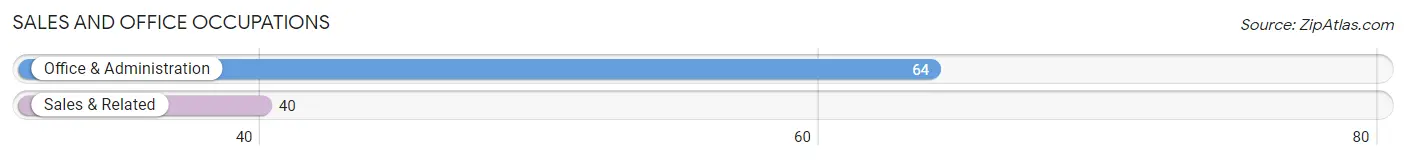
Sales and Office Occupations
The most common Sales and Office occupations in Breda are Office & Administration (64 | 22.7%), and Sales & Related (40 | 14.2%).
Sales and Office Occupations by Sex
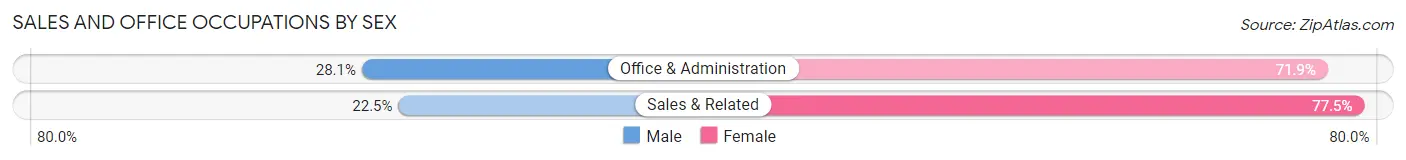
| Occupation | Male | Female |
| Sales & Related | 9 (22.5%) | 31 (77.5%) |
| Office & Administration | 18 (28.1%) | 46 (71.9%) |
| Total (Category) | 27 (26.0%) | 77 (74.0%) |
| Total (Overall) | 154 (54.6%) | 128 (45.4%) |
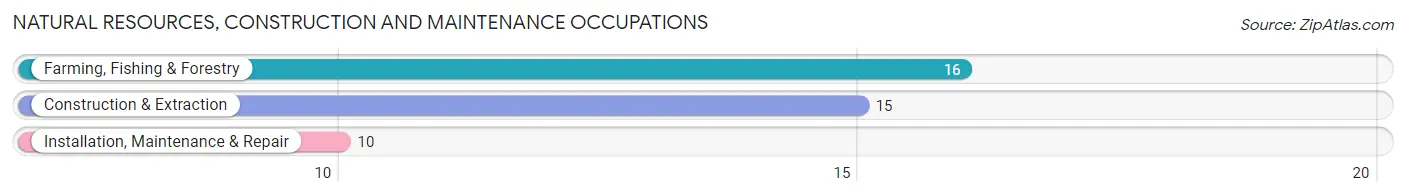
Natural Resources, Construction and Maintenance Occupations
The most common Natural Resources, Construction and Maintenance occupations in Breda are Farming, Fishing & Forestry (16 | 5.7%), Construction & Extraction (15 | 5.3%), and Installation, Maintenance & Repair (10 | 3.5%).
Natural Resources, Construction and Maintenance Occupations by Sex
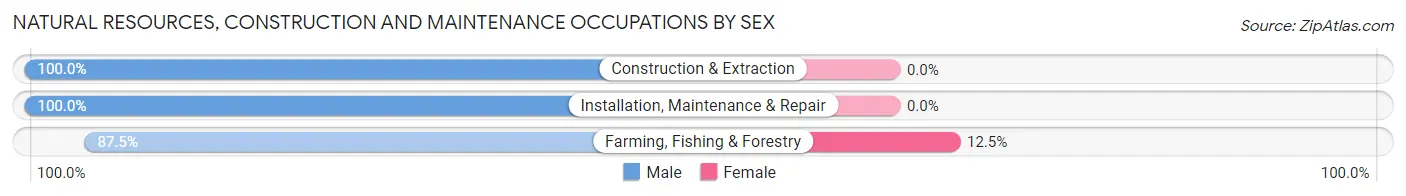
| Occupation | Male | Female |
| Farming, Fishing & Forestry | 14 (87.5%) | 2 (12.5%) |
| Construction & Extraction | 15 (100.0%) | 0 (0.0%) |
| Installation, Maintenance & Repair | 10 (100.0%) | 0 (0.0%) |
| Total (Category) | 39 (95.1%) | 2 (4.9%) |
| Total (Overall) | 154 (54.6%) | 128 (45.4%) |
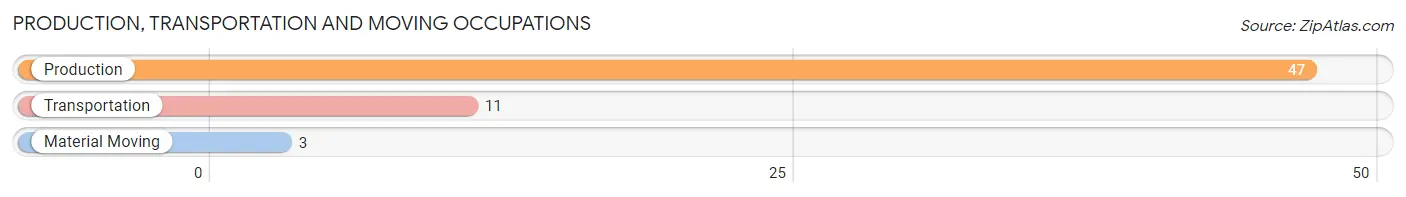
Production, Transportation and Moving Occupations
The most common Production, Transportation and Moving occupations in Breda are Production (47 | 16.7%), Transportation (11 | 3.9%), and Material Moving (3 | 1.1%).
Production, Transportation and Moving Occupations by Sex
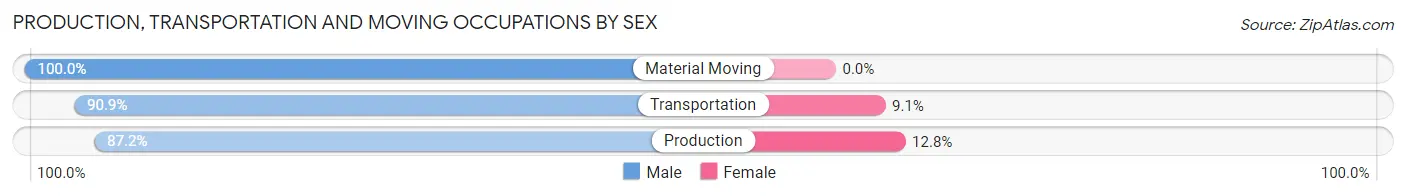
| Occupation | Male | Female |
| Production | 41 (87.2%) | 6 (12.8%) |
| Transportation | 10 (90.9%) | 1 (9.1%) |
| Material Moving | 3 (100.0%) | 0 (0.0%) |
| Total (Category) | 54 (88.5%) | 7 (11.5%) |
| Total (Overall) | 154 (54.6%) | 128 (45.4%) |
Employment Industries by Sex in Breda
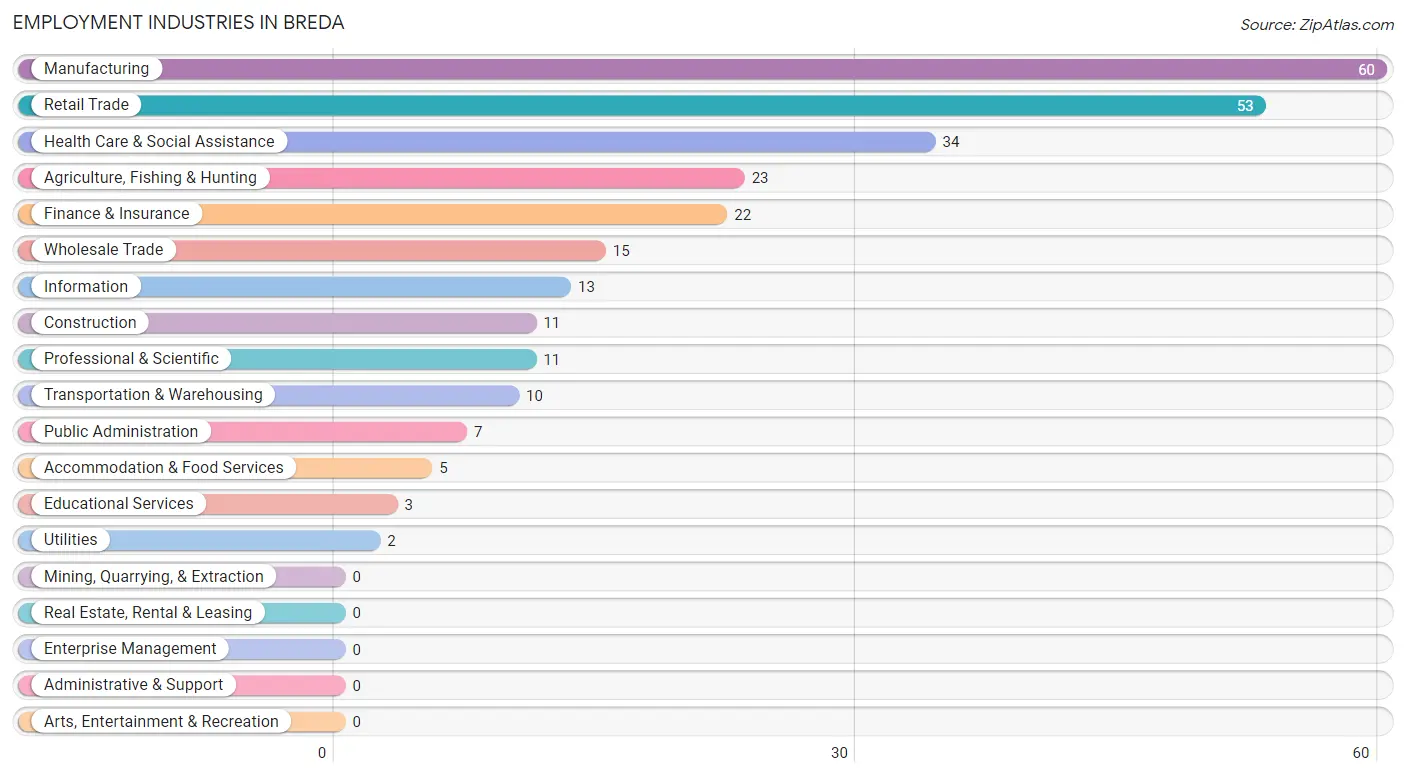
Employment Industries in Breda
The major employment industries in Breda include Manufacturing (60 | 21.3%), Retail Trade (53 | 18.8%), Health Care & Social Assistance (34 | 12.1%), Agriculture, Fishing & Hunting (23 | 8.2%), and Finance & Insurance (22 | 7.8%).
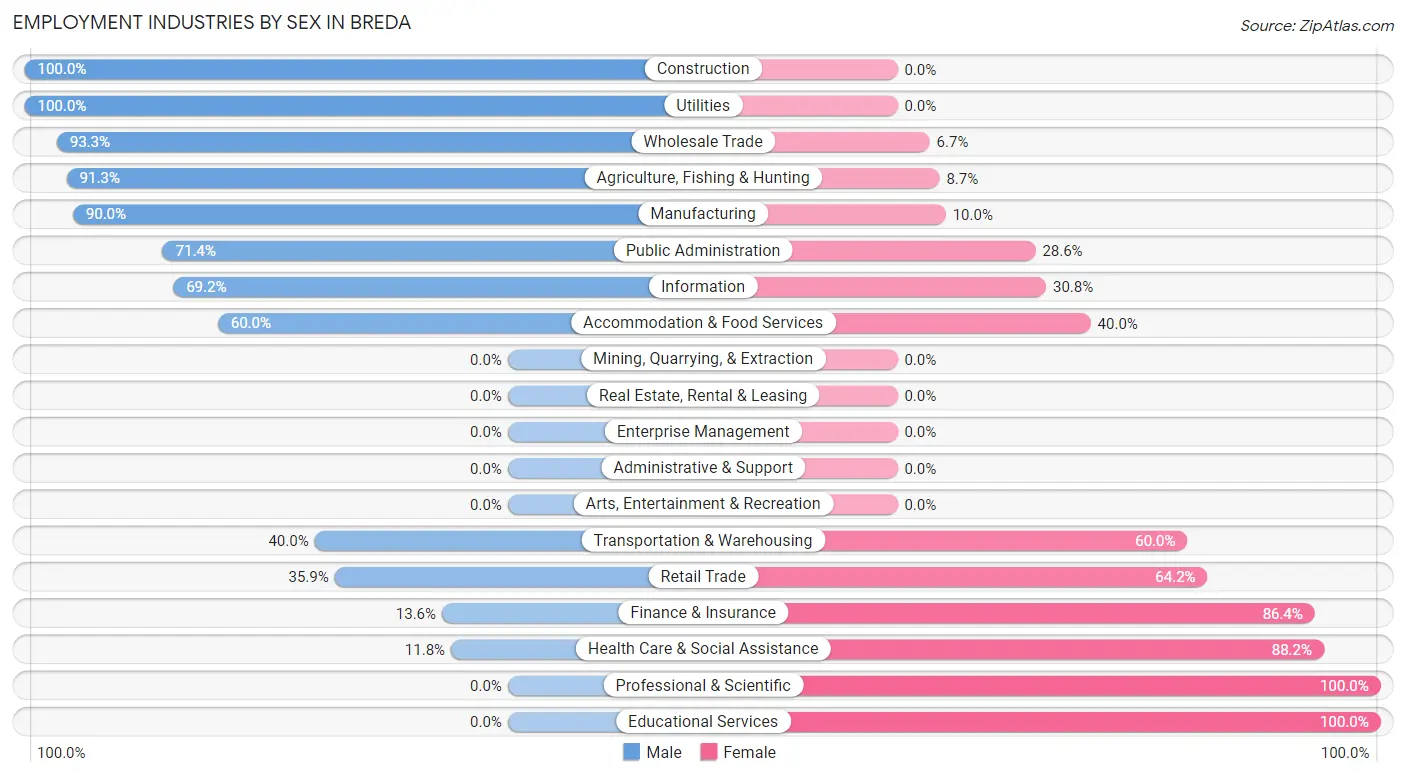
Employment Industries by Sex in Breda
The Breda industries that see more men than women are Construction (100.0%), Utilities (100.0%), and Wholesale Trade (93.3%), whereas the industries that tend to have a higher number of women are Professional & Scientific (100.0%), Educational Services (100.0%), and Health Care & Social Assistance (88.2%).
| Industry | Male | Female |
| Agriculture, Fishing & Hunting | 21 (91.3%) | 2 (8.7%) |
| Mining, Quarrying, & Extraction | 0 (0.0%) | 0 (0.0%) |
| Construction | 11 (100.0%) | 0 (0.0%) |
| Manufacturing | 54 (90.0%) | 6 (10.0%) |
| Wholesale Trade | 14 (93.3%) | 1 (6.7%) |
| Retail Trade | 19 (35.8%) | 34 (64.1%) |
| Transportation & Warehousing | 4 (40.0%) | 6 (60.0%) |
| Utilities | 2 (100.0%) | 0 (0.0%) |
| Information | 9 (69.2%) | 4 (30.8%) |
| Finance & Insurance | 3 (13.6%) | 19 (86.4%) |
| Real Estate, Rental & Leasing | 0 (0.0%) | 0 (0.0%) |
| Professional & Scientific | 0 (0.0%) | 11 (100.0%) |
| Enterprise Management | 0 (0.0%) | 0 (0.0%) |
| Administrative & Support | 0 (0.0%) | 0 (0.0%) |
| Educational Services | 0 (0.0%) | 3 (100.0%) |
| Health Care & Social Assistance | 4 (11.8%) | 30 (88.2%) |
| Arts, Entertainment & Recreation | 0 (0.0%) | 0 (0.0%) |
| Accommodation & Food Services | 3 (60.0%) | 2 (40.0%) |
| Public Administration | 5 (71.4%) | 2 (28.6%) |
| Total | 154 (54.6%) | 128 (45.4%) |
Education in Breda
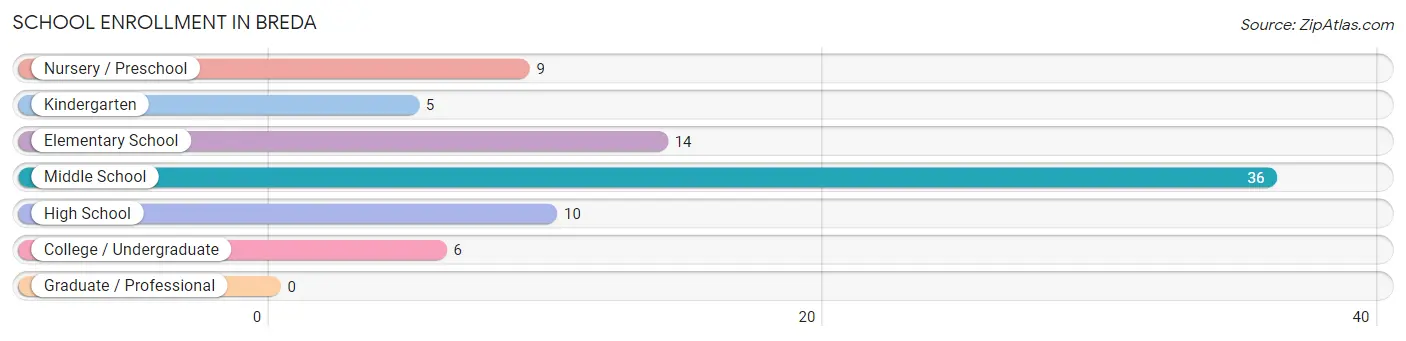
School Enrollment in Breda
The most common levels of schooling among the 80 students in Breda are middle school (36 | 45.0%), elementary school (14 | 17.5%), and high school (10 | 12.5%).
| School Level | # Students | % Students |
| Nursery / Preschool | 9 | 11.3% |
| Kindergarten | 5 | 6.2% |
| Elementary School | 14 | 17.5% |
| Middle School | 36 | 45.0% |
| High School | 10 | 12.5% |
| College / Undergraduate | 6 | 7.5% |
| Graduate / Professional | 0 | 0.0% |
| Total | 80 | 100.0% |
School Enrollment by Age by Funding Source in Breda
Out of a total of 80 students who are enrolled in schools in Breda, 24 (30.0%) attend a private institution, while the remaining 56 (70.0%) are enrolled in public schools. The age group of 25 to 34 year olds has the highest likelihood of being enrolled in private schools, with 2 (100.0% in the age bracket) enrolled. Conversely, the age group of 3 to 4 year olds has the lowest likelihood of being enrolled in a private school, with 7 (100.0% in the age bracket) attending a public institution.
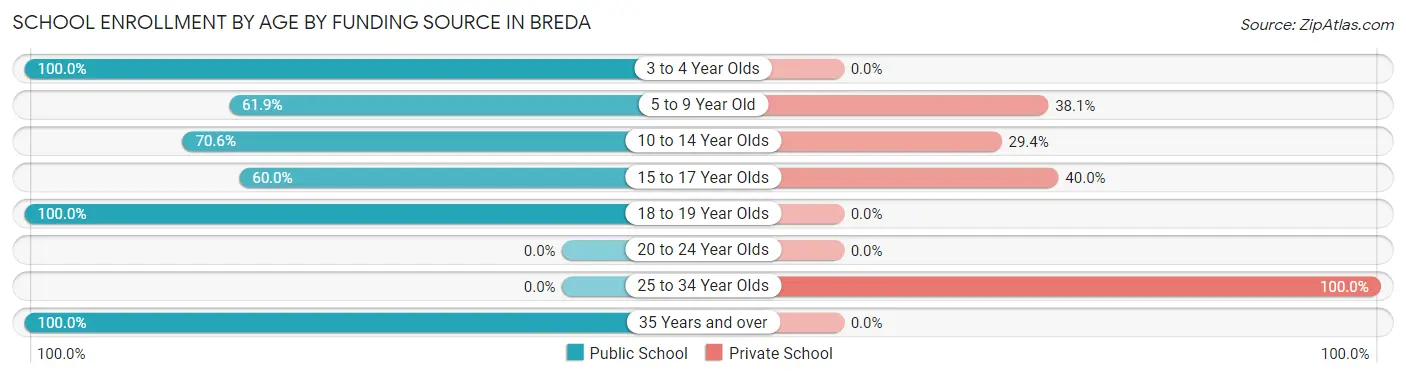
| Age Bracket | Public School | Private School |
| 3 to 4 Year Olds | 7 (100.0%) | 0 (0.0%) |
| 5 to 9 Year Old | 13 (61.9%) | 8 (38.1%) |
| 10 to 14 Year Olds | 24 (70.6%) | 10 (29.4%) |
| 15 to 17 Year Olds | 6 (60.0%) | 4 (40.0%) |
| 18 to 19 Year Olds | 4 (100.0%) | 0 (0.0%) |
| 20 to 24 Year Olds | 0 (0.0%) | 0 (0.0%) |
| 25 to 34 Year Olds | 0 (0.0%) | 2 (100.0%) |
| 35 Years and over | 2 (100.0%) | 0 (0.0%) |
| Total | 56 (70.0%) | 24 (30.0%) |
Educational Attainment by Field of Study in Breda
Business (20 | 34.5%), bio, nature & agricultural (14 | 24.1%), science & technology (12 | 20.7%), arts & humanities (6 | 10.3%), and physical & health sciences (2 | 3.5%) are the most common fields of study among 58 individuals in Breda who have obtained a bachelor's degree or higher.
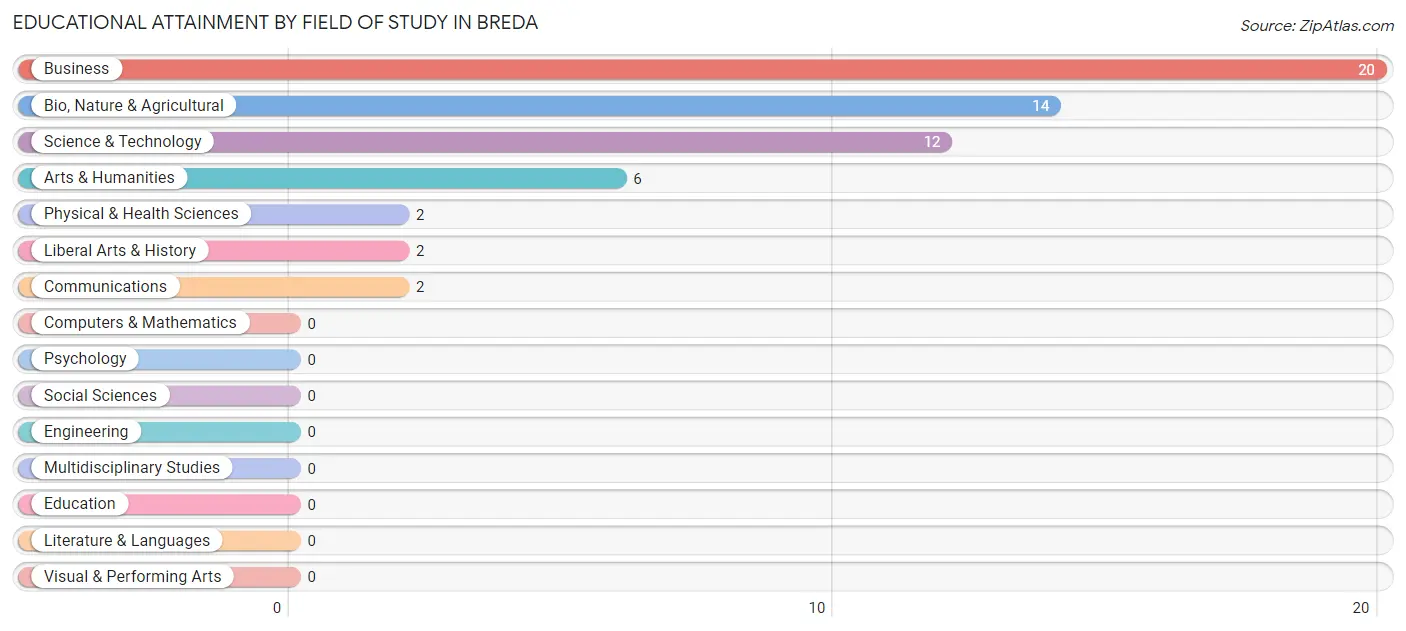
| Field of Study | # Graduates | % Graduates |
| Computers & Mathematics | 0 | 0.0% |
| Bio, Nature & Agricultural | 14 | 24.1% |
| Physical & Health Sciences | 2 | 3.5% |
| Psychology | 0 | 0.0% |
| Social Sciences | 0 | 0.0% |
| Engineering | 0 | 0.0% |
| Multidisciplinary Studies | 0 | 0.0% |
| Science & Technology | 12 | 20.7% |
| Business | 20 | 34.5% |
| Education | 0 | 0.0% |
| Literature & Languages | 0 | 0.0% |
| Liberal Arts & History | 2 | 3.5% |
| Visual & Performing Arts | 0 | 0.0% |
| Communications | 2 | 3.5% |
| Arts & Humanities | 6 | 10.3% |
| Total | 58 | 100.0% |
Transportation & Commute in Breda
Vehicle Availability by Sex in Breda
The most prevalent vehicle ownership categories in Breda are males with 3 vehicles (74, accounting for 48.0%) and females with 3 vehicles (63, making up 57.8%).
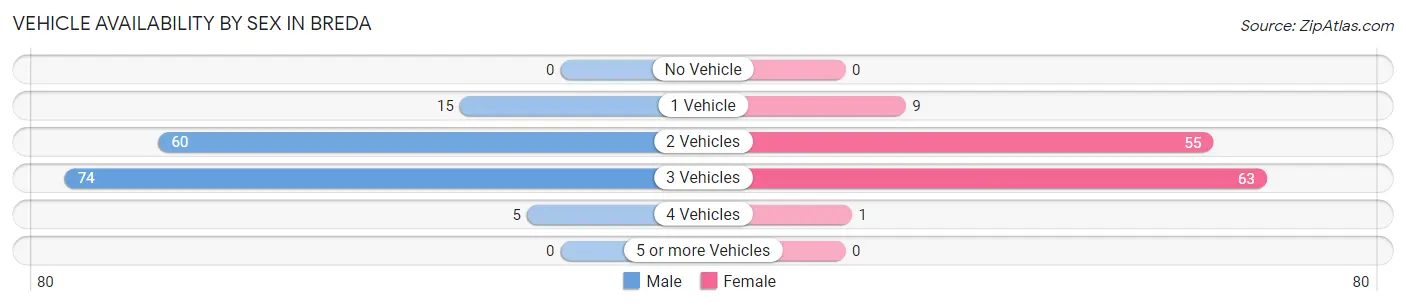
| Vehicles Available | Male | Female |
| No Vehicle | 0 (0.0%) | 0 (0.0%) |
| 1 Vehicle | 15 (9.7%) | 9 (7.0%) |
| 2 Vehicles | 60 (39.0%) | 55 (43.0%) |
| 3 Vehicles | 74 (48.0%) | 63 (49.2%) |
| 4 Vehicles | 5 (3.3%) | 1 (0.8%) |
| 5 or more Vehicles | 0 (0.0%) | 0 (0.0%) |
| Total | 154 (100.0%) | 128 (100.0%) |
Commute Time in Breda
The most frequently occuring commute durations in Breda are 20 to 24 minutes (69 commuters, 26.2%), 15 to 19 minutes (54 commuters, 20.5%), and less than 5 minutes (53 commuters, 20.2%).
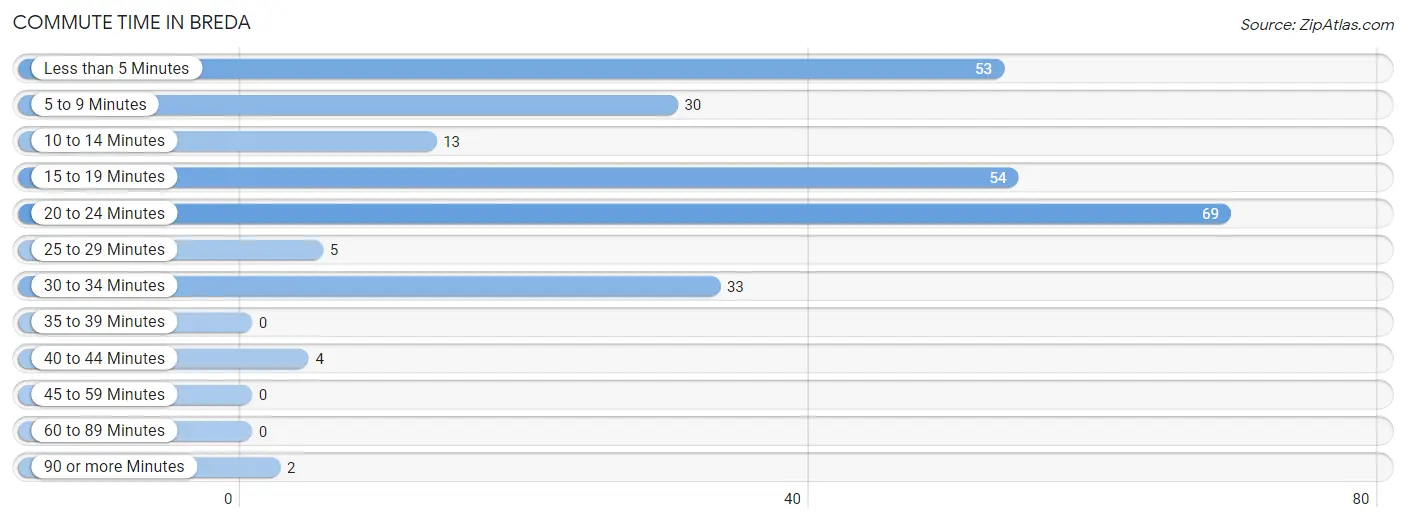
| Commute Time | # Commuters | % Commuters |
| Less than 5 Minutes | 53 | 20.2% |
| 5 to 9 Minutes | 30 | 11.4% |
| 10 to 14 Minutes | 13 | 4.9% |
| 15 to 19 Minutes | 54 | 20.5% |
| 20 to 24 Minutes | 69 | 26.2% |
| 25 to 29 Minutes | 5 | 1.9% |
| 30 to 34 Minutes | 33 | 12.6% |
| 35 to 39 Minutes | 0 | 0.0% |
| 40 to 44 Minutes | 4 | 1.5% |
| 45 to 59 Minutes | 0 | 0.0% |
| 60 to 89 Minutes | 0 | 0.0% |
| 90 or more Minutes | 2 | 0.8% |
Commute Time by Sex in Breda
The most common commute times in Breda are less than 5 minutes (39 commuters, 26.4%) for males and 20 to 24 minutes (40 commuters, 34.8%) for females.
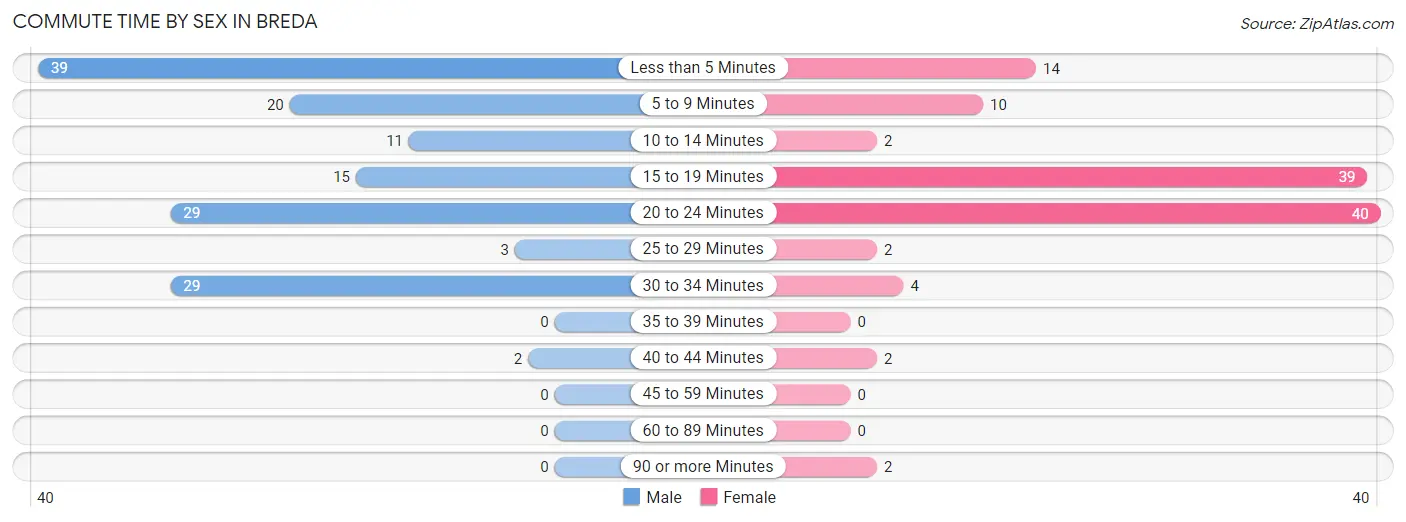
| Commute Time | Male | Female |
| Less than 5 Minutes | 39 (26.4%) | 14 (12.2%) |
| 5 to 9 Minutes | 20 (13.5%) | 10 (8.7%) |
| 10 to 14 Minutes | 11 (7.4%) | 2 (1.7%) |
| 15 to 19 Minutes | 15 (10.1%) | 39 (33.9%) |
| 20 to 24 Minutes | 29 (19.6%) | 40 (34.8%) |
| 25 to 29 Minutes | 3 (2.0%) | 2 (1.7%) |
| 30 to 34 Minutes | 29 (19.6%) | 4 (3.5%) |
| 35 to 39 Minutes | 0 (0.0%) | 0 (0.0%) |
| 40 to 44 Minutes | 2 (1.3%) | 2 (1.7%) |
| 45 to 59 Minutes | 0 (0.0%) | 0 (0.0%) |
| 60 to 89 Minutes | 0 (0.0%) | 0 (0.0%) |
| 90 or more Minutes | 0 (0.0%) | 2 (1.7%) |
Time of Departure to Work by Sex in Breda
The most frequent times of departure to work in Breda are 7:00 AM to 7:29 AM (46, 31.1%) for males and 7:00 AM to 7:29 AM (33, 28.7%) for females.
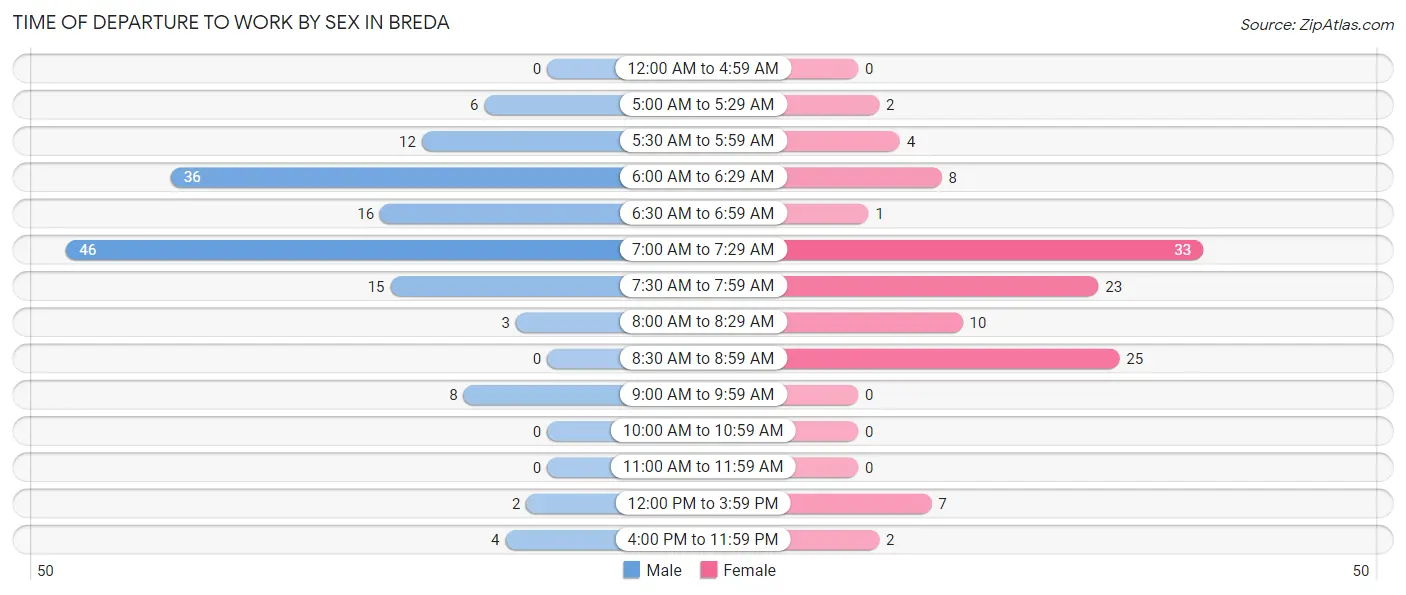
| Time of Departure | Male | Female |
| 12:00 AM to 4:59 AM | 0 (0.0%) | 0 (0.0%) |
| 5:00 AM to 5:29 AM | 6 (4.1%) | 2 (1.7%) |
| 5:30 AM to 5:59 AM | 12 (8.1%) | 4 (3.5%) |
| 6:00 AM to 6:29 AM | 36 (24.3%) | 8 (7.0%) |
| 6:30 AM to 6:59 AM | 16 (10.8%) | 1 (0.9%) |
| 7:00 AM to 7:29 AM | 46 (31.1%) | 33 (28.7%) |
| 7:30 AM to 7:59 AM | 15 (10.1%) | 23 (20.0%) |
| 8:00 AM to 8:29 AM | 3 (2.0%) | 10 (8.7%) |
| 8:30 AM to 8:59 AM | 0 (0.0%) | 25 (21.7%) |
| 9:00 AM to 9:59 AM | 8 (5.4%) | 0 (0.0%) |
| 10:00 AM to 10:59 AM | 0 (0.0%) | 0 (0.0%) |
| 11:00 AM to 11:59 AM | 0 (0.0%) | 0 (0.0%) |
| 12:00 PM to 3:59 PM | 2 (1.3%) | 7 (6.1%) |
| 4:00 PM to 11:59 PM | 4 (2.7%) | 2 (1.7%) |
| Total | 148 (100.0%) | 115 (100.0%) |
Housing Occupancy in Breda
Occupancy by Ownership in Breda
Of the total 206 dwellings in Breda, owner-occupied units account for 144 (69.9%), while renter-occupied units make up 62 (30.1%).
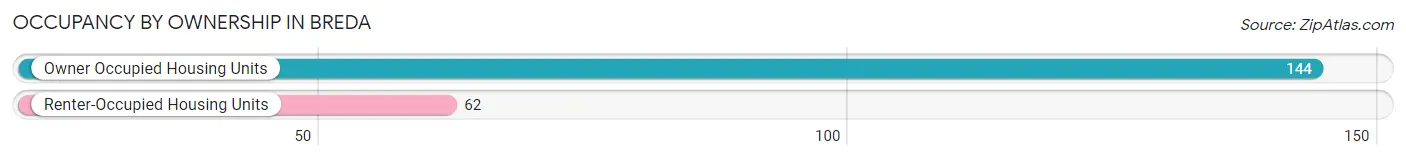
| Occupancy | # Housing Units | % Housing Units |
| Owner Occupied Housing Units | 144 | 69.9% |
| Renter-Occupied Housing Units | 62 | 30.1% |
| Total Occupied Housing Units | 206 | 100.0% |
Occupancy by Household Size in Breda
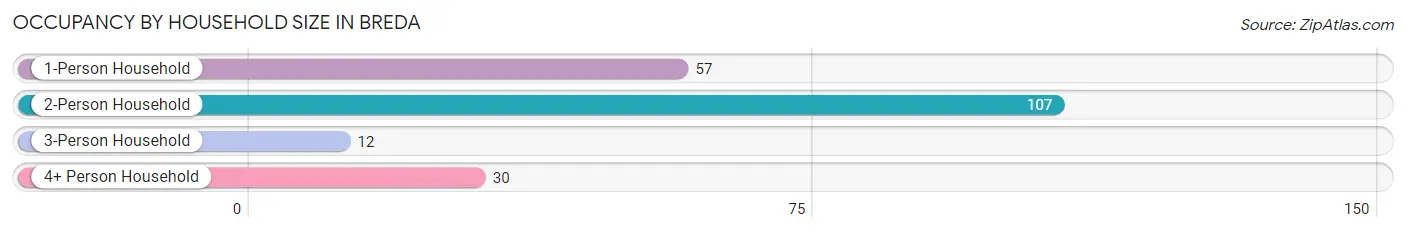
| Household Size | # Housing Units | % Housing Units |
| 1-Person Household | 57 | 27.7% |
| 2-Person Household | 107 | 51.9% |
| 3-Person Household | 12 | 5.8% |
| 4+ Person Household | 30 | 14.6% |
| Total Housing Units | 206 | 100.0% |
Occupancy by Ownership by Household Size in Breda
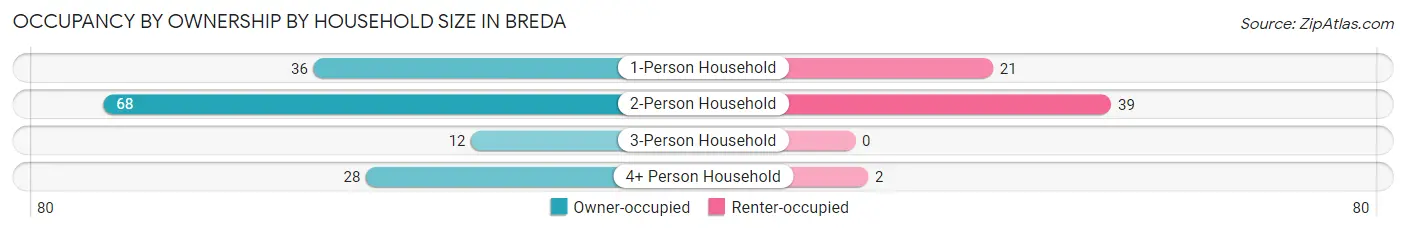
| Household Size | Owner-occupied | Renter-occupied |
| 1-Person Household | 36 (63.2%) | 21 (36.8%) |
| 2-Person Household | 68 (63.5%) | 39 (36.4%) |
| 3-Person Household | 12 (100.0%) | 0 (0.0%) |
| 4+ Person Household | 28 (93.3%) | 2 (6.7%) |
| Total Housing Units | 144 (69.9%) | 62 (30.1%) |
Occupancy by Educational Attainment in Breda
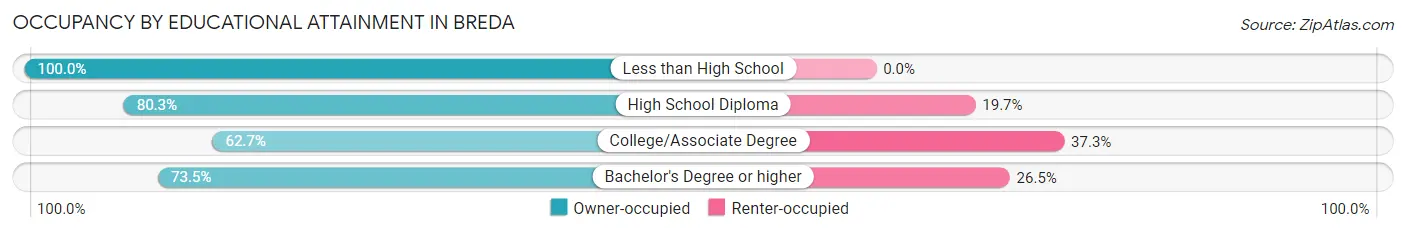
| Household Size | Owner-occupied | Renter-occupied |
| Less than High School | 1 (100.0%) | 0 (0.0%) |
| High School Diploma | 49 (80.3%) | 12 (19.7%) |
| College/Associate Degree | 69 (62.7%) | 41 (37.3%) |
| Bachelor's Degree or higher | 25 (73.5%) | 9 (26.5%) |
Occupancy by Age of Householder in Breda
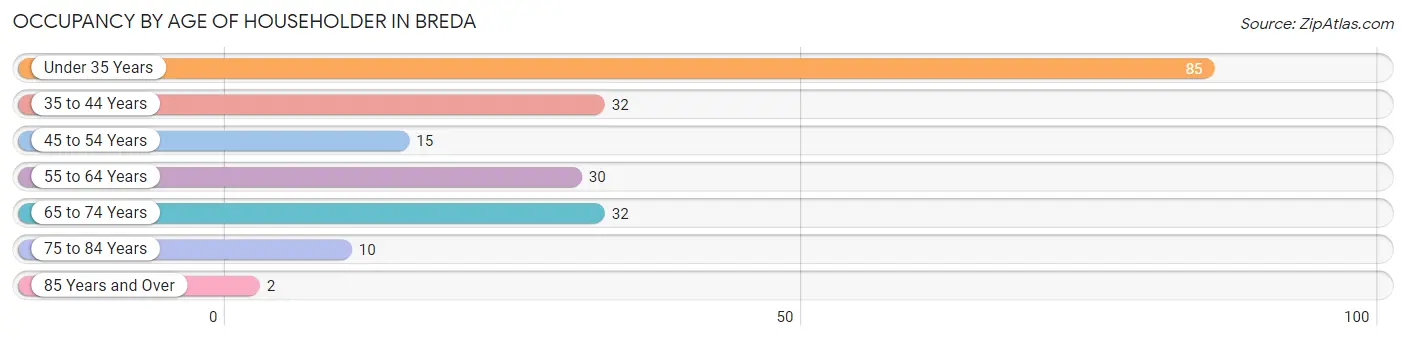
| Age Bracket | # Households | % Households |
| Under 35 Years | 85 | 41.3% |
| 35 to 44 Years | 32 | 15.5% |
| 45 to 54 Years | 15 | 7.3% |
| 55 to 64 Years | 30 | 14.6% |
| 65 to 74 Years | 32 | 15.5% |
| 75 to 84 Years | 10 | 4.9% |
| 85 Years and Over | 2 | 1.0% |
| Total | 206 | 100.0% |
Housing Finances in Breda
Median Income by Occupancy in Breda
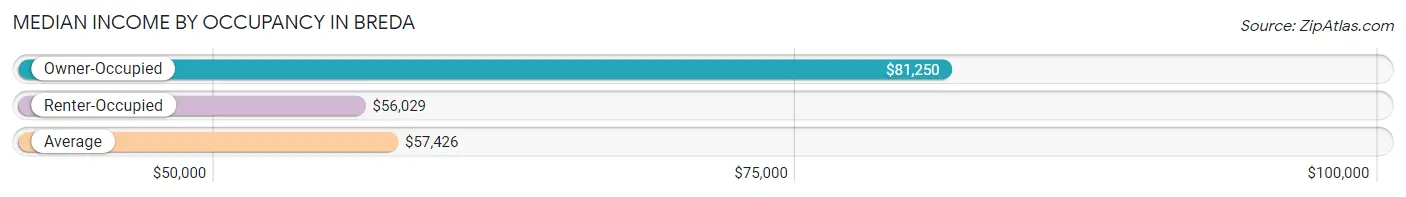
| Occupancy Type | # Households | Median Income |
| Owner-Occupied | 144 (69.9%) | $81,250 |
| Renter-Occupied | 62 (30.1%) | $56,029 |
| Average | 206 (100.0%) | $57,426 |
Occupancy by Householder Income Bracket in Breda
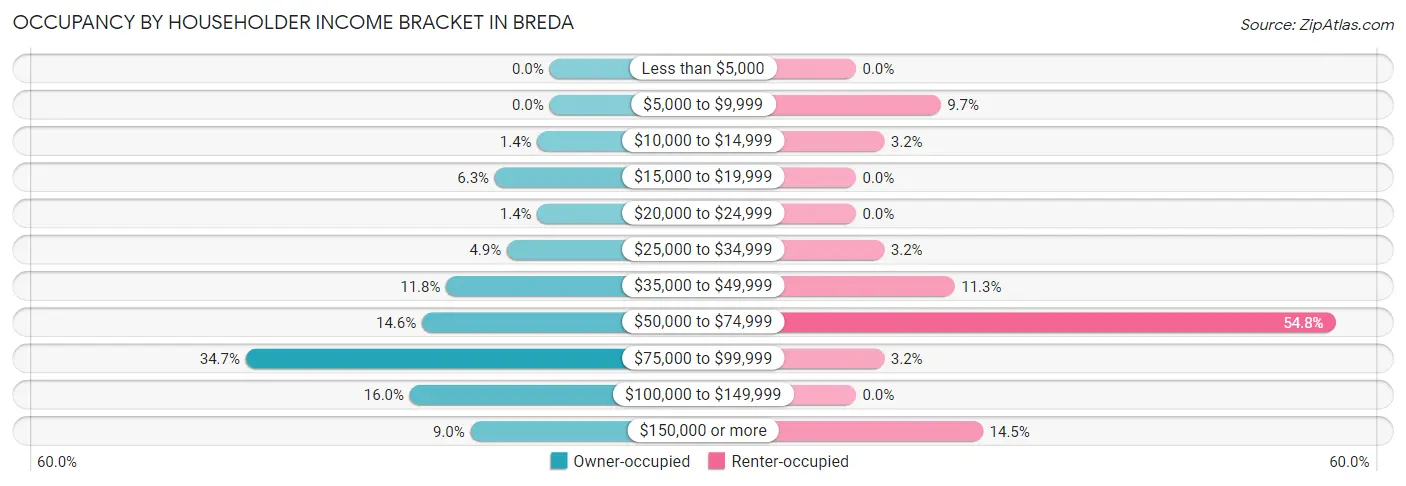
| Income Bracket | Owner-occupied | Renter-occupied |
| Less than $5,000 | 0 (0.0%) | 0 (0.0%) |
| $5,000 to $9,999 | 0 (0.0%) | 6 (9.7%) |
| $10,000 to $14,999 | 2 (1.4%) | 2 (3.2%) |
| $15,000 to $19,999 | 9 (6.2%) | 0 (0.0%) |
| $20,000 to $24,999 | 2 (1.4%) | 0 (0.0%) |
| $25,000 to $34,999 | 7 (4.9%) | 2 (3.2%) |
| $35,000 to $49,999 | 17 (11.8%) | 7 (11.3%) |
| $50,000 to $74,999 | 21 (14.6%) | 34 (54.8%) |
| $75,000 to $99,999 | 50 (34.7%) | 2 (3.2%) |
| $100,000 to $149,999 | 23 (16.0%) | 0 (0.0%) |
| $150,000 or more | 13 (9.0%) | 9 (14.5%) |
| Total | 144 (100.0%) | 62 (100.0%) |
Monthly Housing Cost Tiers in Breda
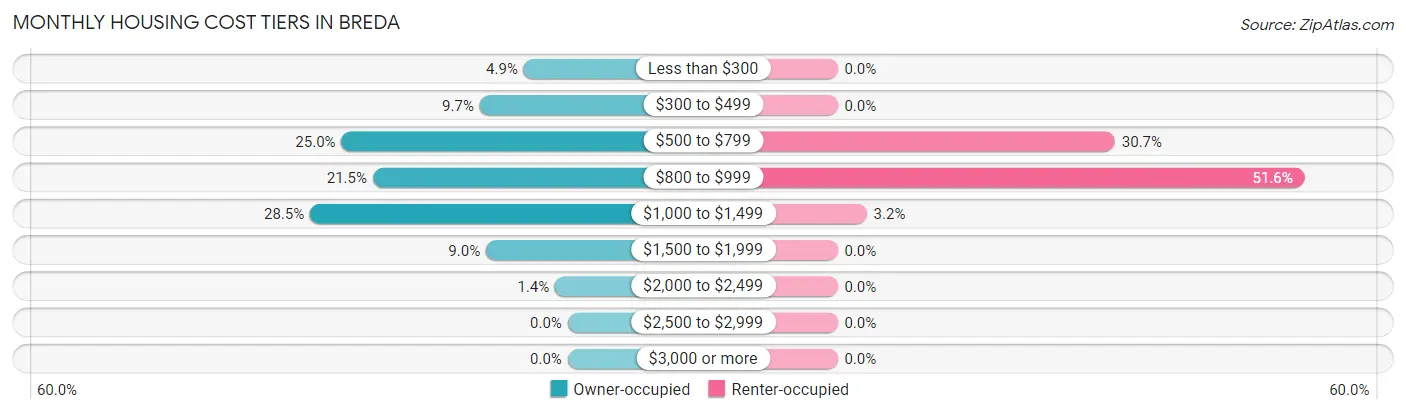
| Monthly Cost | Owner-occupied | Renter-occupied |
| Less than $300 | 7 (4.9%) | 0 (0.0%) |
| $300 to $499 | 14 (9.7%) | 0 (0.0%) |
| $500 to $799 | 36 (25.0%) | 19 (30.6%) |
| $800 to $999 | 31 (21.5%) | 32 (51.6%) |
| $1,000 to $1,499 | 41 (28.5%) | 2 (3.2%) |
| $1,500 to $1,999 | 13 (9.0%) | 0 (0.0%) |
| $2,000 to $2,499 | 2 (1.4%) | 0 (0.0%) |
| $2,500 to $2,999 | 0 (0.0%) | 0 (0.0%) |
| $3,000 or more | 0 (0.0%) | 0 (0.0%) |
| Total | 144 (100.0%) | 62 (100.0%) |
Physical Housing Characteristics in Breda
Housing Structures in Breda
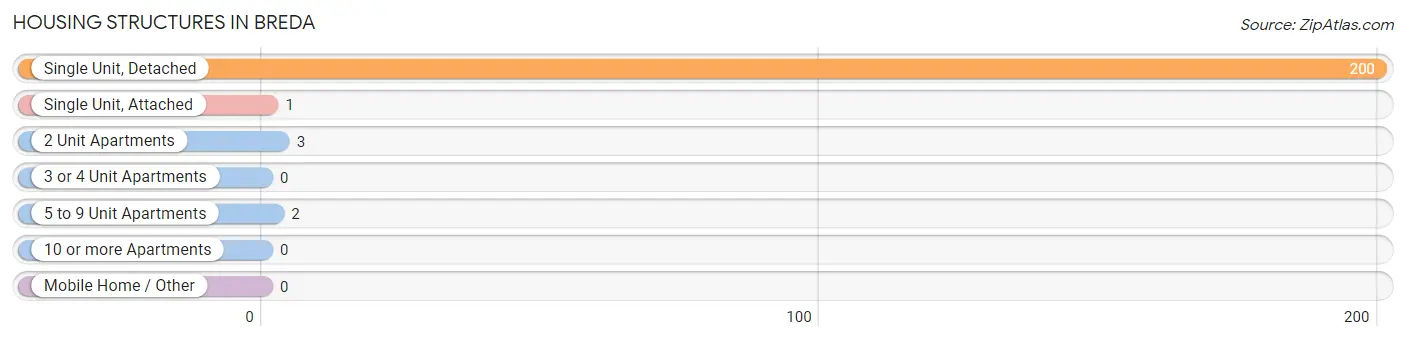
| Structure Type | # Housing Units | % Housing Units |
| Single Unit, Detached | 200 | 97.1% |
| Single Unit, Attached | 1 | 0.5% |
| 2 Unit Apartments | 3 | 1.5% |
| 3 or 4 Unit Apartments | 0 | 0.0% |
| 5 to 9 Unit Apartments | 2 | 1.0% |
| 10 or more Apartments | 0 | 0.0% |
| Mobile Home / Other | 0 | 0.0% |
| Total | 206 | 100.0% |
Housing Structures by Occupancy in Breda
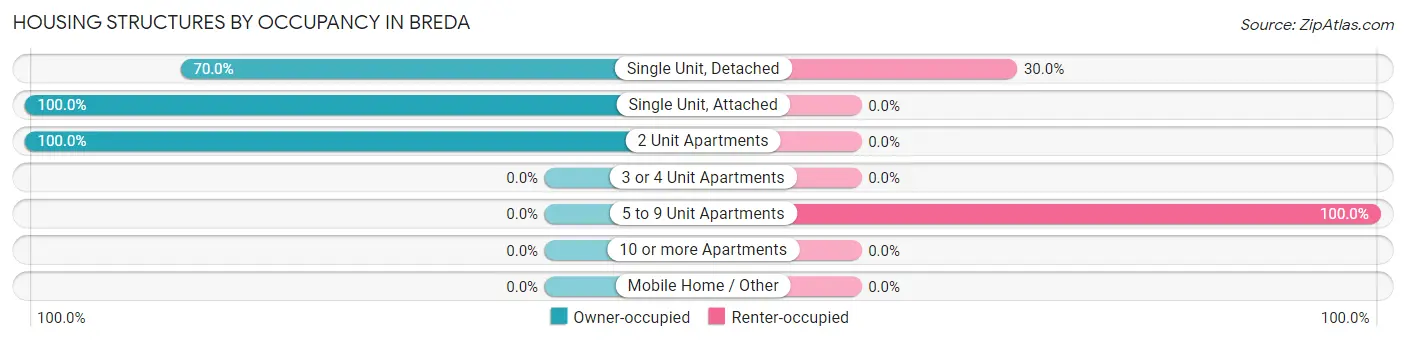
| Structure Type | Owner-occupied | Renter-occupied |
| Single Unit, Detached | 140 (70.0%) | 60 (30.0%) |
| Single Unit, Attached | 1 (100.0%) | 0 (0.0%) |
| 2 Unit Apartments | 3 (100.0%) | 0 (0.0%) |
| 3 or 4 Unit Apartments | 0 (0.0%) | 0 (0.0%) |
| 5 to 9 Unit Apartments | 0 (0.0%) | 2 (100.0%) |
| 10 or more Apartments | 0 (0.0%) | 0 (0.0%) |
| Mobile Home / Other | 0 (0.0%) | 0 (0.0%) |
| Total | 144 (69.9%) | 62 (30.1%) |
Housing Structures by Number of Rooms in Breda
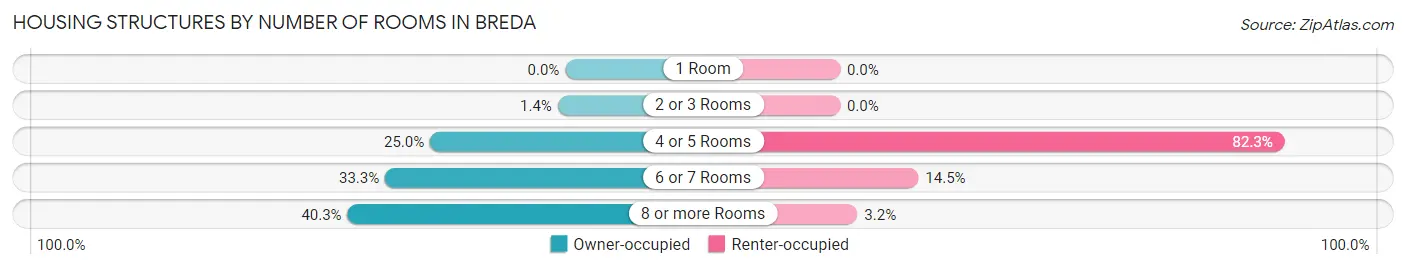
| Number of Rooms | Owner-occupied | Renter-occupied |
| 1 Room | 0 (0.0%) | 0 (0.0%) |
| 2 or 3 Rooms | 2 (1.4%) | 0 (0.0%) |
| 4 or 5 Rooms | 36 (25.0%) | 51 (82.3%) |
| 6 or 7 Rooms | 48 (33.3%) | 9 (14.5%) |
| 8 or more Rooms | 58 (40.3%) | 2 (3.2%) |
| Total | 144 (100.0%) | 62 (100.0%) |
Housing Structure by Heating Type in Breda
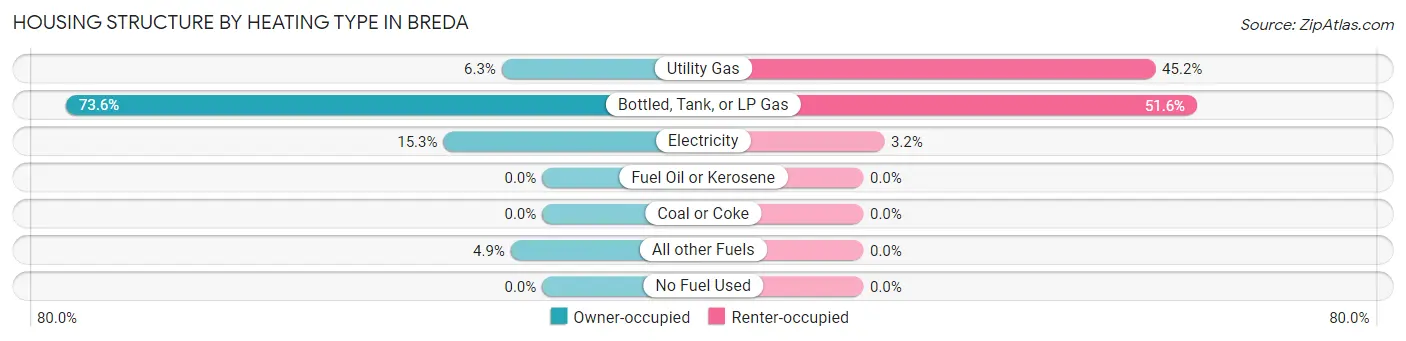
| Heating Type | Owner-occupied | Renter-occupied |
| Utility Gas | 9 (6.2%) | 28 (45.2%) |
| Bottled, Tank, or LP Gas | 106 (73.6%) | 32 (51.6%) |
| Electricity | 22 (15.3%) | 2 (3.2%) |
| Fuel Oil or Kerosene | 0 (0.0%) | 0 (0.0%) |
| Coal or Coke | 0 (0.0%) | 0 (0.0%) |
| All other Fuels | 7 (4.9%) | 0 (0.0%) |
| No Fuel Used | 0 (0.0%) | 0 (0.0%) |
| Total | 144 (100.0%) | 62 (100.0%) |
Household Vehicle Usage in Breda
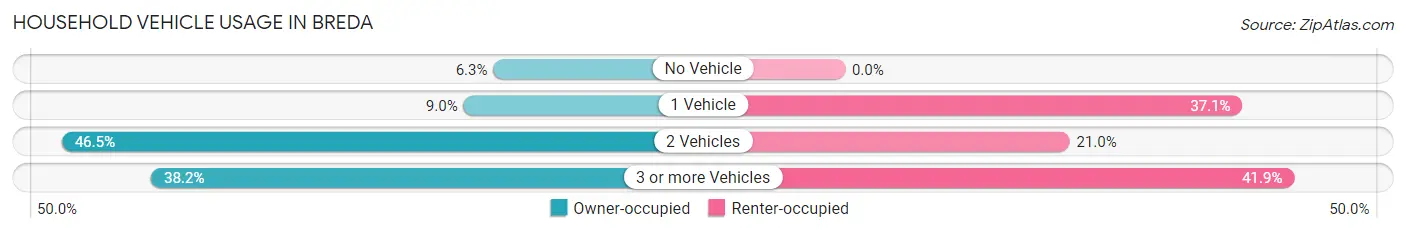
| Vehicles per Household | Owner-occupied | Renter-occupied |
| No Vehicle | 9 (6.2%) | 0 (0.0%) |
| 1 Vehicle | 13 (9.0%) | 23 (37.1%) |
| 2 Vehicles | 67 (46.5%) | 13 (21.0%) |
| 3 or more Vehicles | 55 (38.2%) | 26 (41.9%) |
| Total | 144 (100.0%) | 62 (100.0%) |
Real Estate & Mortgages in Breda
Real Estate and Mortgage Overview in Breda
| Characteristic | Without Mortgage | With Mortgage |
| Housing Units | 66 | 78 |
| Median Property Value | $205,000 | $121,200 |
| Median Household Income | $76,250 | $9 |
| Monthly Housing Costs | $633 | $0 |
| Real Estate Taxes | $1,818 | $0 |
Property Value by Mortgage Status in Breda
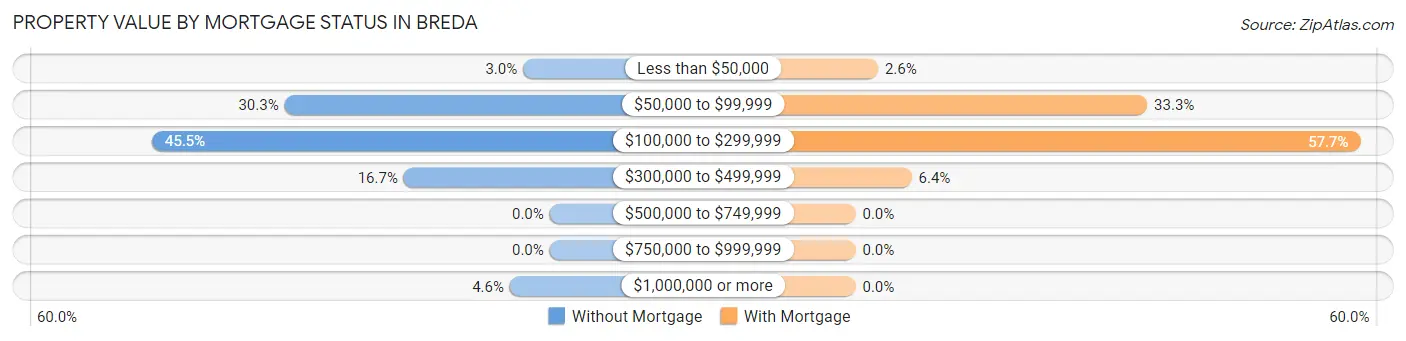
| Property Value | Without Mortgage | With Mortgage |
| Less than $50,000 | 2 (3.0%) | 2 (2.6%) |
| $50,000 to $99,999 | 20 (30.3%) | 26 (33.3%) |
| $100,000 to $299,999 | 30 (45.5%) | 45 (57.7%) |
| $300,000 to $499,999 | 11 (16.7%) | 5 (6.4%) |
| $500,000 to $749,999 | 0 (0.0%) | 0 (0.0%) |
| $750,000 to $999,999 | 0 (0.0%) | 0 (0.0%) |
| $1,000,000 or more | 3 (4.5%) | 0 (0.0%) |
| Total | 66 (100.0%) | 78 (100.0%) |
Household Income by Mortgage Status in Breda
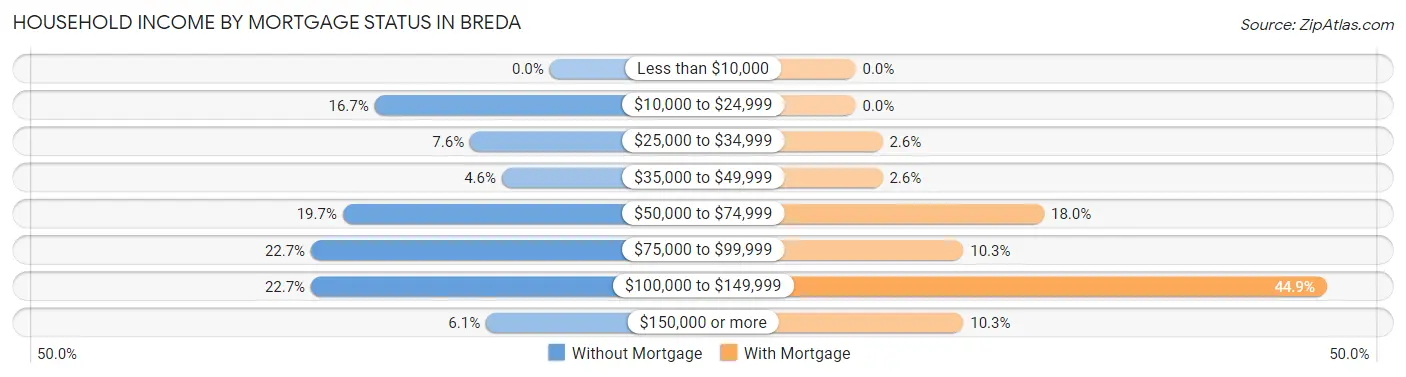
| Household Income | Without Mortgage | With Mortgage |
| Less than $10,000 | 0 (0.0%) | 0 (0.0%) |
| $10,000 to $24,999 | 11 (16.7%) | 0 (0.0%) |
| $25,000 to $34,999 | 5 (7.6%) | 2 (2.6%) |
| $35,000 to $49,999 | 3 (4.5%) | 2 (2.6%) |
| $50,000 to $74,999 | 13 (19.7%) | 14 (17.9%) |
| $75,000 to $99,999 | 15 (22.7%) | 8 (10.3%) |
| $100,000 to $149,999 | 15 (22.7%) | 35 (44.9%) |
| $150,000 or more | 4 (6.1%) | 8 (10.3%) |
| Total | 66 (100.0%) | 78 (100.0%) |
Property Value to Household Income Ratio in Breda
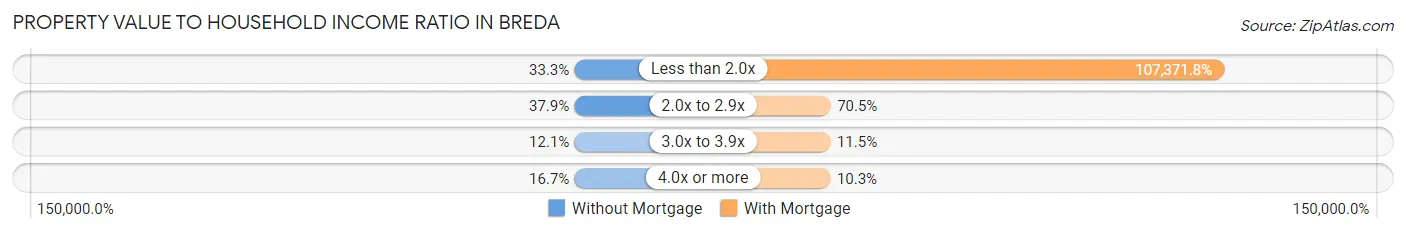
| Value-to-Income Ratio | Without Mortgage | With Mortgage |
| Less than 2.0x | 22 (33.3%) | 83,750 (107,371.8%) |
| 2.0x to 2.9x | 25 (37.9%) | 55 (70.5%) |
| 3.0x to 3.9x | 8 (12.1%) | 9 (11.5%) |
| 4.0x or more | 11 (16.7%) | 8 (10.3%) |
| Total | 66 (100.0%) | 78 (100.0%) |
Real Estate Taxes by Mortgage Status in Breda
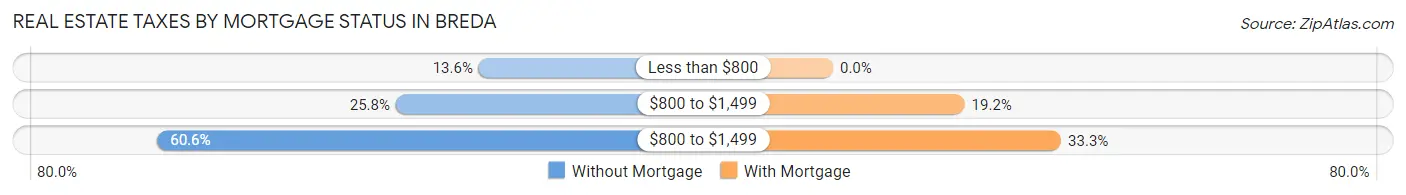
| Property Taxes | Without Mortgage | With Mortgage |
| Less than $800 | 9 (13.6%) | 0 (0.0%) |
| $800 to $1,499 | 17 (25.8%) | 15 (19.2%) |
| $800 to $1,499 | 40 (60.6%) | 26 (33.3%) |
| Total | 66 (100.0%) | 78 (100.0%) |
Health & Disability in Breda
Health Insurance Coverage by Age in Breda
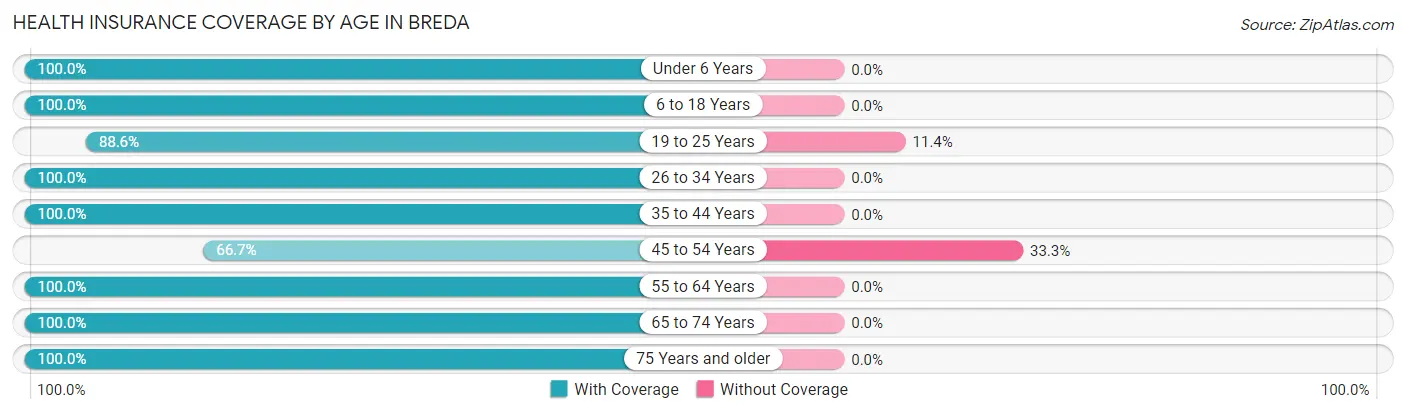
| Age Bracket | With Coverage | Without Coverage |
| Under 6 Years | 26 (100.0%) | 0 (0.0%) |
| 6 to 18 Years | 62 (100.0%) | 0 (0.0%) |
| 19 to 25 Years | 62 (88.6%) | 8 (11.4%) |
| 26 to 34 Years | 73 (100.0%) | 0 (0.0%) |
| 35 to 44 Years | 51 (100.0%) | 0 (0.0%) |
| 45 to 54 Years | 16 (66.7%) | 8 (33.3%) |
| 55 to 64 Years | 65 (100.0%) | 0 (0.0%) |
| 65 to 74 Years | 43 (100.0%) | 0 (0.0%) |
| 75 Years and older | 25 (100.0%) | 0 (0.0%) |
| Total | 423 (96.4%) | 16 (3.6%) |
Health Insurance Coverage by Citizenship Status in Breda
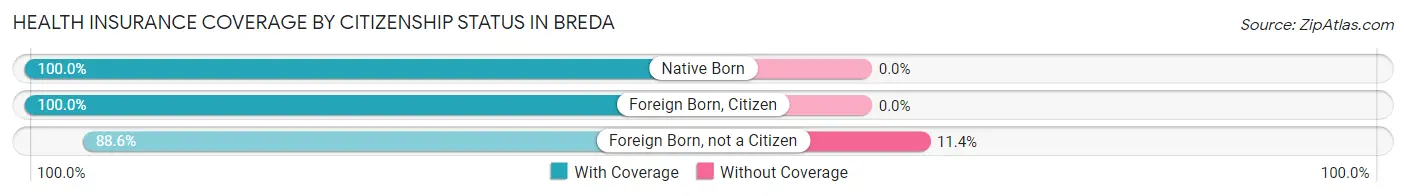
| Citizenship Status | With Coverage | Without Coverage |
| Native Born | 26 (100.0%) | 0 (0.0%) |
| Foreign Born, Citizen | 62 (100.0%) | 0 (0.0%) |
| Foreign Born, not a Citizen | 62 (88.6%) | 8 (11.4%) |
Health Insurance Coverage by Household Income in Breda
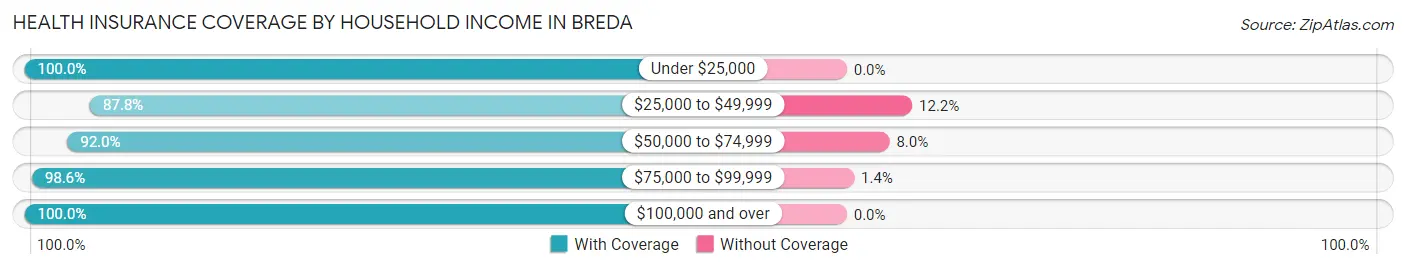
| Household Income | With Coverage | Without Coverage |
| Under $25,000 | 30 (100.0%) | 0 (0.0%) |
| $25,000 to $49,999 | 43 (87.8%) | 6 (12.2%) |
| $50,000 to $74,999 | 92 (92.0%) | 8 (8.0%) |
| $75,000 to $99,999 | 144 (98.6%) | 2 (1.4%) |
| $100,000 and over | 114 (100.0%) | 0 (0.0%) |
Public vs Private Health Insurance Coverage by Age in Breda
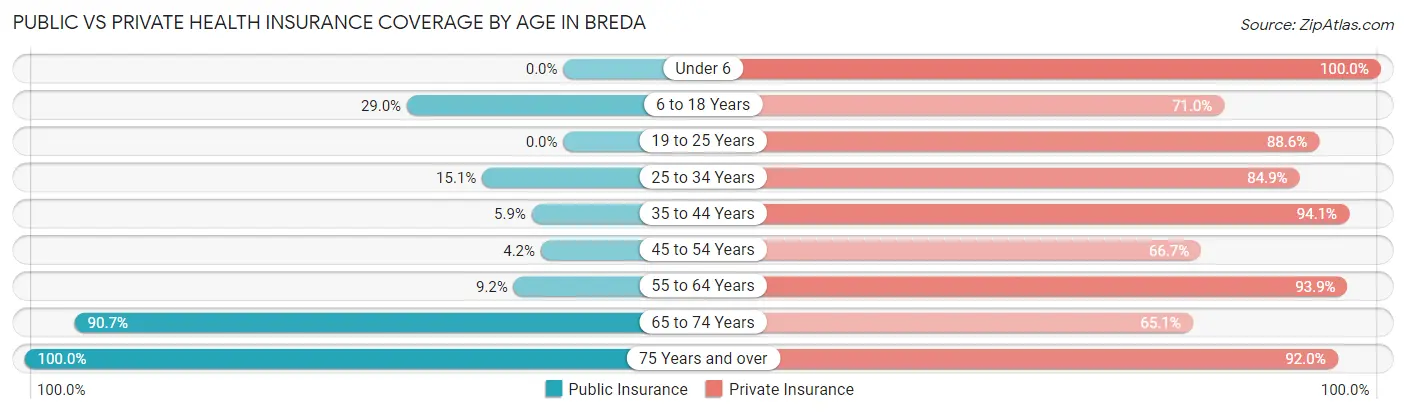
| Age Bracket | Public Insurance | Private Insurance |
| Under 6 | 0 (0.0%) | 26 (100.0%) |
| 6 to 18 Years | 18 (29.0%) | 44 (71.0%) |
| 19 to 25 Years | 0 (0.0%) | 62 (88.6%) |
| 25 to 34 Years | 11 (15.1%) | 62 (84.9%) |
| 35 to 44 Years | 3 (5.9%) | 48 (94.1%) |
| 45 to 54 Years | 1 (4.2%) | 16 (66.7%) |
| 55 to 64 Years | 6 (9.2%) | 61 (93.9%) |
| 65 to 74 Years | 39 (90.7%) | 28 (65.1%) |
| 75 Years and over | 25 (100.0%) | 23 (92.0%) |
| Total | 103 (23.5%) | 370 (84.3%) |
Disability Status by Sex by Age in Breda
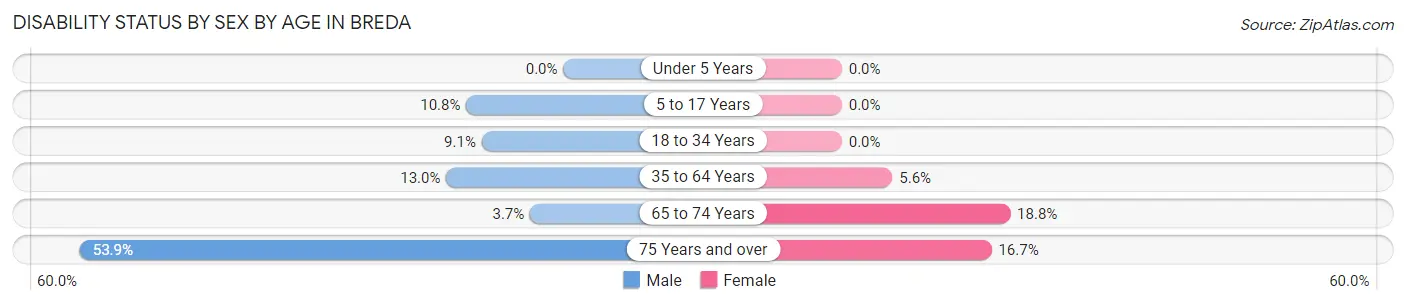
| Age Bracket | Male | Female |
| Under 5 Years | 0 (0.0%) | 0 (0.0%) |
| 5 to 17 Years | 4 (10.8%) | 0 (0.0%) |
| 18 to 34 Years | 8 (9.1%) | 0 (0.0%) |
| 35 to 64 Years | 9 (13.0%) | 4 (5.6%) |
| 65 to 74 Years | 1 (3.7%) | 3 (18.8%) |
| 75 Years and over | 7 (53.8%) | 2 (16.7%) |
Disability Class by Sex by Age in Breda
Disability Class: Hearing Difficulty
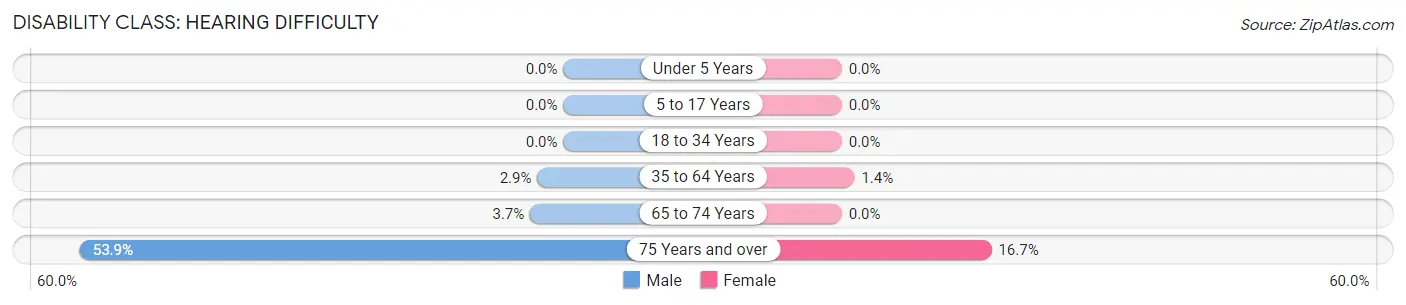
| Age Bracket | Male | Female |
| Under 5 Years | 0 (0.0%) | 0 (0.0%) |
| 5 to 17 Years | 0 (0.0%) | 0 (0.0%) |
| 18 to 34 Years | 0 (0.0%) | 0 (0.0%) |
| 35 to 64 Years | 2 (2.9%) | 1 (1.4%) |
| 65 to 74 Years | 1 (3.7%) | 0 (0.0%) |
| 75 Years and over | 7 (53.8%) | 2 (16.7%) |
Disability Class: Vision Difficulty
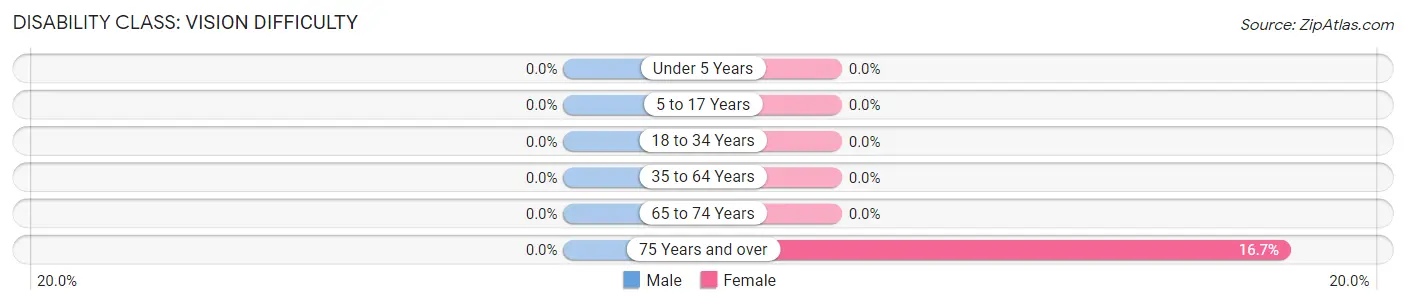
| Age Bracket | Male | Female |
| Under 5 Years | 0 (0.0%) | 0 (0.0%) |
| 5 to 17 Years | 0 (0.0%) | 0 (0.0%) |
| 18 to 34 Years | 0 (0.0%) | 0 (0.0%) |
| 35 to 64 Years | 0 (0.0%) | 0 (0.0%) |
| 65 to 74 Years | 0 (0.0%) | 0 (0.0%) |
| 75 Years and over | 0 (0.0%) | 2 (16.7%) |
Disability Class: Cognitive Difficulty
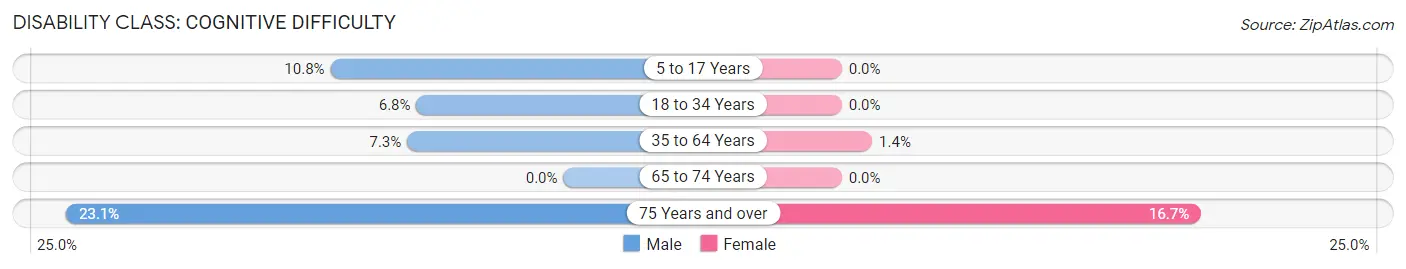
| Age Bracket | Male | Female |
| 5 to 17 Years | 4 (10.8%) | 0 (0.0%) |
| 18 to 34 Years | 6 (6.8%) | 0 (0.0%) |
| 35 to 64 Years | 5 (7.2%) | 1 (1.4%) |
| 65 to 74 Years | 0 (0.0%) | 0 (0.0%) |
| 75 Years and over | 3 (23.1%) | 2 (16.7%) |
Disability Class: Ambulatory Difficulty
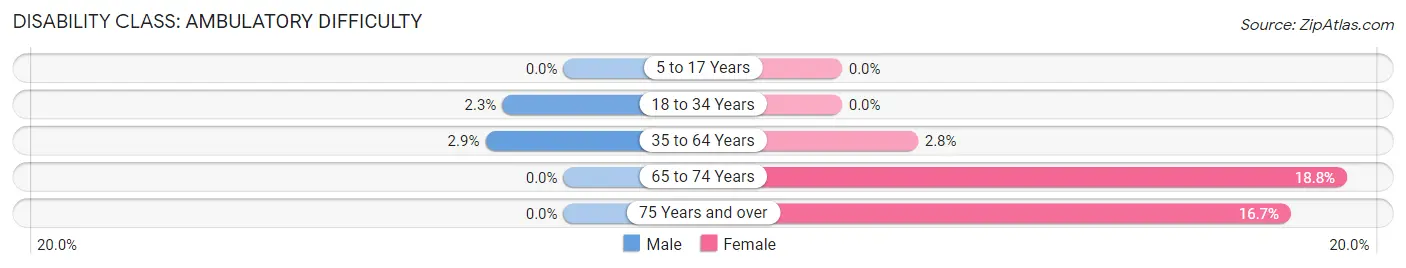
| Age Bracket | Male | Female |
| 5 to 17 Years | 0 (0.0%) | 0 (0.0%) |
| 18 to 34 Years | 2 (2.3%) | 0 (0.0%) |
| 35 to 64 Years | 2 (2.9%) | 2 (2.8%) |
| 65 to 74 Years | 0 (0.0%) | 3 (18.8%) |
| 75 Years and over | 0 (0.0%) | 2 (16.7%) |
Disability Class: Self-Care Difficulty
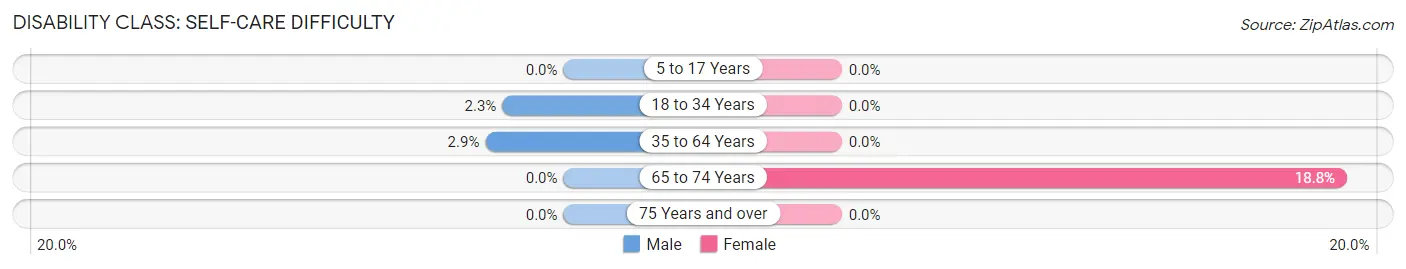
| Age Bracket | Male | Female |
| 5 to 17 Years | 0 (0.0%) | 0 (0.0%) |
| 18 to 34 Years | 2 (2.3%) | 0 (0.0%) |
| 35 to 64 Years | 2 (2.9%) | 0 (0.0%) |
| 65 to 74 Years | 0 (0.0%) | 3 (18.8%) |
| 75 Years and over | 0 (0.0%) | 0 (0.0%) |
Technology Access in Breda
Computing Device Access in Breda
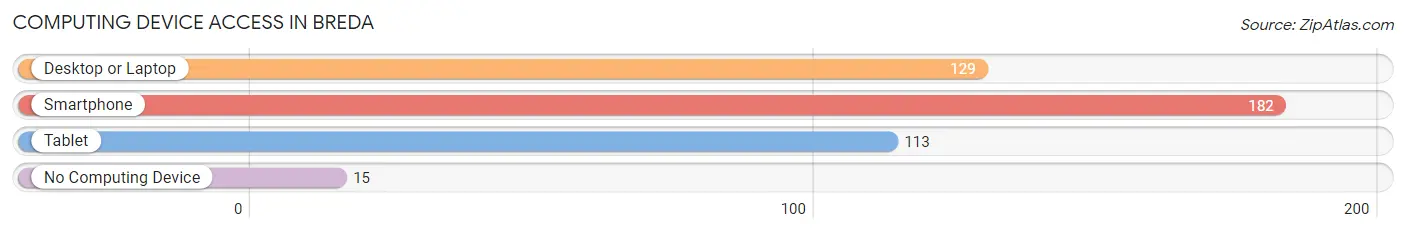
| Device Type | # Households | % Households |
| Desktop or Laptop | 129 | 62.6% |
| Smartphone | 182 | 88.3% |
| Tablet | 113 | 54.8% |
| No Computing Device | 15 | 7.3% |
| Total | 206 | 100.0% |
Internet Access in Breda
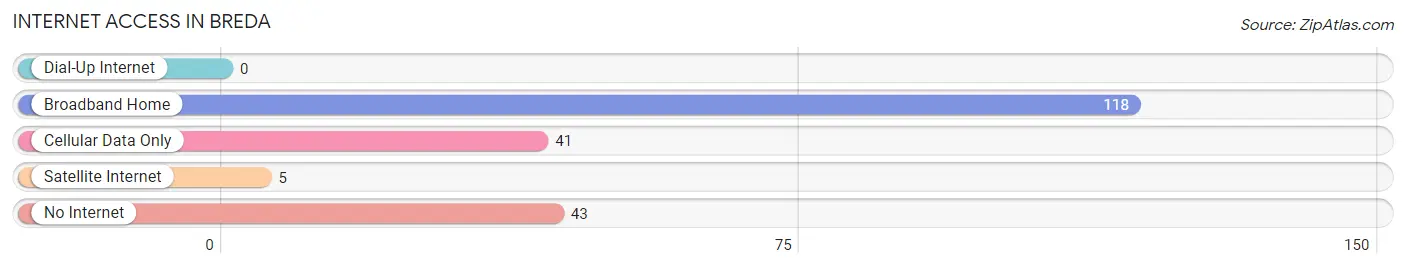
| Internet Type | # Households | % Households |
| Dial-Up Internet | 0 | 0.0% |
| Broadband Home | 118 | 57.3% |
| Cellular Data Only | 41 | 19.9% |
| Satellite Internet | 5 | 2.4% |
| No Internet | 43 | 20.9% |
| Total | 206 | 100.0% |
Breda Summary
Breda is a small city located in Carroll County, Iowa, United States. It is situated in the northwest corner of the state, approximately 30 miles east of the Missouri border. The population of Breda was 1,072 at the 2010 census.
Geography
Breda is located at 42°14'25" North, 94°45'45" West (42.240278, -94.7625). According to the United States Census Bureau, the city has a total area of 0.9 square miles (2.3 km2), all of it land.
History
Breda was founded in 1881 by Dutch immigrants who had come to the area to farm. The city was named after the Dutch city of Breda, which is located in the province of North Brabant. The first settlers in the area were the families of John and Peter Van Peursem, who arrived in 1881. The Van Peursems were followed by other Dutch families, including the Van Houtens, Van Dyks, and Van Oostrums.
The first post office in Breda was established in 1883, and the city was incorporated in 1887. The first school was built in 1891, and the first church was built in 1895.
Economy
The economy of Breda is largely based on agriculture. The city is home to several large farms, including the Van Peursem Farms, which is one of the largest in the area. Other major employers in the city include the Breda Co-op, which is a grain elevator and feed mill, and the Breda Lumber Company.
Demographics
As of the census of 2010, there were 1,072 people, 431 households, and 287 families residing in the city. The population density was 1,179.2 people per square mile (455.3/km2). There were 463 housing units at an average density of 511.2 per square mile (197.3/km2). The racial makeup of the city was 98.2% White, 0.2% African American, 0.2% Native American, 0.2% Asian, 0.2% from other races, and 0.9% from two or more races. Hispanic or Latino of any race were 1.2% of the population.
There were 431 households, out of which 30.2% had children under the age of 18 living with them, 54.2% were married couples living together, 8.4% had a female householder with no husband present, and 33.2% were non-families. 29.2% of all households were made up of individuals, and 15.2% had someone living alone who was 65 years of age or older. The average household size was 2.48 and the average family size was 3.08.
In the city, the population was spread out, with 25.7% under the age of 18, 7.2% from 18 to 24, 25.2% from 25 to 44, 24.2% from 45 to 64, and 17.7% who were 65 years of age or older. The median age was 39 years. For every 100 females, there were 97.2 males. For every 100 females age 18 and over, there were 94.2 males.
The median income for a household in the city was $37,500, and the median income for a family was $45,000. Males had a median income of $30,000 versus $21,250 for females. The per capita income for the city was $17,845. About 5.2% of families and 7.2% of the population were below the poverty line, including 8.2% of those under age 18 and 8.2% of those age 65 or over.
Common Questions
What is Per Capita Income in Breda?
Per Capita income in Breda is $41,241.
What is the Median Family Income in Breda?
Median Family Income in Breda is $86,875.
What is the Median Household income in Breda?
Median Household Income in Breda is $57,426.
What is Income or Wage Gap in Breda?
Income or Wage Gap in Breda is 33.8%.
Women in Breda earn 66.2 cents for every dollar earned by a man.
What is Inequality or Gini Index in Breda?
Inequality or Gini Index in Breda is 0.41.
What is the Total Population of Breda?
Total Population of Breda is 439.
What is the Total Male Population of Breda?
Total Male Population of Breda is 241.
What is the Total Female Population of Breda?
Total Female Population of Breda is 198.
What is the Ratio of Males per 100 Females in Breda?
There are 121.72 Males per 100 Females in Breda.
What is the Ratio of Females per 100 Males in Breda?
There are 82.16 Females per 100 Males in Breda.
What is the Median Population Age in Breda?
Median Population Age in Breda is 34.3 Years.
What is the Average Family Size in Breda
Average Family Size in Breda is 2.6 People.
What is the Average Household Size in Breda
Average Household Size in Breda is 2.1 People.
How Large is the Labor Force in Breda?
There are 290 People in the Labor Forcein in Breda.
What is the Percentage of People in the Labor Force in Breda?
80.8% of People are in the Labor Force in Breda.
What is the Unemployment Rate in Breda?
Unemployment Rate in Breda is 2.8%.