Ferguson, IA Map & Demographics
Ferguson Map
Ferguson Overview
$22,757
PER CAPITA INCOME
$51,667
AVG FAMILY INCOME
$46,250
AVG HOUSEHOLD INCOME
0.32
INEQUALITY / GINI INDEX
102
TOTAL POPULATION
43
MALE POPULATION
59
FEMALE POPULATION
72.88
MALES / 100 FEMALES
137.21
FEMALES / 100 MALES
56.5
MEDIAN AGE
2.5
AVG FAMILY SIZE
2.0
AVG HOUSEHOLD SIZE
28
LABOR FORCE [ PEOPLE ]
31.1%
PERCENT IN LABOR FORCE
32.1%
UNEMPLOYMENT RATE
Ferguson Zip Codes
Ferguson Area Codes
Income in Ferguson
Income Overview in Ferguson
Per Capita Income in Ferguson is $22,757, while median incomes of families and households are $51,667 and $46,250 respectively.
| Characteristic | Number | Measure |
| Per Capita Income | 102 | $22,757 |
| Median Family Income | 26 | $51,667 |
| Mean Family Income | 26 | $50,000 |
| Median Household Income | 50 | $46,250 |
| Mean Household Income | 50 | $46,540 |
| Income Deficit | 26 | $0 |
| Wage / Income Gap (%) | 102 | 0.00% |
| Wage / Income Gap ($) | 102 | 100.00¢ per $1 |
| Gini / Inequality Index | 102 | 0.32 |
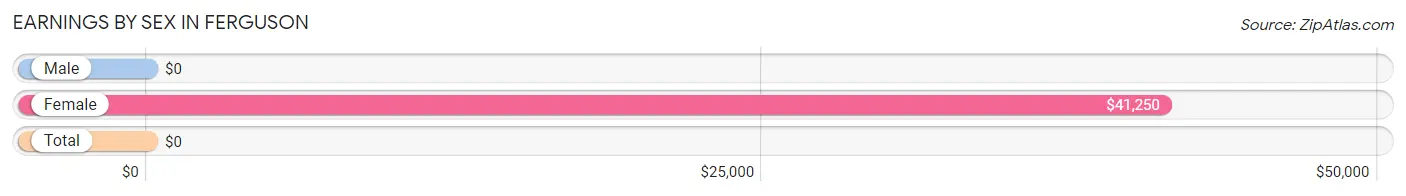
Earnings by Sex in Ferguson
| Sex | Number | Average Earnings |
| Male | 18 (56.2%) | $0 |
| Female | 14 (43.8%) | $41,250 |
| Total | 32 (100.0%) | $0 |
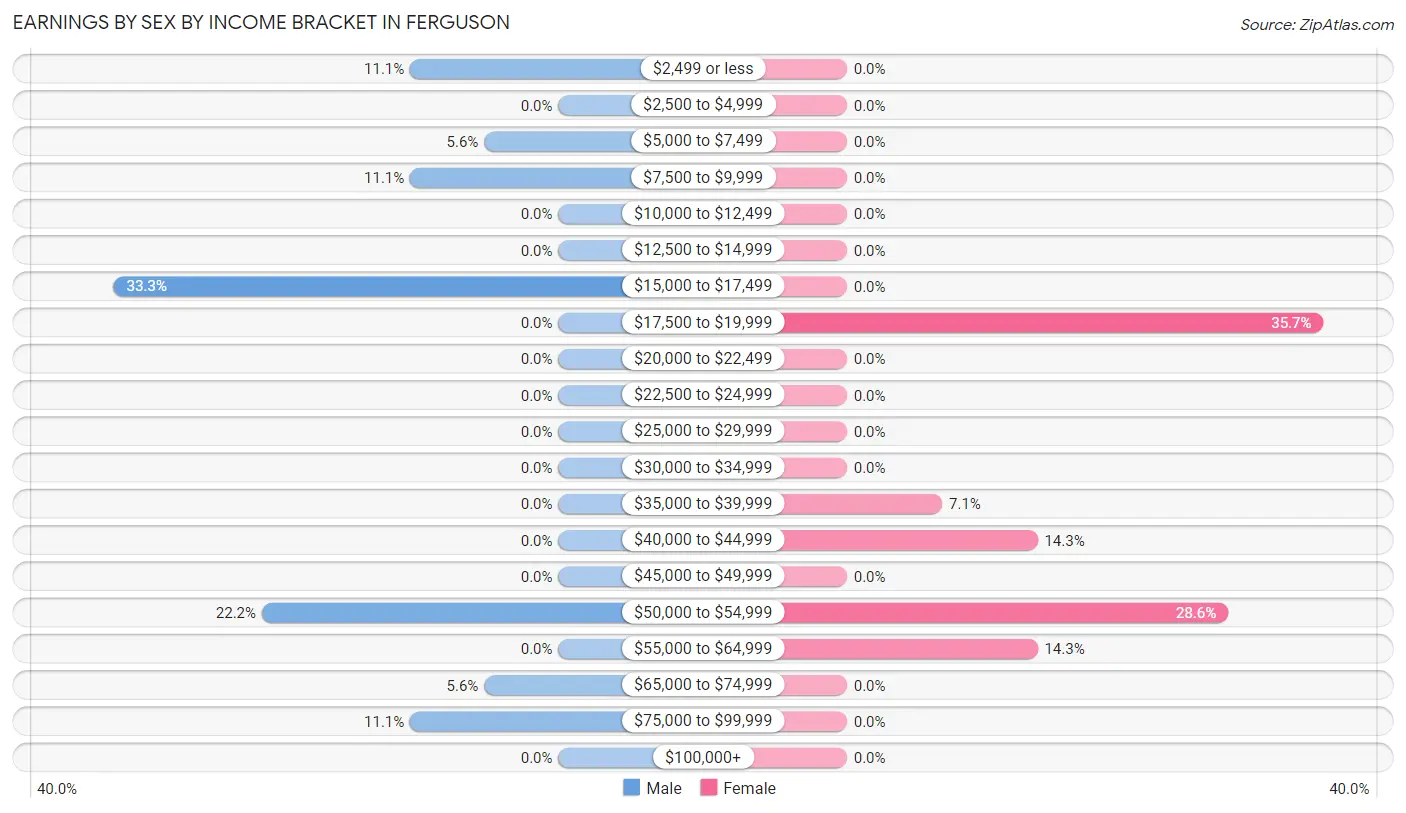
Earnings by Sex by Income Bracket in Ferguson
The most common earnings brackets in Ferguson are $15,000 to $17,499 for men (6 | 33.3%) and $17,500 to $19,999 for women (5 | 35.7%).
| Income | Male | Female |
| $2,499 or less | 2 (11.1%) | 0 (0.0%) |
| $2,500 to $4,999 | 0 (0.0%) | 0 (0.0%) |
| $5,000 to $7,499 | 1 (5.6%) | 0 (0.0%) |
| $7,500 to $9,999 | 2 (11.1%) | 0 (0.0%) |
| $10,000 to $12,499 | 0 (0.0%) | 0 (0.0%) |
| $12,500 to $14,999 | 0 (0.0%) | 0 (0.0%) |
| $15,000 to $17,499 | 6 (33.3%) | 0 (0.0%) |
| $17,500 to $19,999 | 0 (0.0%) | 5 (35.7%) |
| $20,000 to $22,499 | 0 (0.0%) | 0 (0.0%) |
| $22,500 to $24,999 | 0 (0.0%) | 0 (0.0%) |
| $25,000 to $29,999 | 0 (0.0%) | 0 (0.0%) |
| $30,000 to $34,999 | 0 (0.0%) | 0 (0.0%) |
| $35,000 to $39,999 | 0 (0.0%) | 1 (7.1%) |
| $40,000 to $44,999 | 0 (0.0%) | 2 (14.3%) |
| $45,000 to $49,999 | 0 (0.0%) | 0 (0.0%) |
| $50,000 to $54,999 | 4 (22.2%) | 4 (28.6%) |
| $55,000 to $64,999 | 0 (0.0%) | 2 (14.3%) |
| $65,000 to $74,999 | 1 (5.6%) | 0 (0.0%) |
| $75,000 to $99,999 | 2 (11.1%) | 0 (0.0%) |
| $100,000+ | 0 (0.0%) | 0 (0.0%) |
| Total | 18 (100.0%) | 14 (100.0%) |
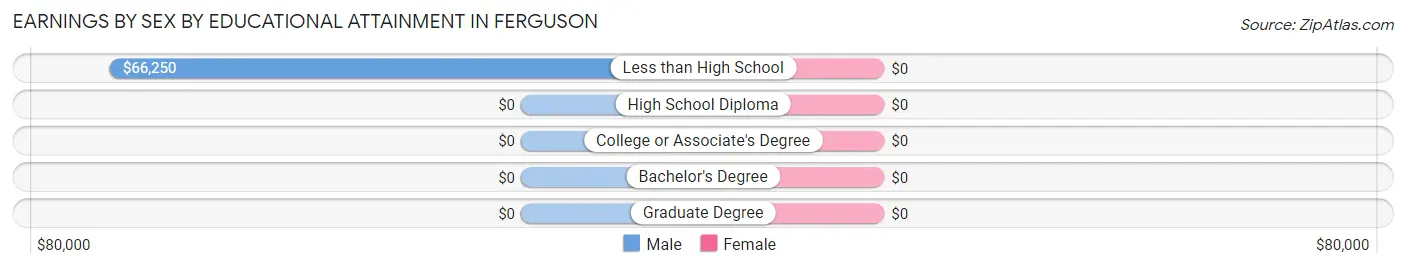
Earnings by Sex by Educational Attainment in Ferguson
| Educational Attainment | Male Income | Female Income |
| Less than High School | $66,250 | $0 |
| High School Diploma | - | - |
| College or Associate's Degree | - | - |
| Bachelor's Degree | - | - |
| Graduate Degree | - | - |
| Total | - | - |
Family Income in Ferguson
Family Income Brackets in Ferguson
According to the Ferguson family income data, there are 11 families falling into the $50,000 to $74,999 income range, which is the most common income bracket and makes up 42.3% of all families.
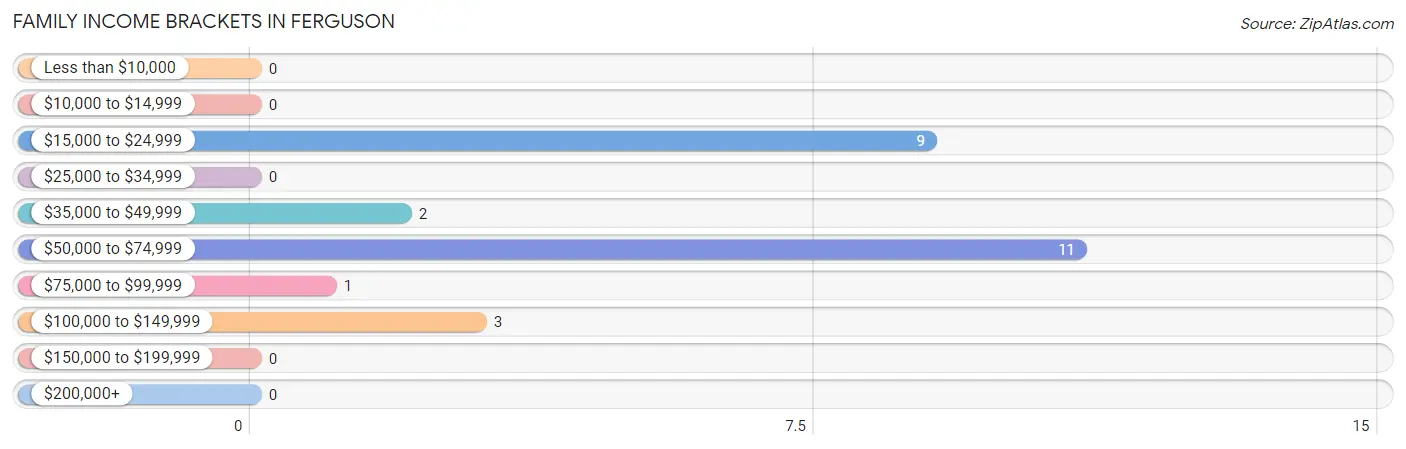
| Income Bracket | # Families | % Families |
| Less than $10,000 | 0 | 0.0% |
| $10,000 to $14,999 | 0 | 0.0% |
| $15,000 to $24,999 | 9 | 34.6% |
| $25,000 to $34,999 | 0 | 0.0% |
| $35,000 to $49,999 | 2 | 7.7% |
| $50,000 to $74,999 | 11 | 42.3% |
| $75,000 to $99,999 | 1 | 3.8% |
| $100,000 to $149,999 | 3 | 11.5% |
| $150,000 to $199,999 | 0 | 0.0% |
| $200,000+ | 0 | 0.0% |
Family Income by Famaliy Size in Ferguson
2-person families (18 | 69.2%) account for the highest median family income in Ferguson with $57,857 per family, while 2-person families (18 | 69.2%) have the highest median income of $28,928 per family member.
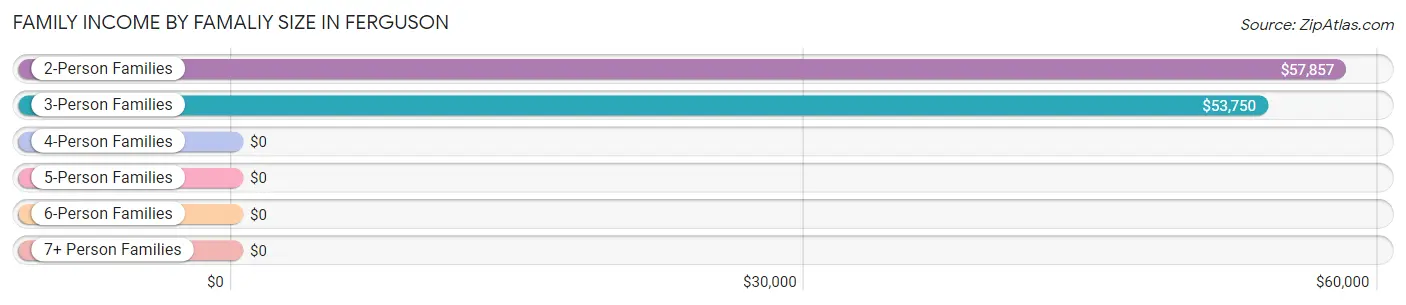
| Income Bracket | # Families | Median Income |
| 2-Person Families | 18 (69.2%) | $57,857 |
| 3-Person Families | 3 (11.5%) | $53,750 |
| 4-Person Families | 5 (19.2%) | $0 |
| 5-Person Families | 0 (0.0%) | $0 |
| 6-Person Families | 0 (0.0%) | $0 |
| 7+ Person Families | 0 (0.0%) | $0 |
| Total | 26 (100.0%) | $51,667 |
Family Income by Number of Earners in Ferguson
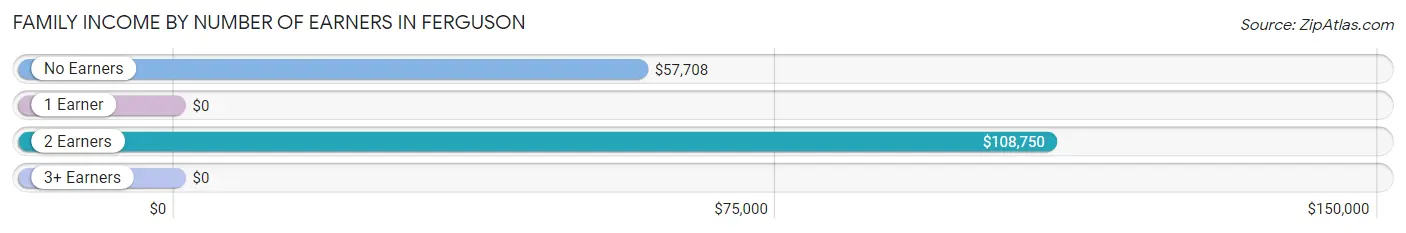
| Number of Earners | # Families | Median Income |
| No Earners | 13 (50.0%) | $57,708 |
| 1 Earner | 9 (34.6%) | $0 |
| 2 Earners | 4 (15.4%) | $108,750 |
| 3+ Earners | 0 (0.0%) | $0 |
| Total | 26 (100.0%) | $51,667 |
Household Income in Ferguson
Household Income Brackets in Ferguson
With 17 households falling in the category, the $50,000 to $74,999 income range is the most frequent in Ferguson, accounting for 34.0% of all households.
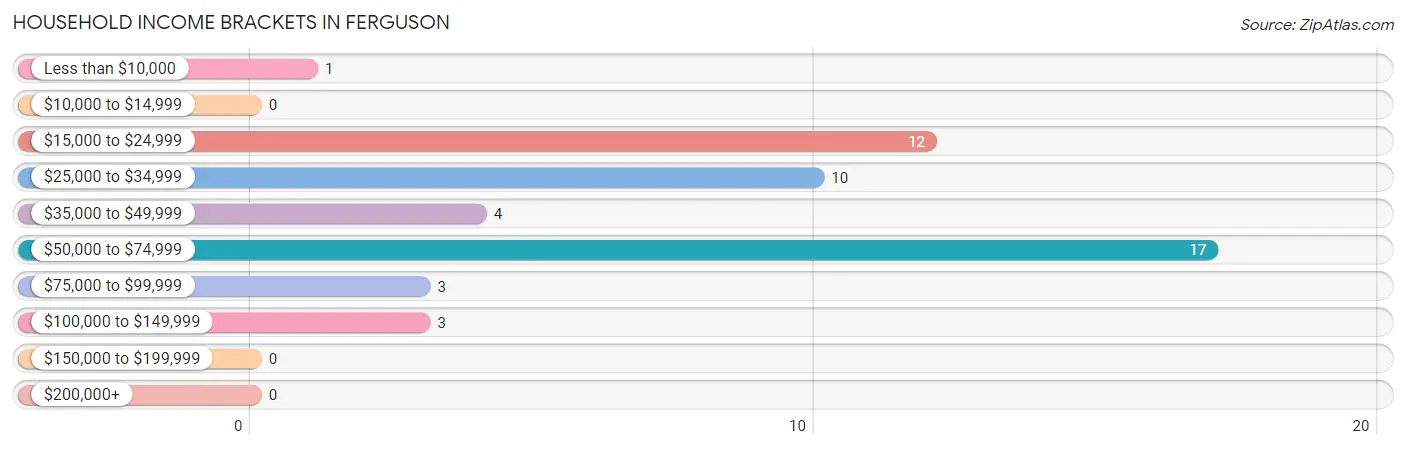
| Income Bracket | # Households | % Households |
| Less than $10,000 | 1 | 2.0% |
| $10,000 to $14,999 | 0 | 0.0% |
| $15,000 to $24,999 | 12 | 24.0% |
| $25,000 to $34,999 | 10 | 20.0% |
| $35,000 to $49,999 | 4 | 8.0% |
| $50,000 to $74,999 | 17 | 34.0% |
| $75,000 to $99,999 | 3 | 6.0% |
| $100,000 to $149,999 | 3 | 6.0% |
| $150,000 to $199,999 | 0 | 0.0% |
| $200,000+ | 0 | 0.0% |
Household Income by Householder Age in Ferguson
The median household income in Ferguson is $46,250, with the highest median household income of $56,250 found in the 45 to 64 years age bracket for the primary householder. A total of 20 households (40.0%) fall into this category.
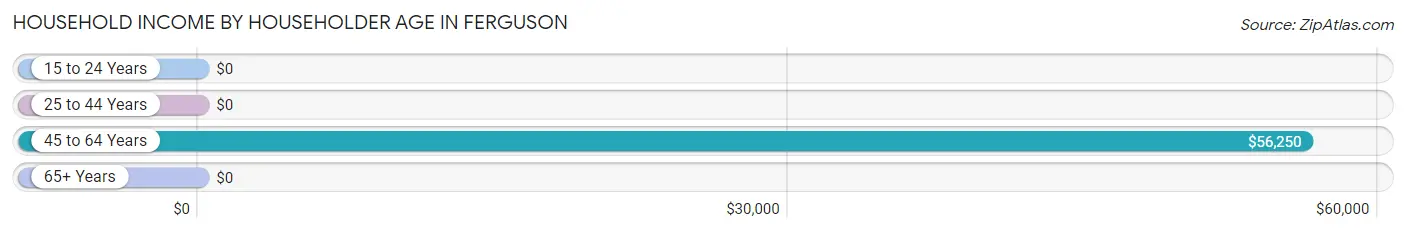
| Income Bracket | # Households | Median Income |
| 15 to 24 Years | 0 (0.0%) | $0 |
| 25 to 44 Years | 7 (14.0%) | $0 |
| 45 to 64 Years | 20 (40.0%) | $56,250 |
| 65+ Years | 23 (46.0%) | $0 |
| Total | 50 (100.0%) | $46,250 |
Poverty in Ferguson
Income Below Poverty by Sex and Age in Ferguson
With 20.9% poverty level for males and 42.4% for females among the residents of Ferguson, 6 to 11 year old males and 6 to 11 year old females are the most vulnerable to poverty, with 4 males (100.0%) and 3 females (100.0%) in their respective age groups living below the poverty level.
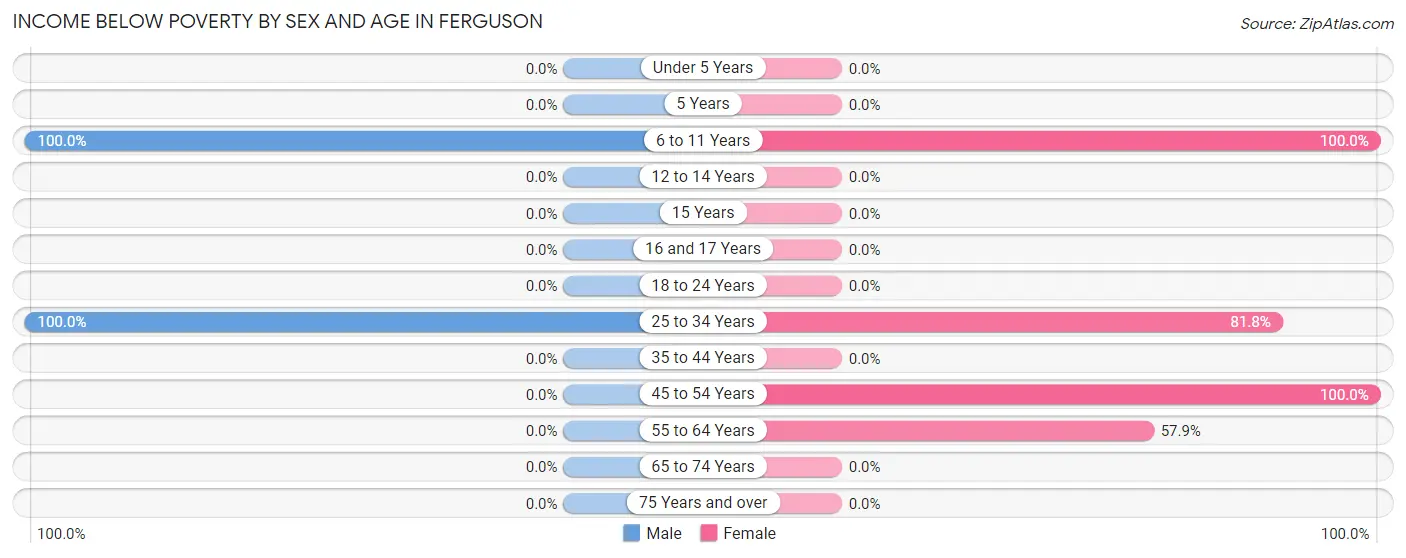
| Age Bracket | Male | Female |
| Under 5 Years | 0 (0.0%) | 0 (0.0%) |
| 5 Years | 0 (0.0%) | 0 (0.0%) |
| 6 to 11 Years | 4 (100.0%) | 3 (100.0%) |
| 12 to 14 Years | 0 (0.0%) | 0 (0.0%) |
| 15 Years | 0 (0.0%) | 0 (0.0%) |
| 16 and 17 Years | 0 (0.0%) | 0 (0.0%) |
| 18 to 24 Years | 0 (0.0%) | 0 (0.0%) |
| 25 to 34 Years | 5 (100.0%) | 9 (81.8%) |
| 35 to 44 Years | 0 (0.0%) | 0 (0.0%) |
| 45 to 54 Years | 0 (0.0%) | 2 (100.0%) |
| 55 to 64 Years | 0 (0.0%) | 11 (57.9%) |
| 65 to 74 Years | 0 (0.0%) | 0 (0.0%) |
| 75 Years and over | 0 (0.0%) | 0 (0.0%) |
| Total | 9 (20.9%) | 25 (42.4%) |
Income Above Poverty by Sex and Age in Ferguson
According to the poverty statistics in Ferguson, males aged under 5 years and females aged under 5 years are the age groups that are most secure financially, with 100.0% of males and 100.0% of females in these age groups living above the poverty line.
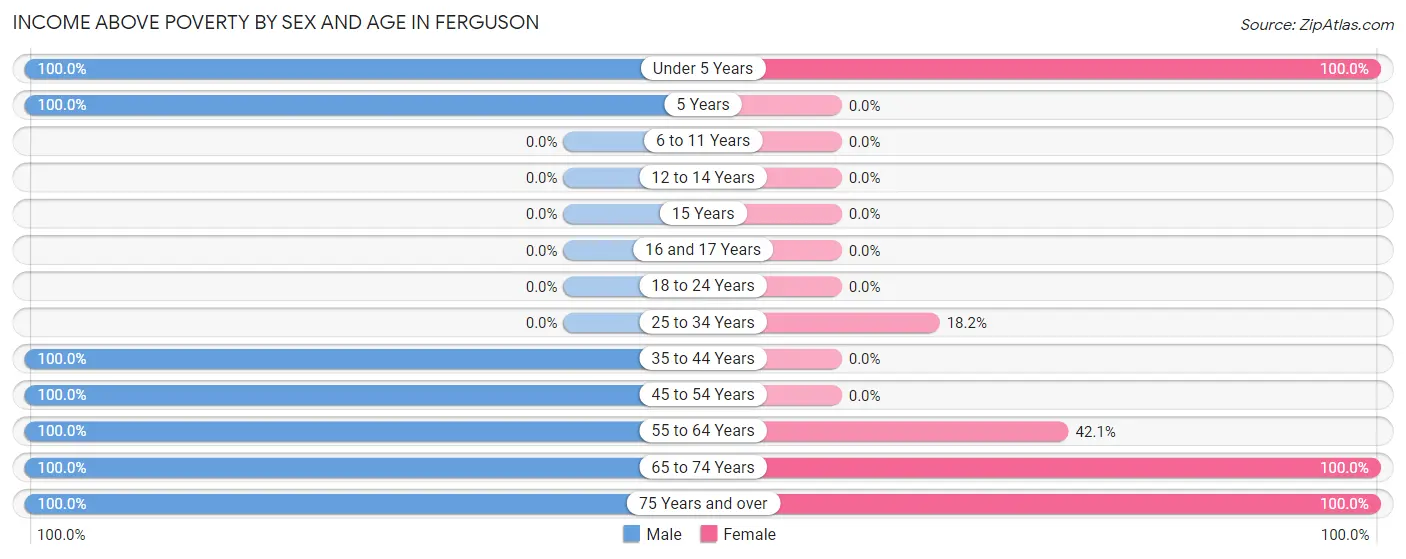
| Age Bracket | Male | Female |
| Under 5 Years | 1 (100.0%) | 3 (100.0%) |
| 5 Years | 1 (100.0%) | 0 (0.0%) |
| 6 to 11 Years | 0 (0.0%) | 0 (0.0%) |
| 12 to 14 Years | 0 (0.0%) | 0 (0.0%) |
| 15 Years | 0 (0.0%) | 0 (0.0%) |
| 16 and 17 Years | 0 (0.0%) | 0 (0.0%) |
| 18 to 24 Years | 0 (0.0%) | 0 (0.0%) |
| 25 to 34 Years | 0 (0.0%) | 2 (18.2%) |
| 35 to 44 Years | 2 (100.0%) | 0 (0.0%) |
| 45 to 54 Years | 8 (100.0%) | 0 (0.0%) |
| 55 to 64 Years | 8 (100.0%) | 8 (42.1%) |
| 65 to 74 Years | 10 (100.0%) | 16 (100.0%) |
| 75 Years and over | 4 (100.0%) | 5 (100.0%) |
| Total | 34 (79.1%) | 34 (57.6%) |
Income Below Poverty Among Married-Couple Families in Ferguson
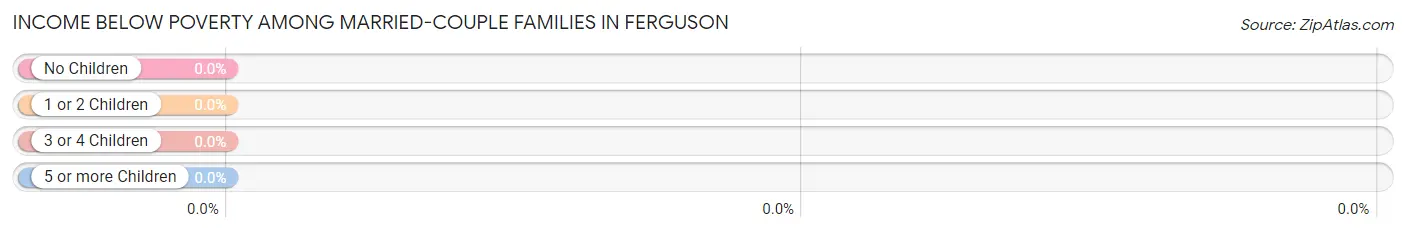
| Children | Above Poverty | Below Poverty |
| No Children | 14 (100.0%) | 0 (0.0%) |
| 1 or 2 Children | 0 (0.0%) | 0 (0.0%) |
| 3 or 4 Children | 0 (0.0%) | 0 (0.0%) |
| 5 or more Children | 0 (0.0%) | 0 (0.0%) |
| Total | 14 (100.0%) | 0 (0.0%) |
Income Below Poverty Among Single-Parent Households in Ferguson
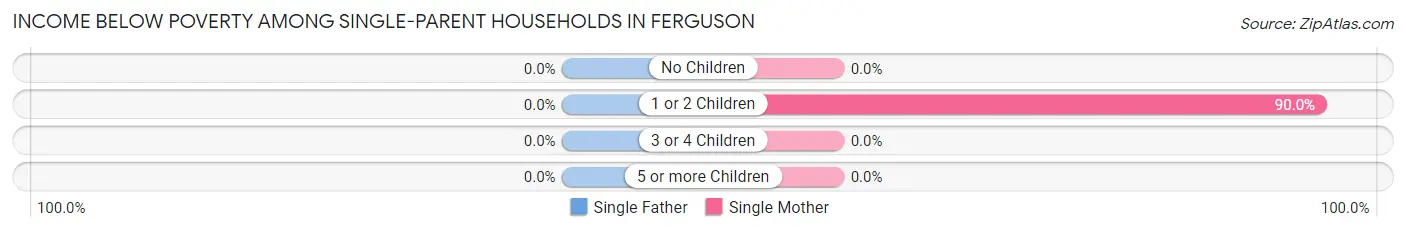
| Children | Single Father | Single Mother |
| No Children | 0 (0.0%) | 0 (0.0%) |
| 1 or 2 Children | 0 (0.0%) | 9 (90.0%) |
| 3 or 4 Children | 0 (0.0%) | 0 (0.0%) |
| 5 or more Children | 0 (0.0%) | 0 (0.0%) |
| Total | 0 (0.0%) | 9 (81.8%) |
Income Below Poverty Among Married-Couple vs Single-Parent Households in Ferguson
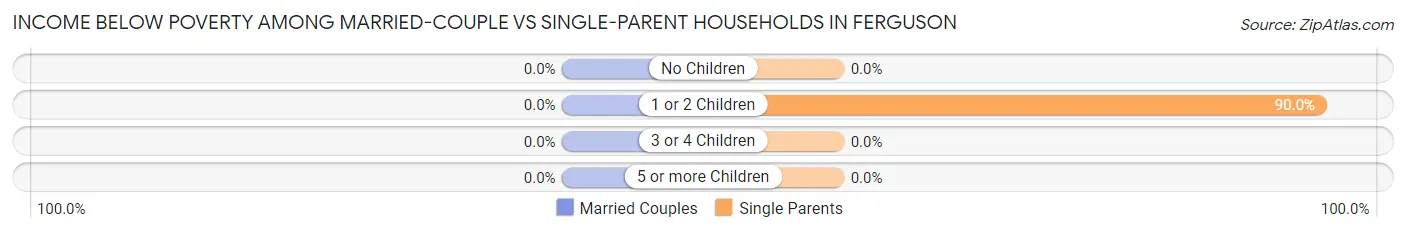
| Children | Married-Couple Families | Single-Parent Households |
| No Children | 0 (0.0%) | 0 (0.0%) |
| 1 or 2 Children | 0 (0.0%) | 9 (90.0%) |
| 3 or 4 Children | 0 (0.0%) | 0 (0.0%) |
| 5 or more Children | 0 (0.0%) | 0 (0.0%) |
| Total | 0 (0.0%) | 9 (75.0%) |
Race in Ferguson
The most populous races in Ferguson are White / Caucasian (96 | 94.1%), Two or more Races (6 | 5.9%), and Hispanic or Latino (3 | 2.9%).
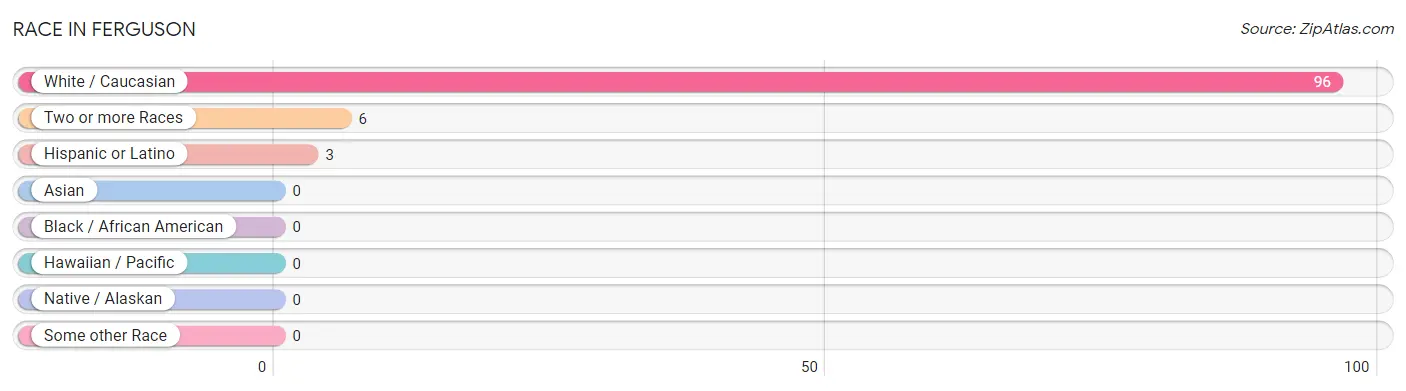
| Race | # Population | % Population |
| Asian | 0 | 0.0% |
| Black / African American | 0 | 0.0% |
| Hawaiian / Pacific | 0 | 0.0% |
| Hispanic or Latino | 3 | 2.9% |
| Native / Alaskan | 0 | 0.0% |
| White / Caucasian | 96 | 94.1% |
| Two or more Races | 6 | 5.9% |
| Some other Race | 0 | 0.0% |
| Total | 102 | 100.0% |
Ancestry in Ferguson
The most populous ancestries reported in Ferguson are German (28 | 27.5%), English (9 | 8.8%), Irish (8 | 7.8%), American (7 | 6.9%), and Central American (3 | 2.9%), together accounting for 53.9% of all Ferguson residents.
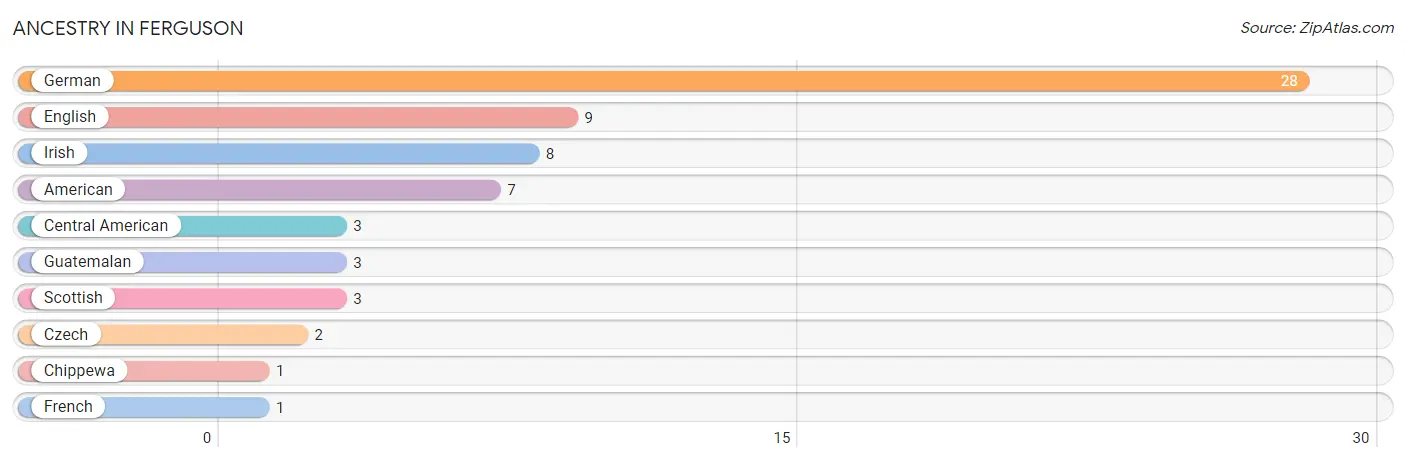
| Ancestry | # Population | % Population |
| American | 7 | 6.9% |
| Central American | 3 | 2.9% |
| Chippewa | 1 | 1.0% |
| Czech | 2 | 2.0% |
| English | 9 | 8.8% |
| French | 1 | 1.0% |
| German | 28 | 27.5% |
| Guatemalan | 3 | 2.9% |
| Irish | 8 | 7.8% |
| Scottish | 3 | 2.9% | View All 10 Rows |
Immigrants in Ferguson

| Immigration Origin | # Population | % Population | View All 0 Rows |
Sex and Age in Ferguson
Sex and Age in Ferguson
The most populous age groups in Ferguson are 70 to 74 Years (9 | 20.9%) for men and 55 to 59 Years (16 | 27.1%) for women.
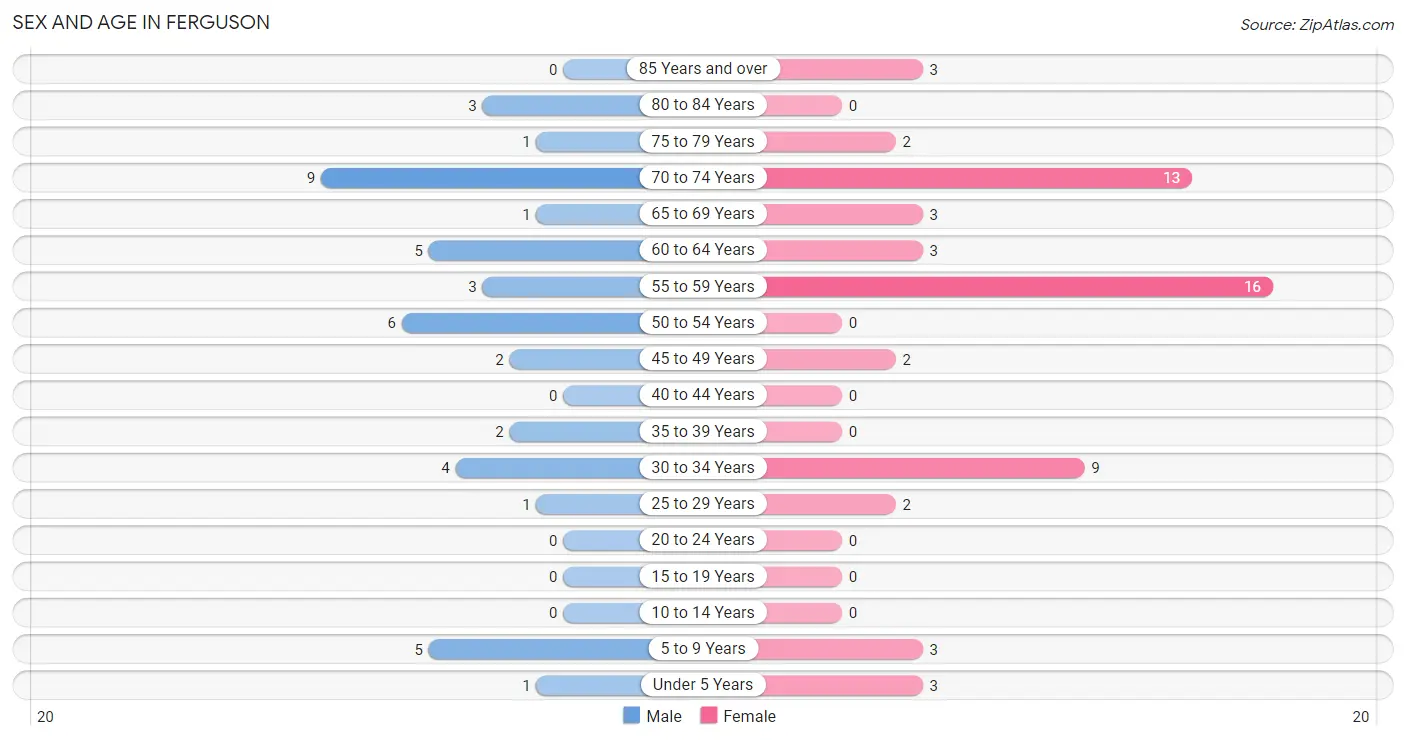
| Age Bracket | Male | Female |
| Under 5 Years | 1 (2.3%) | 3 (5.1%) |
| 5 to 9 Years | 5 (11.6%) | 3 (5.1%) |
| 10 to 14 Years | 0 (0.0%) | 0 (0.0%) |
| 15 to 19 Years | 0 (0.0%) | 0 (0.0%) |
| 20 to 24 Years | 0 (0.0%) | 0 (0.0%) |
| 25 to 29 Years | 1 (2.3%) | 2 (3.4%) |
| 30 to 34 Years | 4 (9.3%) | 9 (15.2%) |
| 35 to 39 Years | 2 (4.6%) | 0 (0.0%) |
| 40 to 44 Years | 0 (0.0%) | 0 (0.0%) |
| 45 to 49 Years | 2 (4.6%) | 2 (3.4%) |
| 50 to 54 Years | 6 (14.0%) | 0 (0.0%) |
| 55 to 59 Years | 3 (7.0%) | 16 (27.1%) |
| 60 to 64 Years | 5 (11.6%) | 3 (5.1%) |
| 65 to 69 Years | 1 (2.3%) | 3 (5.1%) |
| 70 to 74 Years | 9 (20.9%) | 13 (22.0%) |
| 75 to 79 Years | 1 (2.3%) | 2 (3.4%) |
| 80 to 84 Years | 3 (7.0%) | 0 (0.0%) |
| 85 Years and over | 0 (0.0%) | 3 (5.1%) |
| Total | 43 (100.0%) | 59 (100.0%) |
Families and Households in Ferguson
Median Family Size in Ferguson
The median family size in Ferguson is 2.50 persons per family, with single male/father families (1 | 3.8%) accounting for the largest median family size of 3 persons per family. On the other hand, married-couple families (14 | 53.8%) represent the smallest median family size with 2.21 persons per family.
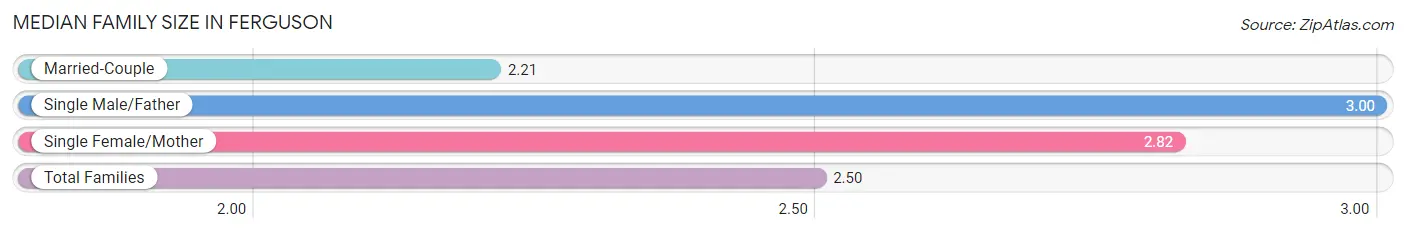
| Family Type | # Families | Family Size |
| Married-Couple | 14 (53.8%) | 2.21 |
| Single Male/Father | 1 (3.8%) | 3.00 |
| Single Female/Mother | 11 (42.3%) | 2.82 |
| Total Families | 26 (100.0%) | 2.50 |
Median Household Size in Ferguson
The median household size in Ferguson is 2.04 persons per household, with single female/mother households (11 | 22.0%) accounting for the largest median household size of 3.27 persons per household. non-family households (24 | 48.0%) represent the smallest median household size with 1.33 persons per household.
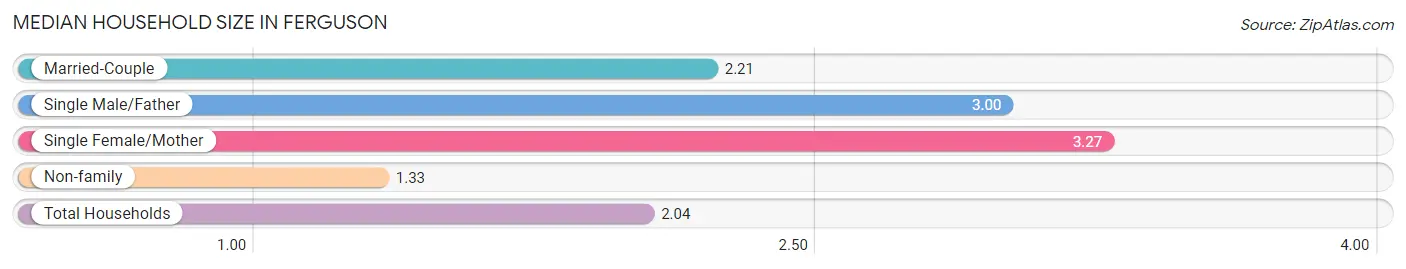
| Household Type | # Households | Household Size |
| Married-Couple | 14 (28.0%) | 2.21 |
| Single Male/Father | 1 (2.0%) | 3.00 |
| Single Female/Mother | 11 (22.0%) | 3.27 |
| Non-family | 24 (48.0%) | 1.33 |
| Total Households | 50 (100.0%) | 2.04 |
Household Size by Marriage Status in Ferguson
Out of a total of 50 households in Ferguson, 26 (52.0%) are family households, while 24 (48.0%) are nonfamily households. The most numerous type of family households are 2-person households, comprising 18, and the most common type of nonfamily households are 1-person households, comprising 16.
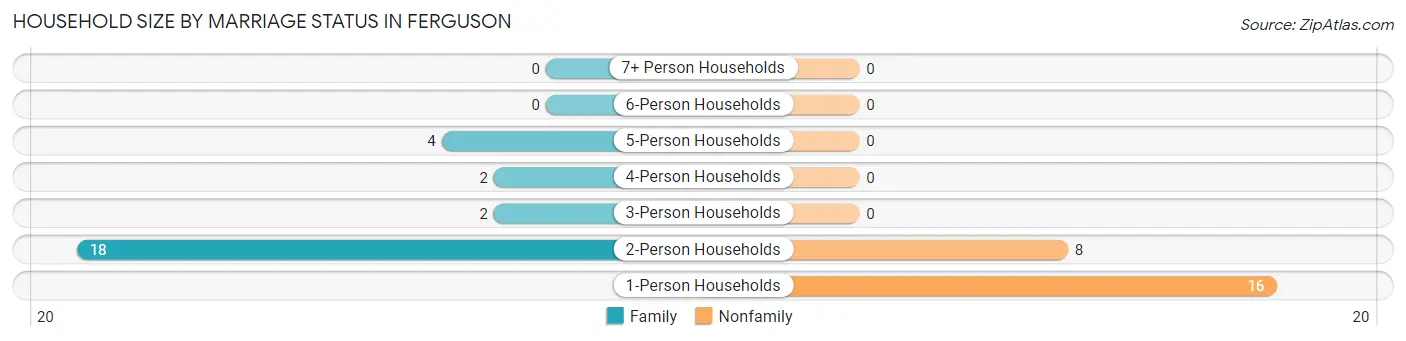
| Household Size | Family Households | Nonfamily Households |
| 1-Person Households | - | 16 (32.0%) |
| 2-Person Households | 18 (36.0%) | 8 (16.0%) |
| 3-Person Households | 2 (4.0%) | 0 (0.0%) |
| 4-Person Households | 2 (4.0%) | 0 (0.0%) |
| 5-Person Households | 4 (8.0%) | 0 (0.0%) |
| 6-Person Households | 0 (0.0%) | 0 (0.0%) |
| 7+ Person Households | 0 (0.0%) | 0 (0.0%) |
| Total | 26 (52.0%) | 24 (48.0%) |
Female Fertility in Ferguson
Fertility by Age in Ferguson
Average fertility rate in Ferguson is 385.0 births per 1,000 women. Women in the age bracket of 20 to 34 years have the highest fertility rate with 455.0 births per 1,000 women. Women in the age bracket of 20 to 34 years acount for 100.0% of all women with births.
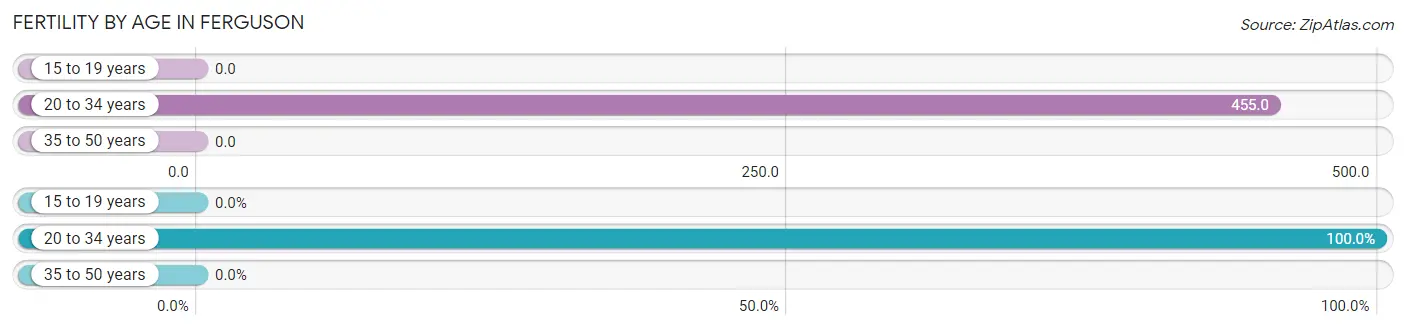
| Age Bracket | Women with Births | Births / 1,000 Women |
| 15 to 19 years | 0 (0.0%) | 0.0 |
| 20 to 34 years | 5 (100.0%) | 455.0 |
| 35 to 50 years | 0 (0.0%) | 0.0 |
| Total | 5 (100.0%) | 385.0 |
Fertility by Age by Marriage Status in Ferguson
80.0% of women with births (5) in Ferguson are married. The highest percentage of unmarried women with births falls into 20 to 34 years age bracket with 20.0% of them unmarried at the time of birth, while the lowest percentage of unmarried women with births belong to 20 to 34 years age bracket with 20.0% of them unmarried.
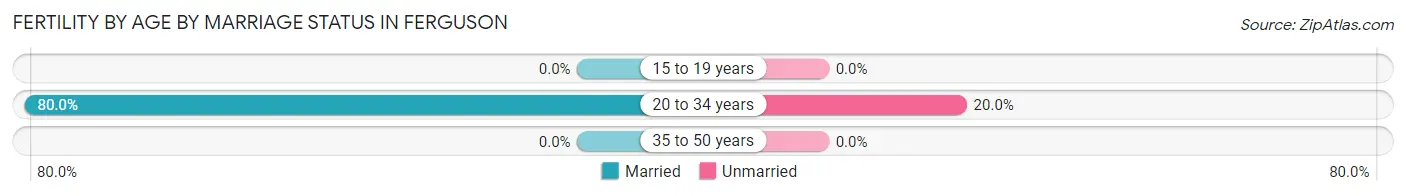
| Age Bracket | Married | Unmarried |
| 15 to 19 years | 0 (0.0%) | 0 (0.0%) |
| 20 to 34 years | 4 (80.0%) | 1 (20.0%) |
| 35 to 50 years | 0 (0.0%) | 0 (0.0%) |
| Total | 4 (80.0%) | 1 (20.0%) |
Fertility by Education in Ferguson
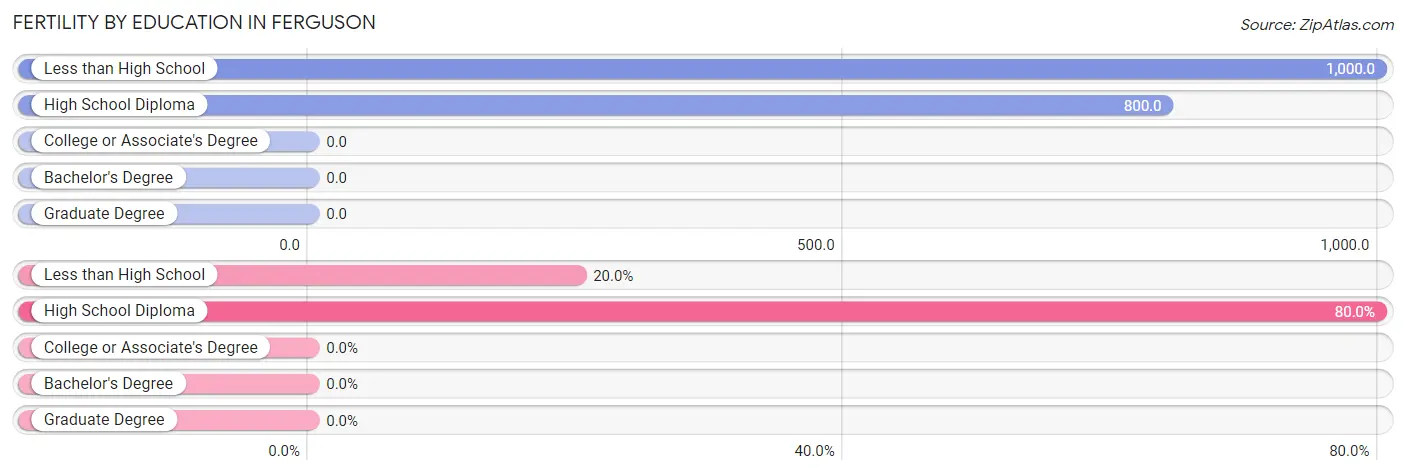
| Educational Attainment | Women with Births | Births / 1,000 Women |
| Less than High School | 1 (20.0%) | 1,000.0 |
| High School Diploma | 4 (80.0%) | 800.0 |
| College or Associate's Degree | 0 (0.0%) | 0.0 |
| Bachelor's Degree | 0 (0.0%) | 0.0 |
| Graduate Degree | 0 (0.0%) | 0.0 |
| Total | 5 (100.0%) | 385.0 |
Fertility by Education by Marriage Status in Ferguson
20.0% of women with births in Ferguson are unmarried. Women with the educational attainment of high school diploma are most likely to be married with 100.0% of them married at childbirth, while women with the educational attainment of less than high school are least likely to be married with 100.0% of them unmarried at childbirth.
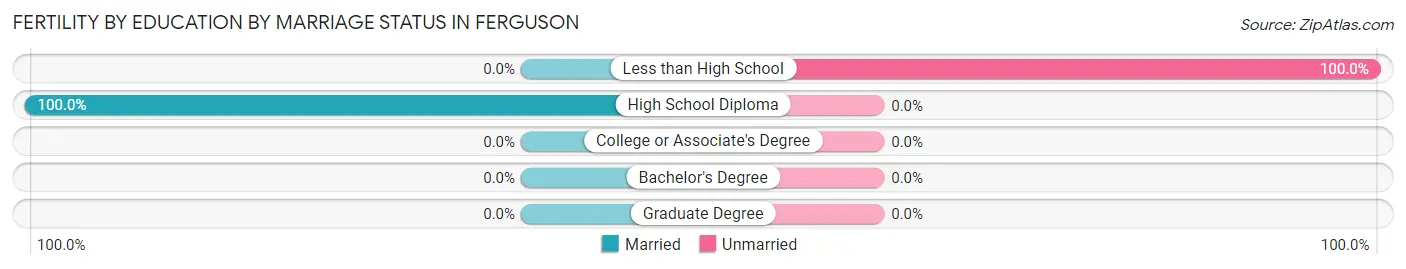
| Educational Attainment | Married | Unmarried |
| Less than High School | 0 (0.0%) | 1 (100.0%) |
| High School Diploma | 4 (100.0%) | 0 (0.0%) |
| College or Associate's Degree | 0 (0.0%) | 0 (0.0%) |
| Bachelor's Degree | 0 (0.0%) | 0 (0.0%) |
| Graduate Degree | 0 (0.0%) | 0 (0.0%) |
| Total | 4 (80.0%) | 1 (20.0%) |
Employment Characteristics in Ferguson
Employment by Class of Employer in Ferguson
Among the 19 employed individuals in Ferguson, private company employees (14 | 73.7%), state government employees (3 | 15.8%), and local government employees (2 | 10.5%) make up the most common classes of employment.
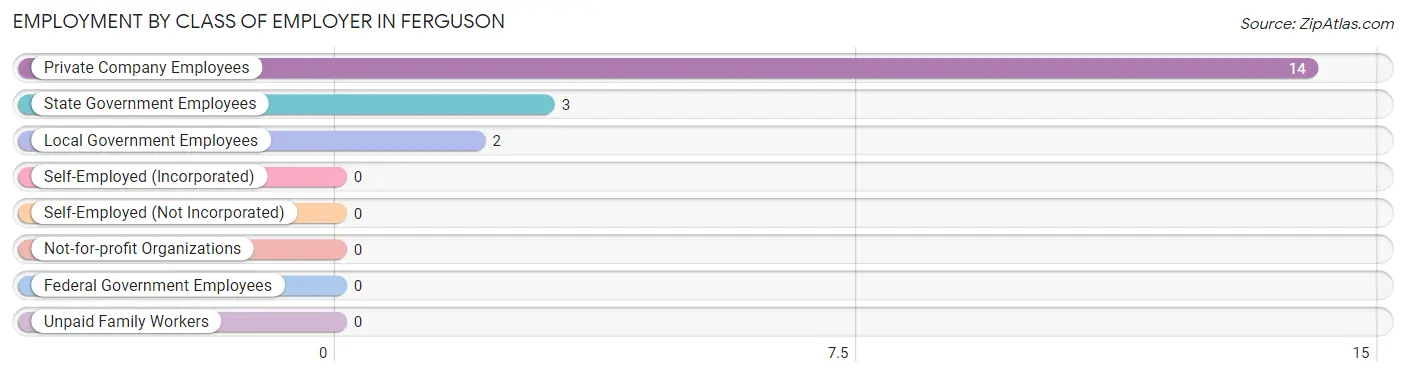
| Employer Class | # Employees | % Employees |
| Private Company Employees | 14 | 73.7% |
| Self-Employed (Incorporated) | 0 | 0.0% |
| Self-Employed (Not Incorporated) | 0 | 0.0% |
| Not-for-profit Organizations | 0 | 0.0% |
| Local Government Employees | 2 | 10.5% |
| State Government Employees | 3 | 15.8% |
| Federal Government Employees | 0 | 0.0% |
| Unpaid Family Workers | 0 | 0.0% |
| Total | 19 | 100.0% |
Employment Status by Age in Ferguson
According to the labor force statistics for Ferguson, out of the total population over 16 years of age (90), 31.1% or 28 individuals are in the labor force, with 32.1% or 9 of them unemployed. The age group with the highest labor force participation rate is 35 to 44 years, with 100.0% or 2 individuals in the labor force. Within the labor force, the 35 to 44 years age range has the highest percentage of unemployed individuals, with 100.0% or 2 of them being unemployed.
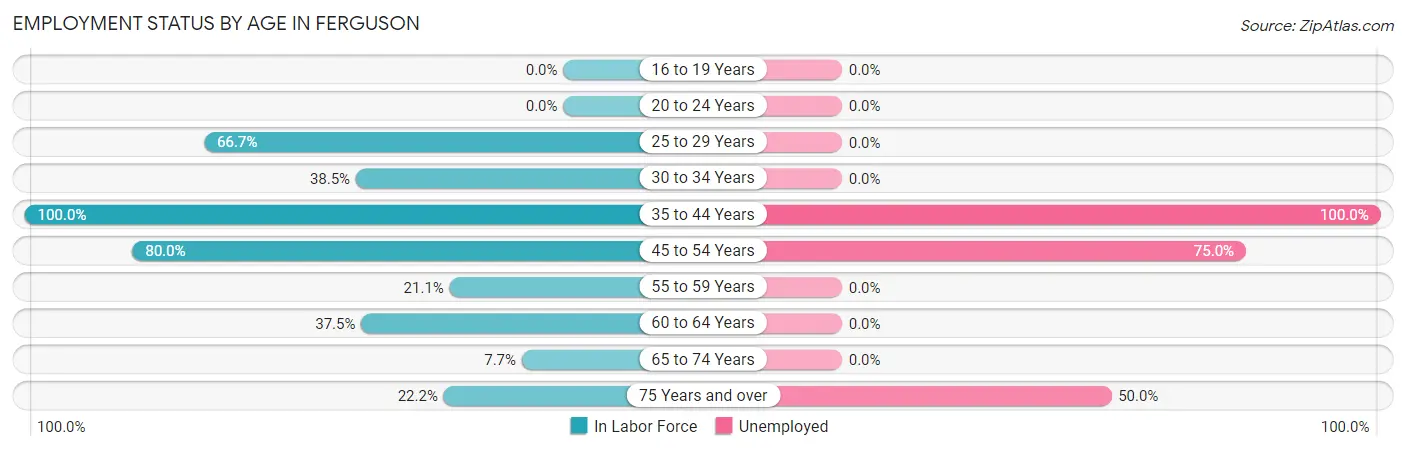
| Age Bracket | In Labor Force | Unemployed |
| 16 to 19 Years | 0 (0.0%) | 0 (0.0%) |
| 20 to 24 Years | 0 (0.0%) | 0 (0.0%) |
| 25 to 29 Years | 2 (66.7%) | 0 (0.0%) |
| 30 to 34 Years | 5 (38.5%) | 0 (0.0%) |
| 35 to 44 Years | 2 (100.0%) | 2 (100.0%) |
| 45 to 54 Years | 8 (80.0%) | 6 (75.0%) |
| 55 to 59 Years | 4 (21.1%) | 0 (0.0%) |
| 60 to 64 Years | 3 (37.5%) | 0 (0.0%) |
| 65 to 74 Years | 2 (7.7%) | 0 (0.0%) |
| 75 Years and over | 2 (22.2%) | 1 (50.0%) |
| Total | 28 (31.1%) | 9 (32.1%) |
Employment Status by Educational Attainment in Ferguson
According to labor force statistics for Ferguson, 43.6% of individuals (24) out of the total population between 25 and 64 years of age (55) are in the labor force, with 33.3% or 8 of them being unemployed. The group with the highest labor force participation rate are those with the educational attainment of college / associate degree, with 56.3% or 9 individuals in the labor force. Within the labor force, individuals with high school diploma education have the highest percentage of unemployment, with 66.7% or 6 of them being unemployed.
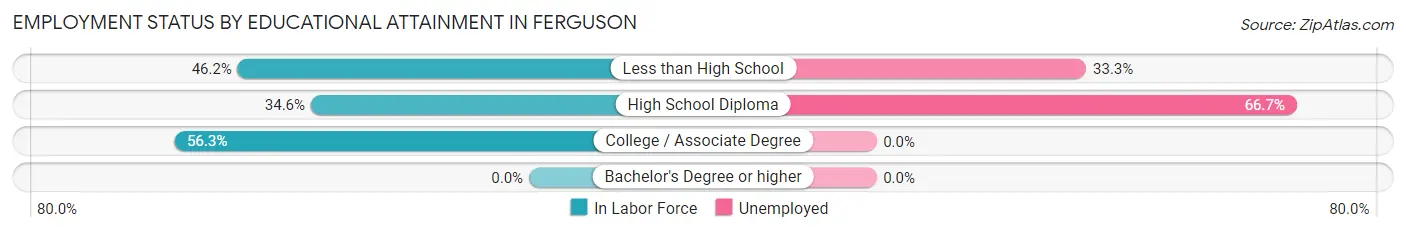
| Educational Attainment | In Labor Force | Unemployed |
| Less than High School | 6 (46.2%) | 4 (33.3%) |
| High School Diploma | 9 (34.6%) | 17 (66.7%) |
| College / Associate Degree | 9 (56.3%) | 0 (0.0%) |
| Bachelor's Degree or higher | 0 (0.0%) | 0 (0.0%) |
| Total | 24 (43.6%) | 18 (33.3%) |
Employment Occupations by Sex in Ferguson
Management, Business, Science and Arts Occupations
The most common Management, Business, Science and Arts occupations in Ferguson are Business & Financial (4 | 21.0%), and Management (3 | 15.8%).
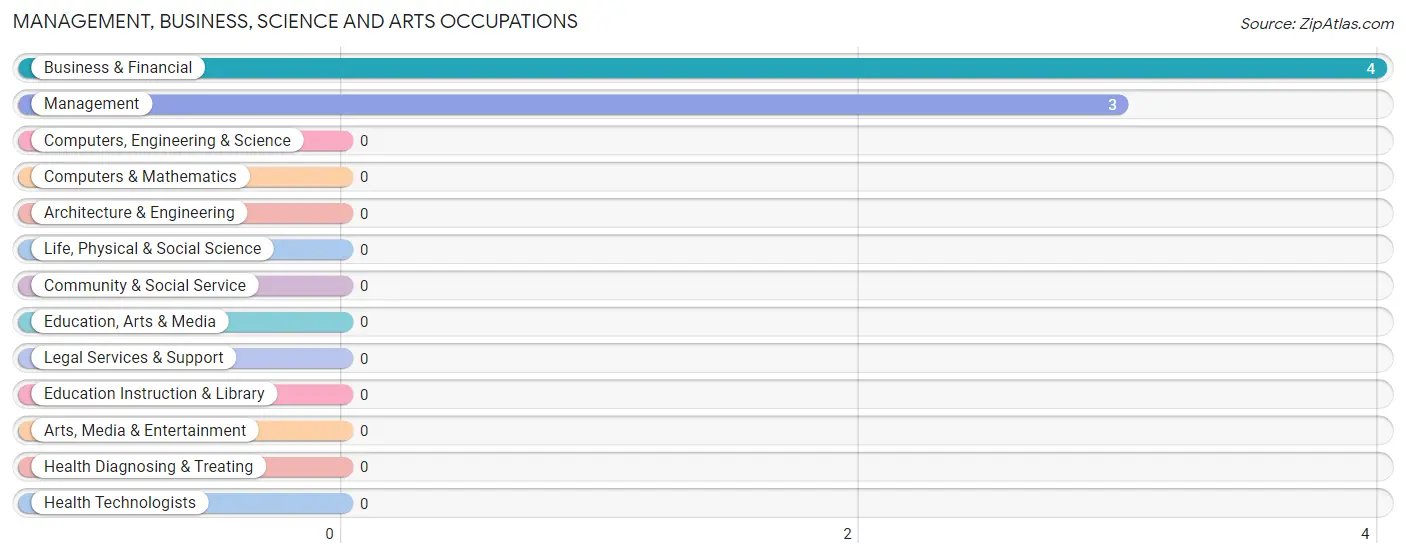
Management, Business, Science and Arts Occupations by Sex
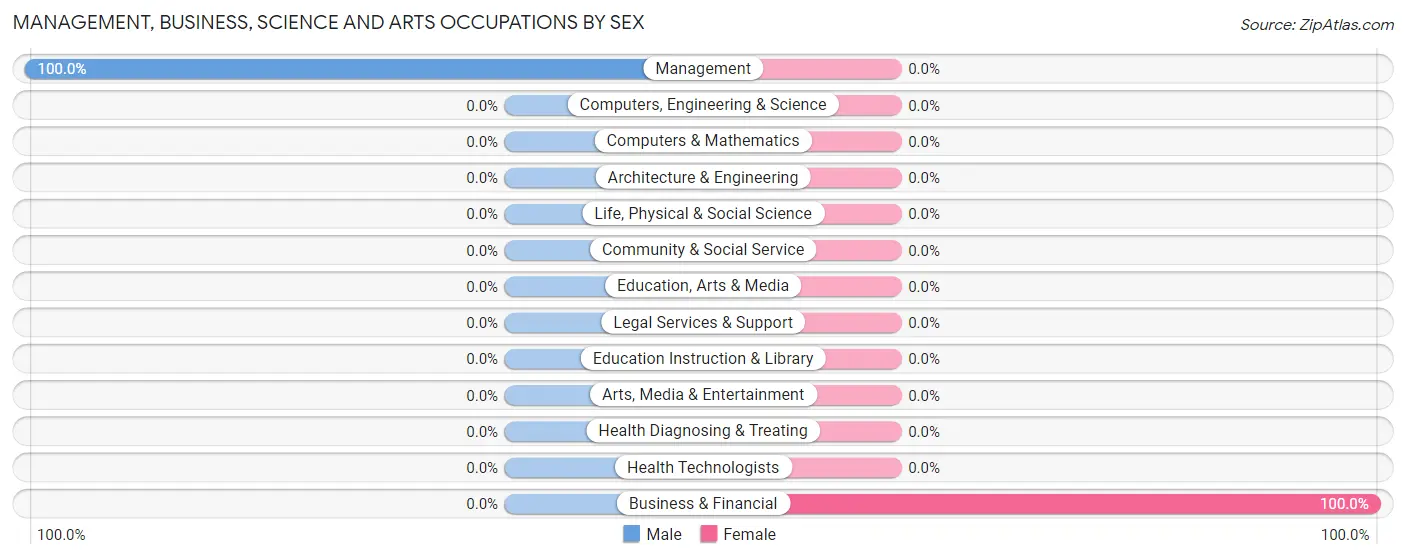
| Occupation | Male | Female |
| Management | 3 (100.0%) | 0 (0.0%) |
| Business & Financial | 0 (0.0%) | 4 (100.0%) |
| Computers, Engineering & Science | 0 (0.0%) | 0 (0.0%) |
| Computers & Mathematics | 0 (0.0%) | 0 (0.0%) |
| Architecture & Engineering | 0 (0.0%) | 0 (0.0%) |
| Life, Physical & Social Science | 0 (0.0%) | 0 (0.0%) |
| Community & Social Service | 0 (0.0%) | 0 (0.0%) |
| Education, Arts & Media | 0 (0.0%) | 0 (0.0%) |
| Legal Services & Support | 0 (0.0%) | 0 (0.0%) |
| Education Instruction & Library | 0 (0.0%) | 0 (0.0%) |
| Arts, Media & Entertainment | 0 (0.0%) | 0 (0.0%) |
| Health Diagnosing & Treating | 0 (0.0%) | 0 (0.0%) |
| Health Technologists | 0 (0.0%) | 0 (0.0%) |
| Total (Category) | 3 (42.9%) | 4 (57.1%) |
| Total (Overall) | 5 (26.3%) | 14 (73.7%) |
Services Occupations
The most common Services occupations in Ferguson are Healthcare Support (3 | 15.8%), and Cleaning & Maintenance (1 | 5.3%).
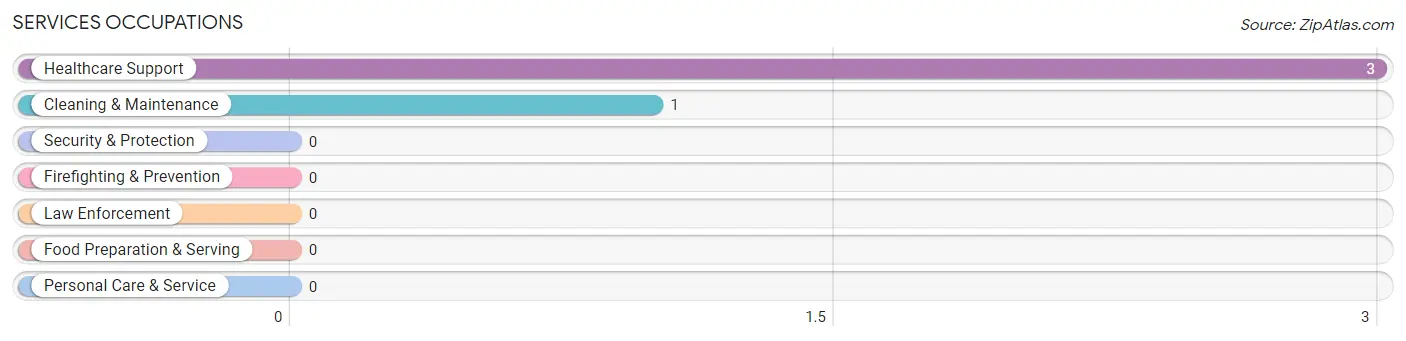
Services Occupations by Sex
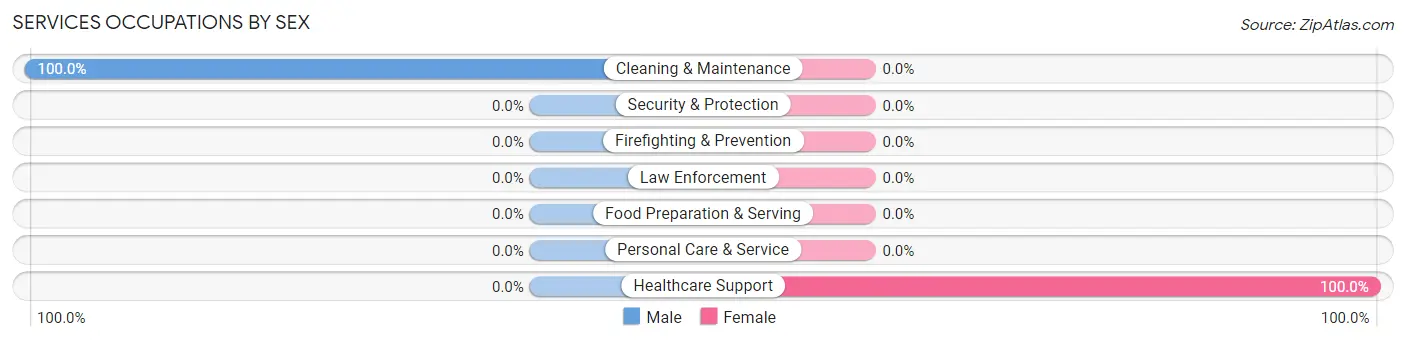
| Occupation | Male | Female |
| Healthcare Support | 0 (0.0%) | 3 (100.0%) |
| Security & Protection | 0 (0.0%) | 0 (0.0%) |
| Firefighting & Prevention | 0 (0.0%) | 0 (0.0%) |
| Law Enforcement | 0 (0.0%) | 0 (0.0%) |
| Food Preparation & Serving | 0 (0.0%) | 0 (0.0%) |
| Cleaning & Maintenance | 1 (100.0%) | 0 (0.0%) |
| Personal Care & Service | 0 (0.0%) | 0 (0.0%) |
| Total (Category) | 1 (25.0%) | 3 (75.0%) |
| Total (Overall) | 5 (26.3%) | 14 (73.7%) |
Sales and Office Occupations
The most common Sales and Office occupations in Ferguson are , and Office & Administration (1 | 5.3%).
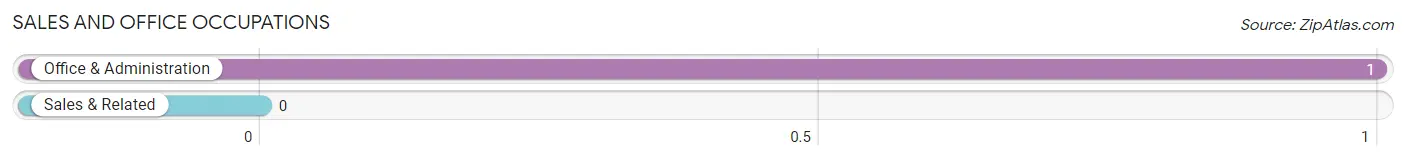
Sales and Office Occupations by Sex
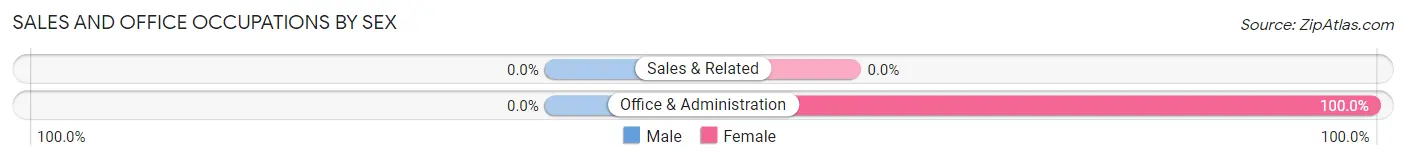
| Occupation | Male | Female |
| Sales & Related | 0 (0.0%) | 0 (0.0%) |
| Office & Administration | 0 (0.0%) | 1 (100.0%) |
| Total (Category) | 0 (0.0%) | 1 (100.0%) |
| Total (Overall) | 5 (26.3%) | 14 (73.7%) |
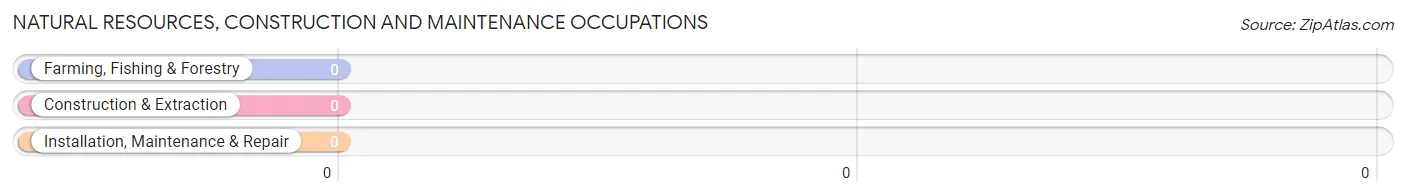
Natural Resources, Construction and Maintenance Occupations
Natural Resources, Construction and Maintenance Occupations by Sex
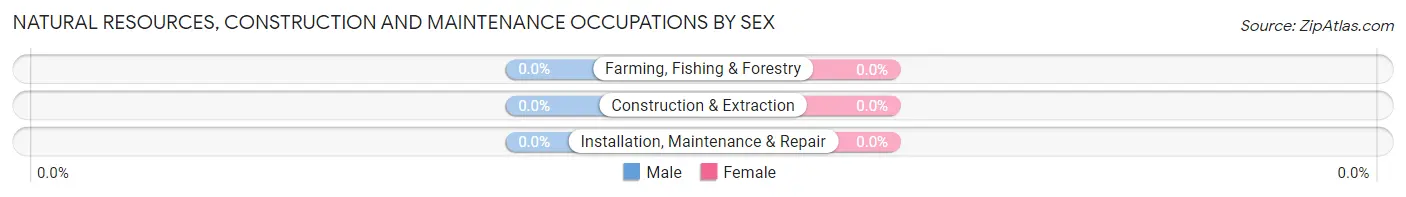
| Occupation | Male | Female |
| Farming, Fishing & Forestry | 0 (0.0%) | 0 (0.0%) |
| Construction & Extraction | 0 (0.0%) | 0 (0.0%) |
| Installation, Maintenance & Repair | 0 (0.0%) | 0 (0.0%) |
| Total (Category) | 0 (0.0%) | 0 (0.0%) |
| Total (Overall) | 5 (26.3%) | 14 (73.7%) |
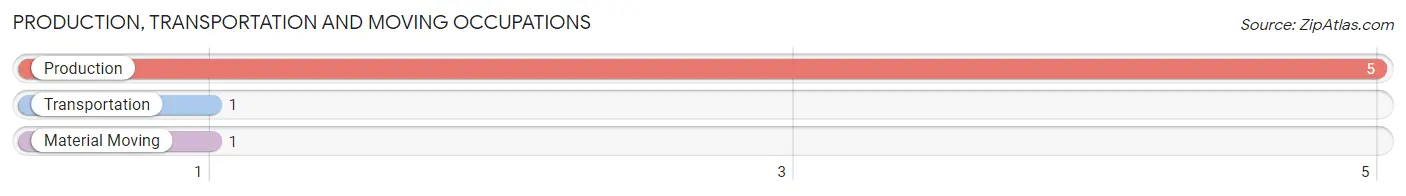
Production, Transportation and Moving Occupations
The most common Production, Transportation and Moving occupations in Ferguson are Production (5 | 26.3%), Transportation (1 | 5.3%), and Material Moving (1 | 5.3%).
Production, Transportation and Moving Occupations by Sex
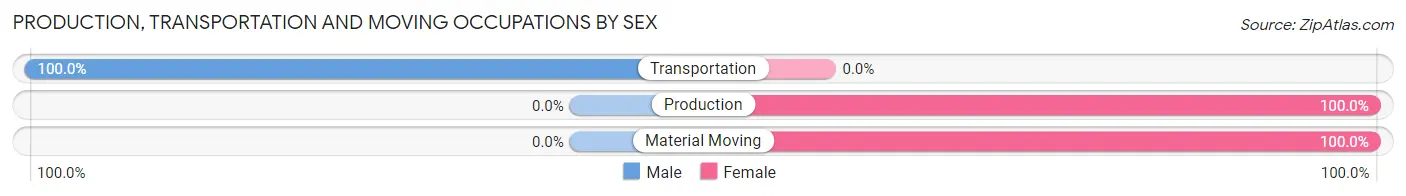
| Occupation | Male | Female |
| Production | 0 (0.0%) | 5 (100.0%) |
| Transportation | 1 (100.0%) | 0 (0.0%) |
| Material Moving | 0 (0.0%) | 1 (100.0%) |
| Total (Category) | 1 (14.3%) | 6 (85.7%) |
| Total (Overall) | 5 (26.3%) | 14 (73.7%) |
Employment Industries by Sex in Ferguson
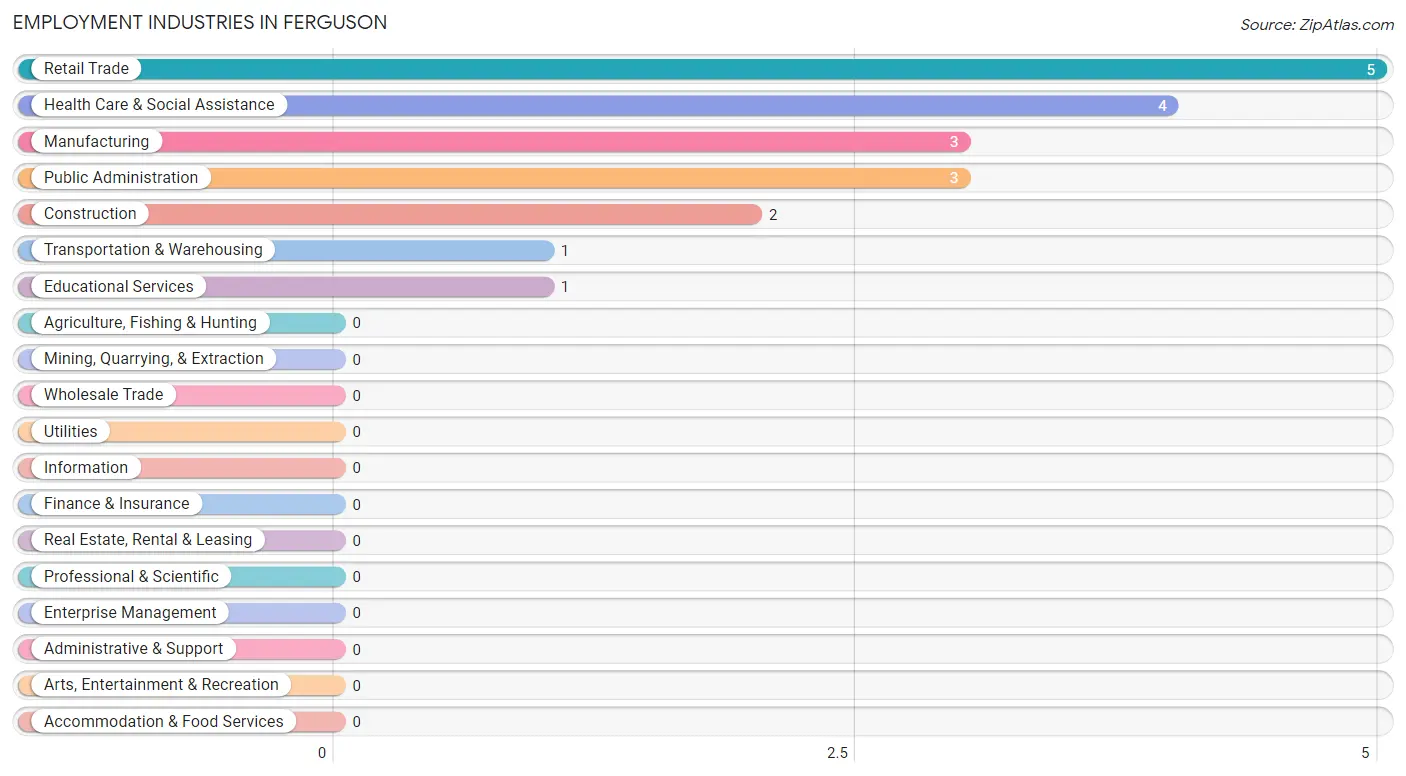
Employment Industries in Ferguson
The major employment industries in Ferguson include Retail Trade (5 | 26.3%), Health Care & Social Assistance (4 | 21.0%), Manufacturing (3 | 15.8%), Public Administration (3 | 15.8%), and Construction (2 | 10.5%).
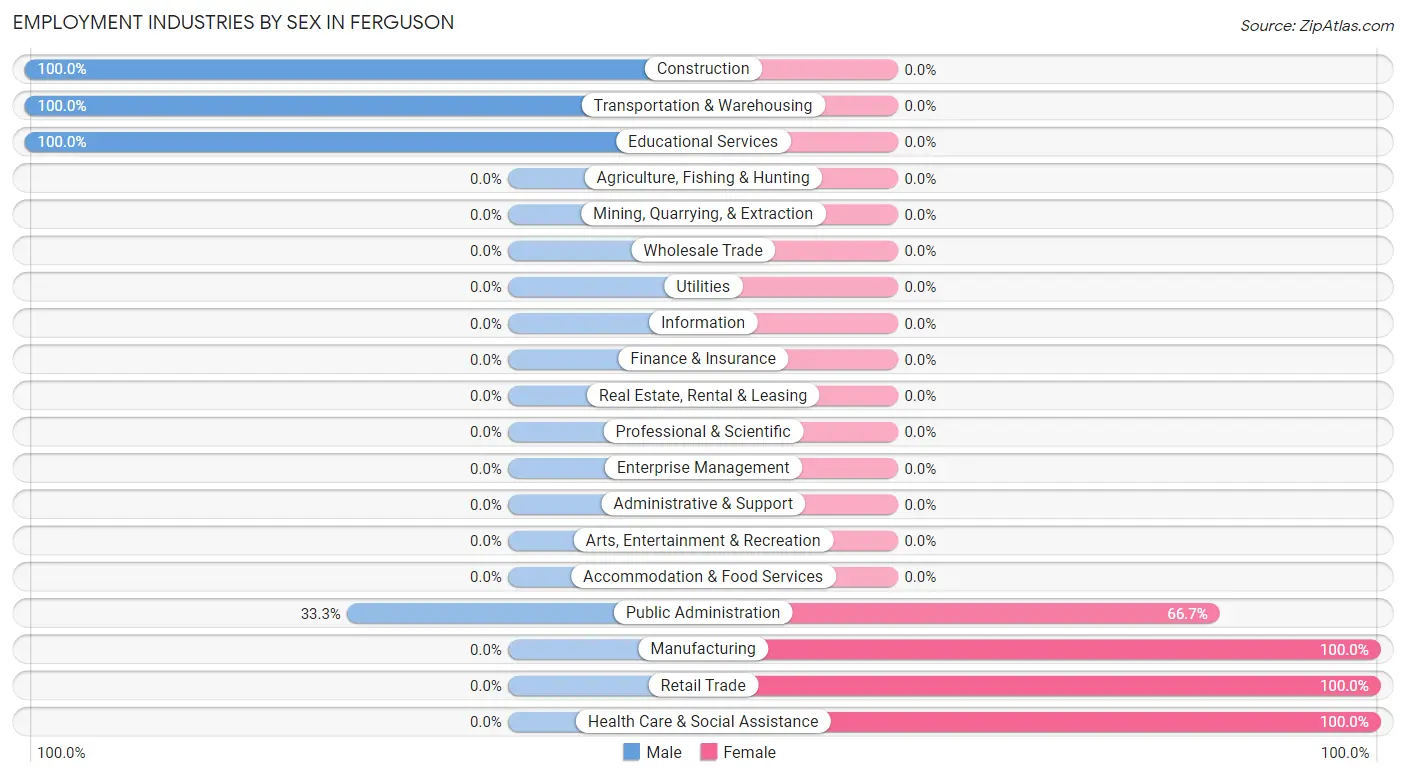
Employment Industries by Sex in Ferguson
The Ferguson industries that see more men than women are Construction (100.0%), Transportation & Warehousing (100.0%), and Educational Services (100.0%), whereas the industries that tend to have a higher number of women are Manufacturing (100.0%), Retail Trade (100.0%), and Health Care & Social Assistance (100.0%).
| Industry | Male | Female |
| Agriculture, Fishing & Hunting | 0 (0.0%) | 0 (0.0%) |
| Mining, Quarrying, & Extraction | 0 (0.0%) | 0 (0.0%) |
| Construction | 2 (100.0%) | 0 (0.0%) |
| Manufacturing | 0 (0.0%) | 3 (100.0%) |
| Wholesale Trade | 0 (0.0%) | 0 (0.0%) |
| Retail Trade | 0 (0.0%) | 5 (100.0%) |
| Transportation & Warehousing | 1 (100.0%) | 0 (0.0%) |
| Utilities | 0 (0.0%) | 0 (0.0%) |
| Information | 0 (0.0%) | 0 (0.0%) |
| Finance & Insurance | 0 (0.0%) | 0 (0.0%) |
| Real Estate, Rental & Leasing | 0 (0.0%) | 0 (0.0%) |
| Professional & Scientific | 0 (0.0%) | 0 (0.0%) |
| Enterprise Management | 0 (0.0%) | 0 (0.0%) |
| Administrative & Support | 0 (0.0%) | 0 (0.0%) |
| Educational Services | 1 (100.0%) | 0 (0.0%) |
| Health Care & Social Assistance | 0 (0.0%) | 4 (100.0%) |
| Arts, Entertainment & Recreation | 0 (0.0%) | 0 (0.0%) |
| Accommodation & Food Services | 0 (0.0%) | 0 (0.0%) |
| Public Administration | 1 (33.3%) | 2 (66.7%) |
| Total | 5 (26.3%) | 14 (73.7%) |
Education in Ferguson
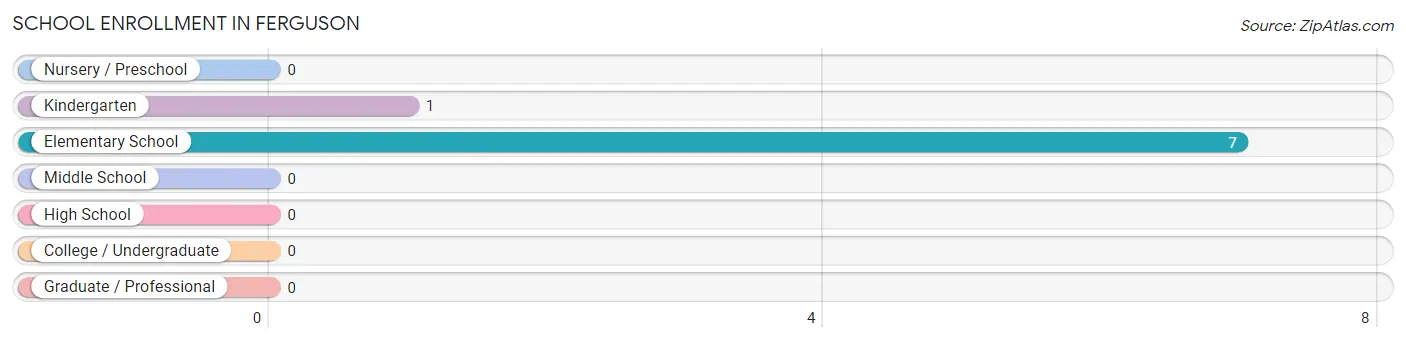
School Enrollment in Ferguson
The most common levels of schooling among the 8 students in Ferguson are elementary school (7 | 87.5%), and kindergarten (1 | 12.5%).
| School Level | # Students | % Students |
| Nursery / Preschool | 0 | 0.0% |
| Kindergarten | 1 | 12.5% |
| Elementary School | 7 | 87.5% |
| Middle School | 0 | 0.0% |
| High School | 0 | 0.0% |
| College / Undergraduate | 0 | 0.0% |
| Graduate / Professional | 0 | 0.0% |
| Total | 8 | 100.0% |
School Enrollment by Age by Funding Source in Ferguson
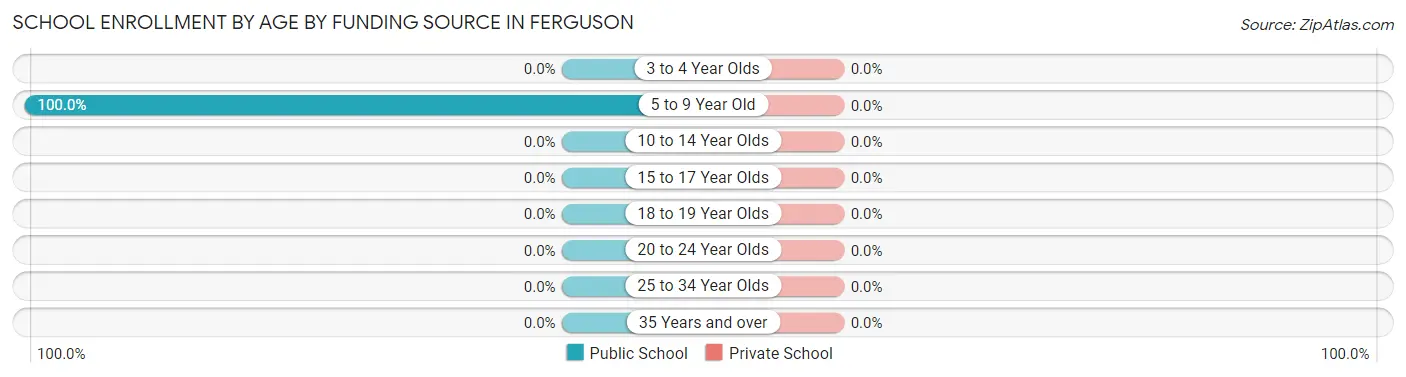
| Age Bracket | Public School | Private School |
| 3 to 4 Year Olds | 0 (0.0%) | 0 (0.0%) |
| 5 to 9 Year Old | 8 (100.0%) | 0 (0.0%) |
| 10 to 14 Year Olds | 0 (0.0%) | 0 (0.0%) |
| 15 to 17 Year Olds | 0 (0.0%) | 0 (0.0%) |
| 18 to 19 Year Olds | 0 (0.0%) | 0 (0.0%) |
| 20 to 24 Year Olds | 0 (0.0%) | 0 (0.0%) |
| 25 to 34 Year Olds | 0 (0.0%) | 0 (0.0%) |
| 35 Years and over | 0 (0.0%) | 0 (0.0%) |
| Total | 8 (100.0%) | 0 (0.0%) |
Educational Attainment by Field of Study in Ferguson
Education (2 | 66.7%), and computers & mathematics (1 | 33.3%) are the most common fields of study among 3 individuals in Ferguson who have obtained a bachelor's degree or higher.
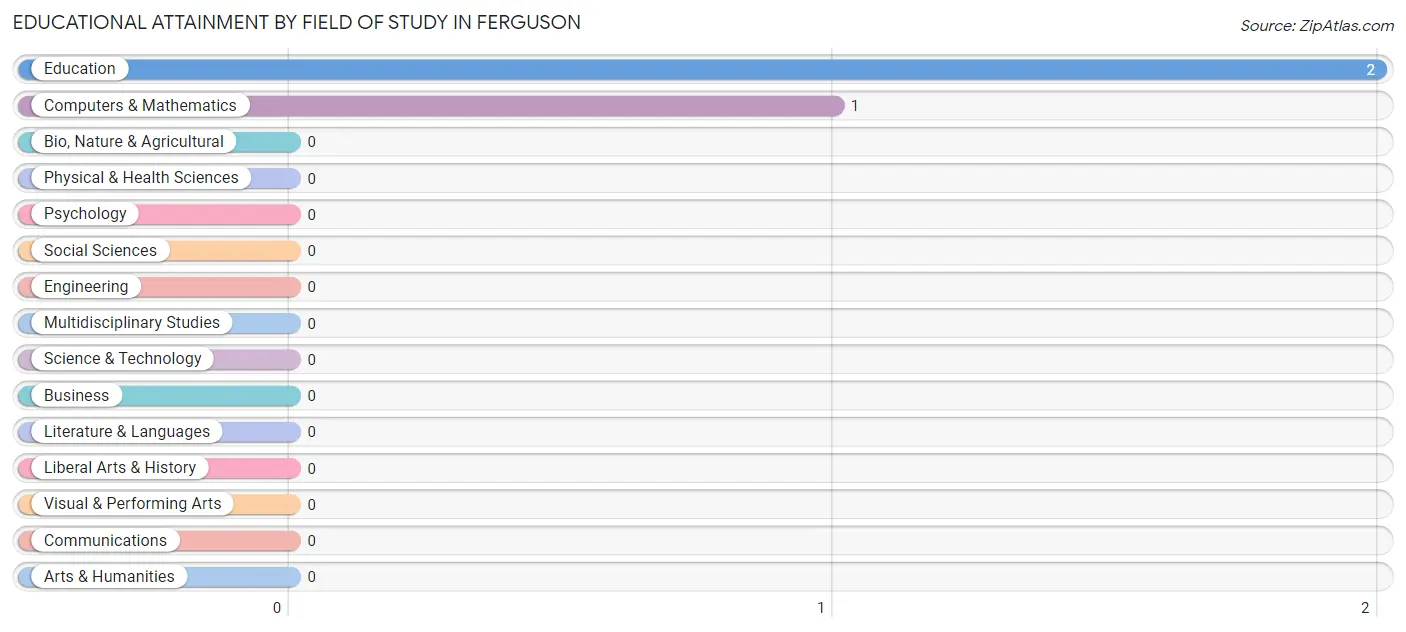
| Field of Study | # Graduates | % Graduates |
| Computers & Mathematics | 1 | 33.3% |
| Bio, Nature & Agricultural | 0 | 0.0% |
| Physical & Health Sciences | 0 | 0.0% |
| Psychology | 0 | 0.0% |
| Social Sciences | 0 | 0.0% |
| Engineering | 0 | 0.0% |
| Multidisciplinary Studies | 0 | 0.0% |
| Science & Technology | 0 | 0.0% |
| Business | 0 | 0.0% |
| Education | 2 | 66.7% |
| Literature & Languages | 0 | 0.0% |
| Liberal Arts & History | 0 | 0.0% |
| Visual & Performing Arts | 0 | 0.0% |
| Communications | 0 | 0.0% |
| Arts & Humanities | 0 | 0.0% |
| Total | 3 | 100.0% |
Transportation & Commute in Ferguson
Vehicle Availability by Sex in Ferguson
The most prevalent vehicle ownership categories in Ferguson are males with 3 vehicles (3, accounting for 60.0%) and females with 3 vehicles (1, making up 21.4%).
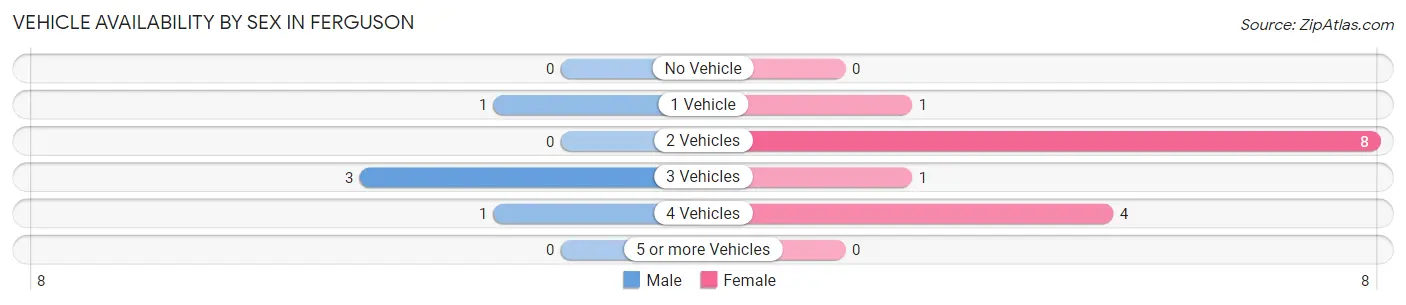
| Vehicles Available | Male | Female |
| No Vehicle | 0 (0.0%) | 0 (0.0%) |
| 1 Vehicle | 1 (20.0%) | 1 (7.1%) |
| 2 Vehicles | 0 (0.0%) | 8 (57.1%) |
| 3 Vehicles | 3 (60.0%) | 1 (7.1%) |
| 4 Vehicles | 1 (20.0%) | 4 (28.6%) |
| 5 or more Vehicles | 0 (0.0%) | 0 (0.0%) |
| Total | 5 (100.0%) | 14 (100.0%) |
Commute Time in Ferguson
The most frequently occuring commute durations in Ferguson are 5 to 9 minutes (5 commuters, 27.8%), 15 to 19 minutes (3 commuters, 16.7%), and 45 to 59 minutes (3 commuters, 16.7%).
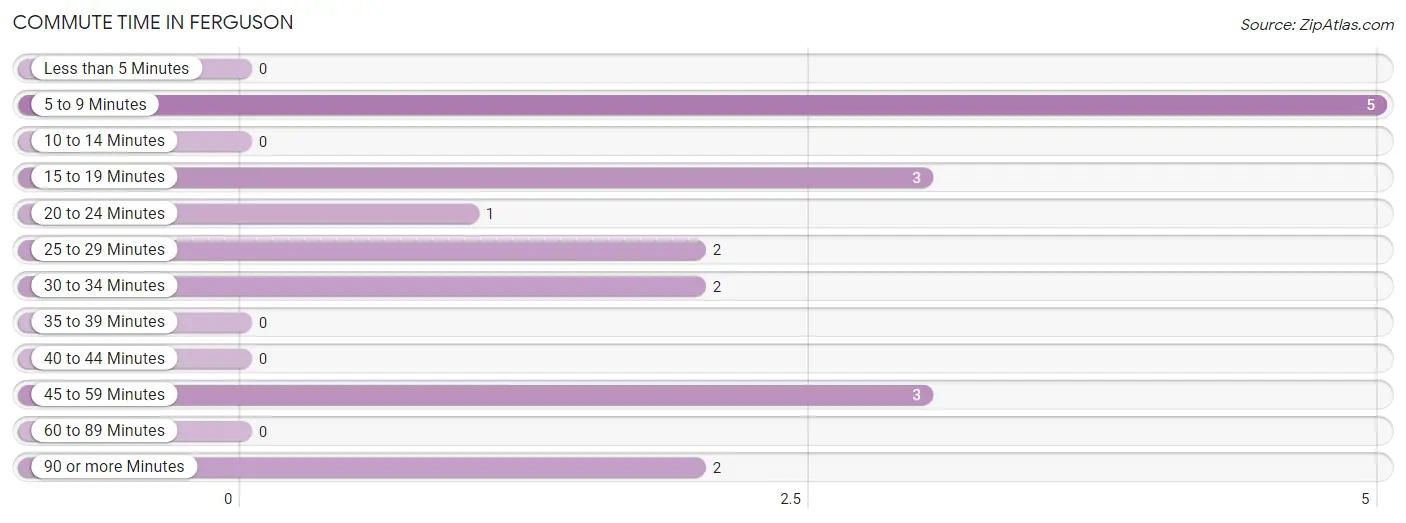
| Commute Time | # Commuters | % Commuters |
| Less than 5 Minutes | 0 | 0.0% |
| 5 to 9 Minutes | 5 | 27.8% |
| 10 to 14 Minutes | 0 | 0.0% |
| 15 to 19 Minutes | 3 | 16.7% |
| 20 to 24 Minutes | 1 | 5.6% |
| 25 to 29 Minutes | 2 | 11.1% |
| 30 to 34 Minutes | 2 | 11.1% |
| 35 to 39 Minutes | 0 | 0.0% |
| 40 to 44 Minutes | 0 | 0.0% |
| 45 to 59 Minutes | 3 | 16.7% |
| 60 to 89 Minutes | 0 | 0.0% |
| 90 or more Minutes | 2 | 11.1% |
Commute Time by Sex in Ferguson
The most common commute times in Ferguson are 45 to 59 minutes (3 commuters, 75.0%) for males and 5 to 9 minutes (5 commuters, 35.7%) for females.
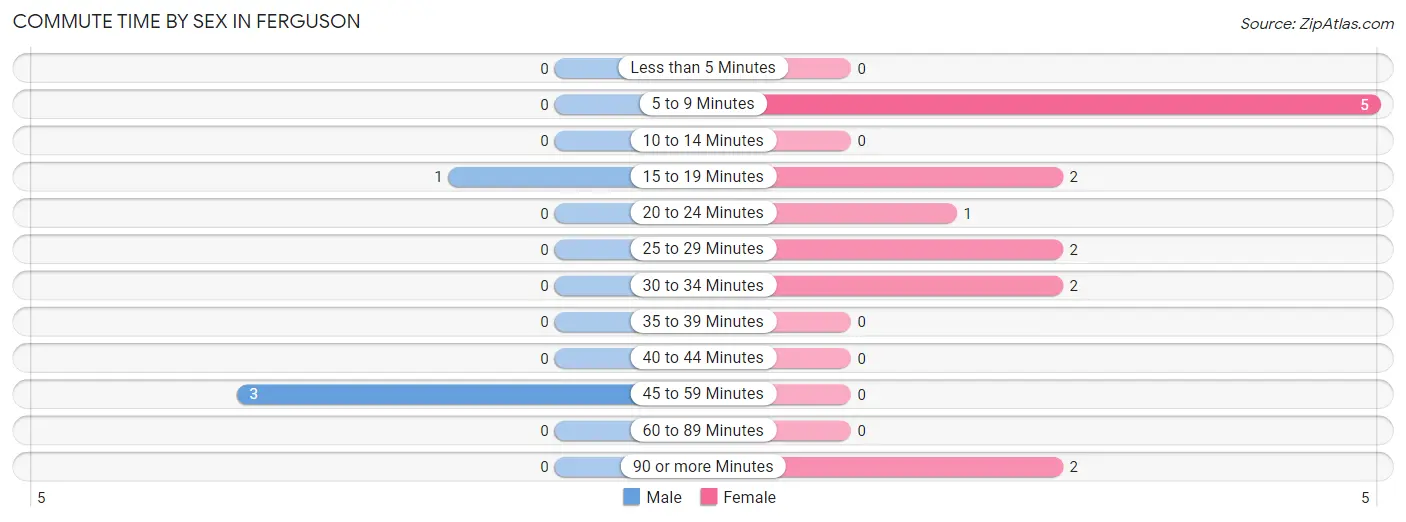
| Commute Time | Male | Female |
| Less than 5 Minutes | 0 (0.0%) | 0 (0.0%) |
| 5 to 9 Minutes | 0 (0.0%) | 5 (35.7%) |
| 10 to 14 Minutes | 0 (0.0%) | 0 (0.0%) |
| 15 to 19 Minutes | 1 (25.0%) | 2 (14.3%) |
| 20 to 24 Minutes | 0 (0.0%) | 1 (7.1%) |
| 25 to 29 Minutes | 0 (0.0%) | 2 (14.3%) |
| 30 to 34 Minutes | 0 (0.0%) | 2 (14.3%) |
| 35 to 39 Minutes | 0 (0.0%) | 0 (0.0%) |
| 40 to 44 Minutes | 0 (0.0%) | 0 (0.0%) |
| 45 to 59 Minutes | 3 (75.0%) | 0 (0.0%) |
| 60 to 89 Minutes | 0 (0.0%) | 0 (0.0%) |
| 90 or more Minutes | 0 (0.0%) | 2 (14.3%) |
Time of Departure to Work by Sex in Ferguson
The most frequent times of departure to work in Ferguson are 12:00 AM to 4:59 AM (4, 100.0%) for males and 7:30 AM to 7:59 AM (7, 50.0%) for females.
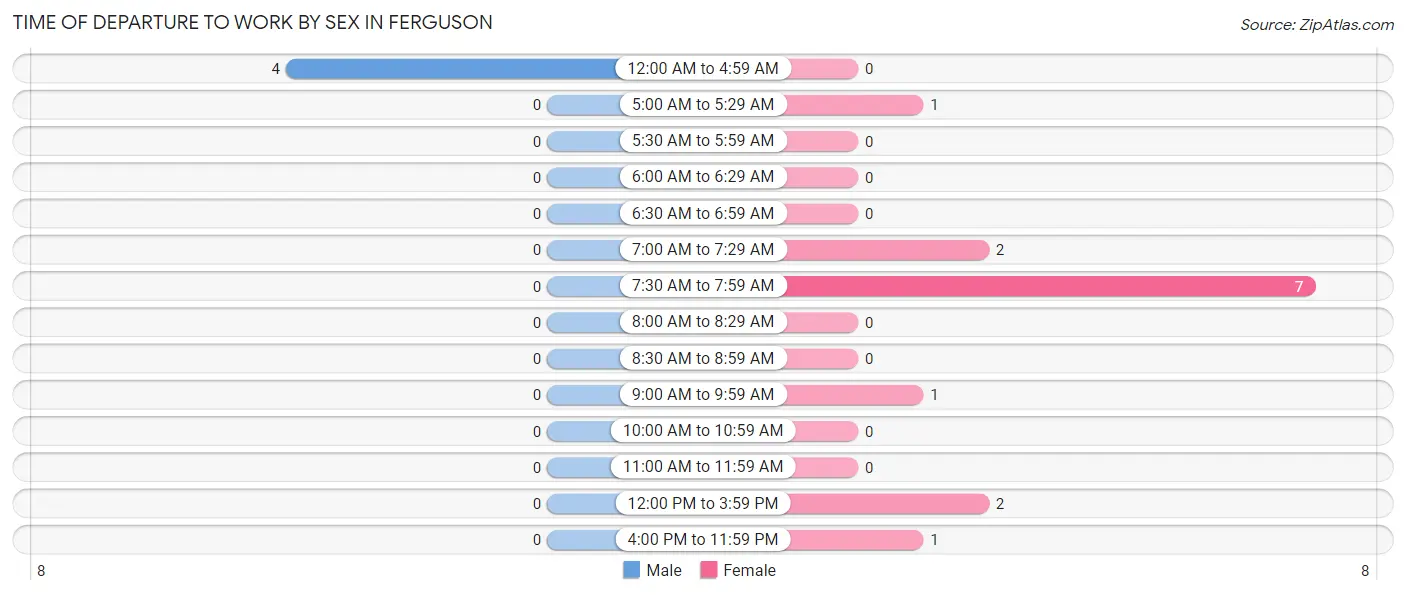
| Time of Departure | Male | Female |
| 12:00 AM to 4:59 AM | 4 (100.0%) | 0 (0.0%) |
| 5:00 AM to 5:29 AM | 0 (0.0%) | 1 (7.1%) |
| 5:30 AM to 5:59 AM | 0 (0.0%) | 0 (0.0%) |
| 6:00 AM to 6:29 AM | 0 (0.0%) | 0 (0.0%) |
| 6:30 AM to 6:59 AM | 0 (0.0%) | 0 (0.0%) |
| 7:00 AM to 7:29 AM | 0 (0.0%) | 2 (14.3%) |
| 7:30 AM to 7:59 AM | 0 (0.0%) | 7 (50.0%) |
| 8:00 AM to 8:29 AM | 0 (0.0%) | 0 (0.0%) |
| 8:30 AM to 8:59 AM | 0 (0.0%) | 0 (0.0%) |
| 9:00 AM to 9:59 AM | 0 (0.0%) | 1 (7.1%) |
| 10:00 AM to 10:59 AM | 0 (0.0%) | 0 (0.0%) |
| 11:00 AM to 11:59 AM | 0 (0.0%) | 0 (0.0%) |
| 12:00 PM to 3:59 PM | 0 (0.0%) | 2 (14.3%) |
| 4:00 PM to 11:59 PM | 0 (0.0%) | 1 (7.1%) |
| Total | 4 (100.0%) | 14 (100.0%) |
Housing Occupancy in Ferguson
Occupancy by Ownership in Ferguson
Of the total 50 dwellings in Ferguson, owner-occupied units account for 37 (74.0%), while renter-occupied units make up 13 (26.0%).
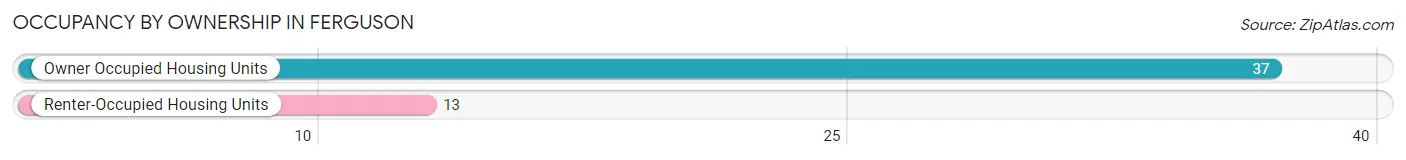
| Occupancy | # Housing Units | % Housing Units |
| Owner Occupied Housing Units | 37 | 74.0% |
| Renter-Occupied Housing Units | 13 | 26.0% |
| Total Occupied Housing Units | 50 | 100.0% |
Occupancy by Household Size in Ferguson
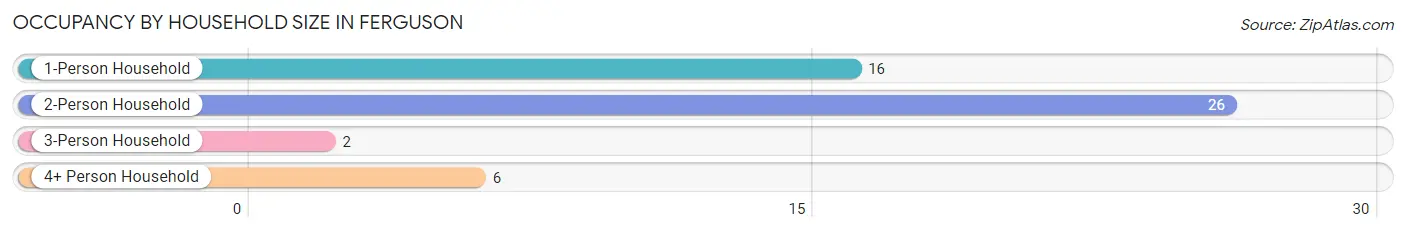
| Household Size | # Housing Units | % Housing Units |
| 1-Person Household | 16 | 32.0% |
| 2-Person Household | 26 | 52.0% |
| 3-Person Household | 2 | 4.0% |
| 4+ Person Household | 6 | 12.0% |
| Total Housing Units | 50 | 100.0% |
Occupancy by Ownership by Household Size in Ferguson
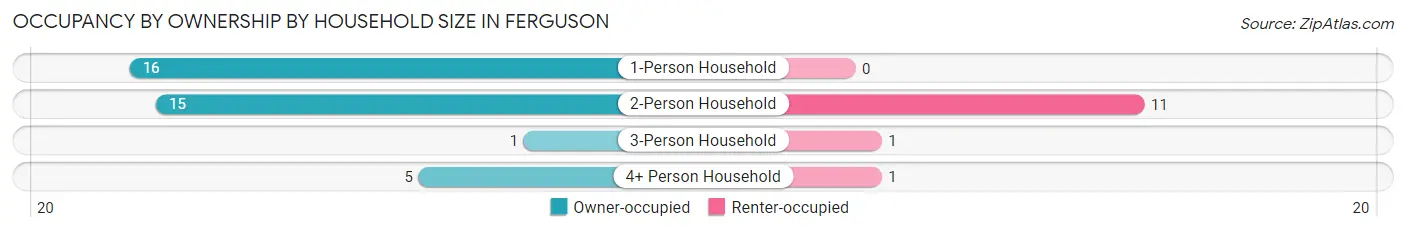
| Household Size | Owner-occupied | Renter-occupied |
| 1-Person Household | 16 (100.0%) | 0 (0.0%) |
| 2-Person Household | 15 (57.7%) | 11 (42.3%) |
| 3-Person Household | 1 (50.0%) | 1 (50.0%) |
| 4+ Person Household | 5 (83.3%) | 1 (16.7%) |
| Total Housing Units | 37 (74.0%) | 13 (26.0%) |
Occupancy by Educational Attainment in Ferguson
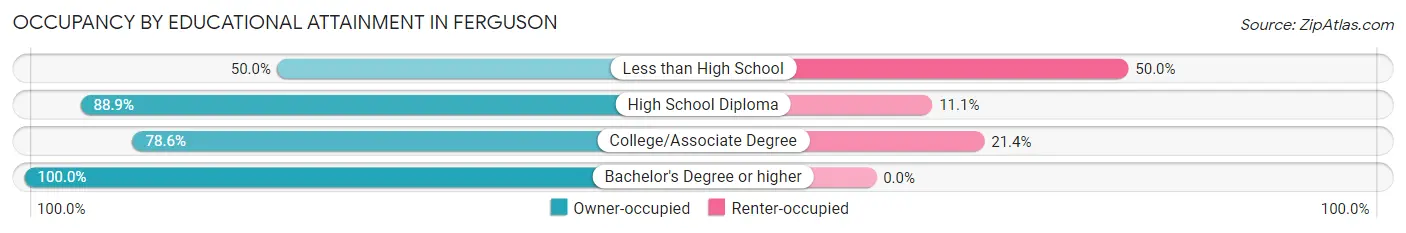
| Household Size | Owner-occupied | Renter-occupied |
| Less than High School | 6 (50.0%) | 6 (50.0%) |
| High School Diploma | 8 (88.9%) | 1 (11.1%) |
| College/Associate Degree | 22 (78.6%) | 6 (21.4%) |
| Bachelor's Degree or higher | 1 (100.0%) | 0 (0.0%) |
Occupancy by Age of Householder in Ferguson
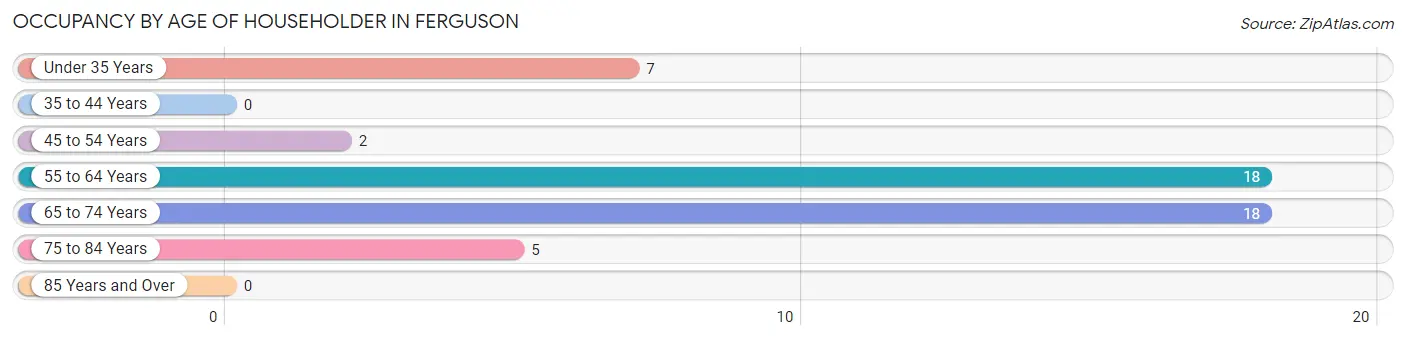
| Age Bracket | # Households | % Households |
| Under 35 Years | 7 | 14.0% |
| 35 to 44 Years | 0 | 0.0% |
| 45 to 54 Years | 2 | 4.0% |
| 55 to 64 Years | 18 | 36.0% |
| 65 to 74 Years | 18 | 36.0% |
| 75 to 84 Years | 5 | 10.0% |
| 85 Years and Over | 0 | 0.0% |
| Total | 50 | 100.0% |
Housing Finances in Ferguson
Median Income by Occupancy in Ferguson
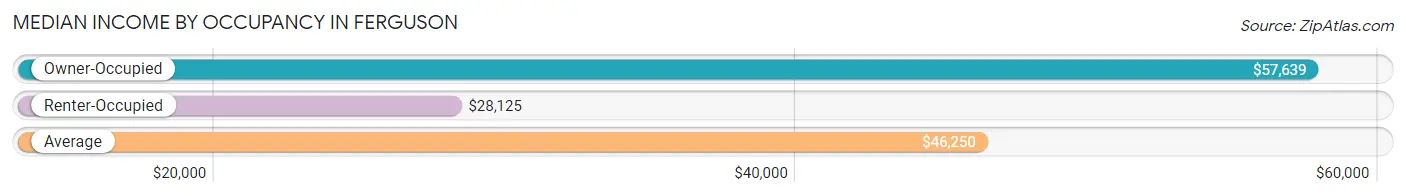
| Occupancy Type | # Households | Median Income |
| Owner-Occupied | 37 (74.0%) | $57,639 |
| Renter-Occupied | 13 (26.0%) | $28,125 |
| Average | 50 (100.0%) | $46,250 |
Occupancy by Householder Income Bracket in Ferguson
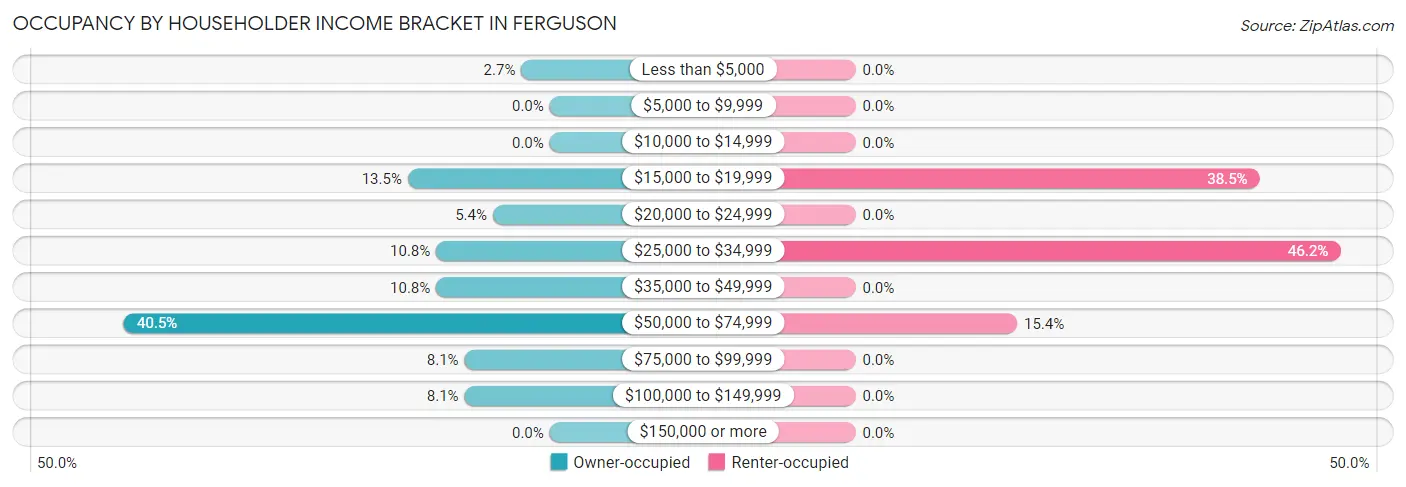
| Income Bracket | Owner-occupied | Renter-occupied |
| Less than $5,000 | 1 (2.7%) | 0 (0.0%) |
| $5,000 to $9,999 | 0 (0.0%) | 0 (0.0%) |
| $10,000 to $14,999 | 0 (0.0%) | 0 (0.0%) |
| $15,000 to $19,999 | 5 (13.5%) | 5 (38.5%) |
| $20,000 to $24,999 | 2 (5.4%) | 0 (0.0%) |
| $25,000 to $34,999 | 4 (10.8%) | 6 (46.2%) |
| $35,000 to $49,999 | 4 (10.8%) | 0 (0.0%) |
| $50,000 to $74,999 | 15 (40.5%) | 2 (15.4%) |
| $75,000 to $99,999 | 3 (8.1%) | 0 (0.0%) |
| $100,000 to $149,999 | 3 (8.1%) | 0 (0.0%) |
| $150,000 or more | 0 (0.0%) | 0 (0.0%) |
| Total | 37 (100.0%) | 13 (100.0%) |
Monthly Housing Cost Tiers in Ferguson
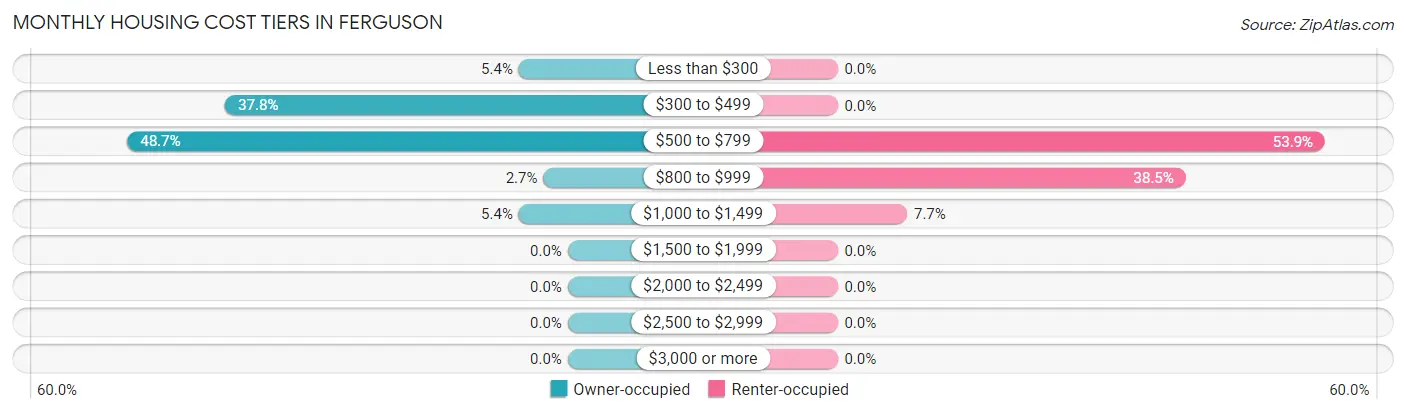
| Monthly Cost | Owner-occupied | Renter-occupied |
| Less than $300 | 2 (5.4%) | 0 (0.0%) |
| $300 to $499 | 14 (37.8%) | 0 (0.0%) |
| $500 to $799 | 18 (48.6%) | 7 (53.8%) |
| $800 to $999 | 1 (2.7%) | 5 (38.5%) |
| $1,000 to $1,499 | 2 (5.4%) | 1 (7.7%) |
| $1,500 to $1,999 | 0 (0.0%) | 0 (0.0%) |
| $2,000 to $2,499 | 0 (0.0%) | 0 (0.0%) |
| $2,500 to $2,999 | 0 (0.0%) | 0 (0.0%) |
| $3,000 or more | 0 (0.0%) | 0 (0.0%) |
| Total | 37 (100.0%) | 13 (100.0%) |
Physical Housing Characteristics in Ferguson
Housing Structures in Ferguson
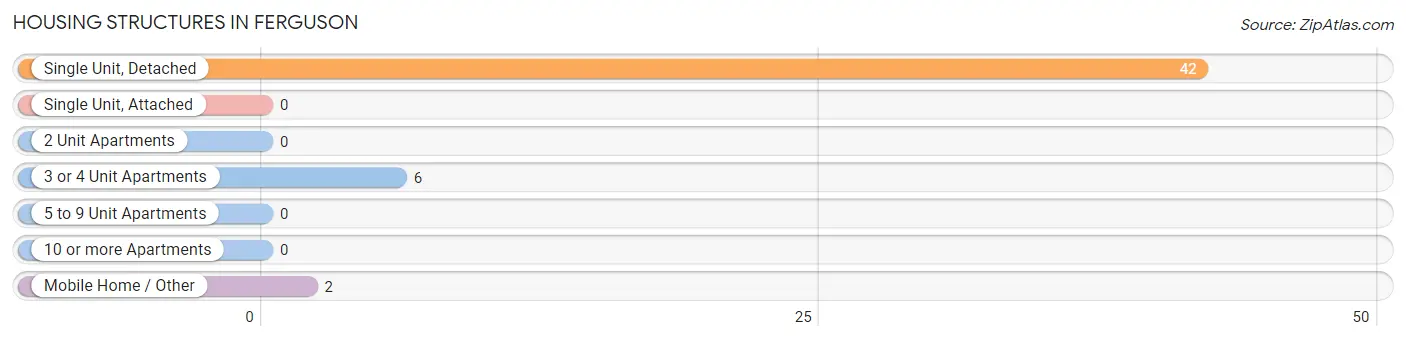
| Structure Type | # Housing Units | % Housing Units |
| Single Unit, Detached | 42 | 84.0% |
| Single Unit, Attached | 0 | 0.0% |
| 2 Unit Apartments | 0 | 0.0% |
| 3 or 4 Unit Apartments | 6 | 12.0% |
| 5 to 9 Unit Apartments | 0 | 0.0% |
| 10 or more Apartments | 0 | 0.0% |
| Mobile Home / Other | 2 | 4.0% |
| Total | 50 | 100.0% |
Housing Structures by Occupancy in Ferguson
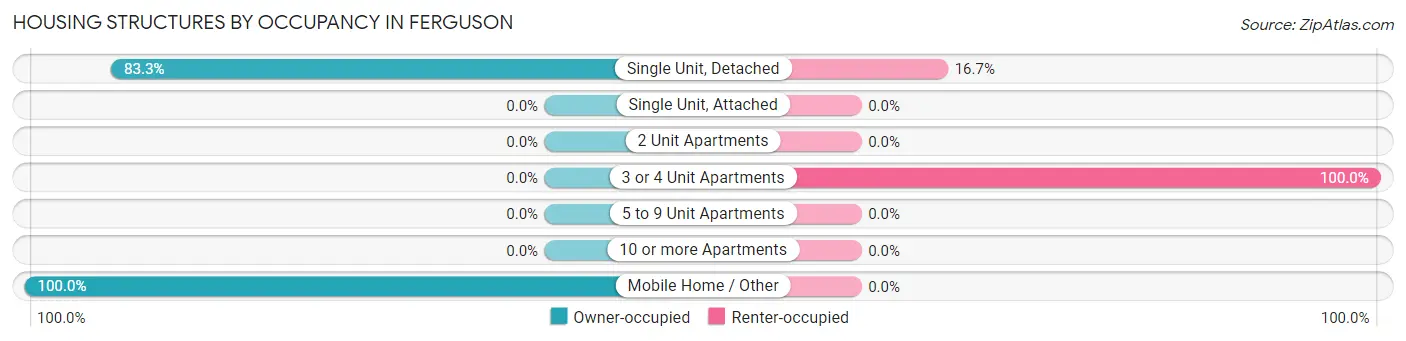
| Structure Type | Owner-occupied | Renter-occupied |
| Single Unit, Detached | 35 (83.3%) | 7 (16.7%) |
| Single Unit, Attached | 0 (0.0%) | 0 (0.0%) |
| 2 Unit Apartments | 0 (0.0%) | 0 (0.0%) |
| 3 or 4 Unit Apartments | 0 (0.0%) | 6 (100.0%) |
| 5 to 9 Unit Apartments | 0 (0.0%) | 0 (0.0%) |
| 10 or more Apartments | 0 (0.0%) | 0 (0.0%) |
| Mobile Home / Other | 2 (100.0%) | 0 (0.0%) |
| Total | 37 (74.0%) | 13 (26.0%) |
Housing Structures by Number of Rooms in Ferguson
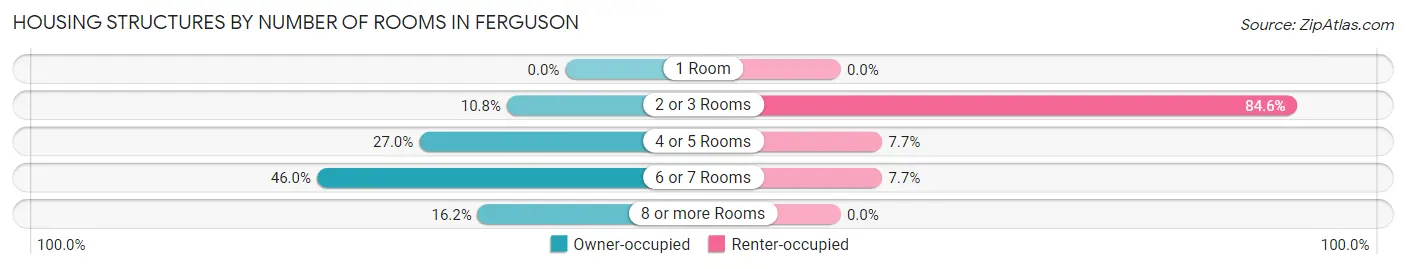
| Number of Rooms | Owner-occupied | Renter-occupied |
| 1 Room | 0 (0.0%) | 0 (0.0%) |
| 2 or 3 Rooms | 4 (10.8%) | 11 (84.6%) |
| 4 or 5 Rooms | 10 (27.0%) | 1 (7.7%) |
| 6 or 7 Rooms | 17 (46.0%) | 1 (7.7%) |
| 8 or more Rooms | 6 (16.2%) | 0 (0.0%) |
| Total | 37 (100.0%) | 13 (100.0%) |
Housing Structure by Heating Type in Ferguson
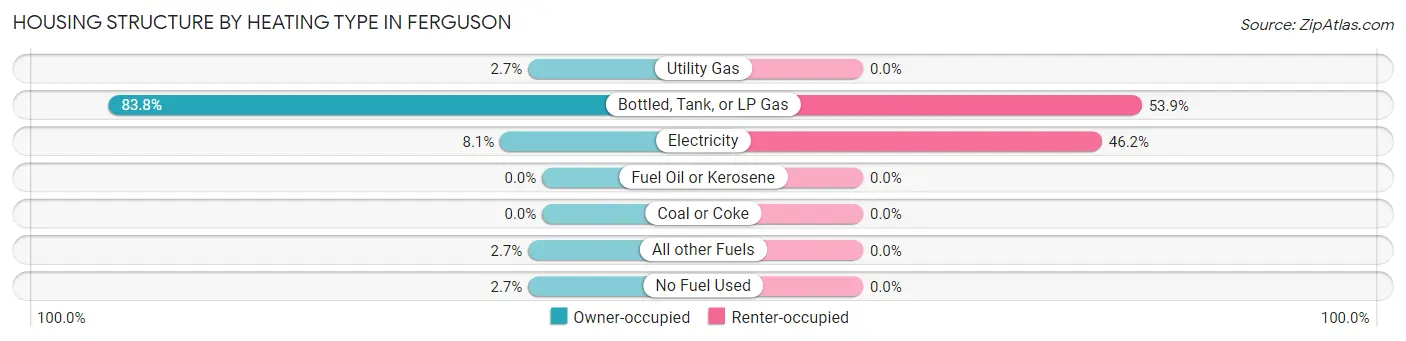
| Heating Type | Owner-occupied | Renter-occupied |
| Utility Gas | 1 (2.7%) | 0 (0.0%) |
| Bottled, Tank, or LP Gas | 31 (83.8%) | 7 (53.8%) |
| Electricity | 3 (8.1%) | 6 (46.2%) |
| Fuel Oil or Kerosene | 0 (0.0%) | 0 (0.0%) |
| Coal or Coke | 0 (0.0%) | 0 (0.0%) |
| All other Fuels | 1 (2.7%) | 0 (0.0%) |
| No Fuel Used | 1 (2.7%) | 0 (0.0%) |
| Total | 37 (100.0%) | 13 (100.0%) |
Household Vehicle Usage in Ferguson
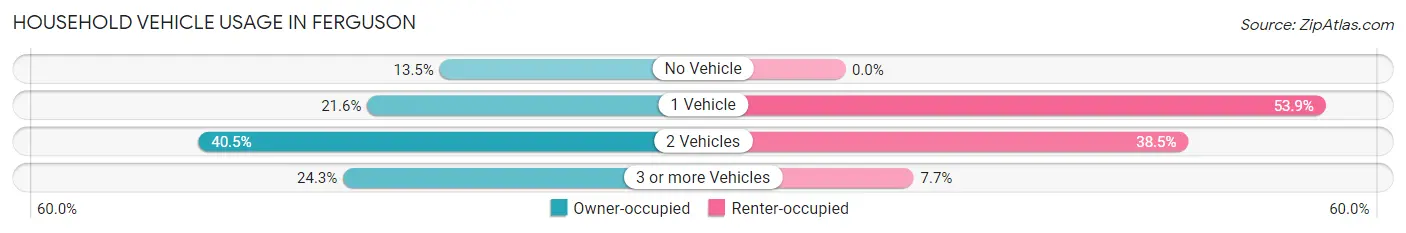
| Vehicles per Household | Owner-occupied | Renter-occupied |
| No Vehicle | 5 (13.5%) | 0 (0.0%) |
| 1 Vehicle | 8 (21.6%) | 7 (53.8%) |
| 2 Vehicles | 15 (40.5%) | 5 (38.5%) |
| 3 or more Vehicles | 9 (24.3%) | 1 (7.7%) |
| Total | 37 (100.0%) | 13 (100.0%) |
Real Estate & Mortgages in Ferguson
Real Estate and Mortgage Overview in Ferguson
| Characteristic | Without Mortgage | With Mortgage |
| Housing Units | 32 | 5 |
| Median Property Value | - | - |
| Median Household Income | $55,000 | $0 |
| Monthly Housing Costs | $500 | $0 |
| Real Estate Taxes | - | - |
Property Value by Mortgage Status in Ferguson
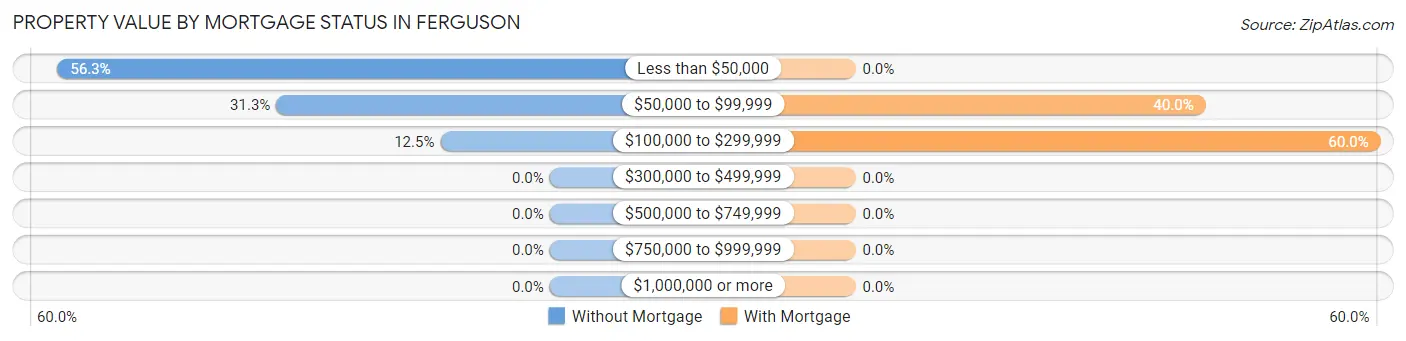
| Property Value | Without Mortgage | With Mortgage |
| Less than $50,000 | 18 (56.2%) | 0 (0.0%) |
| $50,000 to $99,999 | 10 (31.2%) | 2 (40.0%) |
| $100,000 to $299,999 | 4 (12.5%) | 3 (60.0%) |
| $300,000 to $499,999 | 0 (0.0%) | 0 (0.0%) |
| $500,000 to $749,999 | 0 (0.0%) | 0 (0.0%) |
| $750,000 to $999,999 | 0 (0.0%) | 0 (0.0%) |
| $1,000,000 or more | 0 (0.0%) | 0 (0.0%) |
| Total | 32 (100.0%) | 5 (100.0%) |
Household Income by Mortgage Status in Ferguson
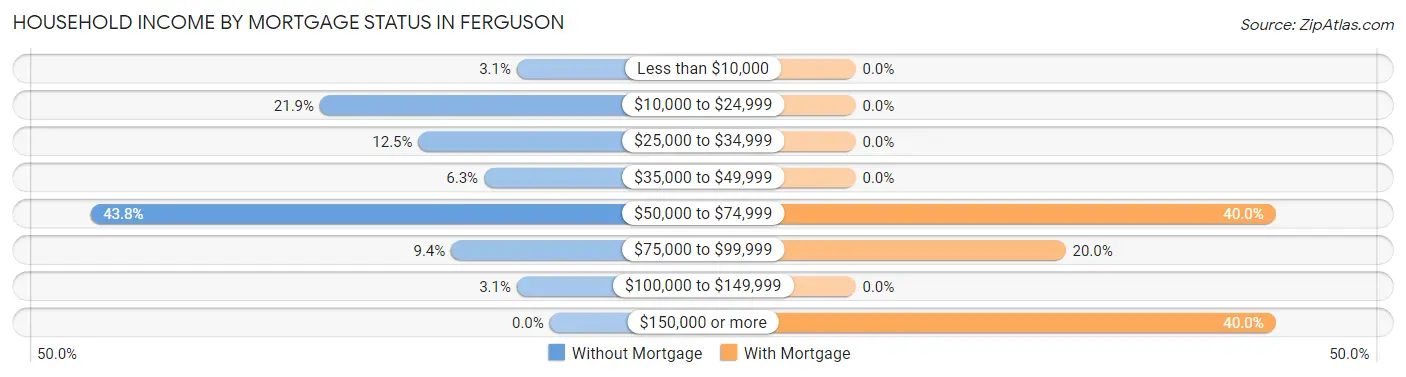
| Household Income | Without Mortgage | With Mortgage |
| Less than $10,000 | 1 (3.1%) | 0 (0.0%) |
| $10,000 to $24,999 | 7 (21.9%) | 0 (0.0%) |
| $25,000 to $34,999 | 4 (12.5%) | 0 (0.0%) |
| $35,000 to $49,999 | 2 (6.2%) | 0 (0.0%) |
| $50,000 to $74,999 | 14 (43.8%) | 2 (40.0%) |
| $75,000 to $99,999 | 3 (9.4%) | 1 (20.0%) |
| $100,000 to $149,999 | 1 (3.1%) | 0 (0.0%) |
| $150,000 or more | 0 (0.0%) | 2 (40.0%) |
| Total | 32 (100.0%) | 5 (100.0%) |
Property Value to Household Income Ratio in Ferguson
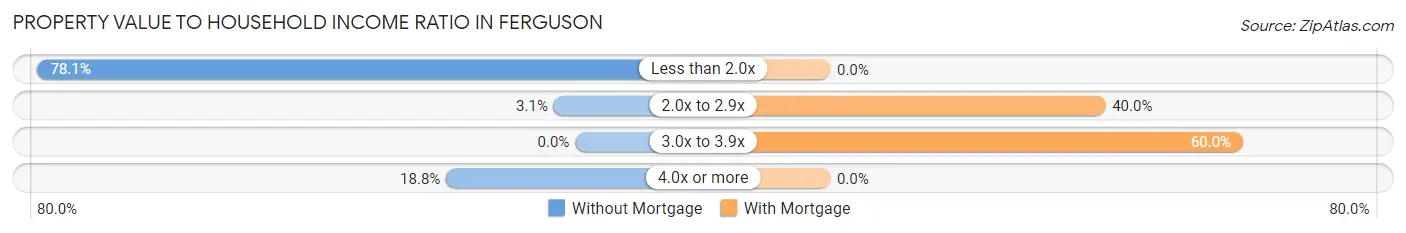
| Value-to-Income Ratio | Without Mortgage | With Mortgage |
| Less than 2.0x | 25 (78.1%) | 0 (0.0%) |
| 2.0x to 2.9x | 1 (3.1%) | 2 (40.0%) |
| 3.0x to 3.9x | 0 (0.0%) | 3 (60.0%) |
| 4.0x or more | 6 (18.8%) | 0 (0.0%) |
| Total | 32 (100.0%) | 5 (100.0%) |
Real Estate Taxes by Mortgage Status in Ferguson
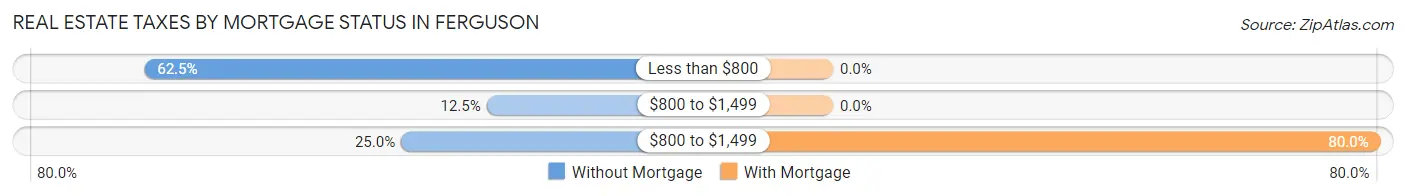
| Property Taxes | Without Mortgage | With Mortgage |
| Less than $800 | 20 (62.5%) | 0 (0.0%) |
| $800 to $1,499 | 4 (12.5%) | 0 (0.0%) |
| $800 to $1,499 | 8 (25.0%) | 4 (80.0%) |
| Total | 32 (100.0%) | 5 (100.0%) |
Health & Disability in Ferguson
Health Insurance Coverage by Age in Ferguson
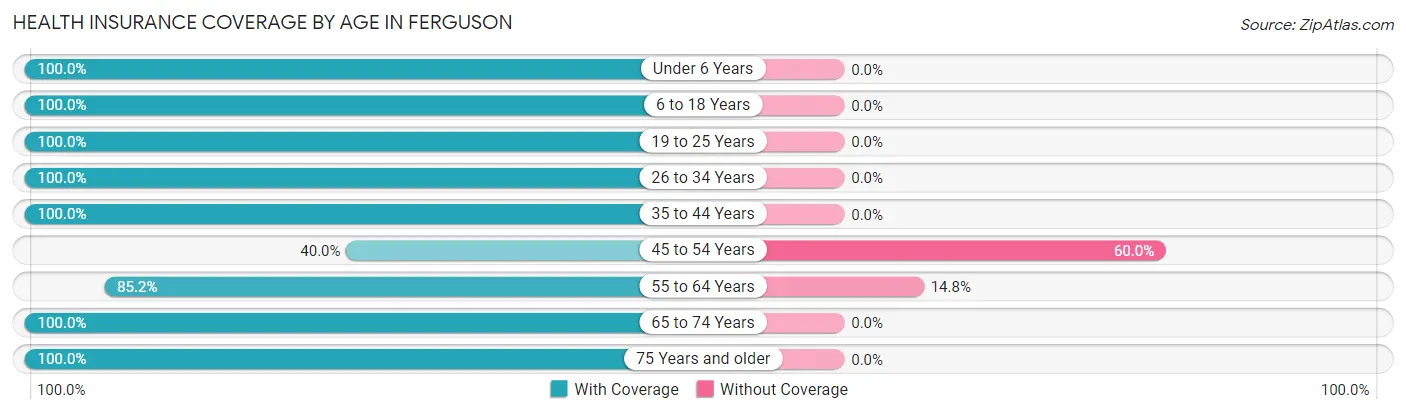
| Age Bracket | With Coverage | Without Coverage |
| Under 6 Years | 5 (100.0%) | 0 (0.0%) |
| 6 to 18 Years | 7 (100.0%) | 0 (0.0%) |
| 19 to 25 Years | 1 (100.0%) | 0 (0.0%) |
| 26 to 34 Years | 15 (100.0%) | 0 (0.0%) |
| 35 to 44 Years | 2 (100.0%) | 0 (0.0%) |
| 45 to 54 Years | 4 (40.0%) | 6 (60.0%) |
| 55 to 64 Years | 23 (85.2%) | 4 (14.8%) |
| 65 to 74 Years | 26 (100.0%) | 0 (0.0%) |
| 75 Years and older | 9 (100.0%) | 0 (0.0%) |
| Total | 92 (90.2%) | 10 (9.8%) |
Health Insurance Coverage by Citizenship Status in Ferguson
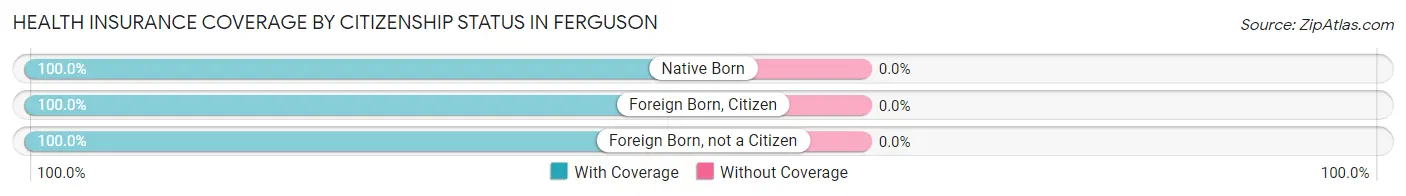
| Citizenship Status | With Coverage | Without Coverage |
| Native Born | 5 (100.0%) | 0 (0.0%) |
| Foreign Born, Citizen | 7 (100.0%) | 0 (0.0%) |
| Foreign Born, not a Citizen | 1 (100.0%) | 0 (0.0%) |
Health Insurance Coverage by Household Income in Ferguson
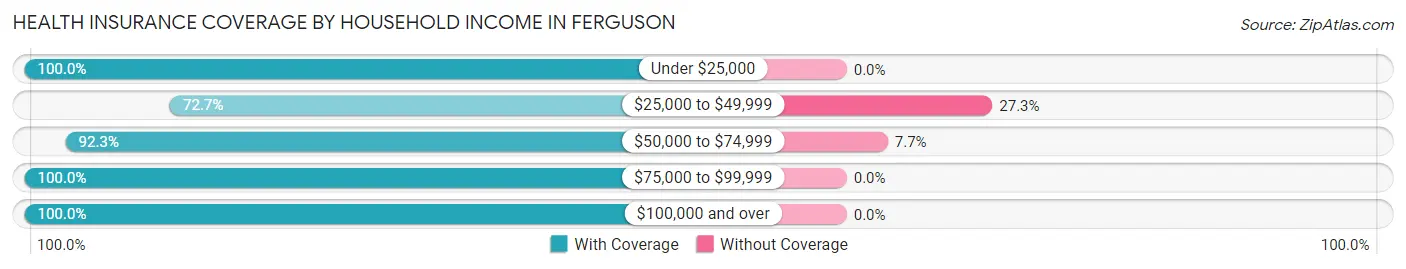
| Household Income | With Coverage | Without Coverage |
| Under $25,000 | 16 (100.0%) | 0 (0.0%) |
| $25,000 to $49,999 | 16 (72.7%) | 6 (27.3%) |
| $50,000 to $74,999 | 48 (92.3%) | 4 (7.7%) |
| $75,000 to $99,999 | 7 (100.0%) | 0 (0.0%) |
| $100,000 and over | 5 (100.0%) | 0 (0.0%) |
Public vs Private Health Insurance Coverage by Age in Ferguson
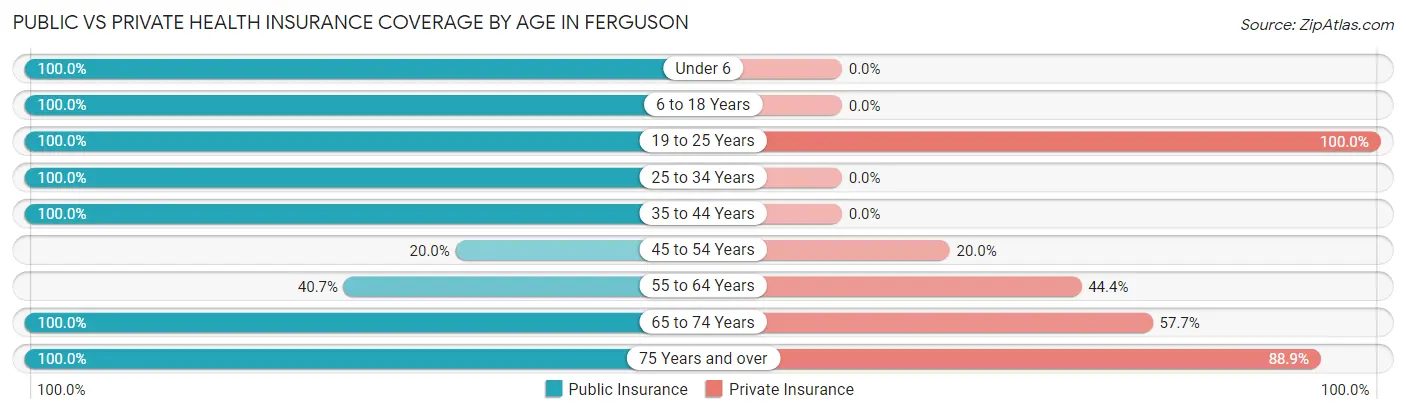
| Age Bracket | Public Insurance | Private Insurance |
| Under 6 | 5 (100.0%) | 0 (0.0%) |
| 6 to 18 Years | 7 (100.0%) | 0 (0.0%) |
| 19 to 25 Years | 1 (100.0%) | 1 (100.0%) |
| 25 to 34 Years | 15 (100.0%) | 0 (0.0%) |
| 35 to 44 Years | 2 (100.0%) | 0 (0.0%) |
| 45 to 54 Years | 2 (20.0%) | 2 (20.0%) |
| 55 to 64 Years | 11 (40.7%) | 12 (44.4%) |
| 65 to 74 Years | 26 (100.0%) | 15 (57.7%) |
| 75 Years and over | 9 (100.0%) | 8 (88.9%) |
| Total | 78 (76.5%) | 38 (37.2%) |
Disability Status by Sex by Age in Ferguson
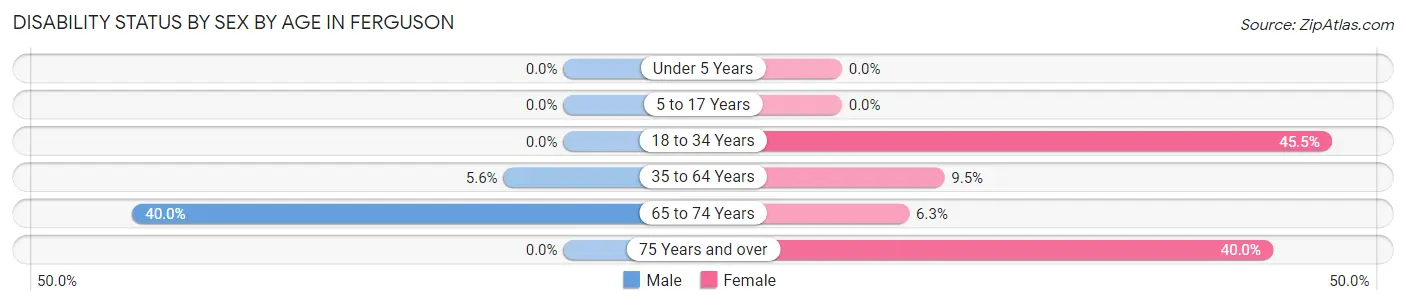
| Age Bracket | Male | Female |
| Under 5 Years | 0 (0.0%) | 0 (0.0%) |
| 5 to 17 Years | 0 (0.0%) | 0 (0.0%) |
| 18 to 34 Years | 0 (0.0%) | 5 (45.5%) |
| 35 to 64 Years | 1 (5.6%) | 2 (9.5%) |
| 65 to 74 Years | 4 (40.0%) | 1 (6.2%) |
| 75 Years and over | 0 (0.0%) | 2 (40.0%) |
Disability Class by Sex by Age in Ferguson
Disability Class: Hearing Difficulty
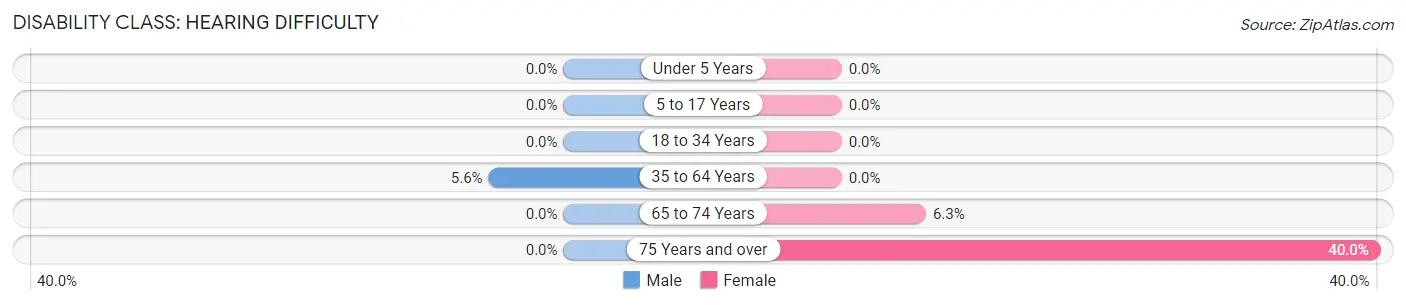
| Age Bracket | Male | Female |
| Under 5 Years | 0 (0.0%) | 0 (0.0%) |
| 5 to 17 Years | 0 (0.0%) | 0 (0.0%) |
| 18 to 34 Years | 0 (0.0%) | 0 (0.0%) |
| 35 to 64 Years | 1 (5.6%) | 0 (0.0%) |
| 65 to 74 Years | 0 (0.0%) | 1 (6.2%) |
| 75 Years and over | 0 (0.0%) | 2 (40.0%) |
Disability Class: Vision Difficulty
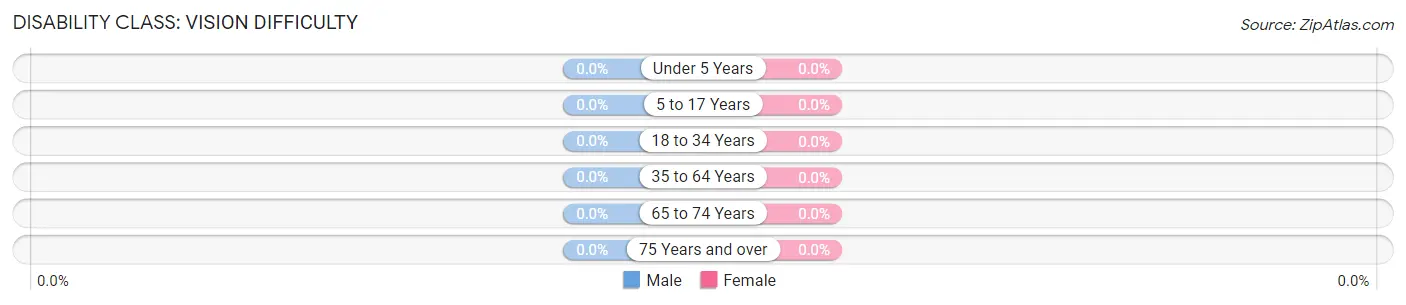
| Age Bracket | Male | Female |
| Under 5 Years | 0 (0.0%) | 0 (0.0%) |
| 5 to 17 Years | 0 (0.0%) | 0 (0.0%) |
| 18 to 34 Years | 0 (0.0%) | 0 (0.0%) |
| 35 to 64 Years | 0 (0.0%) | 0 (0.0%) |
| 65 to 74 Years | 0 (0.0%) | 0 (0.0%) |
| 75 Years and over | 0 (0.0%) | 0 (0.0%) |
Disability Class: Cognitive Difficulty
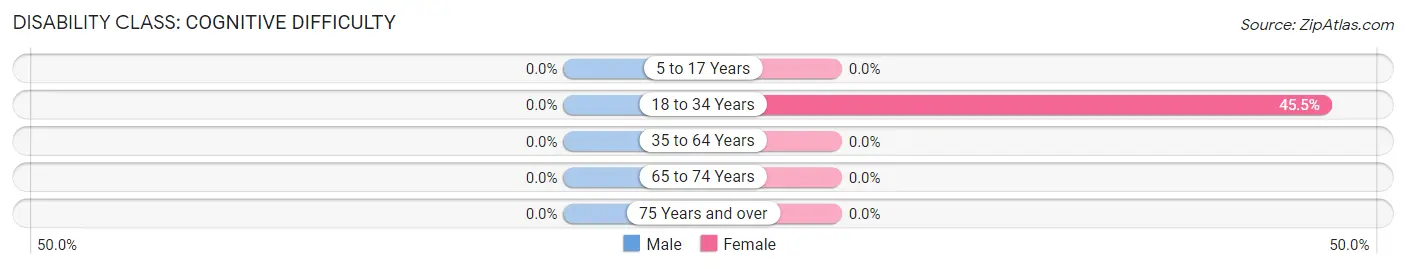
| Age Bracket | Male | Female |
| 5 to 17 Years | 0 (0.0%) | 0 (0.0%) |
| 18 to 34 Years | 0 (0.0%) | 5 (45.5%) |
| 35 to 64 Years | 0 (0.0%) | 0 (0.0%) |
| 65 to 74 Years | 0 (0.0%) | 0 (0.0%) |
| 75 Years and over | 0 (0.0%) | 0 (0.0%) |
Disability Class: Ambulatory Difficulty
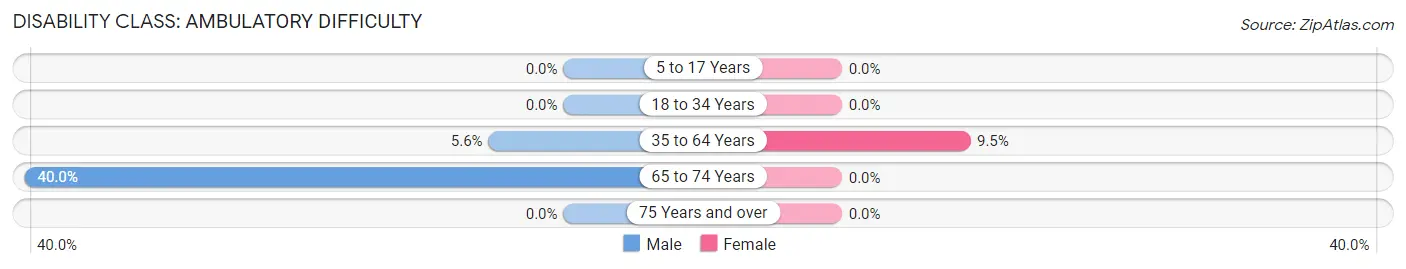
| Age Bracket | Male | Female |
| 5 to 17 Years | 0 (0.0%) | 0 (0.0%) |
| 18 to 34 Years | 0 (0.0%) | 0 (0.0%) |
| 35 to 64 Years | 1 (5.6%) | 2 (9.5%) |
| 65 to 74 Years | 4 (40.0%) | 0 (0.0%) |
| 75 Years and over | 0 (0.0%) | 0 (0.0%) |
Disability Class: Self-Care Difficulty
| Age Bracket | Male | Female |
| 5 to 17 Years | 0 (0.0%) | 0 (0.0%) |
| 18 to 34 Years | 0 (0.0%) | 0 (0.0%) |
| 35 to 64 Years | 0 (0.0%) | 0 (0.0%) |
| 65 to 74 Years | 0 (0.0%) | 0 (0.0%) |
| 75 Years and over | 0 (0.0%) | 0 (0.0%) |
Technology Access in Ferguson
Computing Device Access in Ferguson
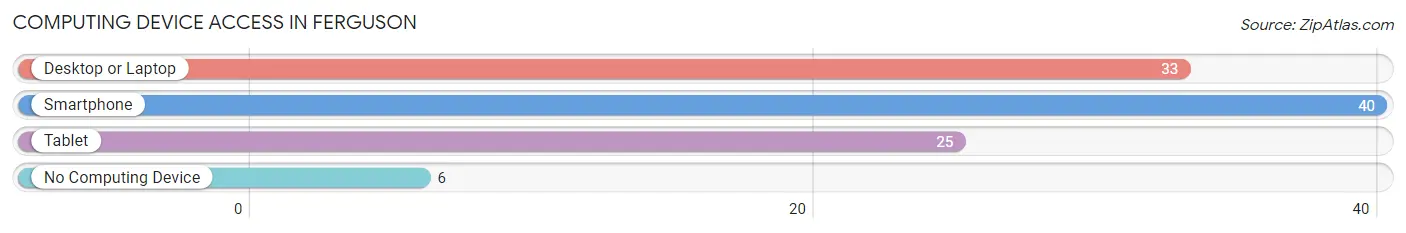
| Device Type | # Households | % Households |
| Desktop or Laptop | 33 | 66.0% |
| Smartphone | 40 | 80.0% |
| Tablet | 25 | 50.0% |
| No Computing Device | 6 | 12.0% |
| Total | 50 | 100.0% |
Internet Access in Ferguson
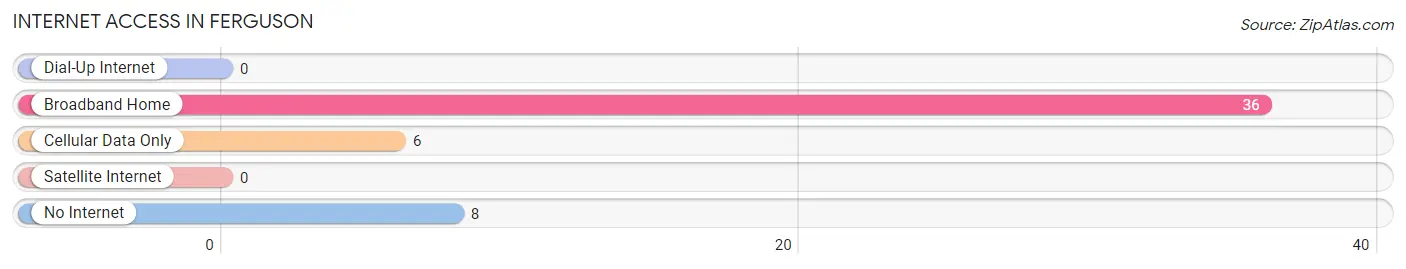
| Internet Type | # Households | % Households |
| Dial-Up Internet | 0 | 0.0% |
| Broadband Home | 36 | 72.0% |
| Cellular Data Only | 6 | 12.0% |
| Satellite Internet | 0 | 0.0% |
| No Internet | 8 | 16.0% |
| Total | 50 | 100.0% |
Ferguson Summary
Ferguson, Iowa is a small town located in the southeastern corner of the state, in the county of Lee. It is situated on the banks of the Mississippi River, and is home to a population of just over 1,000 people. The town was founded in 1837, and has a rich history of industry, agriculture, and culture.
Geography
Ferguson is located in the southeastern corner of Iowa, in Lee County. It is situated on the banks of the Mississippi River, and is bordered by the towns of Fort Madison, Donnellson, and Montrose. The town is located in the Loess Hills region of Iowa, and is characterized by rolling hills and fertile soil. The town is located at an elevation of 645 feet above sea level.
Economy
Ferguson’s economy is largely based on agriculture and manufacturing. The town is home to several large farms, which produce a variety of crops, including corn, soybeans, and wheat. The town is also home to several manufacturing companies, which produce a variety of products, including furniture, automotive parts, and agricultural equipment. In addition, the town is home to several small businesses, including restaurants, retail stores, and service providers.
Demographics
As of the 2010 census, the population of Ferguson was 1,039. The racial makeup of the town was 97.2% White, 0.7% African American, 0.3% Native American, 0.2% Asian, 0.1% Pacific Islander, 0.4% from other races, and 1.1% from two or more races. Hispanic or Latino of any race were 1.2% of the population.
The median income for a household in Ferguson was $41,250, and the median income for a family was $48,750. Males had a median income of $35,000 versus $25,000 for females. The per capita income for the town was $19,845. About 8.2% of families and 10.2% of the population were below the poverty line, including 14.3% of those under age 18 and 8.3% of those age 65 or over.
History
Ferguson was founded in 1837 by a group of settlers from Ohio. The town was named after a local landowner, William Ferguson. The town quickly grew, and by the late 19th century, it was a thriving agricultural and industrial center. The town was home to several large farms, as well as several manufacturing companies.
In the early 20th century, the town was home to a large number of immigrants, primarily from Germany and Ireland. These immigrants brought with them their culture and traditions, which still influence the town today.
In the late 20th century, the town experienced a decline in population, as many of its residents moved away in search of better economic opportunities. However, the town has seen a resurgence in recent years, as new businesses have opened and the population has grown.
Today, Ferguson is a small but vibrant town, with a rich history and culture. It is home to a diverse population, and is a great place to live and work.
Common Questions
What is Per Capita Income in Ferguson?
Per Capita income in Ferguson is $22,757.
What is the Median Family Income in Ferguson?
Median Family Income in Ferguson is $51,667.
What is the Median Household income in Ferguson?
Median Household Income in Ferguson is $46,250.
What is Inequality or Gini Index in Ferguson?
Inequality or Gini Index in Ferguson is 0.32.
What is the Total Population of Ferguson?
Total Population of Ferguson is 102.
What is the Total Male Population of Ferguson?
Total Male Population of Ferguson is 43.
What is the Total Female Population of Ferguson?
Total Female Population of Ferguson is 59.
What is the Ratio of Males per 100 Females in Ferguson?
There are 72.88 Males per 100 Females in Ferguson.
What is the Ratio of Females per 100 Males in Ferguson?
There are 137.21 Females per 100 Males in Ferguson.
What is the Median Population Age in Ferguson?
Median Population Age in Ferguson is 56.5 Years.
What is the Average Family Size in Ferguson
Average Family Size in Ferguson is 2.5 People.
What is the Average Household Size in Ferguson
Average Household Size in Ferguson is 2.0 People.
How Large is the Labor Force in Ferguson?
There are 28 People in the Labor Forcein in Ferguson.
What is the Percentage of People in the Labor Force in Ferguson?
31.1% of People are in the Labor Force in Ferguson.
What is the Unemployment Rate in Ferguson?
Unemployment Rate in Ferguson is 32.1%.