Palmer, IA Map & Demographics
Palmer Map
Palmer Overview
$38,732
PER CAPITA INCOME
$67,917
AVG FAMILY INCOME
$58,542
AVG HOUSEHOLD INCOME
47.2%
WAGE / INCOME GAP [ % ]
52.8¢/ $1
WAGE / INCOME GAP [ $ ]
0.35
INEQUALITY / GINI INDEX
127
TOTAL POPULATION
67
MALE POPULATION
60
FEMALE POPULATION
111.67
MALES / 100 FEMALES
89.55
FEMALES / 100 MALES
52.3
MEDIAN AGE
2.9
AVG FAMILY SIZE
1.7
AVG HOUSEHOLD SIZE
61
LABOR FORCE [ PEOPLE ]
56.5%
PERCENT IN LABOR FORCE
1.6%
UNEMPLOYMENT RATE
Palmer Zip Codes
Palmer Area Codes
Income in Palmer
Income Overview in Palmer
Per Capita Income in Palmer is $38,732, while median incomes of families and households are $67,917 and $58,542 respectively.
| Characteristic | Number | Measure |
| Per Capita Income | 127 | $38,732 |
| Median Family Income | 27 | $67,917 |
| Mean Family Income | 27 | $65,785 |
| Median Household Income | 75 | $58,542 |
| Mean Household Income | 75 | $64,697 |
| Income Deficit | 27 | $0 |
| Wage / Income Gap (%) | 127 | 47.18% |
| Wage / Income Gap ($) | 127 | 52.82¢ per $1 |
| Gini / Inequality Index | 127 | 0.35 |
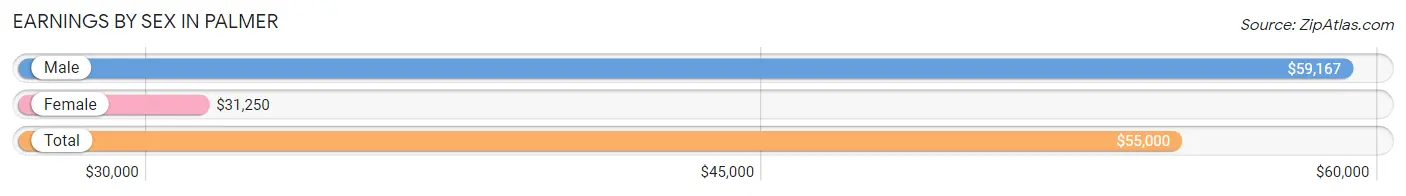
Earnings by Sex in Palmer
Average Earnings in Palmer are $55,000, $59,167 for men and $31,250 for women, a difference of 47.2%.
| Sex | Number | Average Earnings |
| Male | 46 (67.6%) | $59,167 |
| Female | 22 (32.4%) | $31,250 |
| Total | 68 (100.0%) | $55,000 |
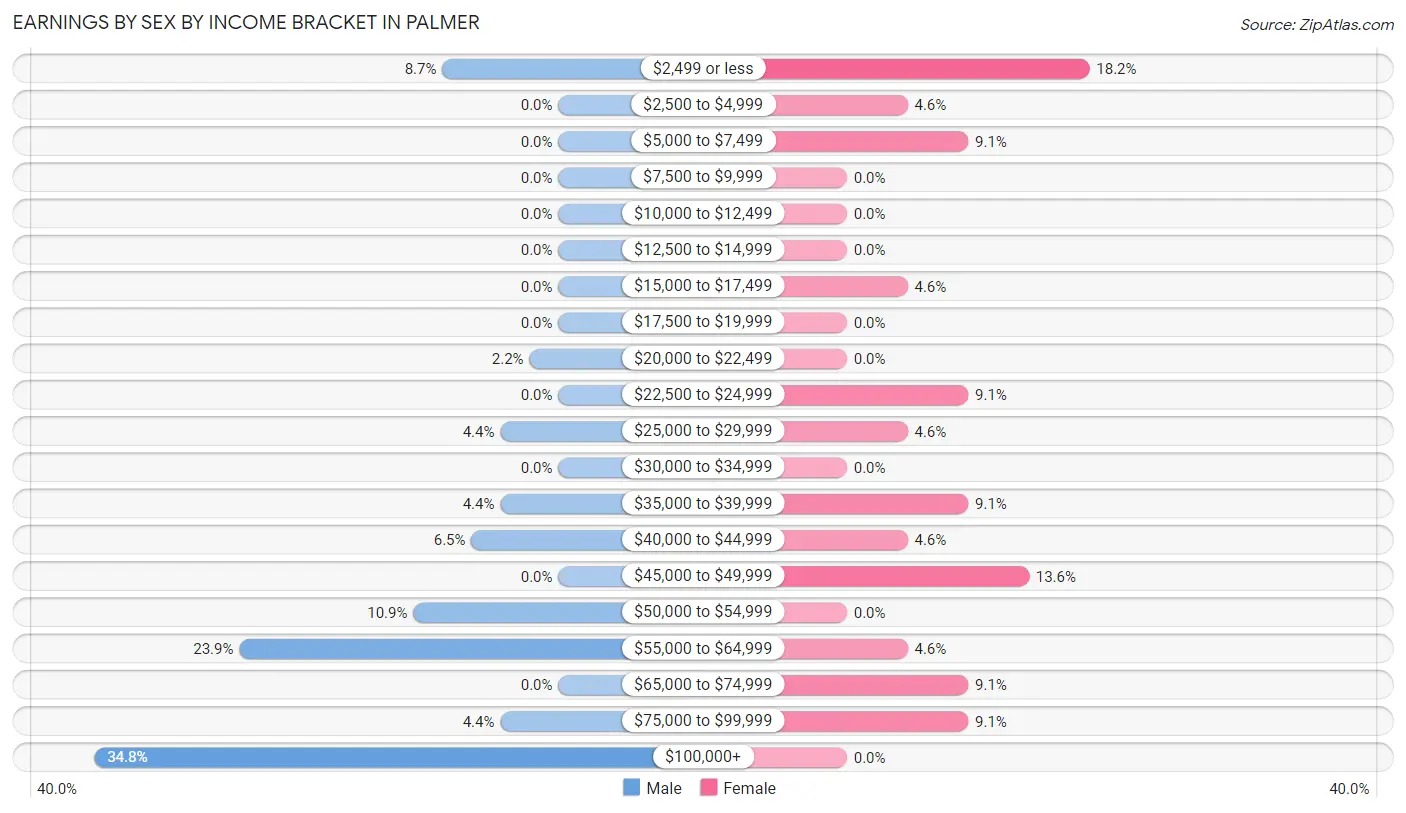
Earnings by Sex by Income Bracket in Palmer
The most common earnings brackets in Palmer are $100,000+ for men (16 | 34.8%) and $2,499 or less for women (4 | 18.2%).
| Income | Male | Female |
| $2,499 or less | 4 (8.7%) | 4 (18.2%) |
| $2,500 to $4,999 | 0 (0.0%) | 1 (4.5%) |
| $5,000 to $7,499 | 0 (0.0%) | 2 (9.1%) |
| $7,500 to $9,999 | 0 (0.0%) | 0 (0.0%) |
| $10,000 to $12,499 | 0 (0.0%) | 0 (0.0%) |
| $12,500 to $14,999 | 0 (0.0%) | 0 (0.0%) |
| $15,000 to $17,499 | 0 (0.0%) | 1 (4.5%) |
| $17,500 to $19,999 | 0 (0.0%) | 0 (0.0%) |
| $20,000 to $22,499 | 1 (2.2%) | 0 (0.0%) |
| $22,500 to $24,999 | 0 (0.0%) | 2 (9.1%) |
| $25,000 to $29,999 | 2 (4.3%) | 1 (4.5%) |
| $30,000 to $34,999 | 0 (0.0%) | 0 (0.0%) |
| $35,000 to $39,999 | 2 (4.3%) | 2 (9.1%) |
| $40,000 to $44,999 | 3 (6.5%) | 1 (4.5%) |
| $45,000 to $49,999 | 0 (0.0%) | 3 (13.6%) |
| $50,000 to $54,999 | 5 (10.9%) | 0 (0.0%) |
| $55,000 to $64,999 | 11 (23.9%) | 1 (4.5%) |
| $65,000 to $74,999 | 0 (0.0%) | 2 (9.1%) |
| $75,000 to $99,999 | 2 (4.3%) | 2 (9.1%) |
| $100,000+ | 16 (34.8%) | 0 (0.0%) |
| Total | 46 (100.0%) | 22 (100.0%) |
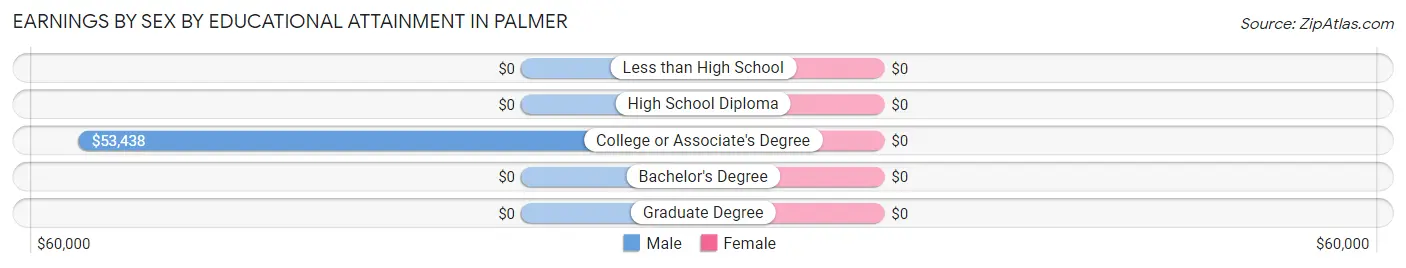
Earnings by Sex by Educational Attainment in Palmer
| Educational Attainment | Male Income | Female Income |
| Less than High School | - | - |
| High School Diploma | - | - |
| College or Associate's Degree | $53,438 | $0 |
| Bachelor's Degree | - | - |
| Graduate Degree | - | - |
| Total | $61,250 | $35,625 |
Family Income in Palmer
Family Income Brackets in Palmer
According to the Palmer family income data, there are 8 families falling into the $50,000 to $74,999 income range, which is the most common income bracket and makes up 29.6% of all families.
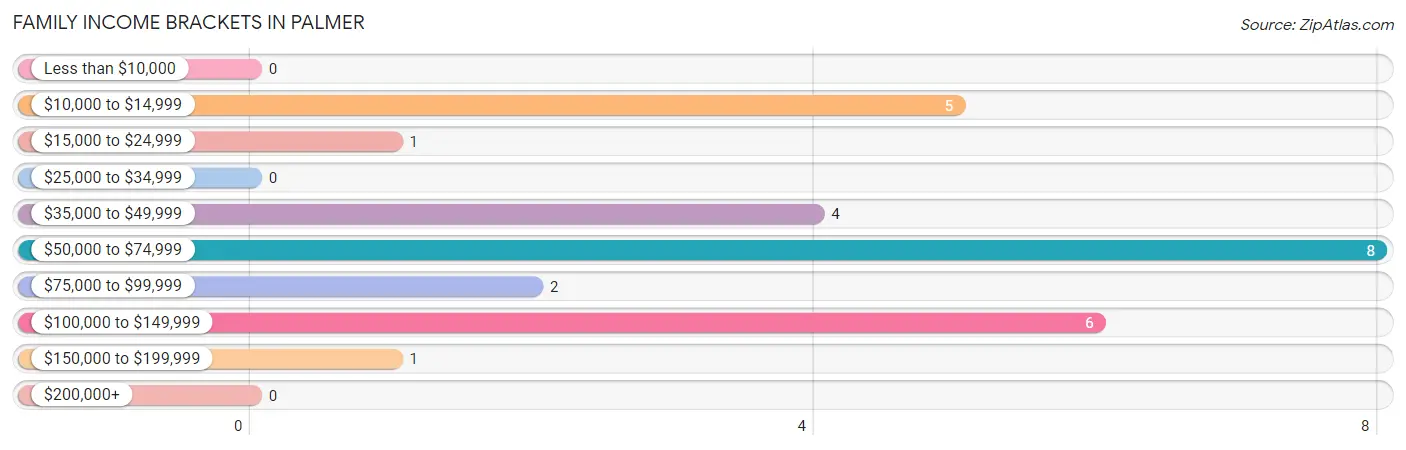
| Income Bracket | # Families | % Families |
| Less than $10,000 | 0 | 0.0% |
| $10,000 to $14,999 | 5 | 18.5% |
| $15,000 to $24,999 | 1 | 3.7% |
| $25,000 to $34,999 | 0 | 0.0% |
| $35,000 to $49,999 | 4 | 14.8% |
| $50,000 to $74,999 | 8 | 29.6% |
| $75,000 to $99,999 | 2 | 7.4% |
| $100,000 to $149,999 | 6 | 22.2% |
| $150,000 to $199,999 | 1 | 3.7% |
| $200,000+ | 0 | 0.0% |
Family Income by Famaliy Size in Palmer
2-person families (17 | 63.0%) account for the highest median family income in Palmer with $83,750 per family, while 2-person families (17 | 63.0%) have the highest median income of $41,875 per family member.
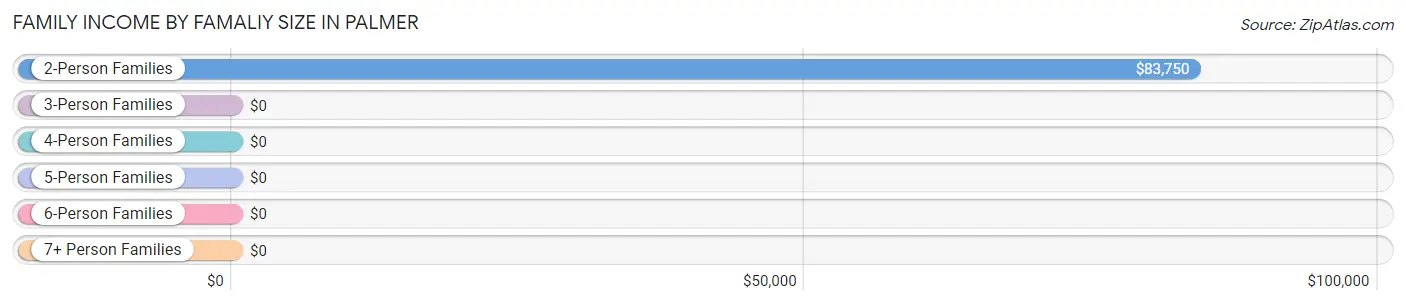
| Income Bracket | # Families | Median Income |
| 2-Person Families | 17 (63.0%) | $83,750 |
| 3-Person Families | 5 (18.5%) | $0 |
| 4-Person Families | 2 (7.4%) | $0 |
| 5-Person Families | 3 (11.1%) | $0 |
| 6-Person Families | 0 (0.0%) | $0 |
| 7+ Person Families | 0 (0.0%) | $0 |
| Total | 27 (100.0%) | $67,917 |
Family Income by Number of Earners in Palmer
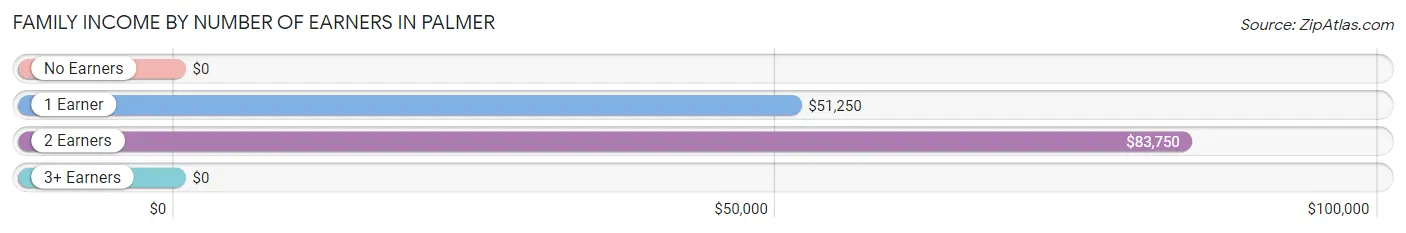
| Number of Earners | # Families | Median Income |
| No Earners | 8 (29.6%) | $0 |
| 1 Earner | 9 (33.3%) | $51,250 |
| 2 Earners | 10 (37.0%) | $83,750 |
| 3+ Earners | 0 (0.0%) | $0 |
| Total | 27 (100.0%) | $67,917 |
Household Income in Palmer
Household Income Brackets in Palmer
With 23 households falling in the category, the $50,000 to $74,999 income range is the most frequent in Palmer, accounting for 30.7% of all households.
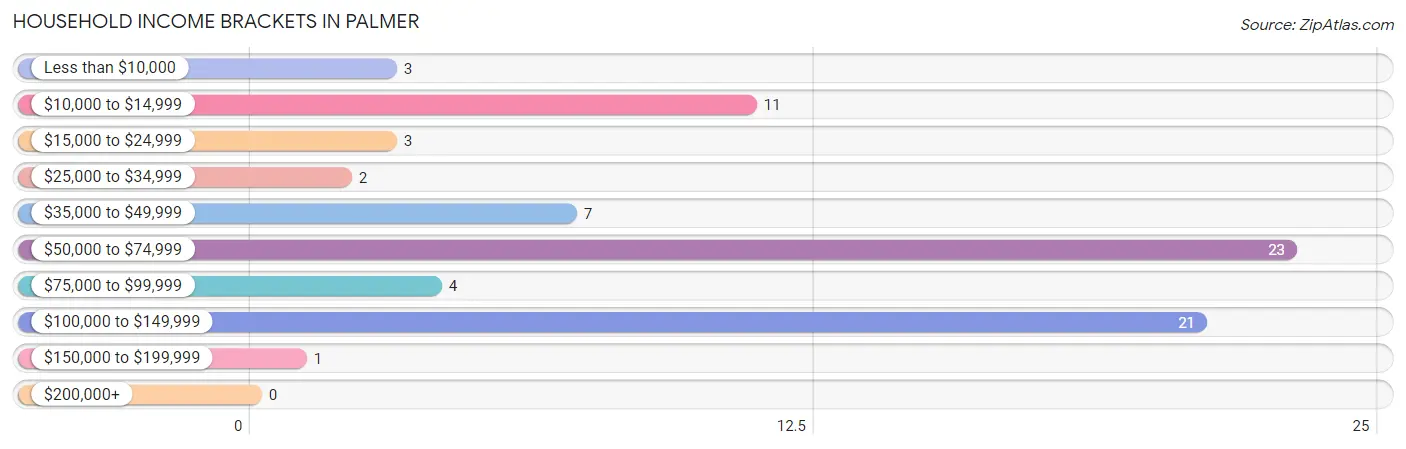
| Income Bracket | # Households | % Households |
| Less than $10,000 | 3 | 4.0% |
| $10,000 to $14,999 | 11 | 14.7% |
| $15,000 to $24,999 | 3 | 4.0% |
| $25,000 to $34,999 | 2 | 2.7% |
| $35,000 to $49,999 | 7 | 9.3% |
| $50,000 to $74,999 | 23 | 30.7% |
| $75,000 to $99,999 | 4 | 5.3% |
| $100,000 to $149,999 | 21 | 28.0% |
| $150,000 to $199,999 | 1 | 1.3% |
| $200,000+ | 0 | 0.0% |
Household Income by Householder Age in Palmer
The median household income in Palmer is $58,542, with the highest median household income of $107,500 found in the 45 to 64 years age bracket for the primary householder. A total of 34 households (45.3%) fall into this category. Meanwhile, the 15 to 24 years age bracket for the primary householder has the lowest median household income of $0, with 7 households (9.3%) in this group.
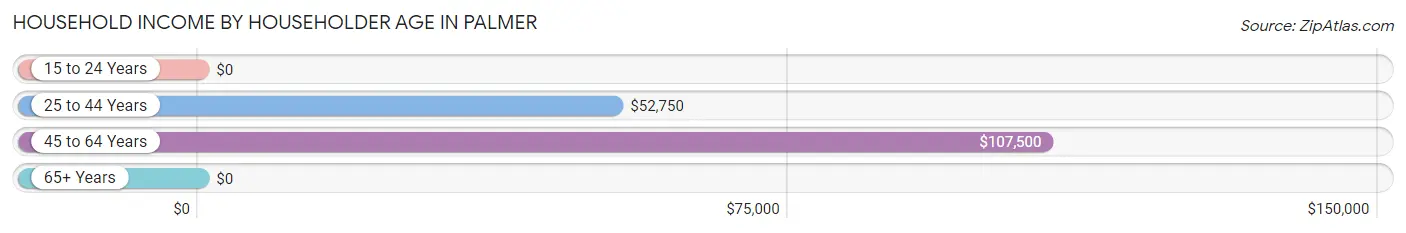
| Income Bracket | # Households | Median Income |
| 15 to 24 Years | 7 (9.3%) | $0 |
| 25 to 44 Years | 13 (17.3%) | $52,750 |
| 45 to 64 Years | 34 (45.3%) | $107,500 |
| 65+ Years | 21 (28.0%) | $0 |
| Total | 75 (100.0%) | $58,542 |
Poverty in Palmer
Income Below Poverty by Sex and Age in Palmer
With 20.9% poverty level for males and 30.0% for females among the residents of Palmer, 16 and 17 year old males and 5 year old females are the most vulnerable to poverty, with 3 males (100.0%) and 6 females (100.0%) in their respective age groups living below the poverty level.
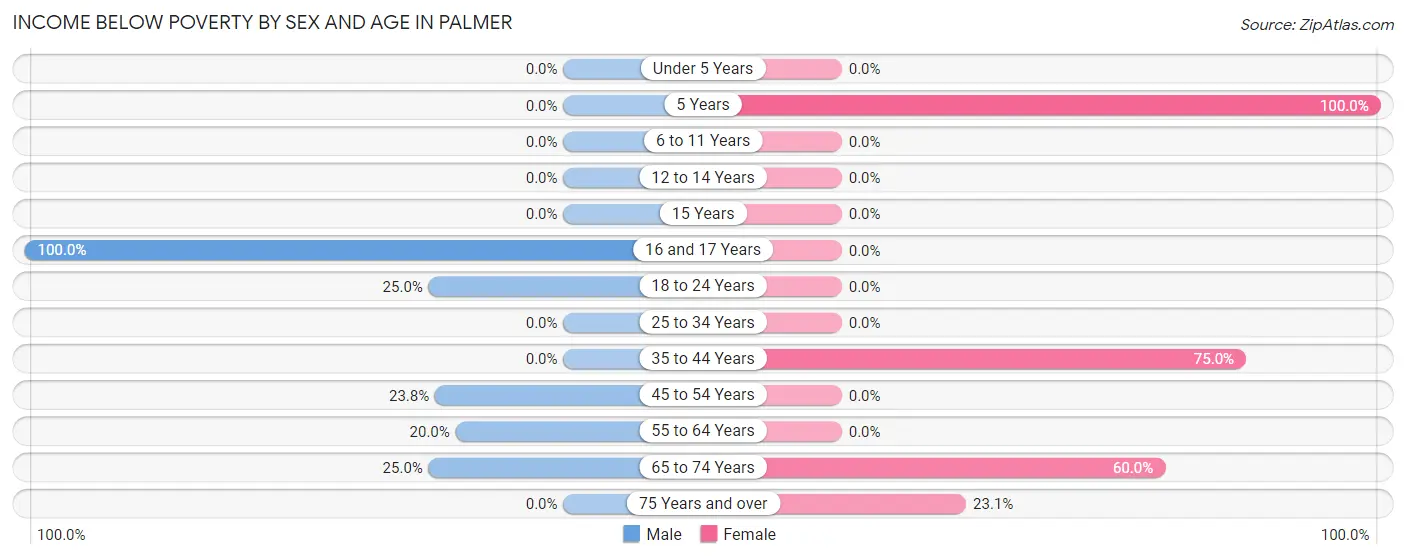
| Age Bracket | Male | Female |
| Under 5 Years | 0 (0.0%) | 0 (0.0%) |
| 5 Years | 0 (0.0%) | 6 (100.0%) |
| 6 to 11 Years | 0 (0.0%) | 0 (0.0%) |
| 12 to 14 Years | 0 (0.0%) | 0 (0.0%) |
| 15 Years | 0 (0.0%) | 0 (0.0%) |
| 16 and 17 Years | 3 (100.0%) | 0 (0.0%) |
| 18 to 24 Years | 2 (25.0%) | 0 (0.0%) |
| 25 to 34 Years | 0 (0.0%) | 0 (0.0%) |
| 35 to 44 Years | 0 (0.0%) | 6 (75.0%) |
| 45 to 54 Years | 5 (23.8%) | 0 (0.0%) |
| 55 to 64 Years | 2 (20.0%) | 0 (0.0%) |
| 65 to 74 Years | 2 (25.0%) | 3 (60.0%) |
| 75 Years and over | 0 (0.0%) | 3 (23.1%) |
| Total | 14 (20.9%) | 18 (30.0%) |
Income Above Poverty by Sex and Age in Palmer
According to the poverty statistics in Palmer, males aged 6 to 11 years and females aged 6 to 11 years are the age groups that are most secure financially, with 100.0% of males and 100.0% of females in these age groups living above the poverty line.
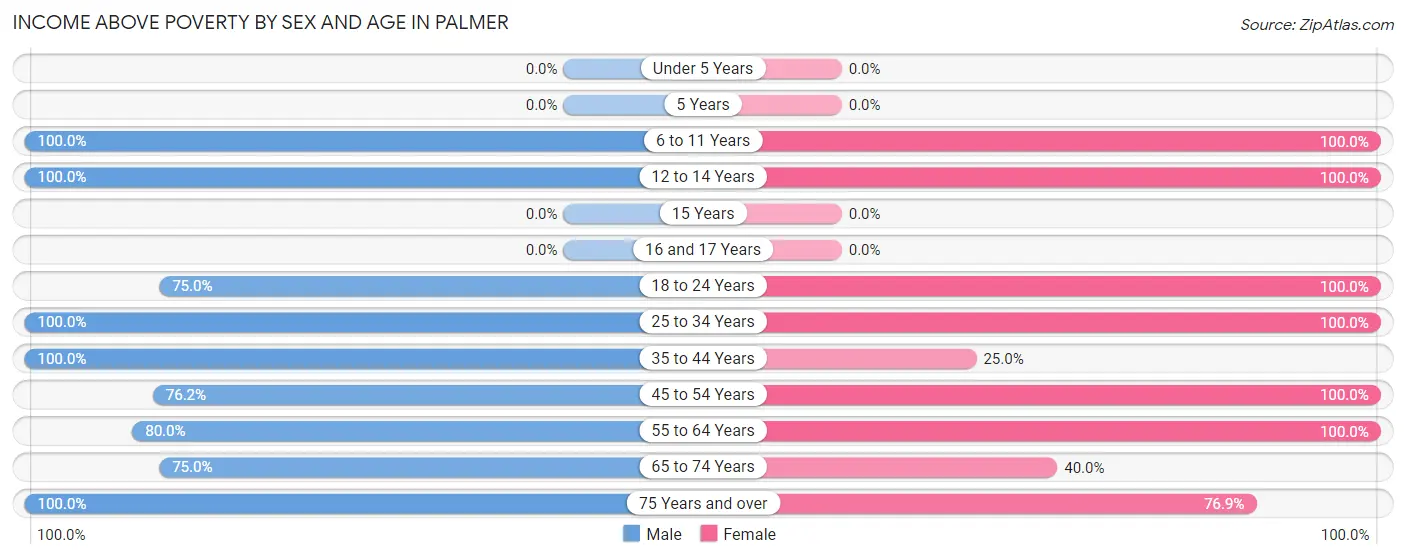
| Age Bracket | Male | Female |
| Under 5 Years | 0 (0.0%) | 0 (0.0%) |
| 5 Years | 0 (0.0%) | 0 (0.0%) |
| 6 to 11 Years | 1 (100.0%) | 7 (100.0%) |
| 12 to 14 Years | 3 (100.0%) | 2 (100.0%) |
| 15 Years | 0 (0.0%) | 0 (0.0%) |
| 16 and 17 Years | 0 (0.0%) | 0 (0.0%) |
| 18 to 24 Years | 6 (75.0%) | 1 (100.0%) |
| 25 to 34 Years | 3 (100.0%) | 5 (100.0%) |
| 35 to 44 Years | 8 (100.0%) | 2 (25.0%) |
| 45 to 54 Years | 16 (76.2%) | 3 (100.0%) |
| 55 to 64 Years | 8 (80.0%) | 10 (100.0%) |
| 65 to 74 Years | 6 (75.0%) | 2 (40.0%) |
| 75 Years and over | 2 (100.0%) | 10 (76.9%) |
| Total | 53 (79.1%) | 42 (70.0%) |
Income Below Poverty Among Married-Couple Families in Palmer
The poverty statistics for married-couple families in Palmer show that 20.0% or 5 of the total 25 families live below the poverty line. Families with 1 or 2 children have the highest poverty rate of 83.3%, comprising of 5 families. On the other hand, families with no children have the lowest poverty rate of 0.0%, which includes 0 families.
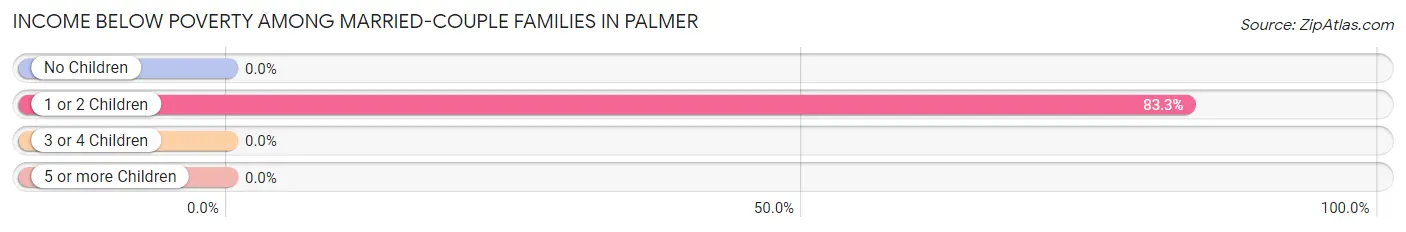
| Children | Above Poverty | Below Poverty |
| No Children | 16 (100.0%) | 0 (0.0%) |
| 1 or 2 Children | 1 (16.7%) | 5 (83.3%) |
| 3 or 4 Children | 3 (100.0%) | 0 (0.0%) |
| 5 or more Children | 0 (0.0%) | 0 (0.0%) |
| Total | 20 (80.0%) | 5 (20.0%) |
Income Below Poverty Among Single-Parent Households in Palmer
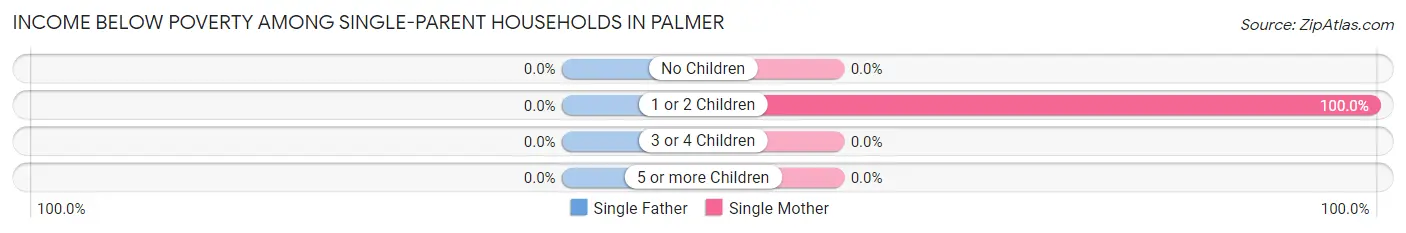
| Children | Single Father | Single Mother |
| No Children | 0 (0.0%) | 0 (0.0%) |
| 1 or 2 Children | 0 (0.0%) | 1 (100.0%) |
| 3 or 4 Children | 0 (0.0%) | 0 (0.0%) |
| 5 or more Children | 0 (0.0%) | 0 (0.0%) |
| Total | 0 (0.0%) | 1 (50.0%) |
Income Below Poverty Among Married-Couple vs Single-Parent Households in Palmer
The poverty data for Palmer shows that 5 of the married-couple family households (20.0%) and 1 of the single-parent households (50.0%) are living below the poverty level. Within the married-couple family households, those with 1 or 2 children have the highest poverty rate, with 5 households (83.3%) falling below the poverty line. Among the single-parent households, those with 1 or 2 children have the highest poverty rate, with 1 household (100.0%) living below poverty.
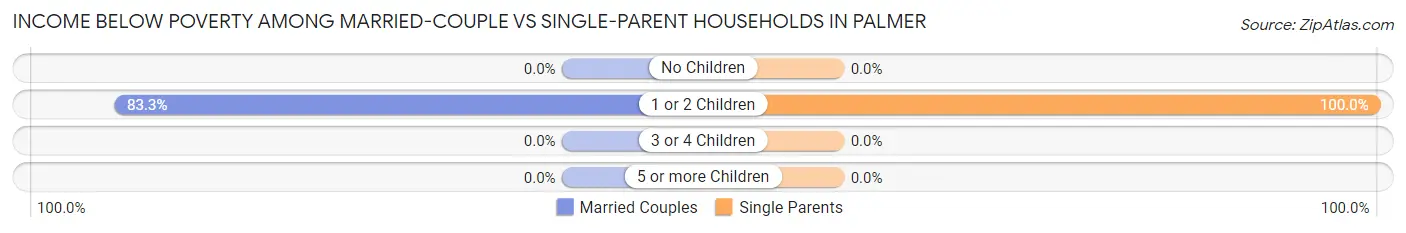
| Children | Married-Couple Families | Single-Parent Households |
| No Children | 0 (0.0%) | 0 (0.0%) |
| 1 or 2 Children | 5 (83.3%) | 1 (100.0%) |
| 3 or 4 Children | 0 (0.0%) | 0 (0.0%) |
| 5 or more Children | 0 (0.0%) | 0 (0.0%) |
| Total | 5 (20.0%) | 1 (50.0%) |
Race in Palmer
The most populous races in Palmer are White / Caucasian (113 | 89.0%), Hispanic or Latino (16 | 12.6%), and Some other Race (14 | 11.0%).
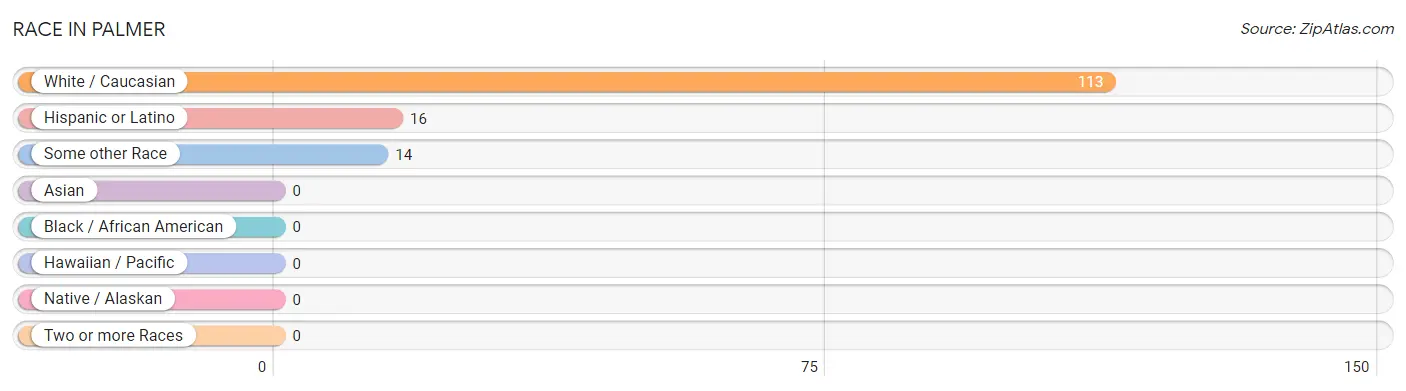
| Race | # Population | % Population |
| Asian | 0 | 0.0% |
| Black / African American | 0 | 0.0% |
| Hawaiian / Pacific | 0 | 0.0% |
| Hispanic or Latino | 16 | 12.6% |
| Native / Alaskan | 0 | 0.0% |
| White / Caucasian | 113 | 89.0% |
| Two or more Races | 0 | 0.0% |
| Some other Race | 14 | 11.0% |
| Total | 127 | 100.0% |
Ancestry in Palmer
The most populous ancestries reported in Palmer are German (63 | 49.6%), American (18 | 14.2%), Mexican (11 | 8.7%), Irish (9 | 7.1%), and Central American (5 | 3.9%), together accounting for 83.5% of all Palmer residents.
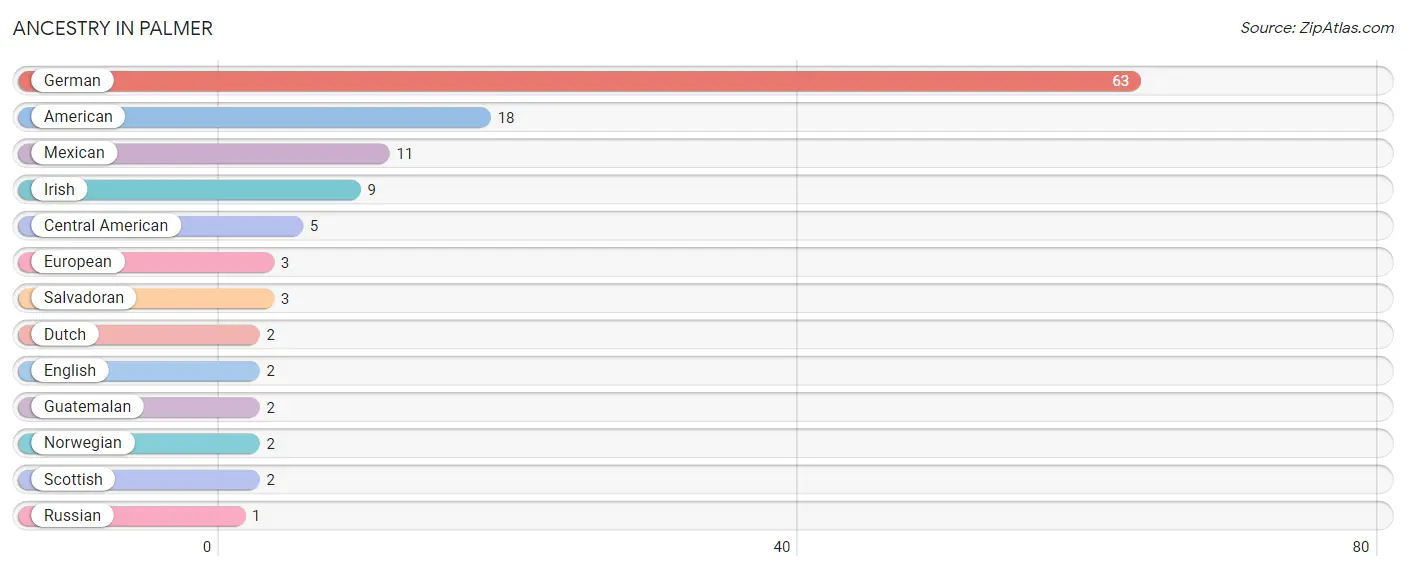
| Ancestry | # Population | % Population |
| American | 18 | 14.2% |
| Central American | 5 | 3.9% |
| Dutch | 2 | 1.6% |
| English | 2 | 1.6% |
| European | 3 | 2.4% |
| German | 63 | 49.6% |
| Guatemalan | 2 | 1.6% |
| Irish | 9 | 7.1% |
| Mexican | 11 | 8.7% |
| Norwegian | 2 | 1.6% |
| Russian | 1 | 0.8% |
| Salvadoran | 3 | 2.4% |
| Scottish | 2 | 1.6% | View All 13 Rows |
Immigrants in Palmer
The most numerous immigrant groups reported in Palmer came from Central America (4 | 3.2%), Latin America (4 | 3.2%), El Salvador (3 | 2.4%), Europe (2 | 1.6%), and Eastern Europe (1 | 0.8%), together accounting for 11.0% of all Palmer residents.
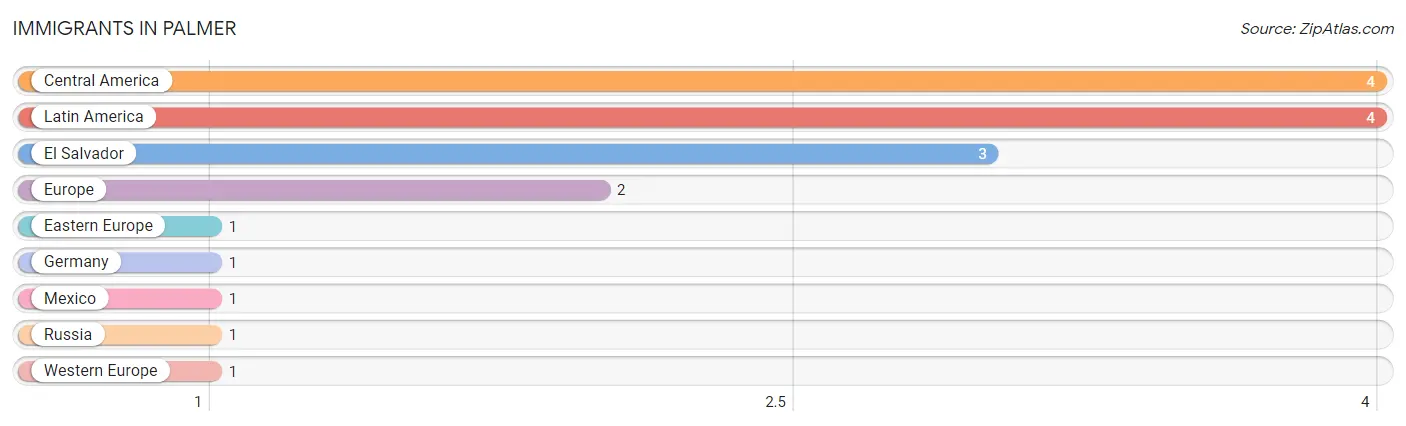
| Immigration Origin | # Population | % Population |
| Central America | 4 | 3.2% |
| Eastern Europe | 1 | 0.8% |
| El Salvador | 3 | 2.4% |
| Europe | 2 | 1.6% |
| Germany | 1 | 0.8% |
| Latin America | 4 | 3.2% |
| Mexico | 1 | 0.8% |
| Russia | 1 | 0.8% |
| Western Europe | 1 | 0.8% | View All 9 Rows |
Sex and Age in Palmer
Sex and Age in Palmer
The most populous age groups in Palmer are 50 to 54 Years (20 | 29.8%) for men and 5 to 9 Years (10 | 16.7%) for women.
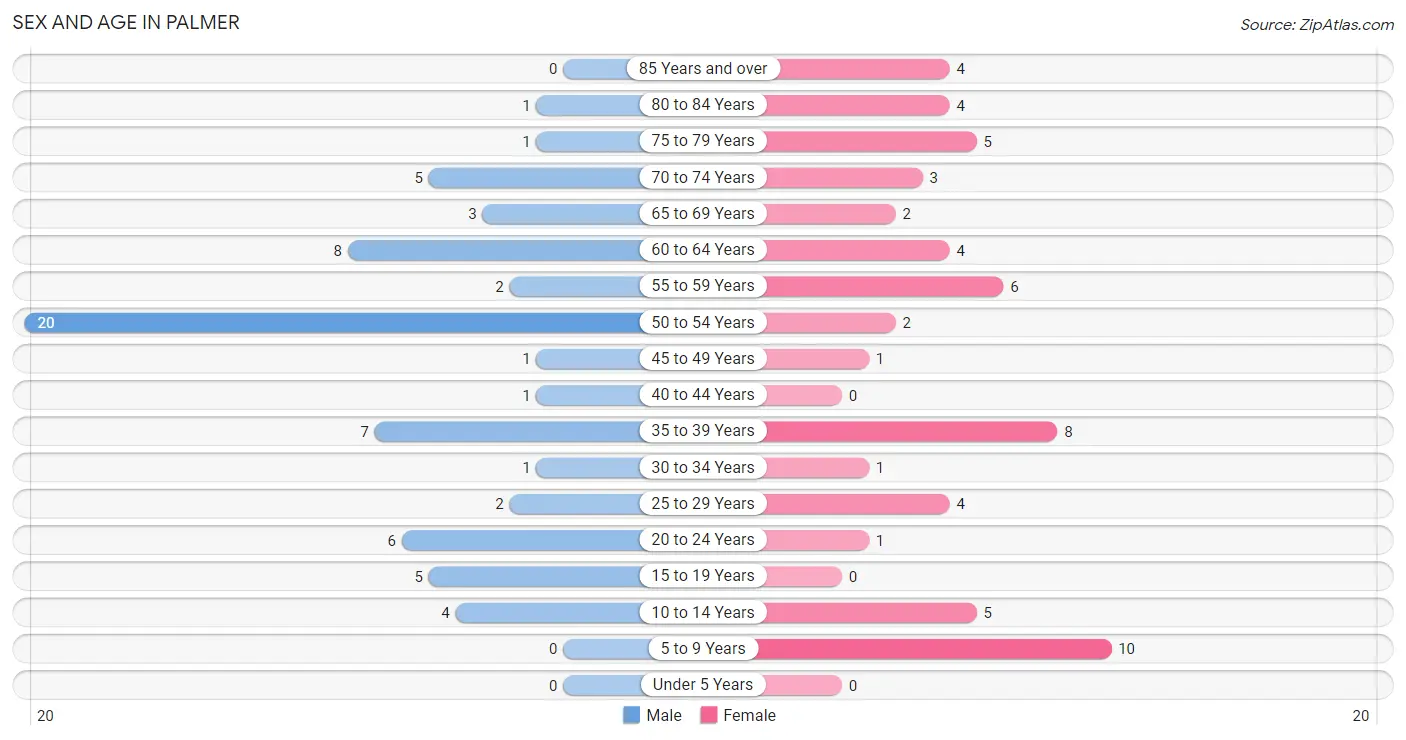
| Age Bracket | Male | Female |
| Under 5 Years | 0 (0.0%) | 0 (0.0%) |
| 5 to 9 Years | 0 (0.0%) | 10 (16.7%) |
| 10 to 14 Years | 4 (6.0%) | 5 (8.3%) |
| 15 to 19 Years | 5 (7.5%) | 0 (0.0%) |
| 20 to 24 Years | 6 (9.0%) | 1 (1.7%) |
| 25 to 29 Years | 2 (3.0%) | 4 (6.7%) |
| 30 to 34 Years | 1 (1.5%) | 1 (1.7%) |
| 35 to 39 Years | 7 (10.4%) | 8 (13.3%) |
| 40 to 44 Years | 1 (1.5%) | 0 (0.0%) |
| 45 to 49 Years | 1 (1.5%) | 1 (1.7%) |
| 50 to 54 Years | 20 (29.8%) | 2 (3.3%) |
| 55 to 59 Years | 2 (3.0%) | 6 (10.0%) |
| 60 to 64 Years | 8 (11.9%) | 4 (6.7%) |
| 65 to 69 Years | 3 (4.5%) | 2 (3.3%) |
| 70 to 74 Years | 5 (7.5%) | 3 (5.0%) |
| 75 to 79 Years | 1 (1.5%) | 5 (8.3%) |
| 80 to 84 Years | 1 (1.5%) | 4 (6.7%) |
| 85 Years and over | 0 (0.0%) | 4 (6.7%) |
| Total | 67 (100.0%) | 60 (100.0%) |
Families and Households in Palmer
Median Family Size in Palmer
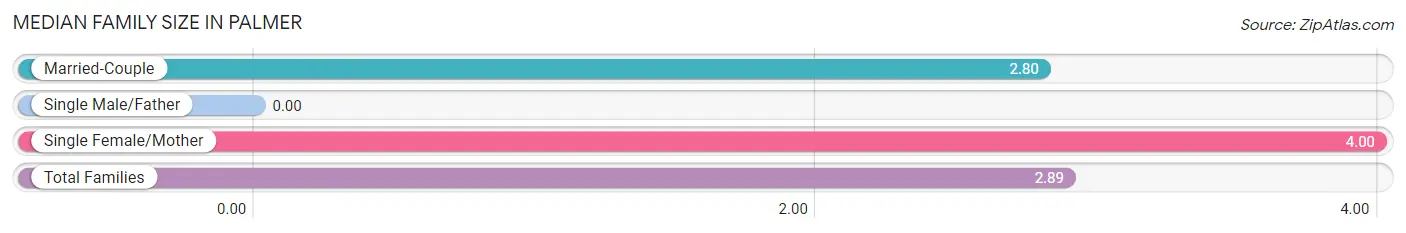
| Family Type | # Families | Family Size |
| Married-Couple | 25 (92.6%) | 2.80 |
| Single Male/Father | 0 (0.0%) | - |
| Single Female/Mother | 2 (7.4%) | 4.00 |
| Total Families | 27 (100.0%) | 2.89 |
Median Household Size in Palmer
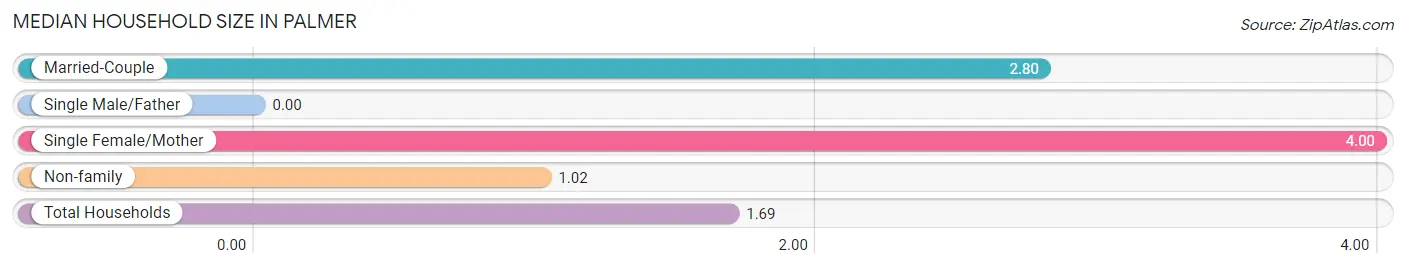
| Household Type | # Households | Household Size |
| Married-Couple | 25 (33.3%) | 2.80 |
| Single Male/Father | 0 (0.0%) | - |
| Single Female/Mother | 2 (2.7%) | 4.00 |
| Non-family | 48 (64.0%) | 1.02 |
| Total Households | 75 (100.0%) | 1.69 |
Household Size by Marriage Status in Palmer
Out of a total of 75 households in Palmer, 27 (36.0%) are family households, while 48 (64.0%) are nonfamily households. The most numerous type of family households are 2-person households, comprising 17, and the most common type of nonfamily households are 1-person households, comprising 47.
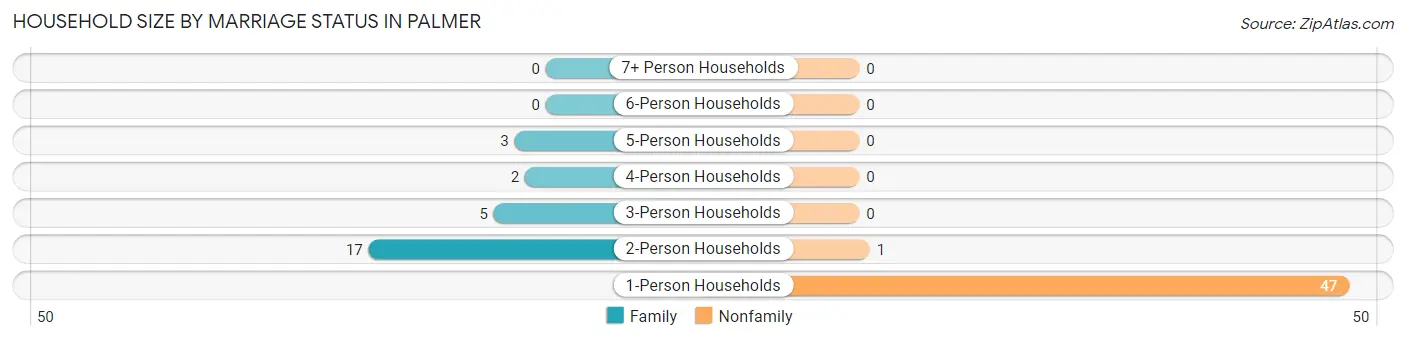
| Household Size | Family Households | Nonfamily Households |
| 1-Person Households | - | 47 (62.7%) |
| 2-Person Households | 17 (22.7%) | 1 (1.3%) |
| 3-Person Households | 5 (6.7%) | 0 (0.0%) |
| 4-Person Households | 2 (2.7%) | 0 (0.0%) |
| 5-Person Households | 3 (4.0%) | 0 (0.0%) |
| 6-Person Households | 0 (0.0%) | 0 (0.0%) |
| 7+ Person Households | 0 (0.0%) | 0 (0.0%) |
| Total | 27 (36.0%) | 48 (64.0%) |
Female Fertility in Palmer
Fertility by Age in Palmer
| Age Bracket | Women with Births | Births / 1,000 Women |
| 15 to 19 years | 0 (0.0%) | 0.0 |
| 20 to 34 years | 0 (0.0%) | 0.0 |
| 35 to 50 years | 0 (0.0%) | 0.0 |
| Total | 0 (0.0%) | 0.0 |
Fertility by Age by Marriage Status in Palmer
| Age Bracket | Married | Unmarried |
| 15 to 19 years | 0 (0.0%) | 0 (0.0%) |
| 20 to 34 years | 0 (0.0%) | 0 (0.0%) |
| 35 to 50 years | 0 (0.0%) | 0 (0.0%) |
| Total | 0 (0.0%) | 0 (0.0%) |
Fertility by Education in Palmer
| Educational Attainment | Women with Births | Births / 1,000 Women |
| Less than High School | 0 (0.0%) | 0.0 |
| High School Diploma | 0 (0.0%) | 0.0 |
| College or Associate's Degree | 0 (0.0%) | 0.0 |
| Bachelor's Degree | 0 (0.0%) | 0.0 |
| Graduate Degree | 0 (0.0%) | 0.0 |
| Total | 0 (0.0%) | 0.0 |
Fertility by Education by Marriage Status in Palmer
| Educational Attainment | Married | Unmarried |
| Less than High School | 0 (0.0%) | 0 (0.0%) |
| High School Diploma | 0 (0.0%) | 0 (0.0%) |
| College or Associate's Degree | 0 (0.0%) | 0 (0.0%) |
| Bachelor's Degree | 0 (0.0%) | 0 (0.0%) |
| Graduate Degree | 0 (0.0%) | 0 (0.0%) |
| Total | 0 (0.0%) | 0 (0.0%) |
Employment Characteristics in Palmer
Employment by Class of Employer in Palmer
Among the 60 employed individuals in Palmer, private company employees (45 | 75.0%), self-employed (not incorporated) (6 | 10.0%), and local government employees (3 | 5.0%) make up the most common classes of employment.
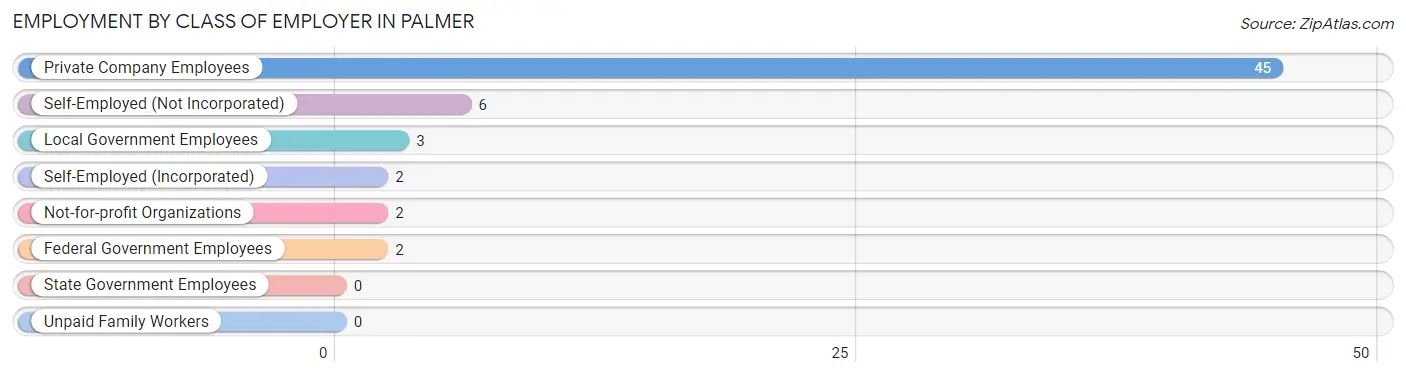
| Employer Class | # Employees | % Employees |
| Private Company Employees | 45 | 75.0% |
| Self-Employed (Incorporated) | 2 | 3.3% |
| Self-Employed (Not Incorporated) | 6 | 10.0% |
| Not-for-profit Organizations | 2 | 3.3% |
| Local Government Employees | 3 | 5.0% |
| State Government Employees | 0 | 0.0% |
| Federal Government Employees | 2 | 3.3% |
| Unpaid Family Workers | 0 | 0.0% |
| Total | 60 | 100.0% |
Employment Status by Age in Palmer
According to the labor force statistics for Palmer, out of the total population over 16 years of age (108), 56.5% or 61 individuals are in the labor force, with 1.6% or 1 of them unemployed. The age group with the highest labor force participation rate is 20 to 24 years, with 100.0% or 7 individuals in the labor force. Within the labor force, the 55 to 59 years age range has the highest percentage of unemployed individuals, with 12.5% or 1 of them being unemployed.
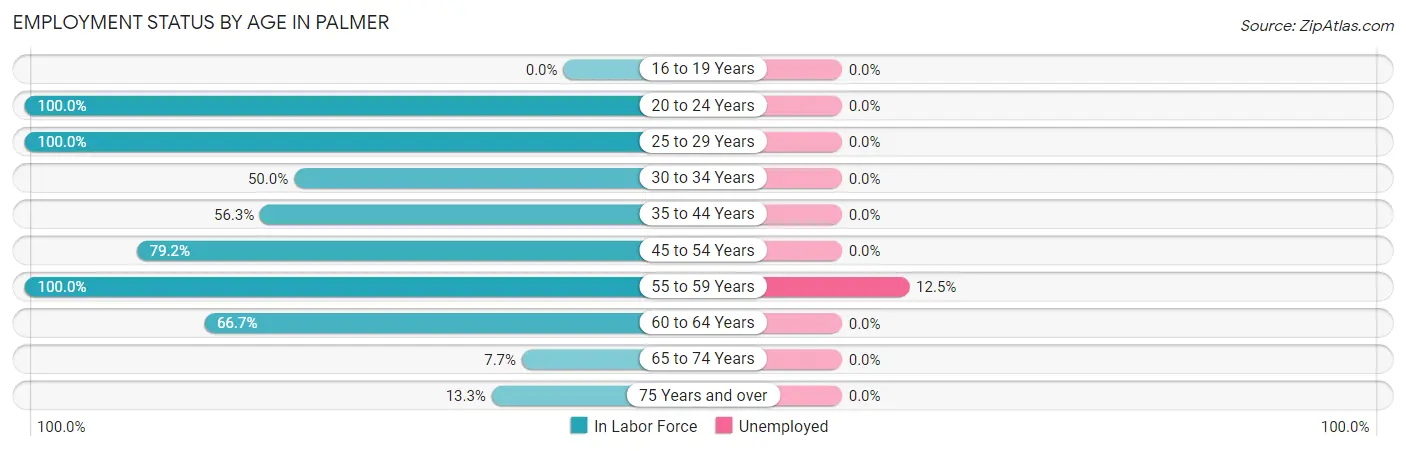
| Age Bracket | In Labor Force | Unemployed |
| 16 to 19 Years | 0 (0.0%) | 0 (0.0%) |
| 20 to 24 Years | 7 (100.0%) | 0 (0.0%) |
| 25 to 29 Years | 6 (100.0%) | 0 (0.0%) |
| 30 to 34 Years | 1 (50.0%) | 0 (0.0%) |
| 35 to 44 Years | 9 (56.3%) | 0 (0.0%) |
| 45 to 54 Years | 19 (79.2%) | 0 (0.0%) |
| 55 to 59 Years | 8 (100.0%) | 1 (12.5%) |
| 60 to 64 Years | 8 (66.7%) | 0 (0.0%) |
| 65 to 74 Years | 1 (7.7%) | 0 (0.0%) |
| 75 Years and over | 2 (13.3%) | 0 (0.0%) |
| Total | 61 (56.5%) | 1 (1.6%) |
Employment Status by Educational Attainment in Palmer
According to labor force statistics for Palmer, 75.0% of individuals (51) out of the total population between 25 and 64 years of age (68) are in the labor force, with 2.0% or 1 of them being unemployed. The group with the highest labor force participation rate are those with the educational attainment of college / associate degree, with 100.0% or 19 individuals in the labor force. Within the labor force, individuals with college / associate degree education have the highest percentage of unemployment, with 5.3% or 1 of them being unemployed.
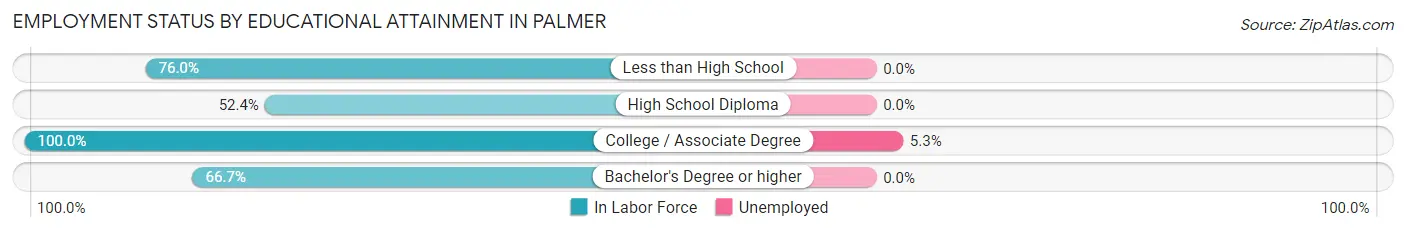
| Educational Attainment | In Labor Force | Unemployed |
| Less than High School | 19 (76.0%) | 0 (0.0%) |
| High School Diploma | 11 (52.4%) | 0 (0.0%) |
| College / Associate Degree | 19 (100.0%) | 1 (5.3%) |
| Bachelor's Degree or higher | 2 (66.7%) | 0 (0.0%) |
| Total | 51 (75.0%) | 1 (2.0%) |
Employment Occupations by Sex in Palmer
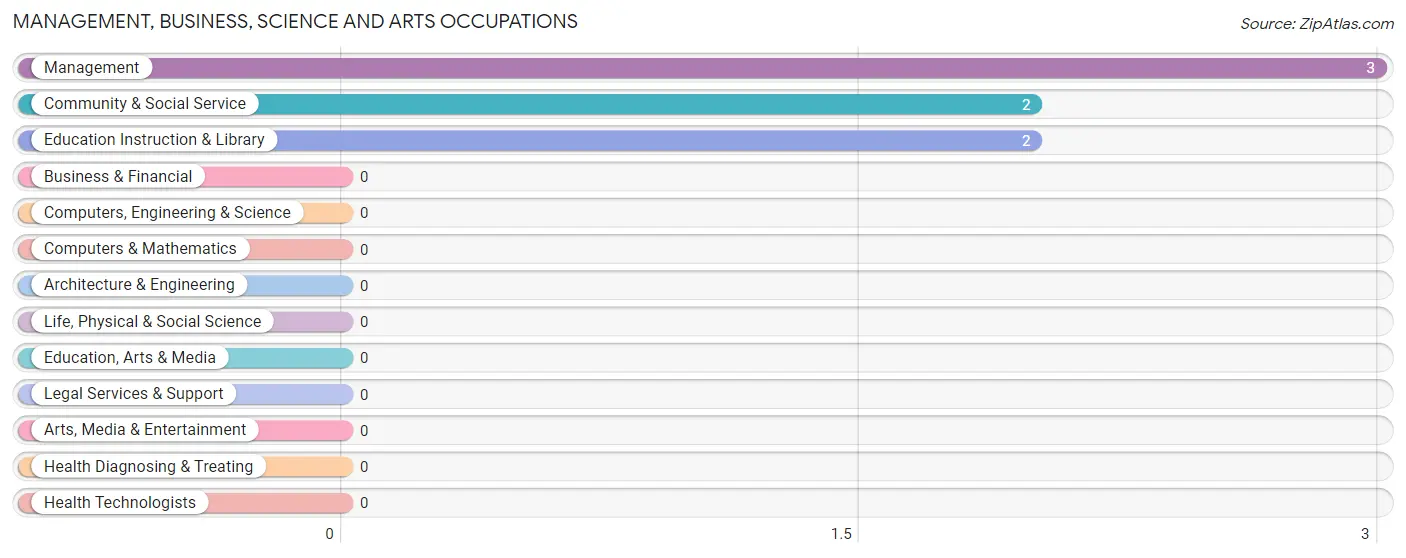
Management, Business, Science and Arts Occupations
The most common Management, Business, Science and Arts occupations in Palmer are Management (3 | 5.0%), Community & Social Service (2 | 3.3%), and Education Instruction & Library (2 | 3.3%).
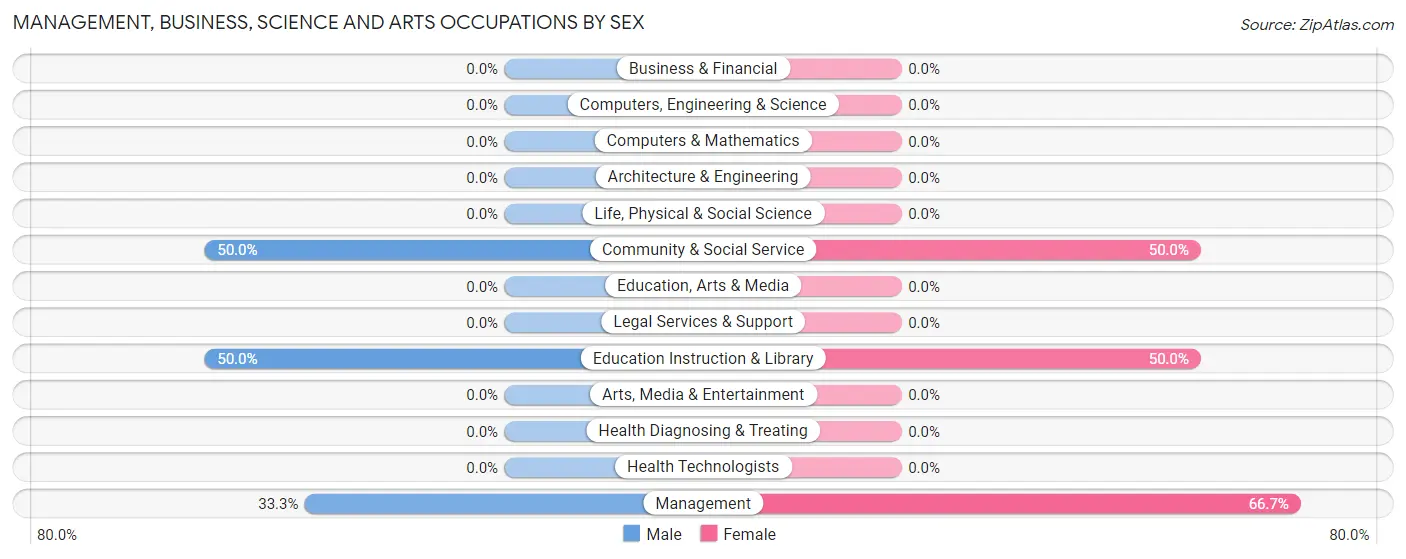
Management, Business, Science and Arts Occupations by Sex
Within the Management, Business, Science and Arts occupations in Palmer, the most male-oriented occupations are Community & Social Service (50.0%), Education Instruction & Library (50.0%), and Management (33.3%), while the most female-oriented occupations are Management (66.7%), Community & Social Service (50.0%), and Education Instruction & Library (50.0%).
| Occupation | Male | Female |
| Management | 1 (33.3%) | 2 (66.7%) |
| Business & Financial | 0 (0.0%) | 0 (0.0%) |
| Computers, Engineering & Science | 0 (0.0%) | 0 (0.0%) |
| Computers & Mathematics | 0 (0.0%) | 0 (0.0%) |
| Architecture & Engineering | 0 (0.0%) | 0 (0.0%) |
| Life, Physical & Social Science | 0 (0.0%) | 0 (0.0%) |
| Community & Social Service | 1 (50.0%) | 1 (50.0%) |
| Education, Arts & Media | 0 (0.0%) | 0 (0.0%) |
| Legal Services & Support | 0 (0.0%) | 0 (0.0%) |
| Education Instruction & Library | 1 (50.0%) | 1 (50.0%) |
| Arts, Media & Entertainment | 0 (0.0%) | 0 (0.0%) |
| Health Diagnosing & Treating | 0 (0.0%) | 0 (0.0%) |
| Health Technologists | 0 (0.0%) | 0 (0.0%) |
| Total (Category) | 2 (40.0%) | 3 (60.0%) |
| Total (Overall) | 42 (70.0%) | 18 (30.0%) |
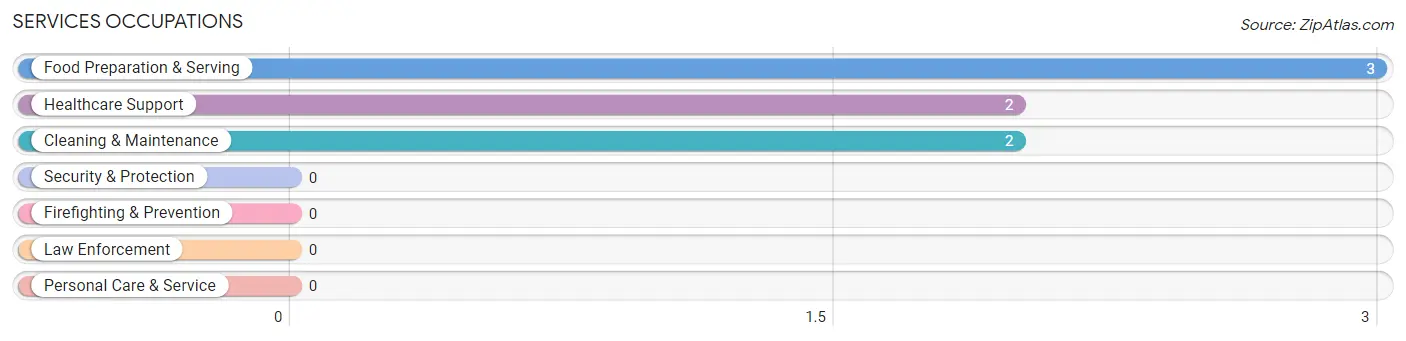
Services Occupations
The most common Services occupations in Palmer are Food Preparation & Serving (3 | 5.0%), Healthcare Support (2 | 3.3%), and Cleaning & Maintenance (2 | 3.3%).
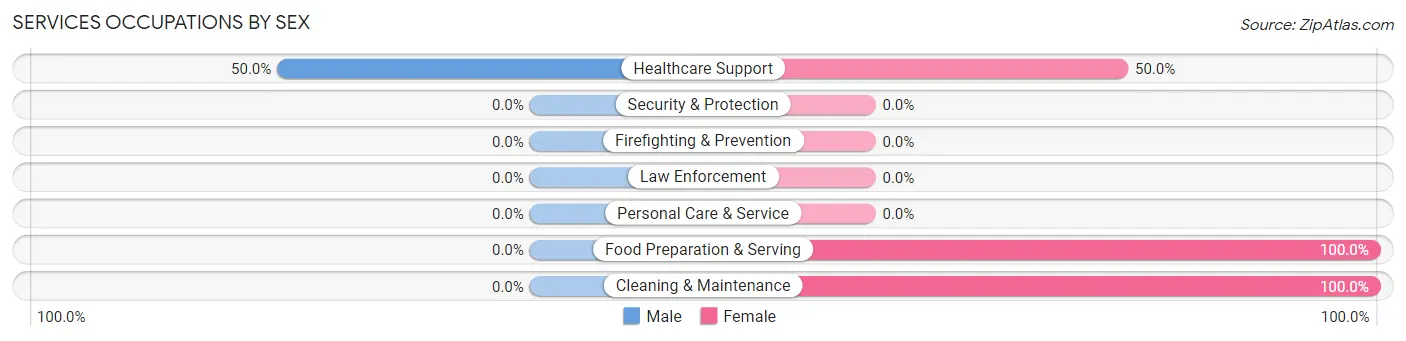
Services Occupations by Sex
| Occupation | Male | Female |
| Healthcare Support | 1 (50.0%) | 1 (50.0%) |
| Security & Protection | 0 (0.0%) | 0 (0.0%) |
| Firefighting & Prevention | 0 (0.0%) | 0 (0.0%) |
| Law Enforcement | 0 (0.0%) | 0 (0.0%) |
| Food Preparation & Serving | 0 (0.0%) | 3 (100.0%) |
| Cleaning & Maintenance | 0 (0.0%) | 2 (100.0%) |
| Personal Care & Service | 0 (0.0%) | 0 (0.0%) |
| Total (Category) | 1 (14.3%) | 6 (85.7%) |
| Total (Overall) | 42 (70.0%) | 18 (30.0%) |
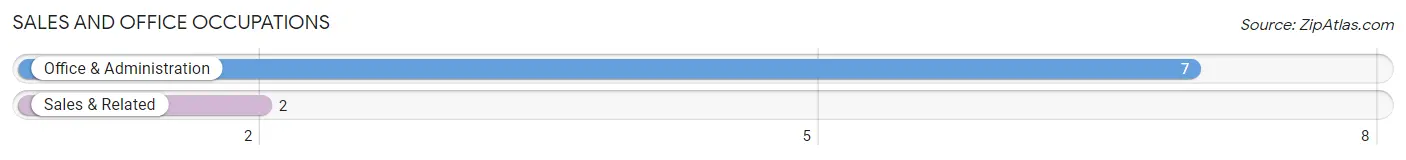
Sales and Office Occupations
The most common Sales and Office occupations in Palmer are Office & Administration (7 | 11.7%), and Sales & Related (2 | 3.3%).
Sales and Office Occupations by Sex
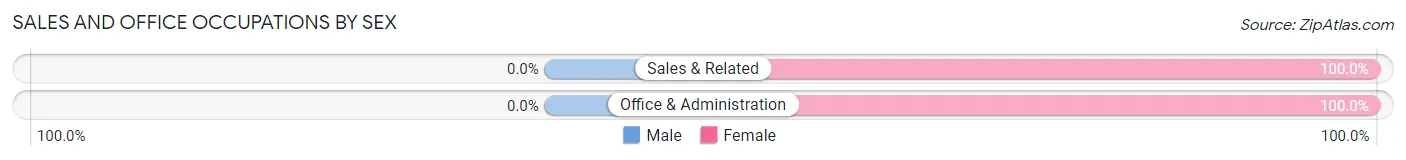
| Occupation | Male | Female |
| Sales & Related | 0 (0.0%) | 2 (100.0%) |
| Office & Administration | 0 (0.0%) | 7 (100.0%) |
| Total (Category) | 0 (0.0%) | 9 (100.0%) |
| Total (Overall) | 42 (70.0%) | 18 (30.0%) |
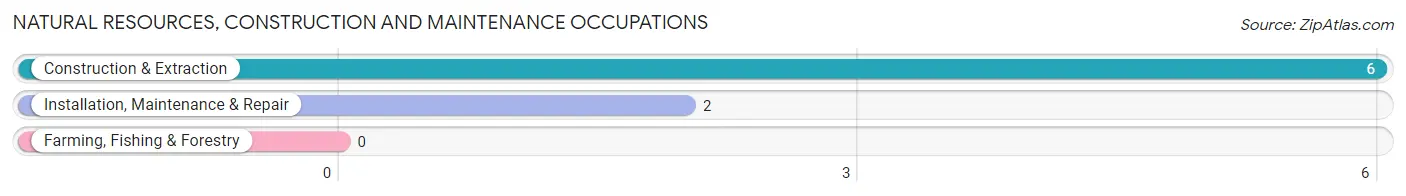
Natural Resources, Construction and Maintenance Occupations
The most common Natural Resources, Construction and Maintenance occupations in Palmer are Construction & Extraction (6 | 10.0%), and Installation, Maintenance & Repair (2 | 3.3%).
Natural Resources, Construction and Maintenance Occupations by Sex
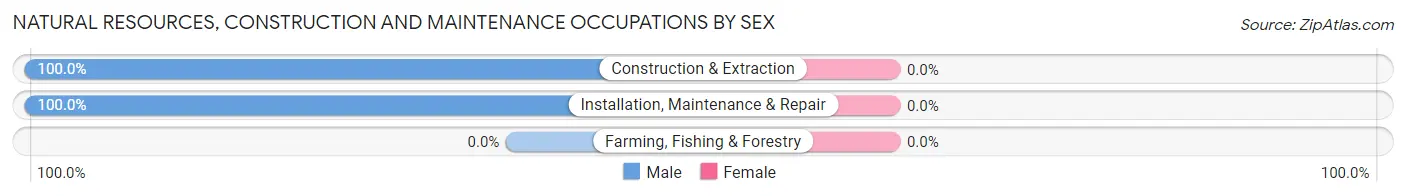
| Occupation | Male | Female |
| Farming, Fishing & Forestry | 0 (0.0%) | 0 (0.0%) |
| Construction & Extraction | 6 (100.0%) | 0 (0.0%) |
| Installation, Maintenance & Repair | 2 (100.0%) | 0 (0.0%) |
| Total (Category) | 8 (100.0%) | 0 (0.0%) |
| Total (Overall) | 42 (70.0%) | 18 (30.0%) |
Production, Transportation and Moving Occupations
The most common Production, Transportation and Moving occupations in Palmer are Transportation (24 | 40.0%), and Production (7 | 11.7%).
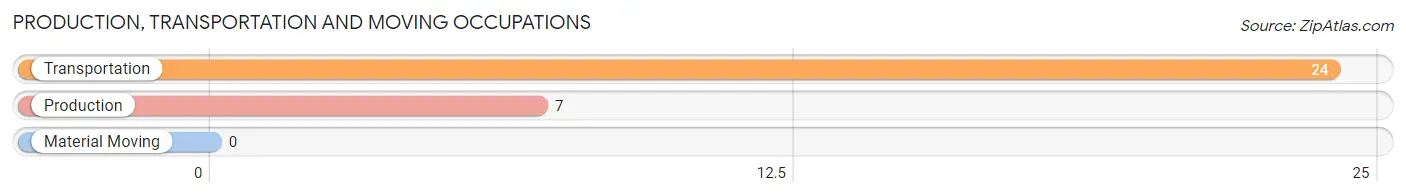
Production, Transportation and Moving Occupations by Sex
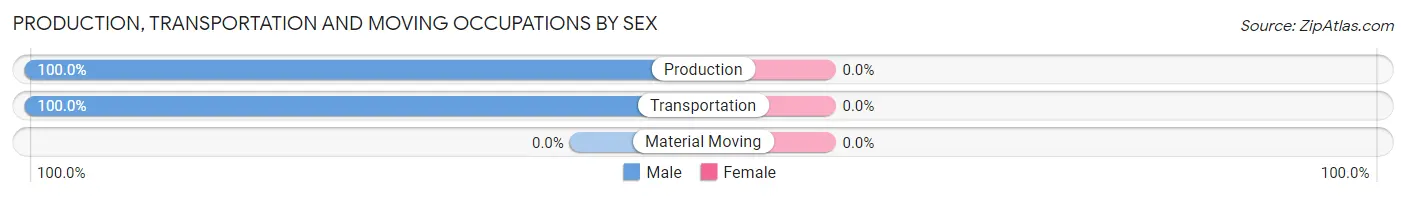
| Occupation | Male | Female |
| Production | 7 (100.0%) | 0 (0.0%) |
| Transportation | 24 (100.0%) | 0 (0.0%) |
| Material Moving | 0 (0.0%) | 0 (0.0%) |
| Total (Category) | 31 (100.0%) | 0 (0.0%) |
| Total (Overall) | 42 (70.0%) | 18 (30.0%) |
Employment Industries by Sex in Palmer
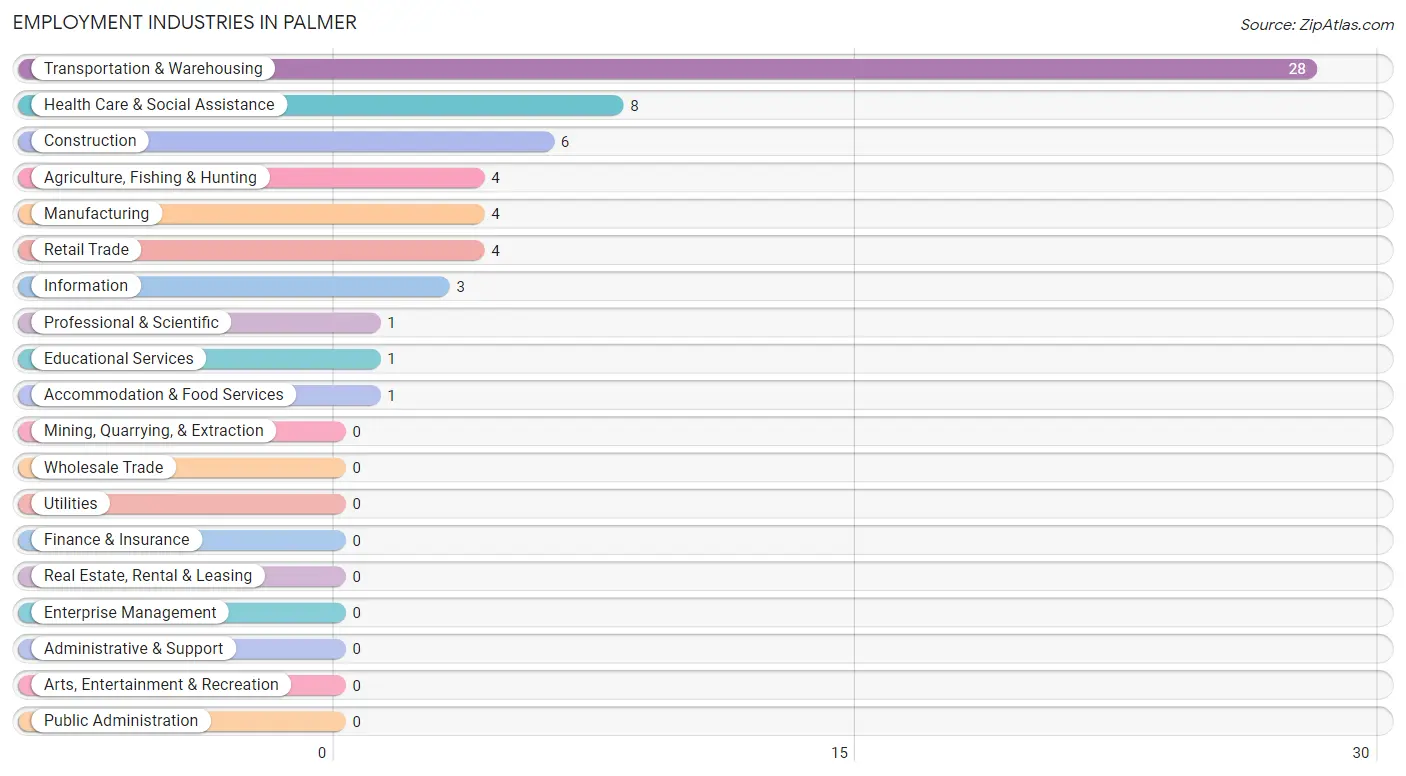
Employment Industries in Palmer
The major employment industries in Palmer include Transportation & Warehousing (28 | 46.7%), Health Care & Social Assistance (8 | 13.3%), Construction (6 | 10.0%), Agriculture, Fishing & Hunting (4 | 6.7%), and Manufacturing (4 | 6.7%).
Employment Industries by Sex in Palmer
The Palmer industries that see more men than women are Construction (100.0%), Manufacturing (100.0%), and Educational Services (100.0%), whereas the industries that tend to have a higher number of women are Information (100.0%), Professional & Scientific (100.0%), and Accommodation & Food Services (100.0%).
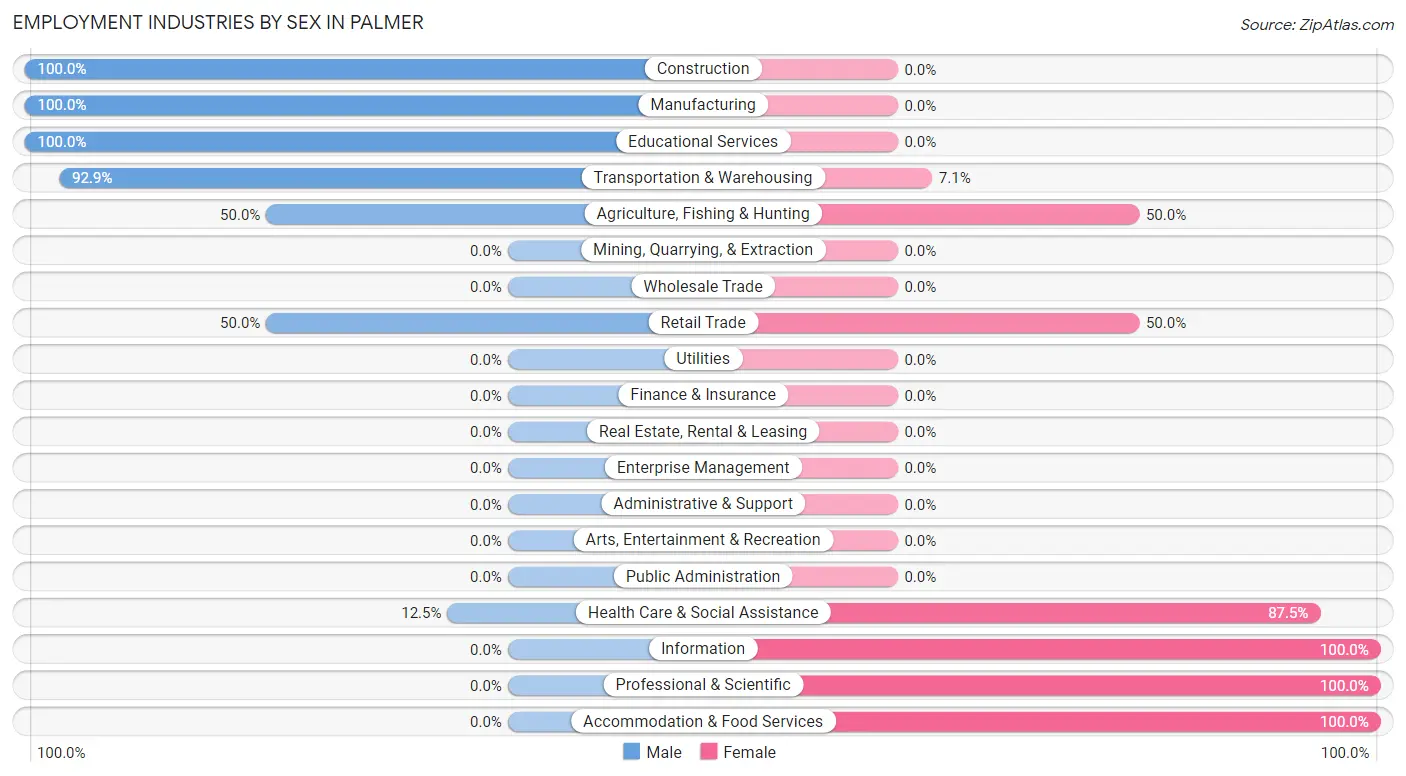
| Industry | Male | Female |
| Agriculture, Fishing & Hunting | 2 (50.0%) | 2 (50.0%) |
| Mining, Quarrying, & Extraction | 0 (0.0%) | 0 (0.0%) |
| Construction | 6 (100.0%) | 0 (0.0%) |
| Manufacturing | 4 (100.0%) | 0 (0.0%) |
| Wholesale Trade | 0 (0.0%) | 0 (0.0%) |
| Retail Trade | 2 (50.0%) | 2 (50.0%) |
| Transportation & Warehousing | 26 (92.9%) | 2 (7.1%) |
| Utilities | 0 (0.0%) | 0 (0.0%) |
| Information | 0 (0.0%) | 3 (100.0%) |
| Finance & Insurance | 0 (0.0%) | 0 (0.0%) |
| Real Estate, Rental & Leasing | 0 (0.0%) | 0 (0.0%) |
| Professional & Scientific | 0 (0.0%) | 1 (100.0%) |
| Enterprise Management | 0 (0.0%) | 0 (0.0%) |
| Administrative & Support | 0 (0.0%) | 0 (0.0%) |
| Educational Services | 1 (100.0%) | 0 (0.0%) |
| Health Care & Social Assistance | 1 (12.5%) | 7 (87.5%) |
| Arts, Entertainment & Recreation | 0 (0.0%) | 0 (0.0%) |
| Accommodation & Food Services | 0 (0.0%) | 1 (100.0%) |
| Public Administration | 0 (0.0%) | 0 (0.0%) |
| Total | 42 (70.0%) | 18 (30.0%) |
Education in Palmer
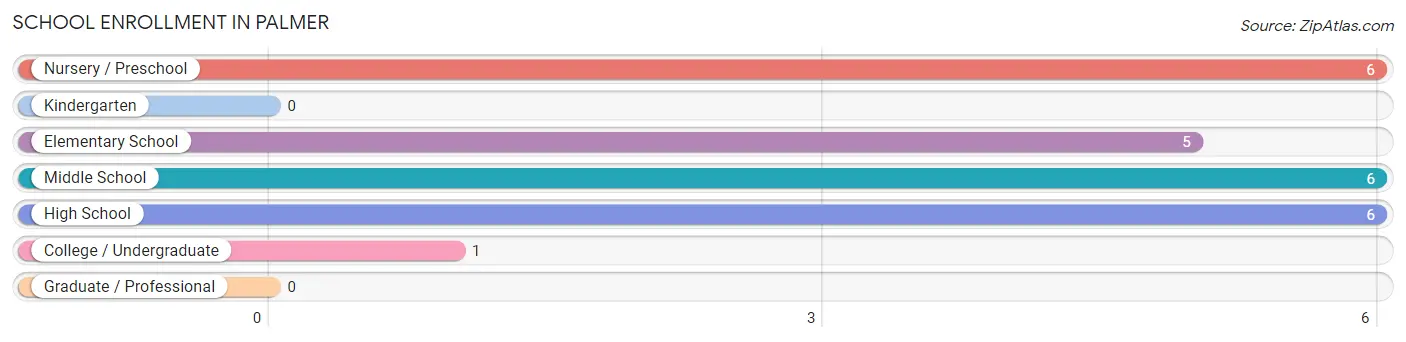
School Enrollment in Palmer
The most common levels of schooling among the 24 students in Palmer are nursery / preschool (6 | 25.0%), middle school (6 | 25.0%), and high school (6 | 25.0%).
| School Level | # Students | % Students |
| Nursery / Preschool | 6 | 25.0% |
| Kindergarten | 0 | 0.0% |
| Elementary School | 5 | 20.8% |
| Middle School | 6 | 25.0% |
| High School | 6 | 25.0% |
| College / Undergraduate | 1 | 4.2% |
| Graduate / Professional | 0 | 0.0% |
| Total | 24 | 100.0% |
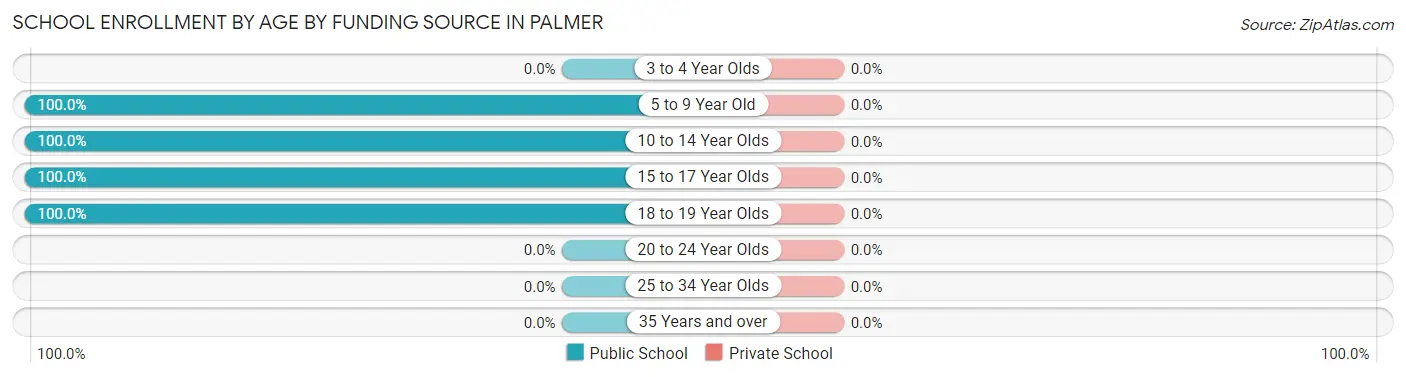
School Enrollment by Age by Funding Source in Palmer
| Age Bracket | Public School | Private School |
| 3 to 4 Year Olds | 0 (0.0%) | 0 (0.0%) |
| 5 to 9 Year Old | 10 (100.0%) | 0 (0.0%) |
| 10 to 14 Year Olds | 9 (100.0%) | 0 (0.0%) |
| 15 to 17 Year Olds | 3 (100.0%) | 0 (0.0%) |
| 18 to 19 Year Olds | 2 (100.0%) | 0 (0.0%) |
| 20 to 24 Year Olds | 0 (0.0%) | 0 (0.0%) |
| 25 to 34 Year Olds | 0 (0.0%) | 0 (0.0%) |
| 35 Years and over | 0 (0.0%) | 0 (0.0%) |
| Total | 24 (100.0%) | 0 (0.0%) |
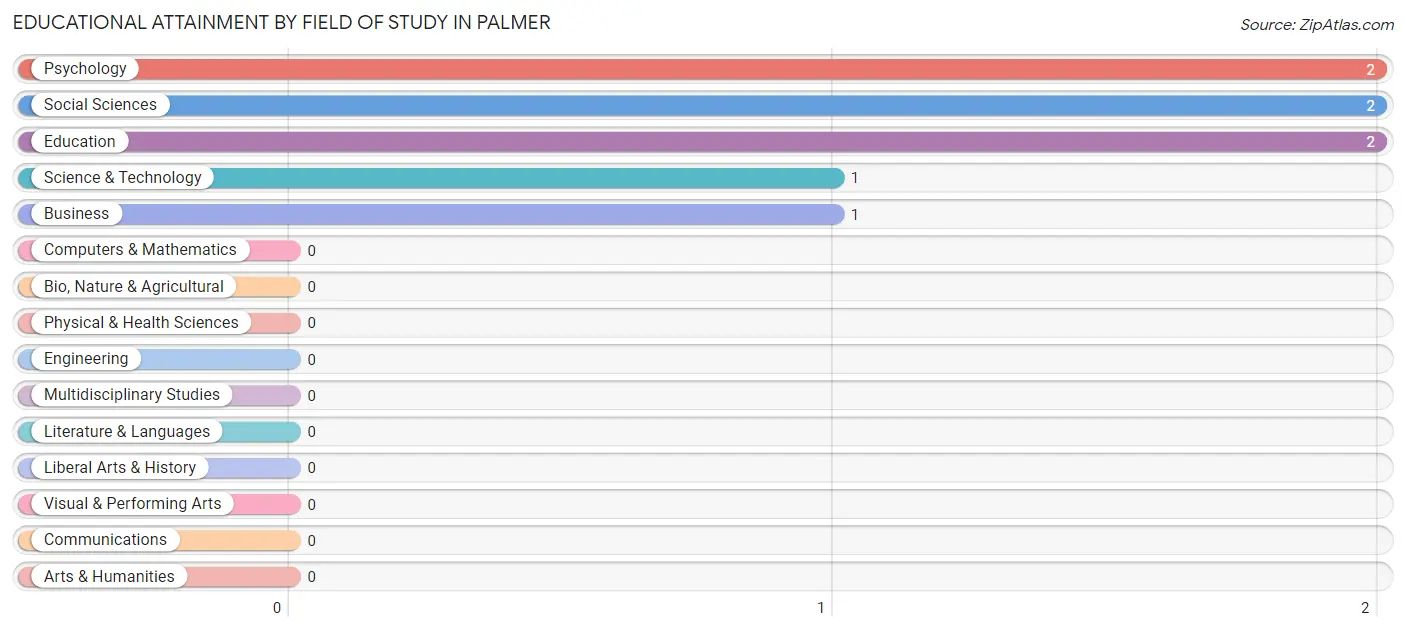
Educational Attainment by Field of Study in Palmer
Psychology (2 | 25.0%), social sciences (2 | 25.0%), education (2 | 25.0%), science & technology (1 | 12.5%), and business (1 | 12.5%) are the most common fields of study among 8 individuals in Palmer who have obtained a bachelor's degree or higher.
| Field of Study | # Graduates | % Graduates |
| Computers & Mathematics | 0 | 0.0% |
| Bio, Nature & Agricultural | 0 | 0.0% |
| Physical & Health Sciences | 0 | 0.0% |
| Psychology | 2 | 25.0% |
| Social Sciences | 2 | 25.0% |
| Engineering | 0 | 0.0% |
| Multidisciplinary Studies | 0 | 0.0% |
| Science & Technology | 1 | 12.5% |
| Business | 1 | 12.5% |
| Education | 2 | 25.0% |
| Literature & Languages | 0 | 0.0% |
| Liberal Arts & History | 0 | 0.0% |
| Visual & Performing Arts | 0 | 0.0% |
| Communications | 0 | 0.0% |
| Arts & Humanities | 0 | 0.0% |
| Total | 8 | 100.0% |
Transportation & Commute in Palmer
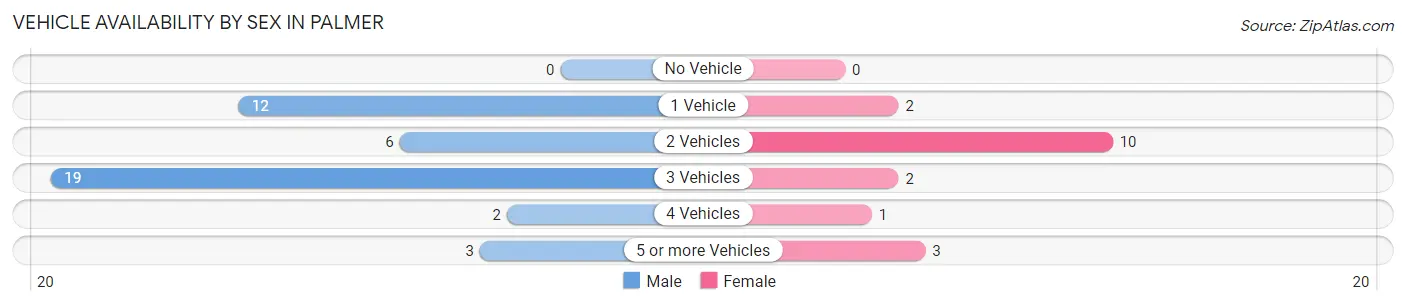
Vehicle Availability by Sex in Palmer
The most prevalent vehicle ownership categories in Palmer are males with 3 vehicles (19, accounting for 45.2%) and females with 3 vehicles (2, making up 105.6%).
| Vehicles Available | Male | Female |
| No Vehicle | 0 (0.0%) | 0 (0.0%) |
| 1 Vehicle | 12 (28.6%) | 2 (11.1%) |
| 2 Vehicles | 6 (14.3%) | 10 (55.6%) |
| 3 Vehicles | 19 (45.2%) | 2 (11.1%) |
| 4 Vehicles | 2 (4.8%) | 1 (5.6%) |
| 5 or more Vehicles | 3 (7.1%) | 3 (16.7%) |
| Total | 42 (100.0%) | 18 (100.0%) |
Commute Time in Palmer
The most frequently occuring commute durations in Palmer are 30 to 34 minutes (15 commuters, 25.9%), 15 to 19 minutes (11 commuters, 19.0%), and less than 5 minutes (7 commuters, 12.1%).
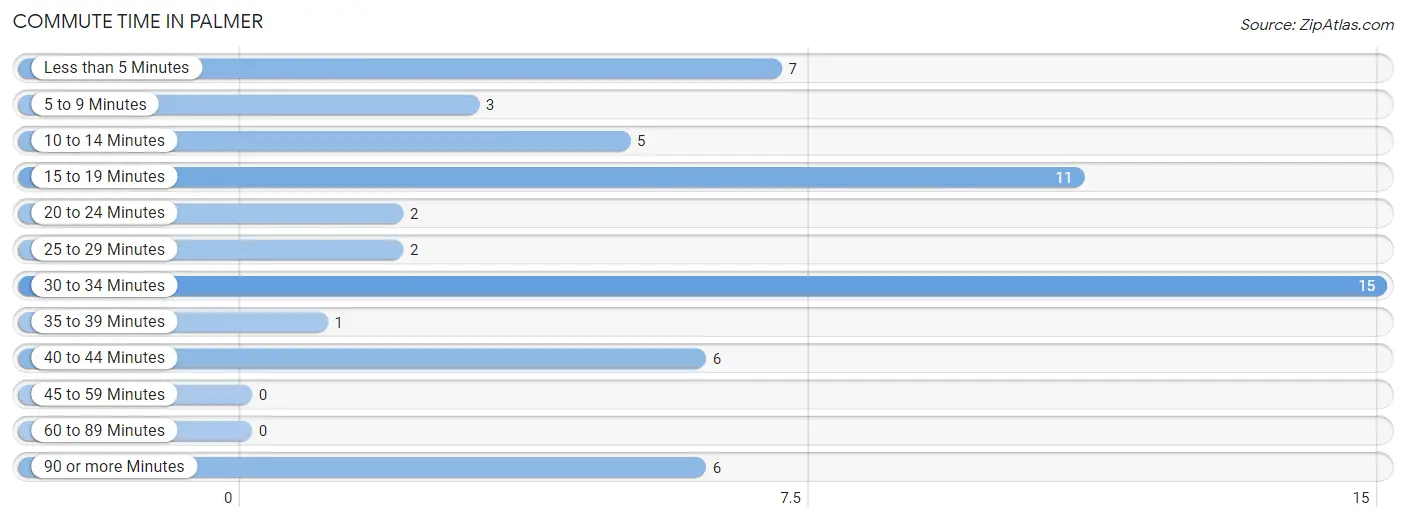
| Commute Time | # Commuters | % Commuters |
| Less than 5 Minutes | 7 | 12.1% |
| 5 to 9 Minutes | 3 | 5.2% |
| 10 to 14 Minutes | 5 | 8.6% |
| 15 to 19 Minutes | 11 | 19.0% |
| 20 to 24 Minutes | 2 | 3.5% |
| 25 to 29 Minutes | 2 | 3.5% |
| 30 to 34 Minutes | 15 | 25.9% |
| 35 to 39 Minutes | 1 | 1.7% |
| 40 to 44 Minutes | 6 | 10.3% |
| 45 to 59 Minutes | 0 | 0.0% |
| 60 to 89 Minutes | 0 | 0.0% |
| 90 or more Minutes | 6 | 10.3% |
Commute Time by Sex in Palmer
The most common commute times in Palmer are 30 to 34 minutes (15 commuters, 35.7%) for males and 15 to 19 minutes (6 commuters, 37.5%) for females.
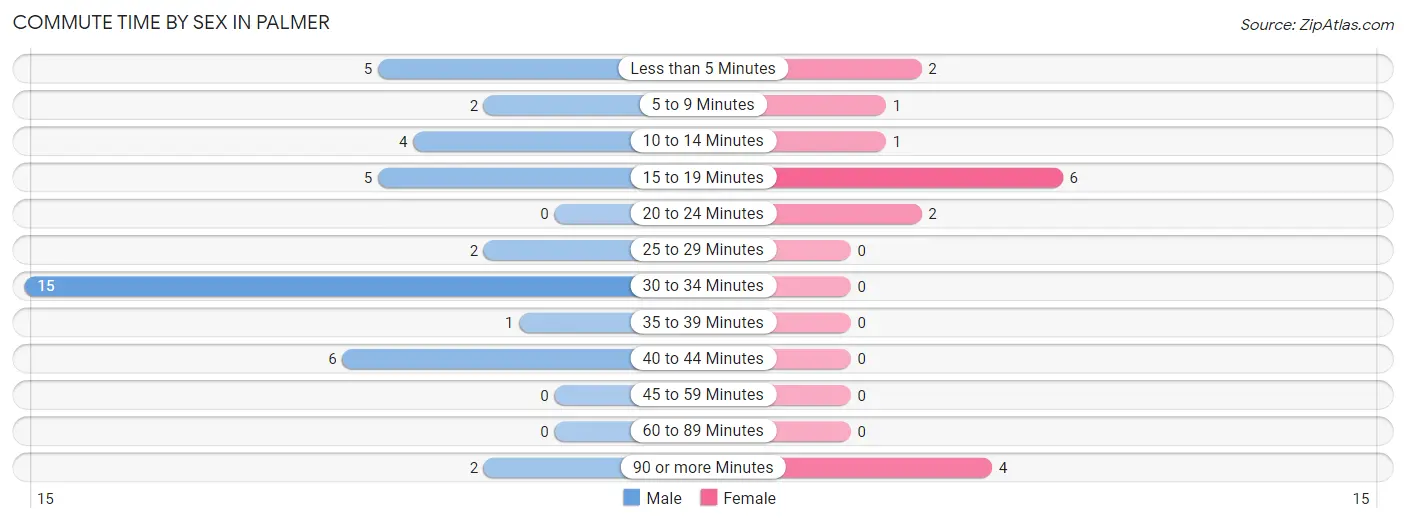
| Commute Time | Male | Female |
| Less than 5 Minutes | 5 (11.9%) | 2 (12.5%) |
| 5 to 9 Minutes | 2 (4.8%) | 1 (6.2%) |
| 10 to 14 Minutes | 4 (9.5%) | 1 (6.2%) |
| 15 to 19 Minutes | 5 (11.9%) | 6 (37.5%) |
| 20 to 24 Minutes | 0 (0.0%) | 2 (12.5%) |
| 25 to 29 Minutes | 2 (4.8%) | 0 (0.0%) |
| 30 to 34 Minutes | 15 (35.7%) | 0 (0.0%) |
| 35 to 39 Minutes | 1 (2.4%) | 0 (0.0%) |
| 40 to 44 Minutes | 6 (14.3%) | 0 (0.0%) |
| 45 to 59 Minutes | 0 (0.0%) | 0 (0.0%) |
| 60 to 89 Minutes | 0 (0.0%) | 0 (0.0%) |
| 90 or more Minutes | 2 (4.8%) | 4 (25.0%) |
Time of Departure to Work by Sex in Palmer
The most frequent times of departure to work in Palmer are 5:00 AM to 5:29 AM (20, 47.6%) for males and 5:30 AM to 5:59 AM (4, 25.0%) for females.
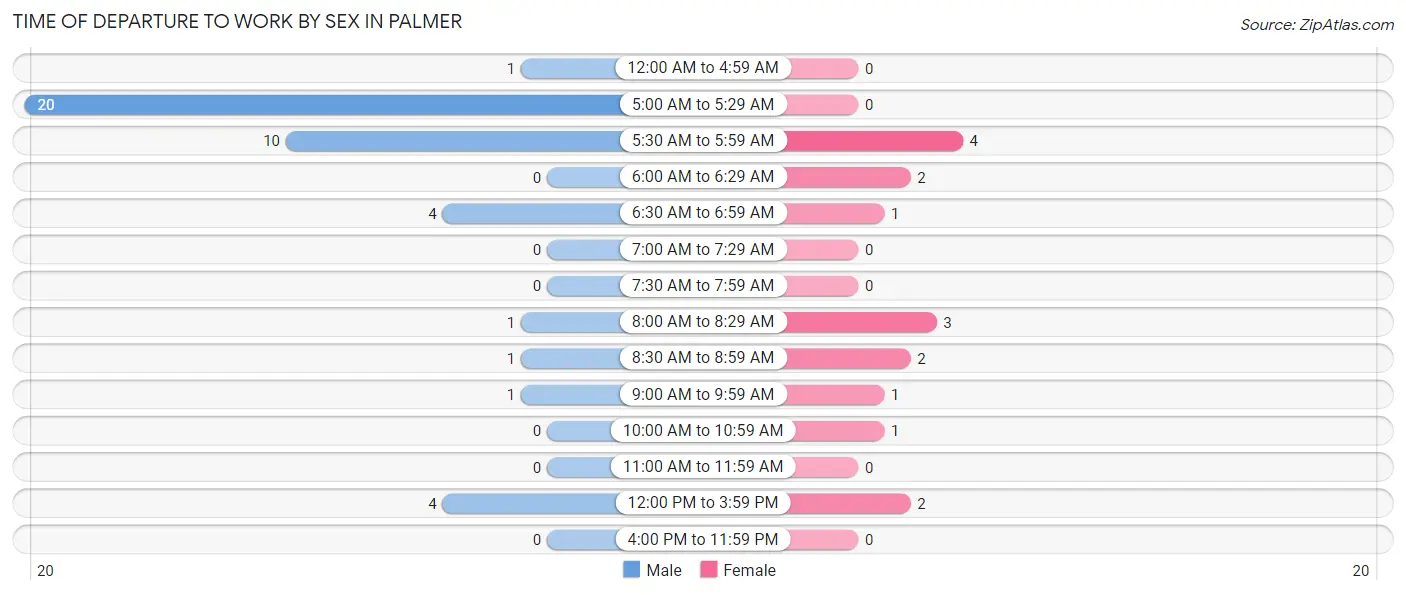
| Time of Departure | Male | Female |
| 12:00 AM to 4:59 AM | 1 (2.4%) | 0 (0.0%) |
| 5:00 AM to 5:29 AM | 20 (47.6%) | 0 (0.0%) |
| 5:30 AM to 5:59 AM | 10 (23.8%) | 4 (25.0%) |
| 6:00 AM to 6:29 AM | 0 (0.0%) | 2 (12.5%) |
| 6:30 AM to 6:59 AM | 4 (9.5%) | 1 (6.2%) |
| 7:00 AM to 7:29 AM | 0 (0.0%) | 0 (0.0%) |
| 7:30 AM to 7:59 AM | 0 (0.0%) | 0 (0.0%) |
| 8:00 AM to 8:29 AM | 1 (2.4%) | 3 (18.8%) |
| 8:30 AM to 8:59 AM | 1 (2.4%) | 2 (12.5%) |
| 9:00 AM to 9:59 AM | 1 (2.4%) | 1 (6.2%) |
| 10:00 AM to 10:59 AM | 0 (0.0%) | 1 (6.2%) |
| 11:00 AM to 11:59 AM | 0 (0.0%) | 0 (0.0%) |
| 12:00 PM to 3:59 PM | 4 (9.5%) | 2 (12.5%) |
| 4:00 PM to 11:59 PM | 0 (0.0%) | 0 (0.0%) |
| Total | 42 (100.0%) | 16 (100.0%) |
Housing Occupancy in Palmer
Occupancy by Ownership in Palmer
Of the total 75 dwellings in Palmer, owner-occupied units account for 67 (89.3%), while renter-occupied units make up 8 (10.7%).
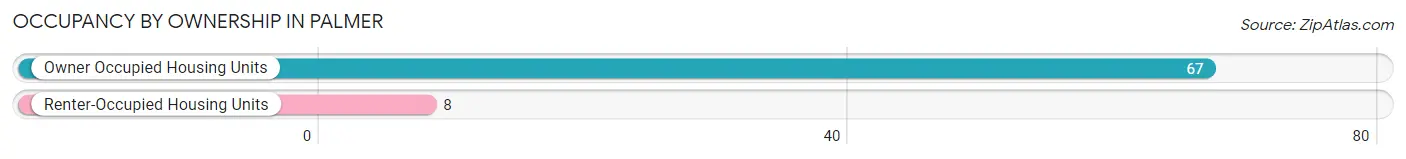
| Occupancy | # Housing Units | % Housing Units |
| Owner Occupied Housing Units | 67 | 89.3% |
| Renter-Occupied Housing Units | 8 | 10.7% |
| Total Occupied Housing Units | 75 | 100.0% |
Occupancy by Household Size in Palmer
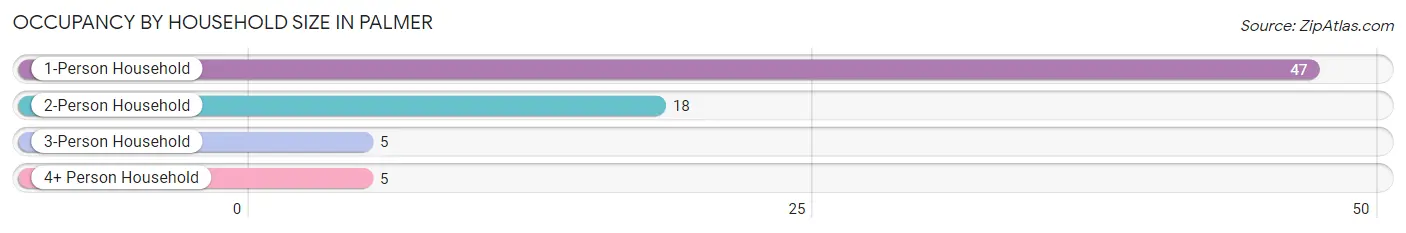
| Household Size | # Housing Units | % Housing Units |
| 1-Person Household | 47 | 62.7% |
| 2-Person Household | 18 | 24.0% |
| 3-Person Household | 5 | 6.7% |
| 4+ Person Household | 5 | 6.7% |
| Total Housing Units | 75 | 100.0% |
Occupancy by Ownership by Household Size in Palmer
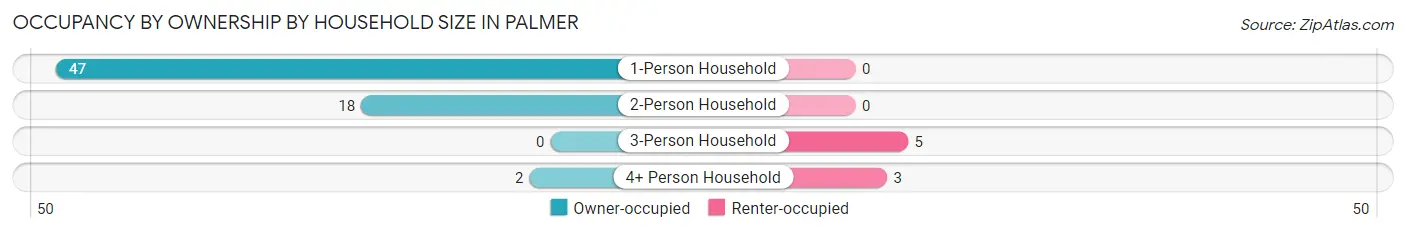
| Household Size | Owner-occupied | Renter-occupied |
| 1-Person Household | 47 (100.0%) | 0 (0.0%) |
| 2-Person Household | 18 (100.0%) | 0 (0.0%) |
| 3-Person Household | 0 (0.0%) | 5 (100.0%) |
| 4+ Person Household | 2 (40.0%) | 3 (60.0%) |
| Total Housing Units | 67 (89.3%) | 8 (10.7%) |
Occupancy by Educational Attainment in Palmer
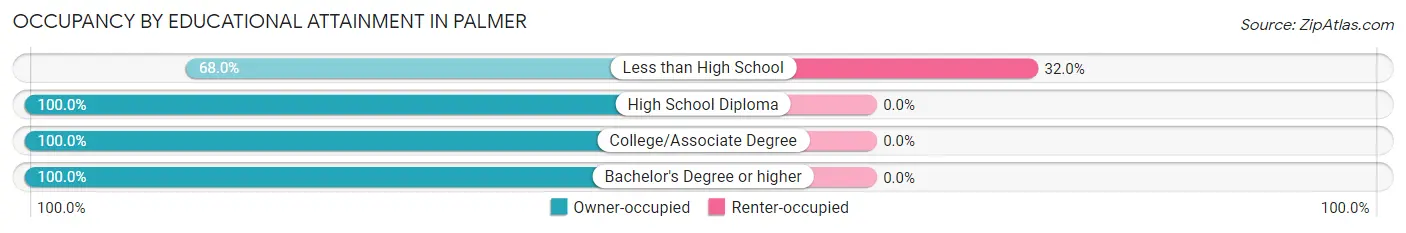
| Household Size | Owner-occupied | Renter-occupied |
| Less than High School | 17 (68.0%) | 8 (32.0%) |
| High School Diploma | 16 (100.0%) | 0 (0.0%) |
| College/Associate Degree | 27 (100.0%) | 0 (0.0%) |
| Bachelor's Degree or higher | 7 (100.0%) | 0 (0.0%) |
Occupancy by Age of Householder in Palmer
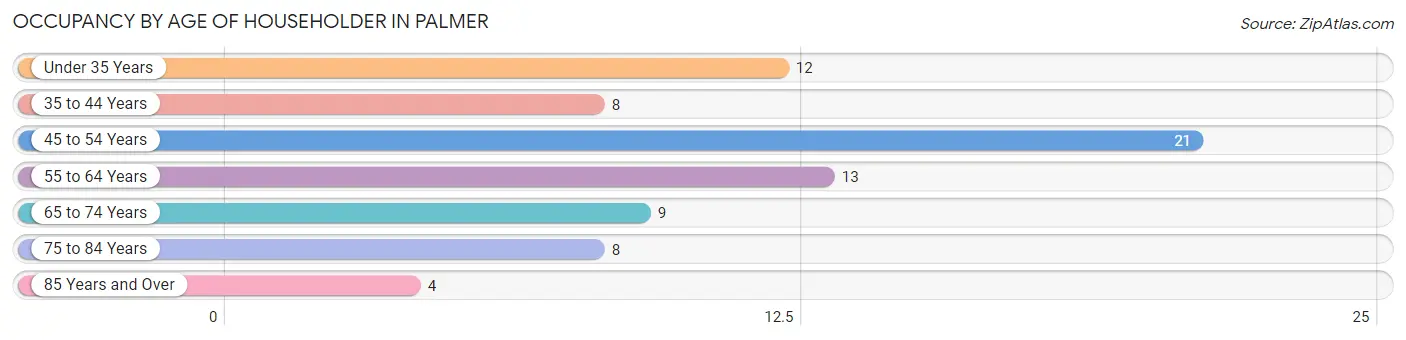
| Age Bracket | # Households | % Households |
| Under 35 Years | 12 | 16.0% |
| 35 to 44 Years | 8 | 10.7% |
| 45 to 54 Years | 21 | 28.0% |
| 55 to 64 Years | 13 | 17.3% |
| 65 to 74 Years | 9 | 12.0% |
| 75 to 84 Years | 8 | 10.7% |
| 85 Years and Over | 4 | 5.3% |
| Total | 75 | 100.0% |
Housing Finances in Palmer
Median Income by Occupancy in Palmer
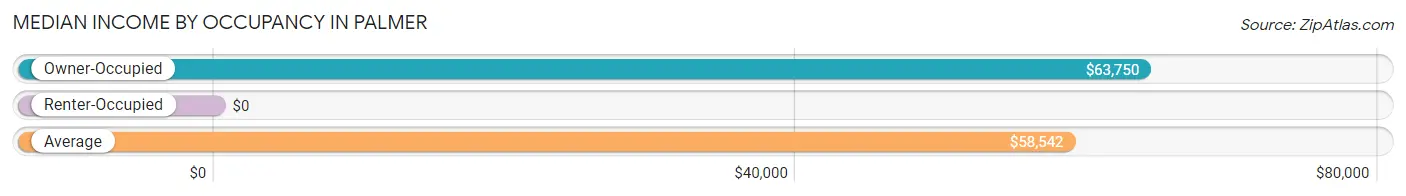
| Occupancy Type | # Households | Median Income |
| Owner-Occupied | 67 (89.3%) | $63,750 |
| Renter-Occupied | 8 (10.7%) | $0 |
| Average | 75 (100.0%) | $58,542 |
Occupancy by Householder Income Bracket in Palmer
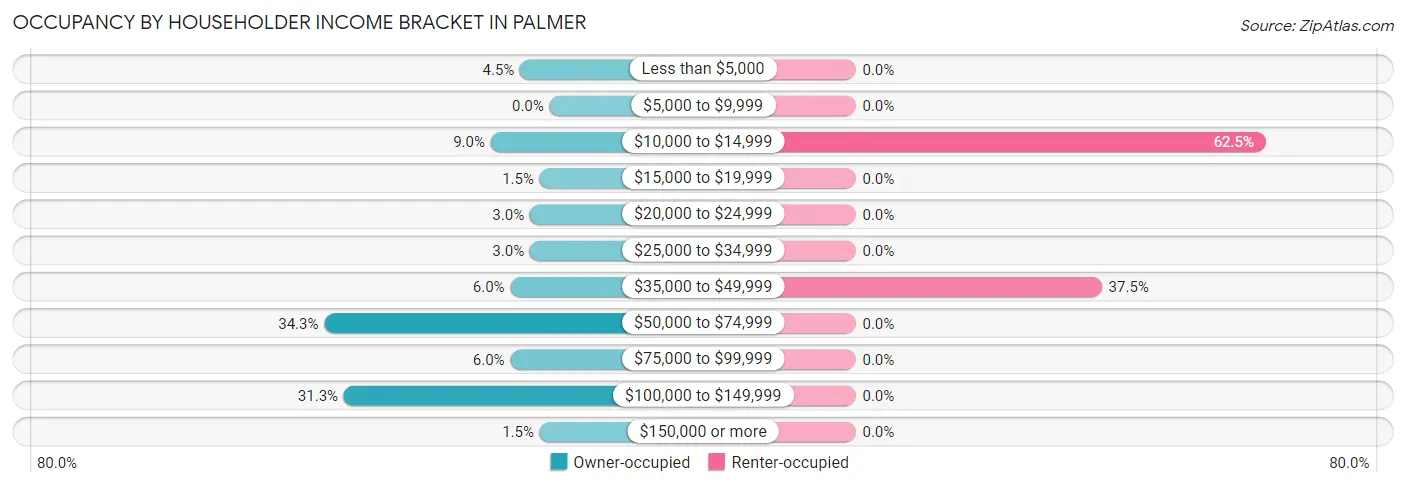
| Income Bracket | Owner-occupied | Renter-occupied |
| Less than $5,000 | 3 (4.5%) | 0 (0.0%) |
| $5,000 to $9,999 | 0 (0.0%) | 0 (0.0%) |
| $10,000 to $14,999 | 6 (9.0%) | 5 (62.5%) |
| $15,000 to $19,999 | 1 (1.5%) | 0 (0.0%) |
| $20,000 to $24,999 | 2 (3.0%) | 0 (0.0%) |
| $25,000 to $34,999 | 2 (3.0%) | 0 (0.0%) |
| $35,000 to $49,999 | 4 (6.0%) | 3 (37.5%) |
| $50,000 to $74,999 | 23 (34.3%) | 0 (0.0%) |
| $75,000 to $99,999 | 4 (6.0%) | 0 (0.0%) |
| $100,000 to $149,999 | 21 (31.3%) | 0 (0.0%) |
| $150,000 or more | 1 (1.5%) | 0 (0.0%) |
| Total | 67 (100.0%) | 8 (100.0%) |
Monthly Housing Cost Tiers in Palmer
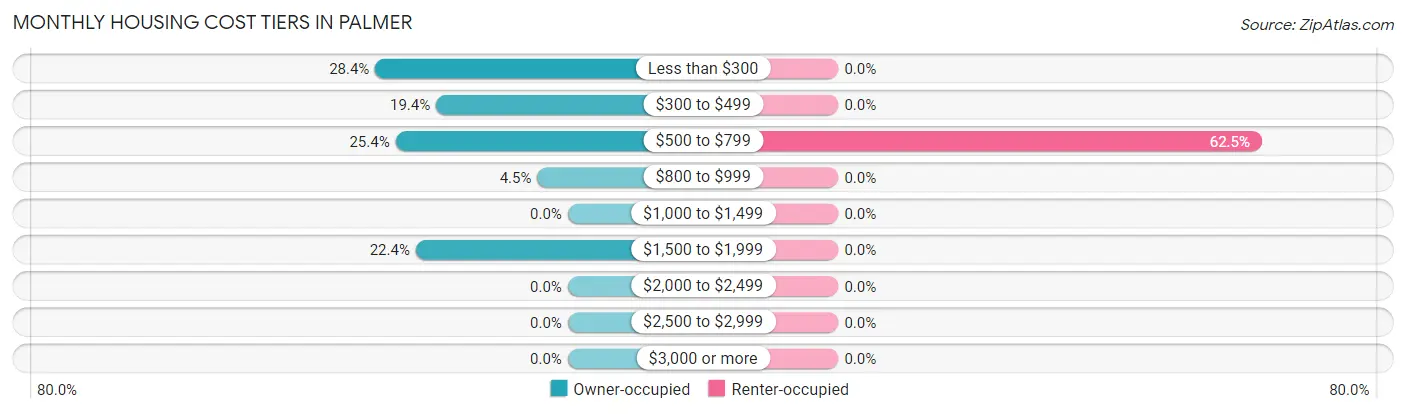
| Monthly Cost | Owner-occupied | Renter-occupied |
| Less than $300 | 19 (28.4%) | 0 (0.0%) |
| $300 to $499 | 13 (19.4%) | 0 (0.0%) |
| $500 to $799 | 17 (25.4%) | 5 (62.5%) |
| $800 to $999 | 3 (4.5%) | 0 (0.0%) |
| $1,000 to $1,499 | 0 (0.0%) | 0 (0.0%) |
| $1,500 to $1,999 | 15 (22.4%) | 0 (0.0%) |
| $2,000 to $2,499 | 0 (0.0%) | 0 (0.0%) |
| $2,500 to $2,999 | 0 (0.0%) | 0 (0.0%) |
| $3,000 or more | 0 (0.0%) | 0 (0.0%) |
| Total | 67 (100.0%) | 8 (100.0%) |
Physical Housing Characteristics in Palmer
Housing Structures in Palmer
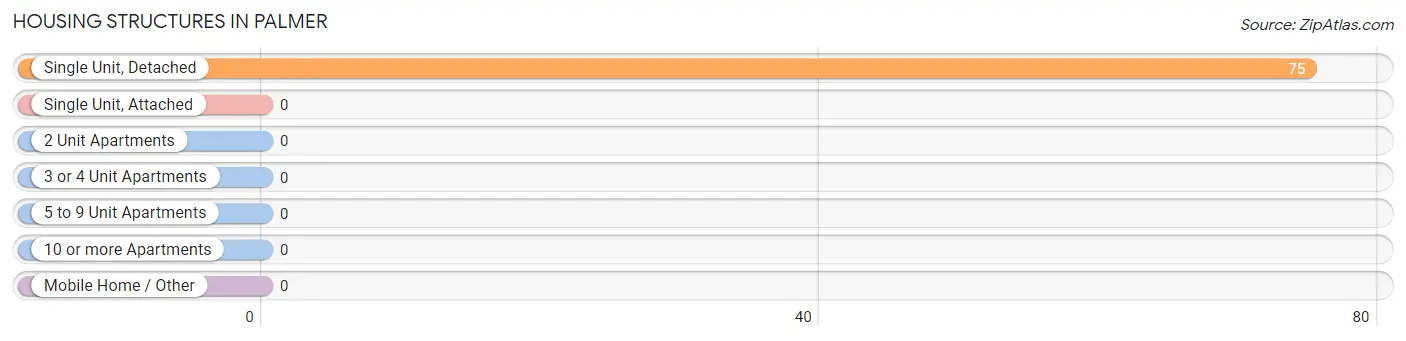
| Structure Type | # Housing Units | % Housing Units |
| Single Unit, Detached | 75 | 100.0% |
| Single Unit, Attached | 0 | 0.0% |
| 2 Unit Apartments | 0 | 0.0% |
| 3 or 4 Unit Apartments | 0 | 0.0% |
| 5 to 9 Unit Apartments | 0 | 0.0% |
| 10 or more Apartments | 0 | 0.0% |
| Mobile Home / Other | 0 | 0.0% |
| Total | 75 | 100.0% |
Housing Structures by Occupancy in Palmer
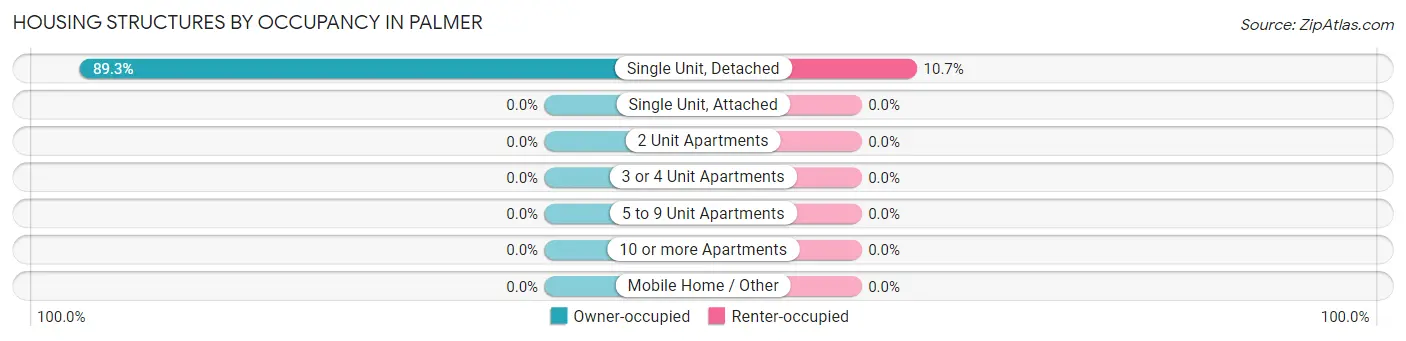
| Structure Type | Owner-occupied | Renter-occupied |
| Single Unit, Detached | 67 (89.3%) | 8 (10.7%) |
| Single Unit, Attached | 0 (0.0%) | 0 (0.0%) |
| 2 Unit Apartments | 0 (0.0%) | 0 (0.0%) |
| 3 or 4 Unit Apartments | 0 (0.0%) | 0 (0.0%) |
| 5 to 9 Unit Apartments | 0 (0.0%) | 0 (0.0%) |
| 10 or more Apartments | 0 (0.0%) | 0 (0.0%) |
| Mobile Home / Other | 0 (0.0%) | 0 (0.0%) |
| Total | 67 (89.3%) | 8 (10.7%) |
Housing Structures by Number of Rooms in Palmer
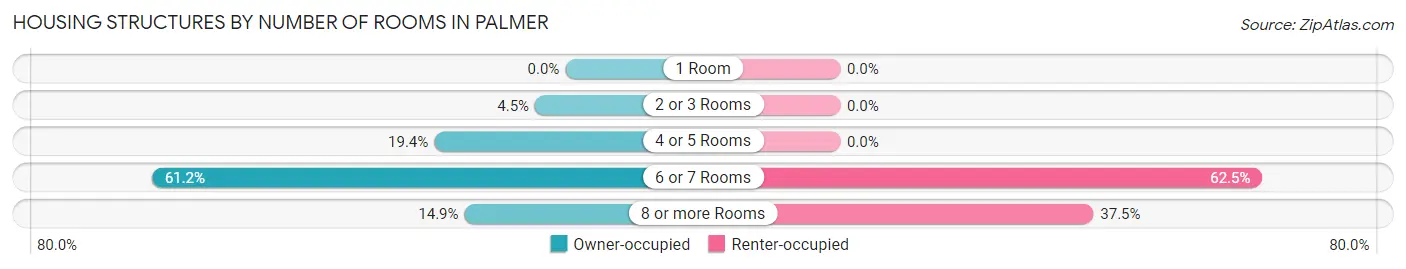
| Number of Rooms | Owner-occupied | Renter-occupied |
| 1 Room | 0 (0.0%) | 0 (0.0%) |
| 2 or 3 Rooms | 3 (4.5%) | 0 (0.0%) |
| 4 or 5 Rooms | 13 (19.4%) | 0 (0.0%) |
| 6 or 7 Rooms | 41 (61.2%) | 5 (62.5%) |
| 8 or more Rooms | 10 (14.9%) | 3 (37.5%) |
| Total | 67 (100.0%) | 8 (100.0%) |
Housing Structure by Heating Type in Palmer
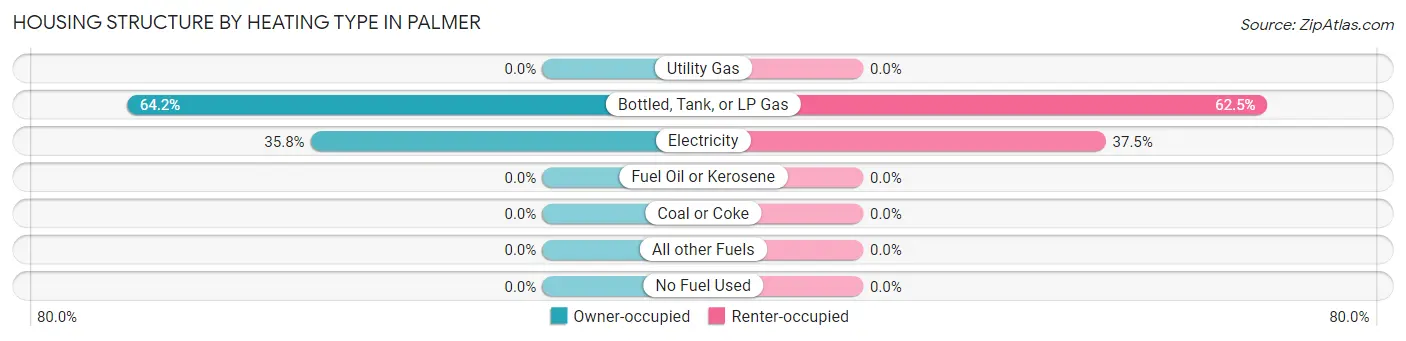
| Heating Type | Owner-occupied | Renter-occupied |
| Utility Gas | 0 (0.0%) | 0 (0.0%) |
| Bottled, Tank, or LP Gas | 43 (64.2%) | 5 (62.5%) |
| Electricity | 24 (35.8%) | 3 (37.5%) |
| Fuel Oil or Kerosene | 0 (0.0%) | 0 (0.0%) |
| Coal or Coke | 0 (0.0%) | 0 (0.0%) |
| All other Fuels | 0 (0.0%) | 0 (0.0%) |
| No Fuel Used | 0 (0.0%) | 0 (0.0%) |
| Total | 67 (100.0%) | 8 (100.0%) |
Household Vehicle Usage in Palmer
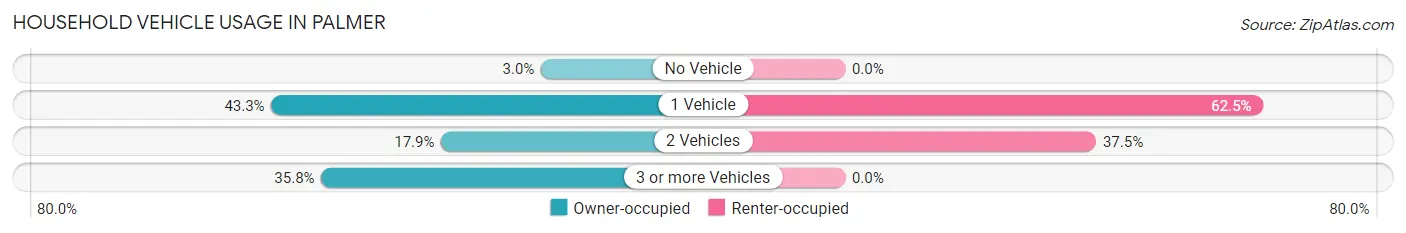
| Vehicles per Household | Owner-occupied | Renter-occupied |
| No Vehicle | 2 (3.0%) | 0 (0.0%) |
| 1 Vehicle | 29 (43.3%) | 5 (62.5%) |
| 2 Vehicles | 12 (17.9%) | 3 (37.5%) |
| 3 or more Vehicles | 24 (35.8%) | 0 (0.0%) |
| Total | 67 (100.0%) | 8 (100.0%) |
Real Estate & Mortgages in Palmer
Real Estate and Mortgage Overview in Palmer
| Characteristic | Without Mortgage | With Mortgage |
| Housing Units | 40 | 27 |
| Median Property Value | $27,000 | $32,200 |
| Median Household Income | $54,000 | $1 |
| Monthly Housing Costs | $313 | $0 |
| Real Estate Taxes | $281 | $2 |
Property Value by Mortgage Status in Palmer
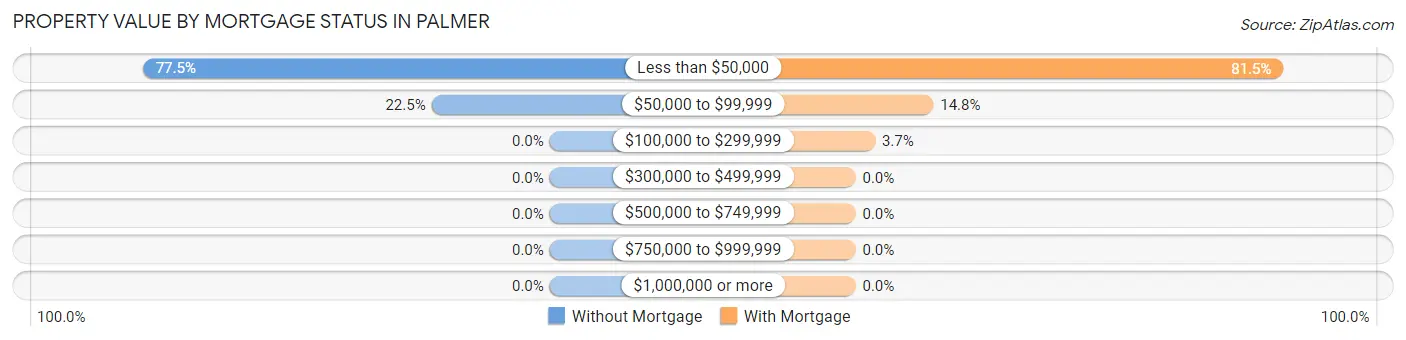
| Property Value | Without Mortgage | With Mortgage |
| Less than $50,000 | 31 (77.5%) | 22 (81.5%) |
| $50,000 to $99,999 | 9 (22.5%) | 4 (14.8%) |
| $100,000 to $299,999 | 0 (0.0%) | 1 (3.7%) |
| $300,000 to $499,999 | 0 (0.0%) | 0 (0.0%) |
| $500,000 to $749,999 | 0 (0.0%) | 0 (0.0%) |
| $750,000 to $999,999 | 0 (0.0%) | 0 (0.0%) |
| $1,000,000 or more | 0 (0.0%) | 0 (0.0%) |
| Total | 40 (100.0%) | 27 (100.0%) |
Household Income by Mortgage Status in Palmer
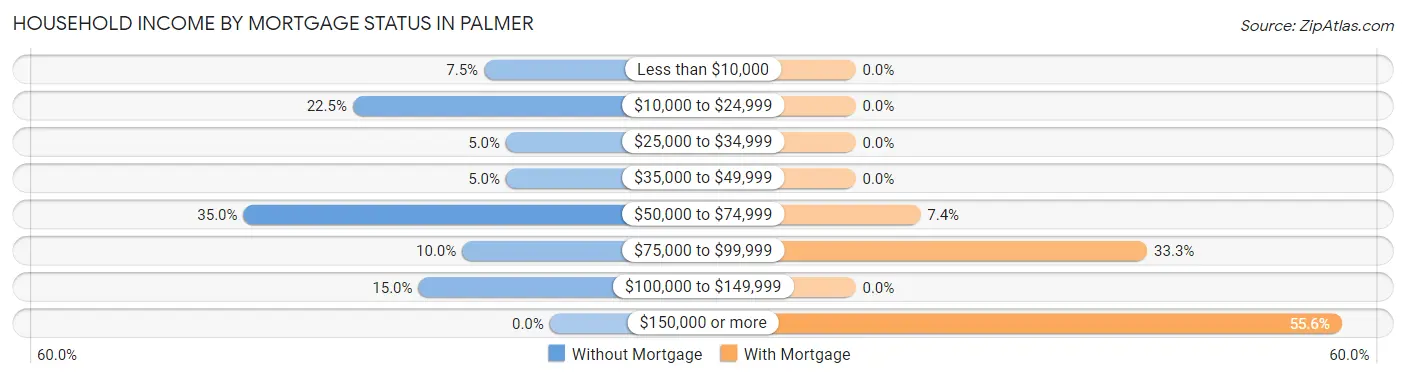
| Household Income | Without Mortgage | With Mortgage |
| Less than $10,000 | 3 (7.5%) | 0 (0.0%) |
| $10,000 to $24,999 | 9 (22.5%) | 0 (0.0%) |
| $25,000 to $34,999 | 2 (5.0%) | 0 (0.0%) |
| $35,000 to $49,999 | 2 (5.0%) | 0 (0.0%) |
| $50,000 to $74,999 | 14 (35.0%) | 2 (7.4%) |
| $75,000 to $99,999 | 4 (10.0%) | 9 (33.3%) |
| $100,000 to $149,999 | 6 (15.0%) | 0 (0.0%) |
| $150,000 or more | 0 (0.0%) | 15 (55.6%) |
| Total | 40 (100.0%) | 27 (100.0%) |
Property Value to Household Income Ratio in Palmer
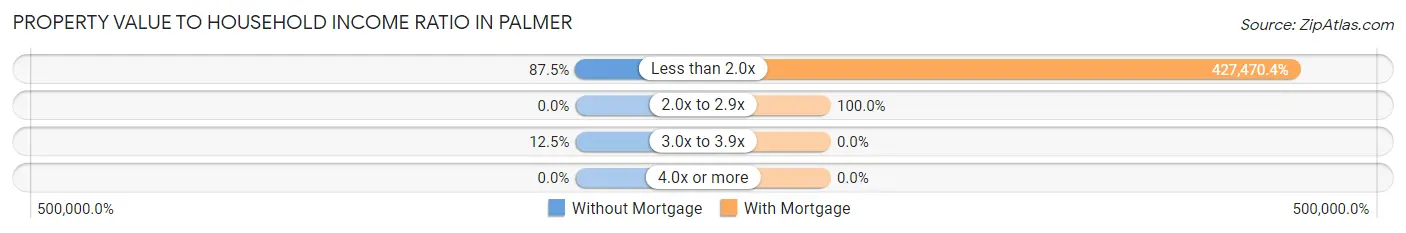
| Value-to-Income Ratio | Without Mortgage | With Mortgage |
| Less than 2.0x | 35 (87.5%) | 115,417 (427,470.4%) |
| 2.0x to 2.9x | 0 (0.0%) | 27 (100.0%) |
| 3.0x to 3.9x | 5 (12.5%) | 0 (0.0%) |
| 4.0x or more | 0 (0.0%) | 0 (0.0%) |
| Total | 40 (100.0%) | 27 (100.0%) |
Real Estate Taxes by Mortgage Status in Palmer
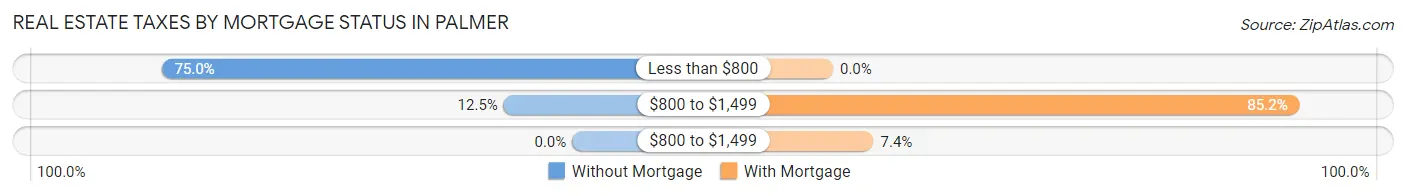
| Property Taxes | Without Mortgage | With Mortgage |
| Less than $800 | 30 (75.0%) | 0 (0.0%) |
| $800 to $1,499 | 5 (12.5%) | 23 (85.2%) |
| $800 to $1,499 | 0 (0.0%) | 2 (7.4%) |
| Total | 40 (100.0%) | 27 (100.0%) |
Health & Disability in Palmer
Health Insurance Coverage by Age in Palmer
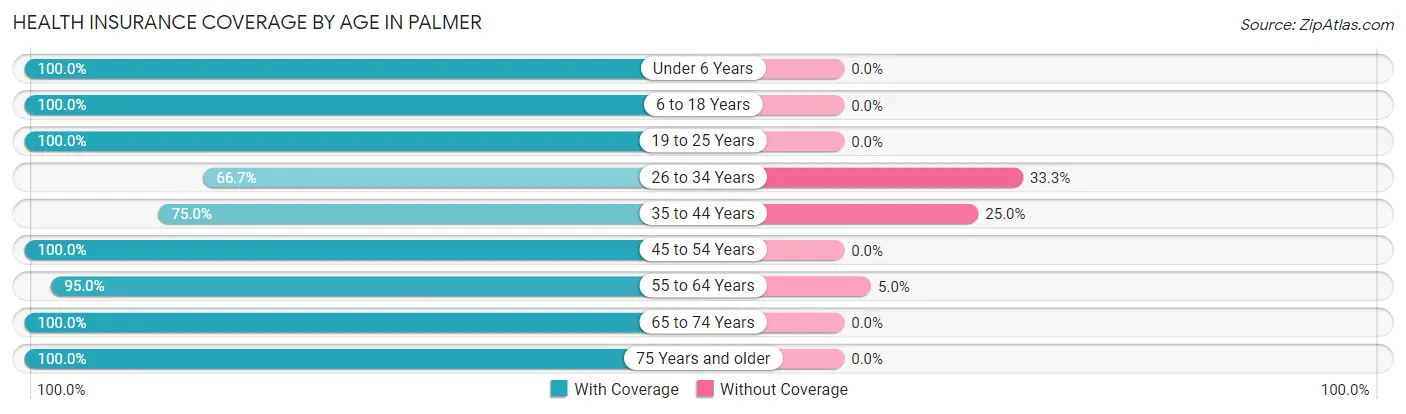
| Age Bracket | With Coverage | Without Coverage |
| Under 6 Years | 6 (100.0%) | 0 (0.0%) |
| 6 to 18 Years | 17 (100.0%) | 0 (0.0%) |
| 19 to 25 Years | 10 (100.0%) | 0 (0.0%) |
| 26 to 34 Years | 4 (66.7%) | 2 (33.3%) |
| 35 to 44 Years | 12 (75.0%) | 4 (25.0%) |
| 45 to 54 Years | 24 (100.0%) | 0 (0.0%) |
| 55 to 64 Years | 19 (95.0%) | 1 (5.0%) |
| 65 to 74 Years | 13 (100.0%) | 0 (0.0%) |
| 75 Years and older | 15 (100.0%) | 0 (0.0%) |
| Total | 120 (94.5%) | 7 (5.5%) |
Health Insurance Coverage by Citizenship Status in Palmer
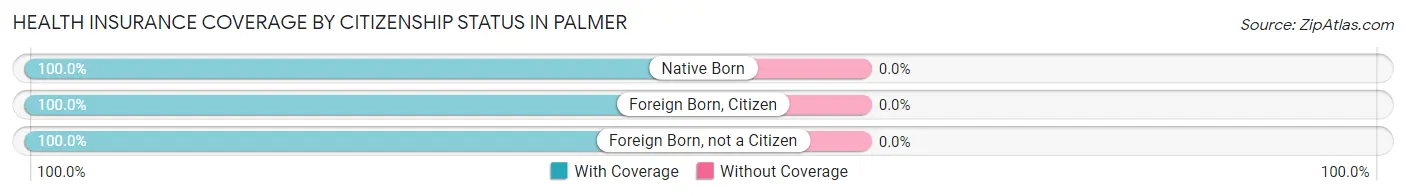
| Citizenship Status | With Coverage | Without Coverage |
| Native Born | 6 (100.0%) | 0 (0.0%) |
| Foreign Born, Citizen | 17 (100.0%) | 0 (0.0%) |
| Foreign Born, not a Citizen | 10 (100.0%) | 0 (0.0%) |
Health Insurance Coverage by Household Income in Palmer
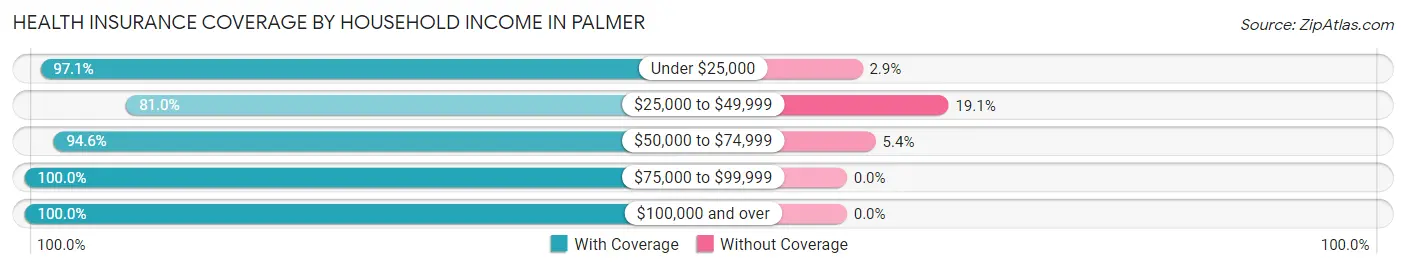
| Household Income | With Coverage | Without Coverage |
| Under $25,000 | 33 (97.1%) | 1 (2.9%) |
| $25,000 to $49,999 | 17 (80.9%) | 4 (19.1%) |
| $50,000 to $74,999 | 35 (94.6%) | 2 (5.4%) |
| $75,000 to $99,999 | 7 (100.0%) | 0 (0.0%) |
| $100,000 and over | 28 (100.0%) | 0 (0.0%) |
Public vs Private Health Insurance Coverage by Age in Palmer
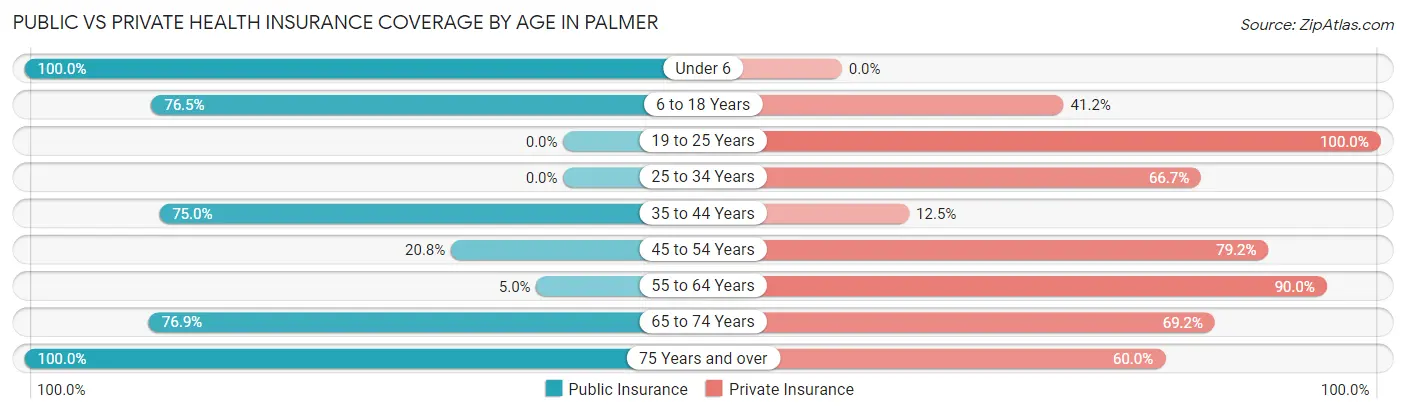
| Age Bracket | Public Insurance | Private Insurance |
| Under 6 | 6 (100.0%) | 0 (0.0%) |
| 6 to 18 Years | 13 (76.5%) | 7 (41.2%) |
| 19 to 25 Years | 0 (0.0%) | 10 (100.0%) |
| 25 to 34 Years | 0 (0.0%) | 4 (66.7%) |
| 35 to 44 Years | 12 (75.0%) | 2 (12.5%) |
| 45 to 54 Years | 5 (20.8%) | 19 (79.2%) |
| 55 to 64 Years | 1 (5.0%) | 18 (90.0%) |
| 65 to 74 Years | 10 (76.9%) | 9 (69.2%) |
| 75 Years and over | 15 (100.0%) | 9 (60.0%) |
| Total | 62 (48.8%) | 78 (61.4%) |
Disability Status by Sex by Age in Palmer
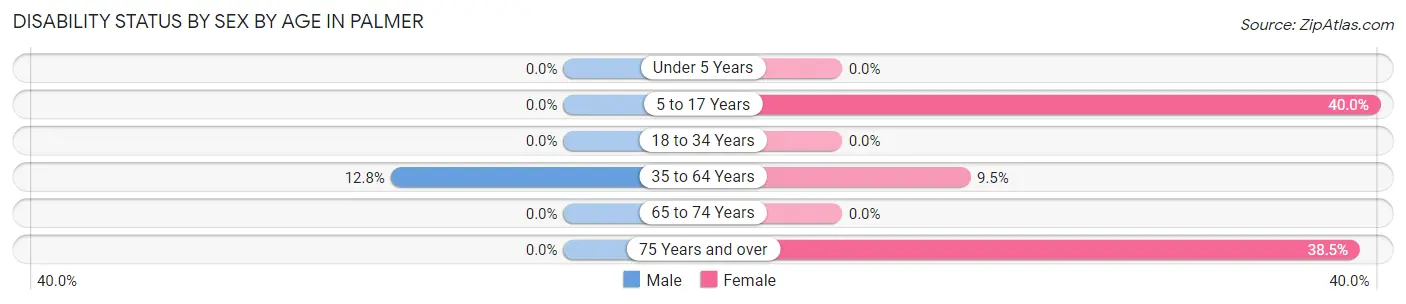
| Age Bracket | Male | Female |
| Under 5 Years | 0 (0.0%) | 0 (0.0%) |
| 5 to 17 Years | 0 (0.0%) | 6 (40.0%) |
| 18 to 34 Years | 0 (0.0%) | 0 (0.0%) |
| 35 to 64 Years | 5 (12.8%) | 2 (9.5%) |
| 65 to 74 Years | 0 (0.0%) | 0 (0.0%) |
| 75 Years and over | 0 (0.0%) | 5 (38.5%) |
Disability Class by Sex by Age in Palmer
Disability Class: Hearing Difficulty
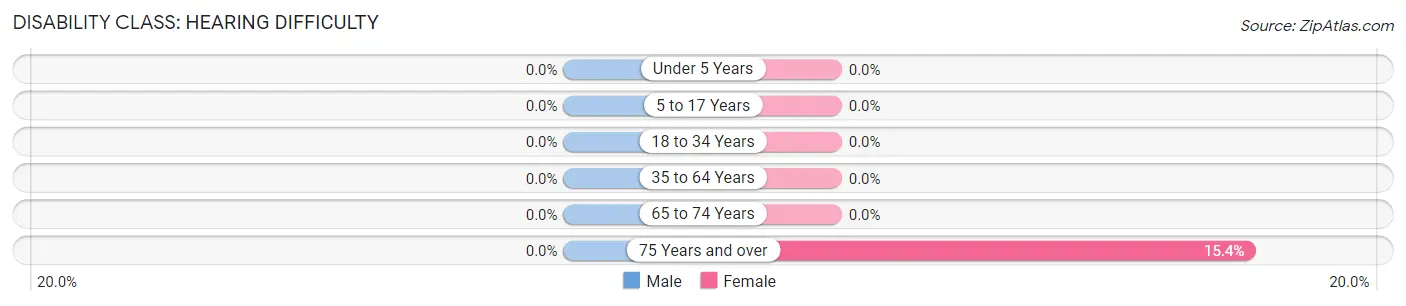
| Age Bracket | Male | Female |
| Under 5 Years | 0 (0.0%) | 0 (0.0%) |
| 5 to 17 Years | 0 (0.0%) | 0 (0.0%) |
| 18 to 34 Years | 0 (0.0%) | 0 (0.0%) |
| 35 to 64 Years | 0 (0.0%) | 0 (0.0%) |
| 65 to 74 Years | 0 (0.0%) | 0 (0.0%) |
| 75 Years and over | 0 (0.0%) | 2 (15.4%) |
Disability Class: Vision Difficulty
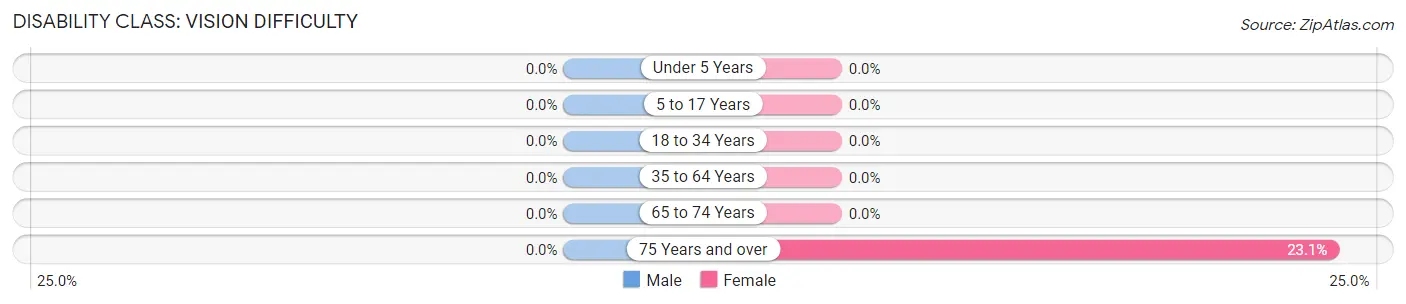
| Age Bracket | Male | Female |
| Under 5 Years | 0 (0.0%) | 0 (0.0%) |
| 5 to 17 Years | 0 (0.0%) | 0 (0.0%) |
| 18 to 34 Years | 0 (0.0%) | 0 (0.0%) |
| 35 to 64 Years | 0 (0.0%) | 0 (0.0%) |
| 65 to 74 Years | 0 (0.0%) | 0 (0.0%) |
| 75 Years and over | 0 (0.0%) | 3 (23.1%) |
Disability Class: Cognitive Difficulty
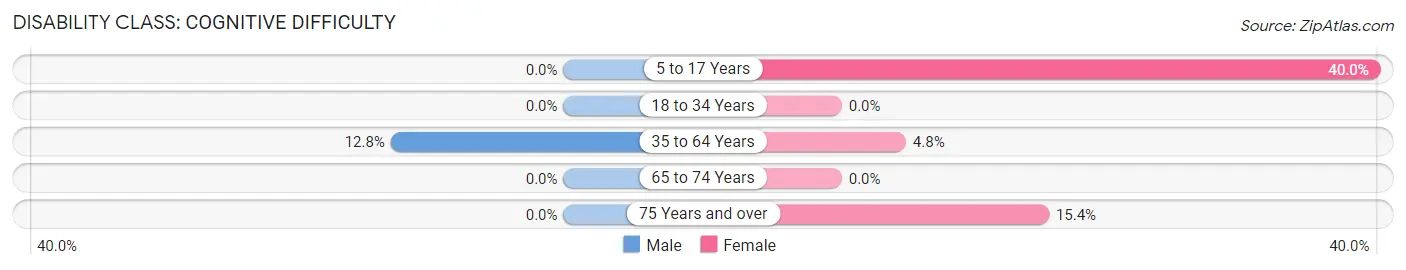
| Age Bracket | Male | Female |
| 5 to 17 Years | 0 (0.0%) | 6 (40.0%) |
| 18 to 34 Years | 0 (0.0%) | 0 (0.0%) |
| 35 to 64 Years | 5 (12.8%) | 1 (4.8%) |
| 65 to 74 Years | 0 (0.0%) | 0 (0.0%) |
| 75 Years and over | 0 (0.0%) | 2 (15.4%) |
Disability Class: Ambulatory Difficulty
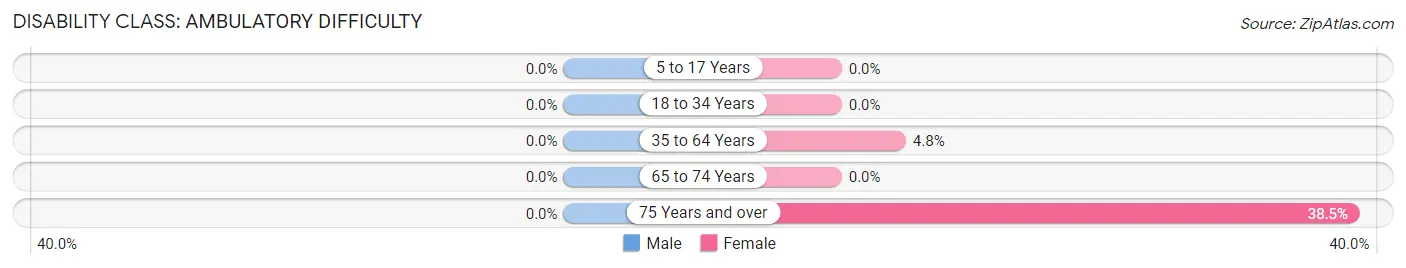
| Age Bracket | Male | Female |
| 5 to 17 Years | 0 (0.0%) | 0 (0.0%) |
| 18 to 34 Years | 0 (0.0%) | 0 (0.0%) |
| 35 to 64 Years | 0 (0.0%) | 1 (4.8%) |
| 65 to 74 Years | 0 (0.0%) | 0 (0.0%) |
| 75 Years and over | 0 (0.0%) | 5 (38.5%) |
Disability Class: Self-Care Difficulty
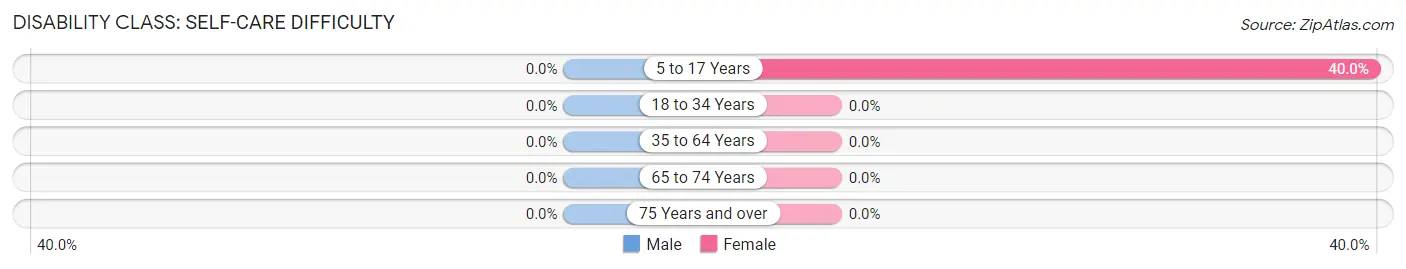
| Age Bracket | Male | Female |
| 5 to 17 Years | 0 (0.0%) | 6 (40.0%) |
| 18 to 34 Years | 0 (0.0%) | 0 (0.0%) |
| 35 to 64 Years | 0 (0.0%) | 0 (0.0%) |
| 65 to 74 Years | 0 (0.0%) | 0 (0.0%) |
| 75 Years and over | 0 (0.0%) | 0 (0.0%) |
Technology Access in Palmer
Computing Device Access in Palmer
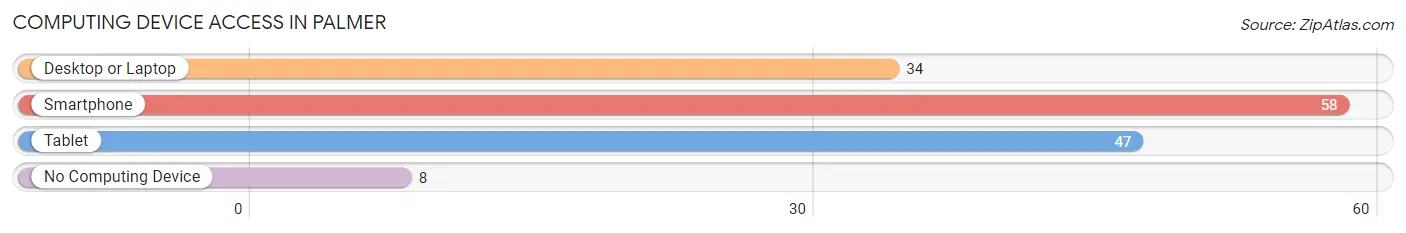
| Device Type | # Households | % Households |
| Desktop or Laptop | 34 | 45.3% |
| Smartphone | 58 | 77.3% |
| Tablet | 47 | 62.7% |
| No Computing Device | 8 | 10.7% |
| Total | 75 | 100.0% |
Internet Access in Palmer
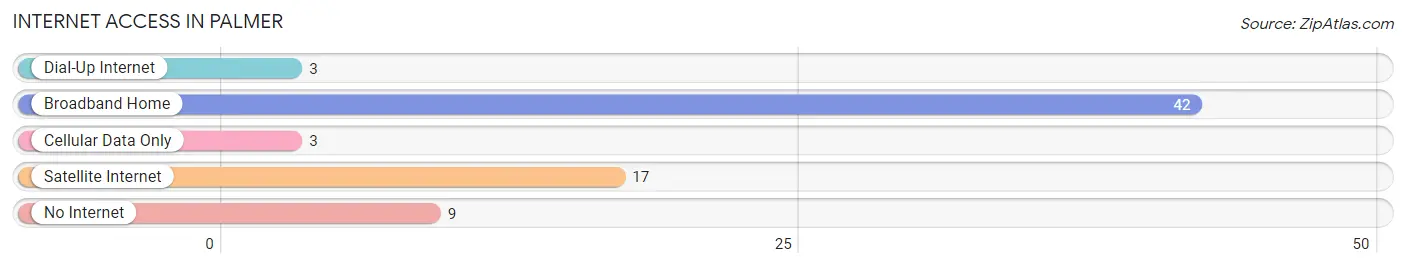
| Internet Type | # Households | % Households |
| Dial-Up Internet | 3 | 4.0% |
| Broadband Home | 42 | 56.0% |
| Cellular Data Only | 3 | 4.0% |
| Satellite Internet | 17 | 22.7% |
| No Internet | 9 | 12.0% |
| Total | 75 | 100.0% |
Palmer Summary
Palmer, Iowa is a small town located in the northwest corner of the state, in the county of Harrison. It is situated on the banks of the Missouri River, and is home to a population of just over 500 people. The town was founded in 1856, and has a rich history of farming, industry, and commerce.
Geography
Palmer is located in the northwest corner of Iowa, in Harrison County. It is situated on the banks of the Missouri River, and is surrounded by rolling hills and farmland. The town is located approximately 25 miles from the state capital of Des Moines, and is within easy driving distance of Omaha, Nebraska. The town is also close to the Iowa-Nebraska border, and is within a few hours drive of both Kansas City and St. Louis.
The town is situated on a flat plain, with the Missouri River to the north and the Des Moines River to the south. The town is located at an elevation of 890 feet above sea level, and has an average annual temperature of 54 degrees Fahrenheit.
Economy
Palmer’s economy is largely based on agriculture and industry. The town is home to several large farms, which produce corn, soybeans, and other crops. The town also has a number of small businesses, including a grocery store, a hardware store, and a few restaurants.
The town is also home to a number of manufacturing companies, including a plastics factory and a metal fabrication plant. The town is also home to a number of small businesses, including a gas station, a barber shop, and a few other retail stores.
Demographics
As of the 2010 census, the population of Palmer was 514 people. The town is predominantly white, with a small minority population of African Americans, Hispanics, and Asians. The median household income in the town is $41,250, and the median age is 44.
The town is home to a number of churches, including the First Baptist Church, the United Methodist Church, and the Church of the Nazarene. The town also has a public library, a post office, and a few other public services.
History
Palmer was founded in 1856, and was originally known as “Palmer’s Landing”. The town was named after the first settler, William Palmer, who arrived in the area in 1854. The town was originally a trading post, and was a popular stop for travelers and traders.
In the late 19th century, the town began to grow and develop, and by the early 20th century, it had become a thriving agricultural and industrial center. The town was home to several large farms, and was also home to a number of manufacturing companies.
In the mid-20th century, the town began to decline, as many of the factories and businesses closed down. The town has since seen a resurgence, and is now home to a number of small businesses and farms. The town is also home to a number of historic buildings, including the Palmer Opera House, which was built in 1891.
Common Questions
What is Per Capita Income in Palmer?
Per Capita income in Palmer is $38,732.
What is the Median Family Income in Palmer?
Median Family Income in Palmer is $67,917.
What is the Median Household income in Palmer?
Median Household Income in Palmer is $58,542.
What is Income or Wage Gap in Palmer?
Income or Wage Gap in Palmer is 47.2%.
Women in Palmer earn 52.8 cents for every dollar earned by a man.
What is Inequality or Gini Index in Palmer?
Inequality or Gini Index in Palmer is 0.35.
What is the Total Population of Palmer?
Total Population of Palmer is 127.
What is the Total Male Population of Palmer?
Total Male Population of Palmer is 67.
What is the Total Female Population of Palmer?
Total Female Population of Palmer is 60.
What is the Ratio of Males per 100 Females in Palmer?
There are 111.67 Males per 100 Females in Palmer.
What is the Ratio of Females per 100 Males in Palmer?
There are 89.55 Females per 100 Males in Palmer.
What is the Median Population Age in Palmer?
Median Population Age in Palmer is 52.3 Years.
What is the Average Family Size in Palmer
Average Family Size in Palmer is 2.9 People.
What is the Average Household Size in Palmer
Average Household Size in Palmer is 1.7 People.
How Large is the Labor Force in Palmer?
There are 61 People in the Labor Forcein in Palmer.
What is the Percentage of People in the Labor Force in Palmer?
56.5% of People are in the Labor Force in Palmer.
What is the Unemployment Rate in Palmer?
Unemployment Rate in Palmer is 1.6%.