What Cheer, IA Map & Demographics
What Cheer Map
What Cheer Overview
$23,933
PER CAPITA INCOME
$60,313
AVG FAMILY INCOME
$45,500
AVG HOUSEHOLD INCOME
24.3%
WAGE / INCOME GAP [ % ]
75.7¢/ $1
WAGE / INCOME GAP [ $ ]
0.45
INEQUALITY / GINI INDEX
724
TOTAL POPULATION
399
MALE POPULATION
325
FEMALE POPULATION
122.77
MALES / 100 FEMALES
81.45
FEMALES / 100 MALES
34.8
MEDIAN AGE
3.4
AVG FAMILY SIZE
2.8
AVG HOUSEHOLD SIZE
294
LABOR FORCE [ PEOPLE ]
57.1%
PERCENT IN LABOR FORCE
9.9%
UNEMPLOYMENT RATE
What Cheer Zip Codes
What Cheer Area Codes
Income in What Cheer
Income Overview in What Cheer
Per Capita Income in What Cheer is $23,933, while median incomes of families and households are $60,313 and $45,500 respectively.
| Characteristic | Number | Measure |
| Per Capita Income | 724 | $23,933 |
| Median Family Income | 175 | $60,313 |
| Mean Family Income | 175 | $59,842 |
| Median Household Income | 262 | $45,500 |
| Mean Household Income | 262 | $54,917 |
| Income Deficit | 175 | $0 |
| Wage / Income Gap (%) | 724 | 24.30% |
| Wage / Income Gap ($) | 724 | 75.70¢ per $1 |
| Gini / Inequality Index | 724 | 0.45 |
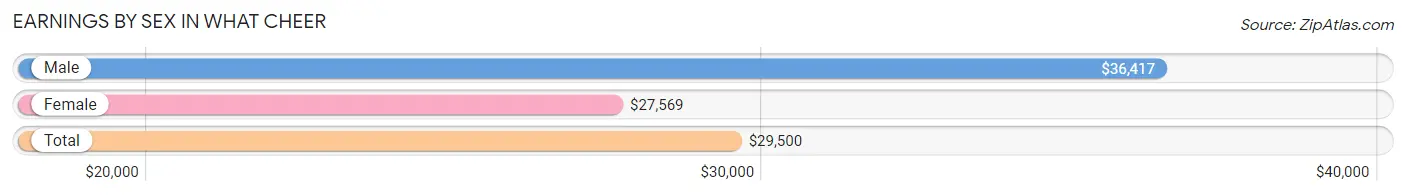
Earnings by Sex in What Cheer
Average Earnings in What Cheer are $29,500, $36,417 for men and $27,569 for women, a difference of 24.3%.
| Sex | Number | Average Earnings |
| Male | 191 (63.2%) | $36,417 |
| Female | 111 (36.7%) | $27,569 |
| Total | 302 (100.0%) | $29,500 |
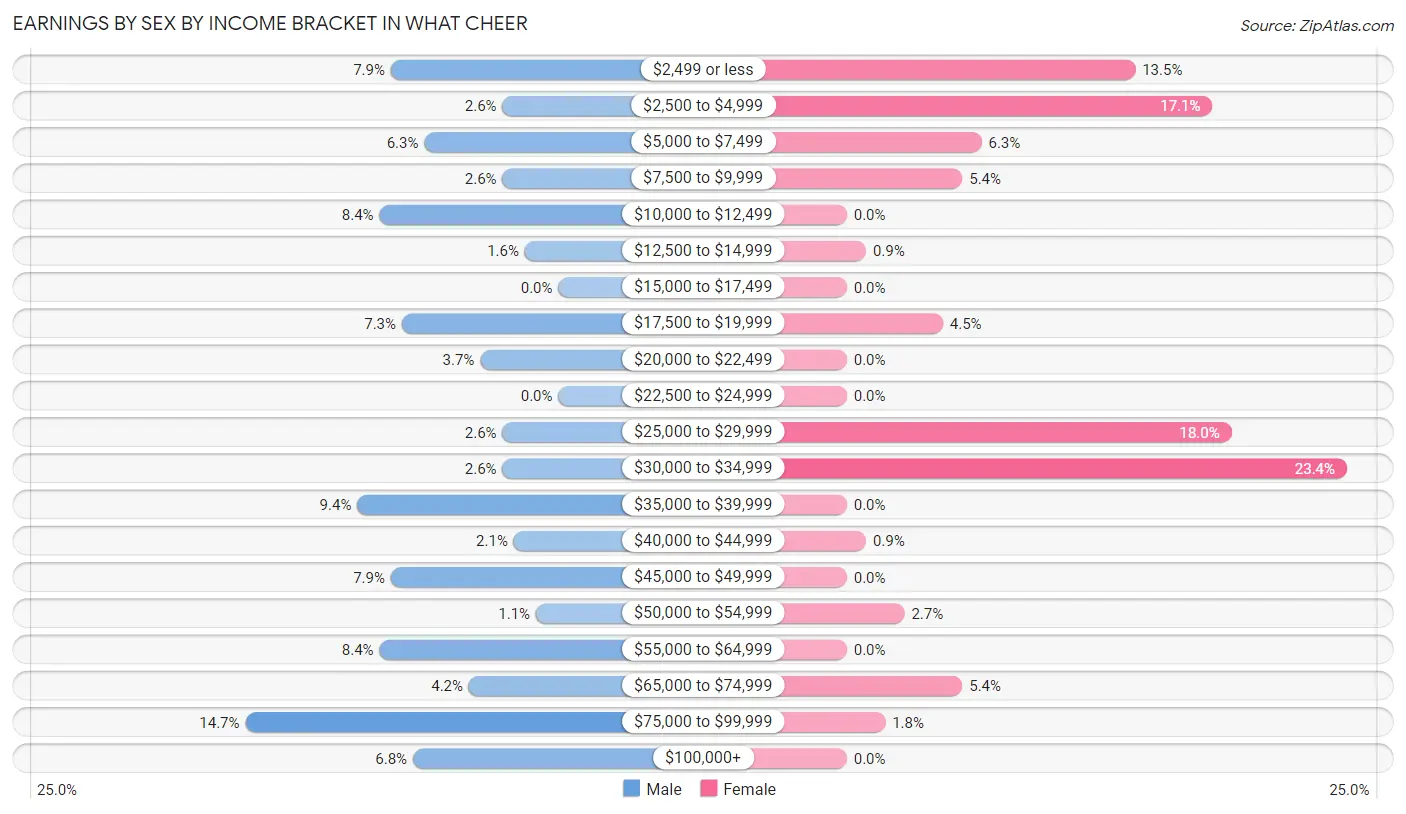
Earnings by Sex by Income Bracket in What Cheer
The most common earnings brackets in What Cheer are $75,000 to $99,999 for men (28 | 14.7%) and $30,000 to $34,999 for women (26 | 23.4%).
| Income | Male | Female |
| $2,499 or less | 15 (7.9%) | 15 (13.5%) |
| $2,500 to $4,999 | 5 (2.6%) | 19 (17.1%) |
| $5,000 to $7,499 | 12 (6.3%) | 7 (6.3%) |
| $7,500 to $9,999 | 5 (2.6%) | 6 (5.4%) |
| $10,000 to $12,499 | 16 (8.4%) | 0 (0.0%) |
| $12,500 to $14,999 | 3 (1.6%) | 1 (0.9%) |
| $15,000 to $17,499 | 0 (0.0%) | 0 (0.0%) |
| $17,500 to $19,999 | 14 (7.3%) | 5 (4.5%) |
| $20,000 to $22,499 | 7 (3.7%) | 0 (0.0%) |
| $22,500 to $24,999 | 0 (0.0%) | 0 (0.0%) |
| $25,000 to $29,999 | 5 (2.6%) | 20 (18.0%) |
| $30,000 to $34,999 | 5 (2.6%) | 26 (23.4%) |
| $35,000 to $39,999 | 18 (9.4%) | 0 (0.0%) |
| $40,000 to $44,999 | 4 (2.1%) | 1 (0.9%) |
| $45,000 to $49,999 | 15 (7.9%) | 0 (0.0%) |
| $50,000 to $54,999 | 2 (1.1%) | 3 (2.7%) |
| $55,000 to $64,999 | 16 (8.4%) | 0 (0.0%) |
| $65,000 to $74,999 | 8 (4.2%) | 6 (5.4%) |
| $75,000 to $99,999 | 28 (14.7%) | 2 (1.8%) |
| $100,000+ | 13 (6.8%) | 0 (0.0%) |
| Total | 191 (100.0%) | 111 (100.0%) |
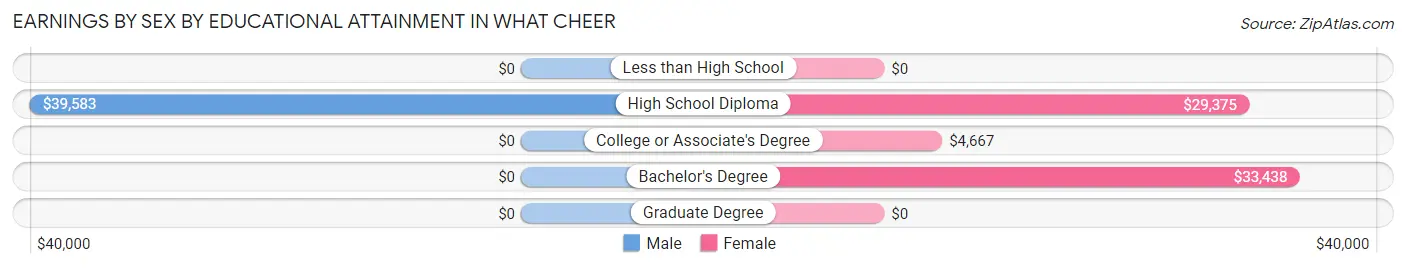
Earnings by Sex by Educational Attainment in What Cheer
Average earnings in What Cheer are $35,625 for men and $28,681 for women, a difference of 19.5%. Men with an educational attainment of high school diploma enjoy the highest average annual earnings of $39,583, while those with high school diploma education earn the least with $39,583. Women with an educational attainment of bachelor's degree earn the most with the average annual earnings of $33,438, while those with college or associate's degree education have the smallest earnings of $4,667.
| Educational Attainment | Male Income | Female Income |
| Less than High School | - | - |
| High School Diploma | $39,583 | $29,375 |
| College or Associate's Degree | - | - |
| Bachelor's Degree | - | - |
| Graduate Degree | - | - |
| Total | $35,625 | $28,681 |
Family Income in What Cheer
Family Income Brackets in What Cheer
According to the What Cheer family income data, there are 45 families falling into the $50,000 to $74,999 income range, which is the most common income bracket and makes up 25.7% of all families.
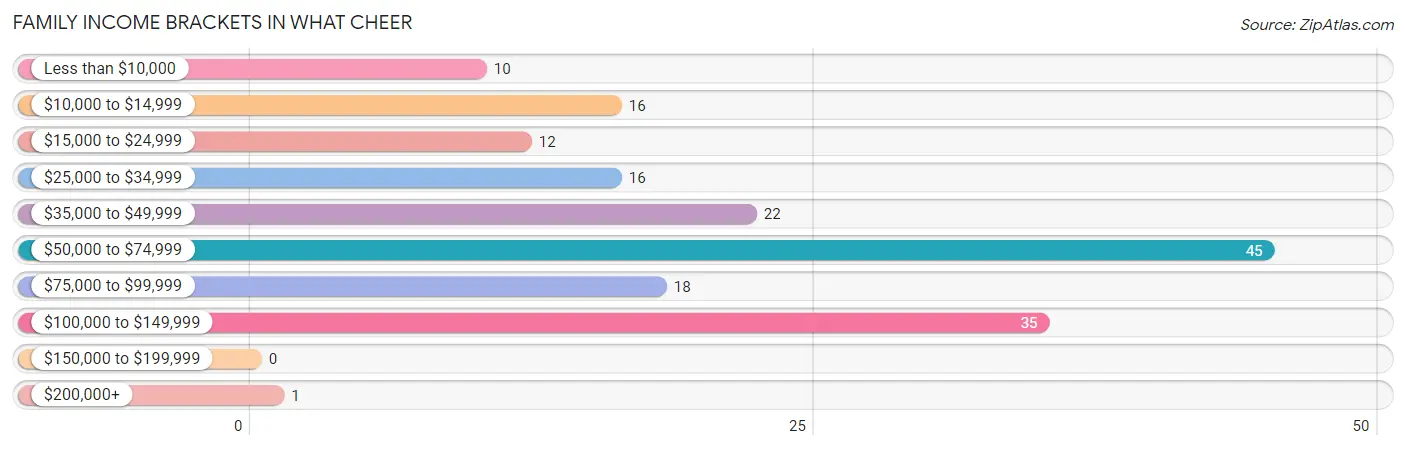
| Income Bracket | # Families | % Families |
| Less than $10,000 | 10 | 5.7% |
| $10,000 to $14,999 | 16 | 9.1% |
| $15,000 to $24,999 | 12 | 6.9% |
| $25,000 to $34,999 | 16 | 9.1% |
| $35,000 to $49,999 | 22 | 12.6% |
| $50,000 to $74,999 | 45 | 25.7% |
| $75,000 to $99,999 | 18 | 10.3% |
| $100,000 to $149,999 | 35 | 20.0% |
| $150,000 to $199,999 | 0 | 0.0% |
| $200,000+ | 1 | 0.6% |
Family Income by Famaliy Size in What Cheer
4-person families (18 | 10.3%) account for the highest median family income in What Cheer with $100,938 per family, while 3-person families (33 | 18.9%) have the highest median income of $31,319 per family member.
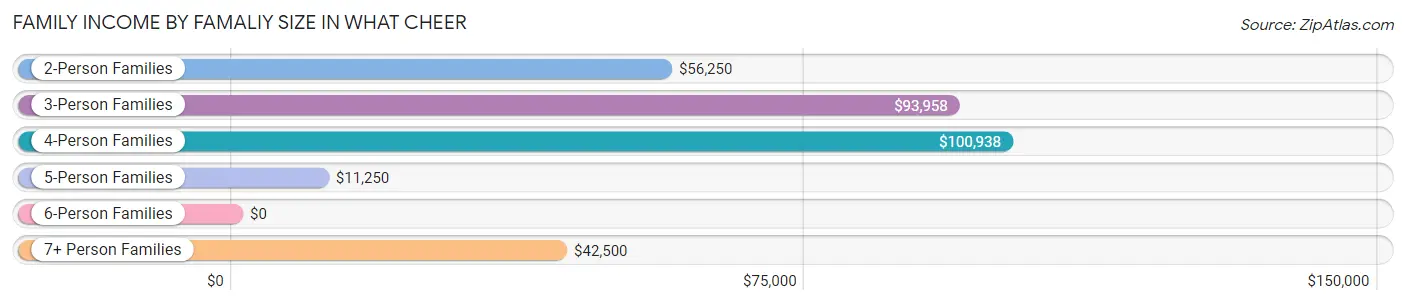
| Income Bracket | # Families | Median Income |
| 2-Person Families | 89 (50.9%) | $56,250 |
| 3-Person Families | 33 (18.9%) | $93,958 |
| 4-Person Families | 18 (10.3%) | $100,938 |
| 5-Person Families | 17 (9.7%) | $11,250 |
| 6-Person Families | 8 (4.6%) | $0 |
| 7+ Person Families | 10 (5.7%) | $42,500 |
| Total | 175 (100.0%) | $60,313 |
Family Income by Number of Earners in What Cheer
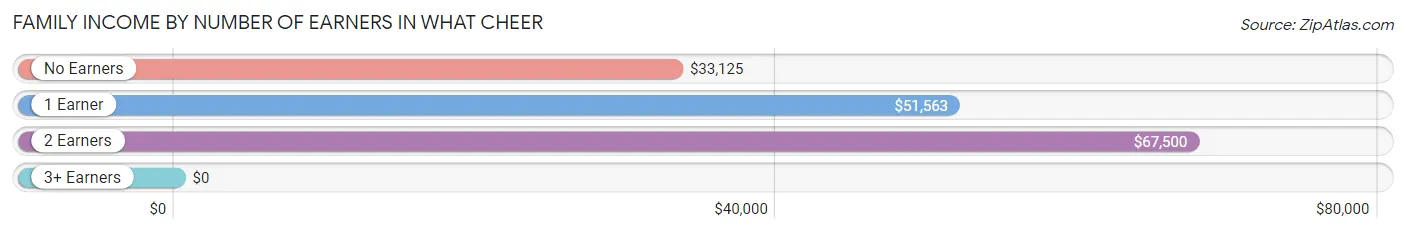
| Number of Earners | # Families | Median Income |
| No Earners | 27 (15.4%) | $33,125 |
| 1 Earner | 77 (44.0%) | $51,563 |
| 2 Earners | 68 (38.9%) | $67,500 |
| 3+ Earners | 3 (1.7%) | $0 |
| Total | 175 (100.0%) | $60,313 |
Household Income in What Cheer
Household Income Brackets in What Cheer
With 51 households falling in the category, the $50,000 to $74,999 income range is the most frequent in What Cheer, accounting for 19.5% of all households.
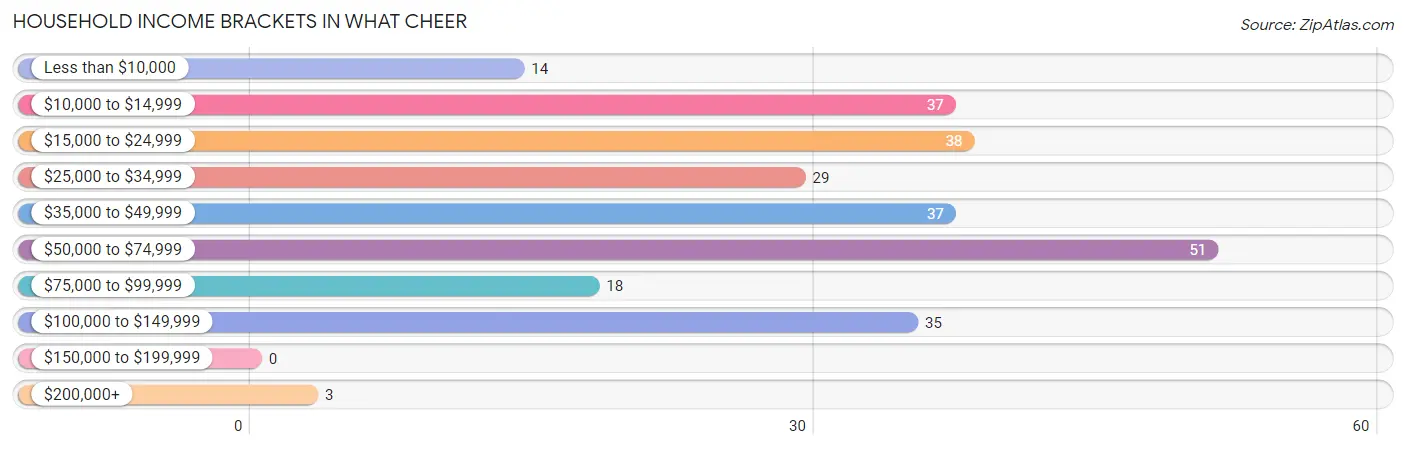
| Income Bracket | # Households | % Households |
| Less than $10,000 | 14 | 5.3% |
| $10,000 to $14,999 | 37 | 14.1% |
| $15,000 to $24,999 | 38 | 14.5% |
| $25,000 to $34,999 | 29 | 11.1% |
| $35,000 to $49,999 | 37 | 14.1% |
| $50,000 to $74,999 | 51 | 19.5% |
| $75,000 to $99,999 | 18 | 6.9% |
| $100,000 to $149,999 | 35 | 13.4% |
| $150,000 to $199,999 | 0 | 0.0% |
| $200,000+ | 3 | 1.1% |
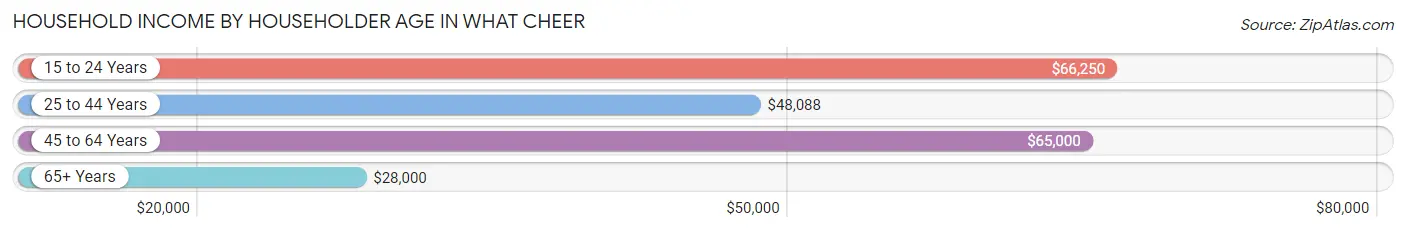
Household Income by Householder Age in What Cheer
The median household income in What Cheer is $45,500, with the highest median household income of $66,250 found in the 15 to 24 years age bracket for the primary householder. A total of 16 households (6.1%) fall into this category. Meanwhile, the 65+ years age bracket for the primary householder has the lowest median household income of $28,000, with 88 households (33.6%) in this group.
| Income Bracket | # Households | Median Income |
| 15 to 24 Years | 16 (6.1%) | $66,250 |
| 25 to 44 Years | 80 (30.5%) | $48,088 |
| 45 to 64 Years | 78 (29.8%) | $65,000 |
| 65+ Years | 88 (33.6%) | $28,000 |
| Total | 262 (100.0%) | $45,500 |
Poverty in What Cheer
Income Below Poverty by Sex and Age in What Cheer
With 25.1% poverty level for males and 28.0% for females among the residents of What Cheer, 5 year old males and 15 year old females are the most vulnerable to poverty, with 5 males (100.0%) and 8 females (100.0%) in their respective age groups living below the poverty level.
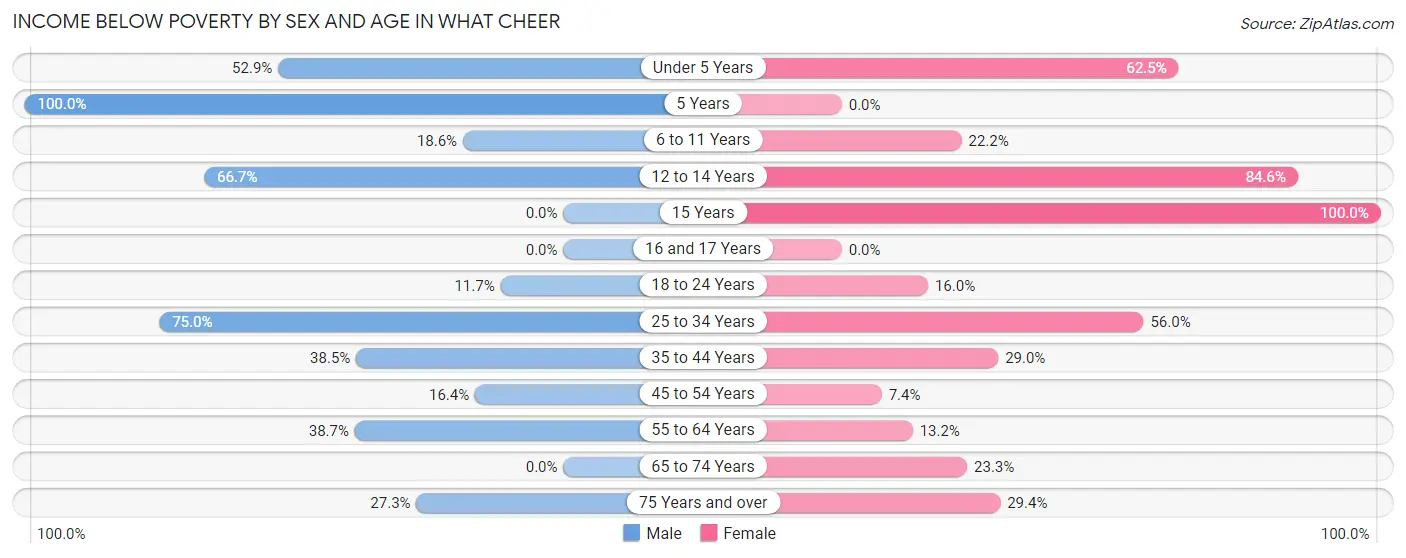
| Age Bracket | Male | Female |
| Under 5 Years | 9 (52.9%) | 5 (62.5%) |
| 5 Years | 5 (100.0%) | 0 (0.0%) |
| 6 to 11 Years | 11 (18.6%) | 18 (22.2%) |
| 12 to 14 Years | 8 (66.7%) | 11 (84.6%) |
| 15 Years | 0 (0.0%) | 8 (100.0%) |
| 16 and 17 Years | 0 (0.0%) | 0 (0.0%) |
| 18 to 24 Years | 7 (11.7%) | 4 (16.0%) |
| 25 to 34 Years | 9 (75.0%) | 14 (56.0%) |
| 35 to 44 Years | 20 (38.5%) | 9 (29.0%) |
| 45 to 54 Years | 10 (16.4%) | 2 (7.4%) |
| 55 to 64 Years | 12 (38.7%) | 5 (13.2%) |
| 65 to 74 Years | 0 (0.0%) | 10 (23.3%) |
| 75 Years and over | 9 (27.3%) | 5 (29.4%) |
| Total | 100 (25.1%) | 91 (28.0%) |
Income Above Poverty by Sex and Age in What Cheer
According to the poverty statistics in What Cheer, males aged 15 years and females aged 16 and 17 years are the age groups that are most secure financially, with 100.0% of males and 100.0% of females in these age groups living above the poverty line.
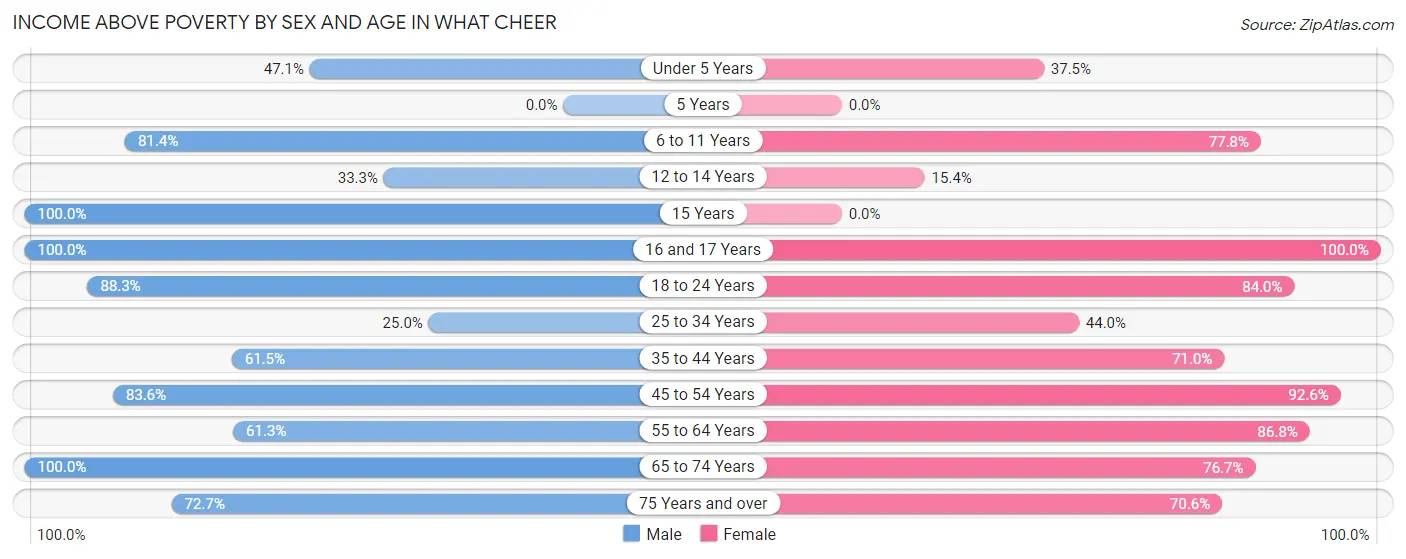
| Age Bracket | Male | Female |
| Under 5 Years | 8 (47.1%) | 3 (37.5%) |
| 5 Years | 0 (0.0%) | 0 (0.0%) |
| 6 to 11 Years | 48 (81.4%) | 63 (77.8%) |
| 12 to 14 Years | 4 (33.3%) | 2 (15.4%) |
| 15 Years | 6 (100.0%) | 0 (0.0%) |
| 16 and 17 Years | 23 (100.0%) | 9 (100.0%) |
| 18 to 24 Years | 53 (88.3%) | 21 (84.0%) |
| 25 to 34 Years | 3 (25.0%) | 11 (44.0%) |
| 35 to 44 Years | 32 (61.5%) | 22 (71.0%) |
| 45 to 54 Years | 51 (83.6%) | 25 (92.6%) |
| 55 to 64 Years | 19 (61.3%) | 33 (86.8%) |
| 65 to 74 Years | 28 (100.0%) | 33 (76.7%) |
| 75 Years and over | 24 (72.7%) | 12 (70.6%) |
| Total | 299 (74.9%) | 234 (72.0%) |
Income Below Poverty Among Married-Couple Families in What Cheer
The poverty statistics for married-couple families in What Cheer show that 22.1% or 27 of the total 122 families live below the poverty line. Families with 5 or more children have the highest poverty rate of 100.0%, comprising of 5 families. On the other hand, families with 1 or 2 children have the lowest poverty rate of 0.0%, which includes 0 families.
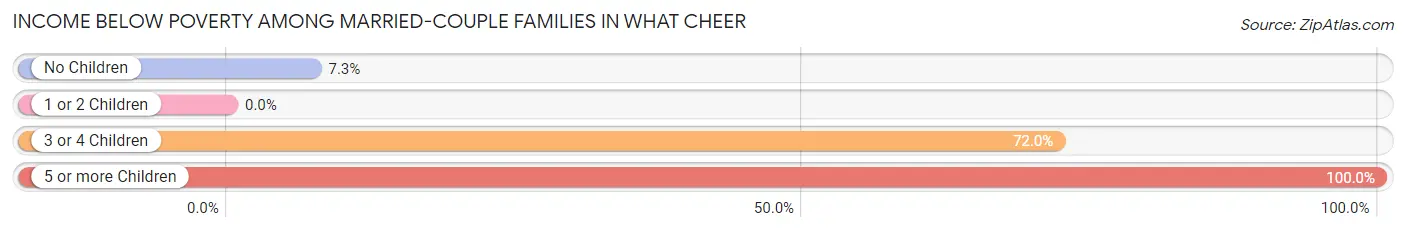
| Children | Above Poverty | Below Poverty |
| No Children | 51 (92.7%) | 4 (7.3%) |
| 1 or 2 Children | 37 (100.0%) | 0 (0.0%) |
| 3 or 4 Children | 7 (28.0%) | 18 (72.0%) |
| 5 or more Children | 0 (0.0%) | 5 (100.0%) |
| Total | 95 (77.9%) | 27 (22.1%) |
Income Below Poverty Among Single-Parent Households in What Cheer
According to the poverty data in What Cheer, 27.3% or 9 single-father households and 20.0% or 4 single-mother households are living below the poverty line. Among single-father households, those with 1 or 2 children have the highest poverty rate, with 9 households (42.9%) experiencing poverty. Likewise, among single-mother households, those with 1 or 2 children have the highest poverty rate, with 4 households (100.0%) falling below the poverty line.
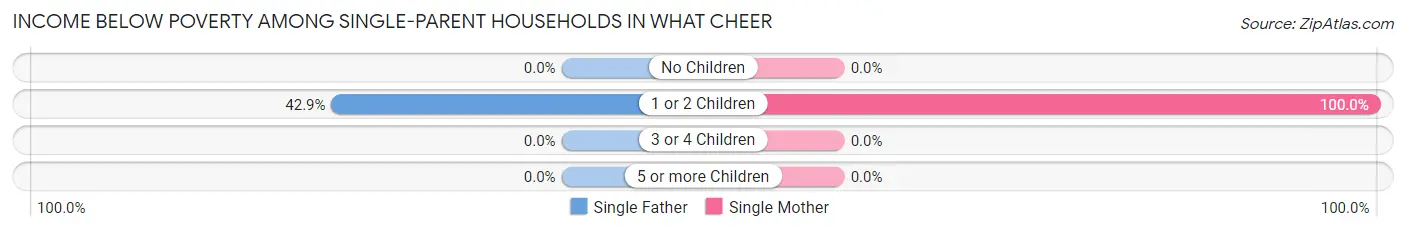
| Children | Single Father | Single Mother |
| No Children | 0 (0.0%) | 0 (0.0%) |
| 1 or 2 Children | 9 (42.9%) | 4 (100.0%) |
| 3 or 4 Children | 0 (0.0%) | 0 (0.0%) |
| 5 or more Children | 0 (0.0%) | 0 (0.0%) |
| Total | 9 (27.3%) | 4 (20.0%) |
Income Below Poverty Among Married-Couple vs Single-Parent Households in What Cheer
The poverty data for What Cheer shows that 27 of the married-couple family households (22.1%) and 13 of the single-parent households (24.5%) are living below the poverty level. Within the married-couple family households, those with 5 or more children have the highest poverty rate, with 5 households (100.0%) falling below the poverty line. Among the single-parent households, those with 1 or 2 children have the highest poverty rate, with 13 household (52.0%) living below poverty.
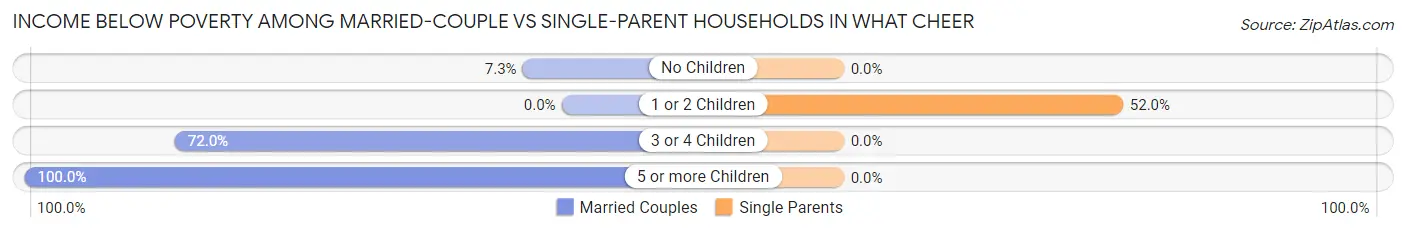
| Children | Married-Couple Families | Single-Parent Households |
| No Children | 4 (7.3%) | 0 (0.0%) |
| 1 or 2 Children | 0 (0.0%) | 13 (52.0%) |
| 3 or 4 Children | 18 (72.0%) | 0 (0.0%) |
| 5 or more Children | 5 (100.0%) | 0 (0.0%) |
| Total | 27 (22.1%) | 13 (24.5%) |
Race in What Cheer
The most populous races in What Cheer are White / Caucasian (676 | 93.4%), Hispanic or Latino (37 | 5.1%), and Two or more Races (22 | 3.0%).
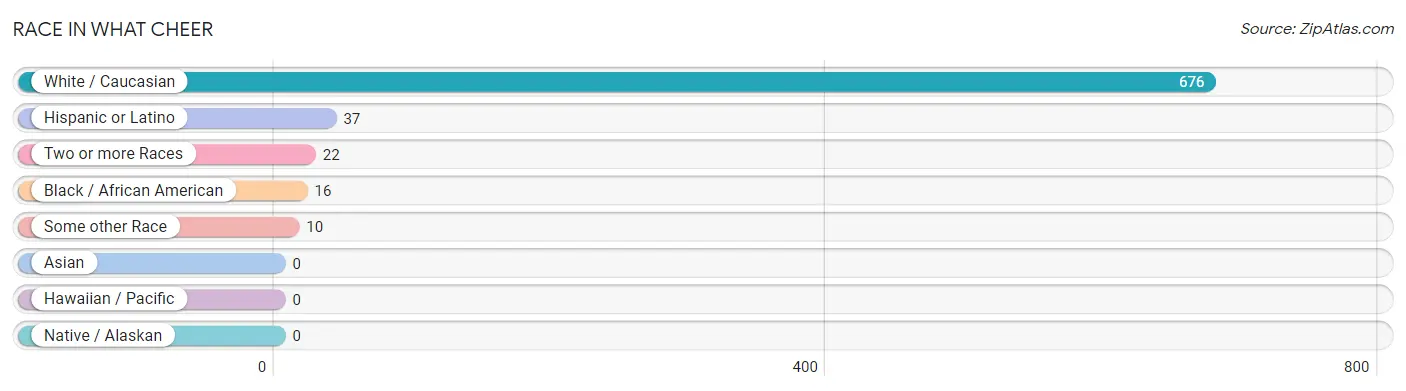
| Race | # Population | % Population |
| Asian | 0 | 0.0% |
| Black / African American | 16 | 2.2% |
| Hawaiian / Pacific | 0 | 0.0% |
| Hispanic or Latino | 37 | 5.1% |
| Native / Alaskan | 0 | 0.0% |
| White / Caucasian | 676 | 93.4% |
| Two or more Races | 22 | 3.0% |
| Some other Race | 10 | 1.4% |
| Total | 724 | 100.0% |
Ancestry in What Cheer
The most populous ancestries reported in What Cheer are Irish (177 | 24.4%), German (138 | 19.1%), English (77 | 10.6%), American (32 | 4.4%), and Dutch (31 | 4.3%), together accounting for 62.8% of all What Cheer residents.
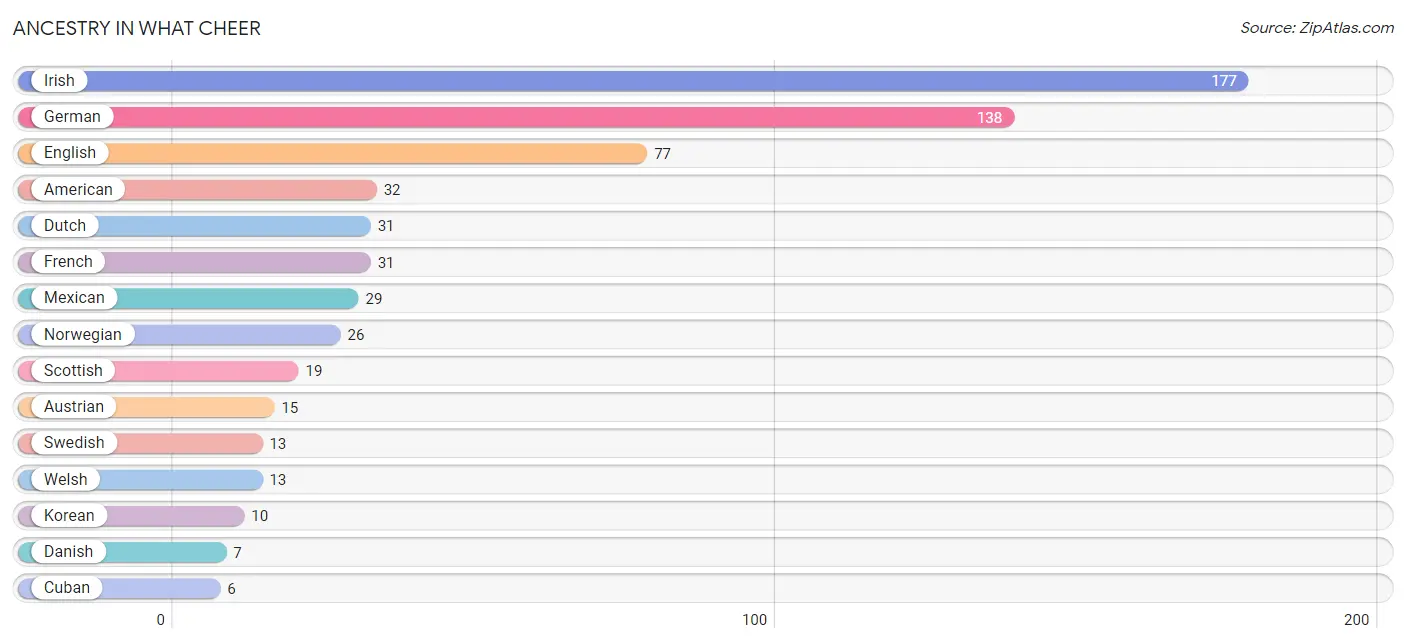
| Ancestry | # Population | % Population |
| American | 32 | 4.4% |
| Austrian | 15 | 2.1% |
| British | 4 | 0.5% |
| Cherokee | 1 | 0.1% |
| Cuban | 6 | 0.8% |
| Czech | 3 | 0.4% |
| Danish | 7 | 1.0% |
| Dutch | 31 | 4.3% |
| English | 77 | 10.6% |
| French | 31 | 4.3% |
| French Canadian | 2 | 0.3% |
| German | 138 | 19.1% |
| Indian (Asian) | 5 | 0.7% |
| Irish | 177 | 24.4% |
| Korean | 10 | 1.4% |
| Mexican | 29 | 4.0% |
| Native Hawaiian | 5 | 0.7% |
| Norwegian | 26 | 3.6% |
| Pennsylvania German | 2 | 0.3% |
| Puerto Rican | 2 | 0.3% |
| Scandinavian | 2 | 0.3% |
| Scotch-Irish | 3 | 0.4% |
| Scottish | 19 | 2.6% |
| Sioux | 1 | 0.1% |
| Sri Lankan | 5 | 0.7% |
| Swedish | 13 | 1.8% |
| Thai | 5 | 0.7% |
| Welsh | 13 | 1.8% | View All 28 Rows |
Immigrants in What Cheer
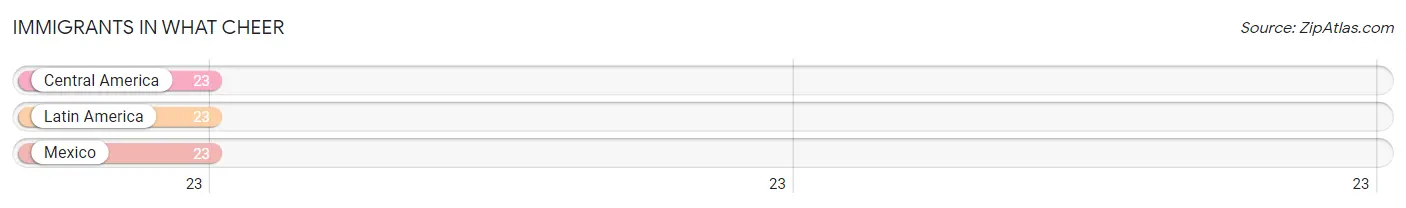
The most numerous immigrant groups reported in What Cheer came from Central America (23 | 3.2%), Latin America (23 | 3.2%), and Mexico (23 | 3.2%), together accounting for 9.5% of all What Cheer residents.
| Immigration Origin | # Population | % Population |
| Central America | 23 | 3.2% |
| Latin America | 23 | 3.2% |
| Mexico | 23 | 3.2% | View All 3 Rows |
Sex and Age in What Cheer
Sex and Age in What Cheer
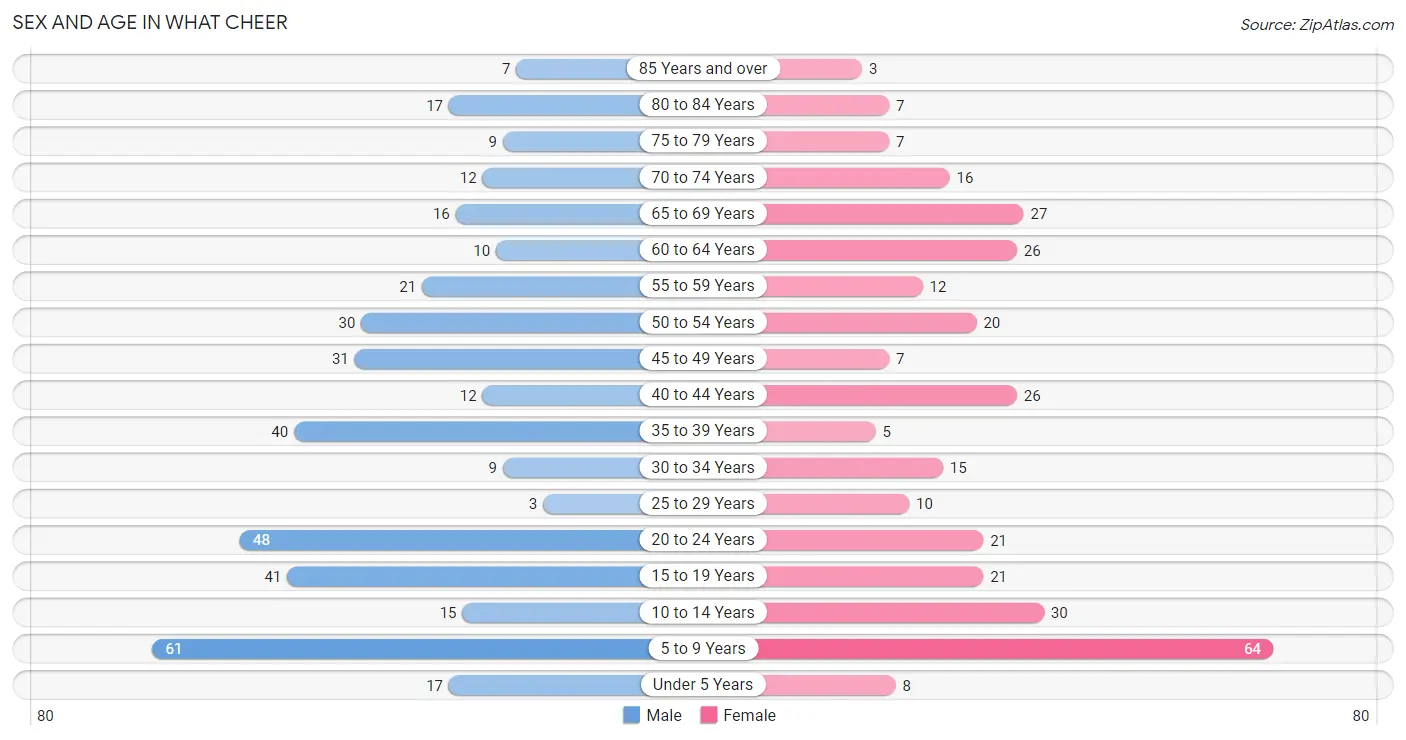
The most populous age groups in What Cheer are 5 to 9 Years (61 | 15.3%) for men and 5 to 9 Years (64 | 19.7%) for women.
| Age Bracket | Male | Female |
| Under 5 Years | 17 (4.3%) | 8 (2.5%) |
| 5 to 9 Years | 61 (15.3%) | 64 (19.7%) |
| 10 to 14 Years | 15 (3.8%) | 30 (9.2%) |
| 15 to 19 Years | 41 (10.3%) | 21 (6.5%) |
| 20 to 24 Years | 48 (12.0%) | 21 (6.5%) |
| 25 to 29 Years | 3 (0.7%) | 10 (3.1%) |
| 30 to 34 Years | 9 (2.3%) | 15 (4.6%) |
| 35 to 39 Years | 40 (10.0%) | 5 (1.5%) |
| 40 to 44 Years | 12 (3.0%) | 26 (8.0%) |
| 45 to 49 Years | 31 (7.8%) | 7 (2.1%) |
| 50 to 54 Years | 30 (7.5%) | 20 (6.1%) |
| 55 to 59 Years | 21 (5.3%) | 12 (3.7%) |
| 60 to 64 Years | 10 (2.5%) | 26 (8.0%) |
| 65 to 69 Years | 16 (4.0%) | 27 (8.3%) |
| 70 to 74 Years | 12 (3.0%) | 16 (4.9%) |
| 75 to 79 Years | 9 (2.3%) | 7 (2.1%) |
| 80 to 84 Years | 17 (4.3%) | 7 (2.1%) |
| 85 Years and over | 7 (1.8%) | 3 (0.9%) |
| Total | 399 (100.0%) | 325 (100.0%) |
Families and Households in What Cheer
Median Family Size in What Cheer
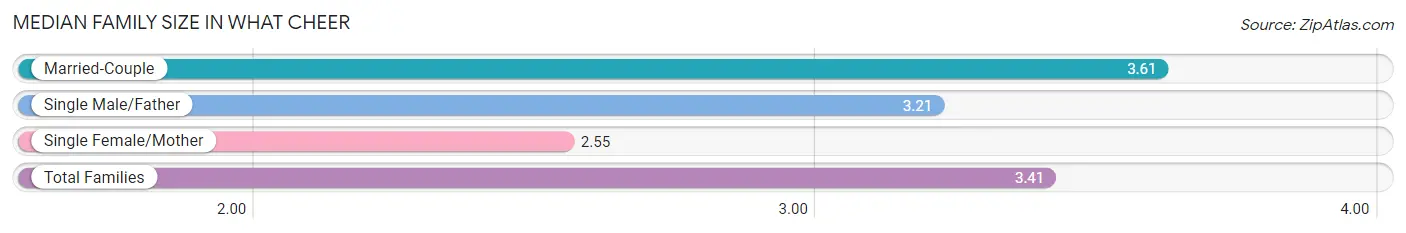
The median family size in What Cheer is 3.41 persons per family, with married-couple families (122 | 69.7%) accounting for the largest median family size of 3.61 persons per family. On the other hand, single female/mother families (20 | 11.4%) represent the smallest median family size with 2.55 persons per family.
| Family Type | # Families | Family Size |
| Married-Couple | 122 (69.7%) | 3.61 |
| Single Male/Father | 33 (18.9%) | 3.21 |
| Single Female/Mother | 20 (11.4%) | 2.55 |
| Total Families | 175 (100.0%) | 3.41 |
Median Household Size in What Cheer
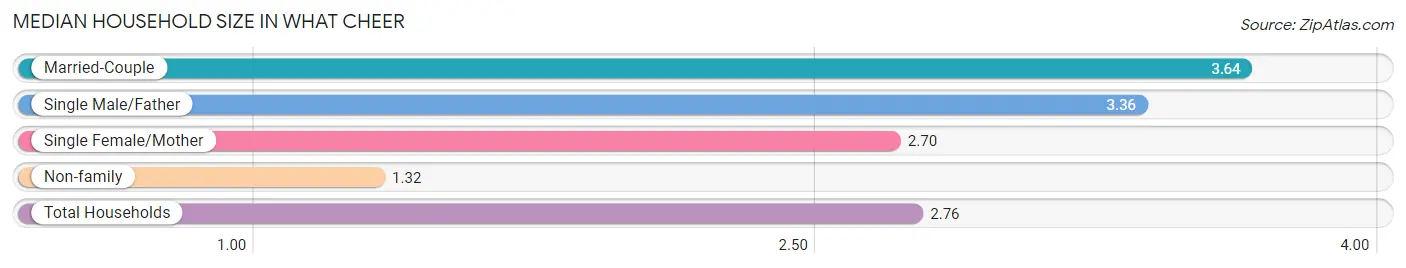
The median household size in What Cheer is 2.76 persons per household, with married-couple households (122 | 46.6%) accounting for the largest median household size of 3.64 persons per household. non-family households (87 | 33.2%) represent the smallest median household size with 1.32 persons per household.
| Household Type | # Households | Household Size |
| Married-Couple | 122 (46.6%) | 3.64 |
| Single Male/Father | 33 (12.6%) | 3.36 |
| Single Female/Mother | 20 (7.6%) | 2.70 |
| Non-family | 87 (33.2%) | 1.32 |
| Total Households | 262 (100.0%) | 2.76 |
Household Size by Marriage Status in What Cheer
Out of a total of 262 households in What Cheer, 175 (66.8%) are family households, while 87 (33.2%) are nonfamily households. The most numerous type of family households are 2-person households, comprising 82, and the most common type of nonfamily households are 1-person households, comprising 74.
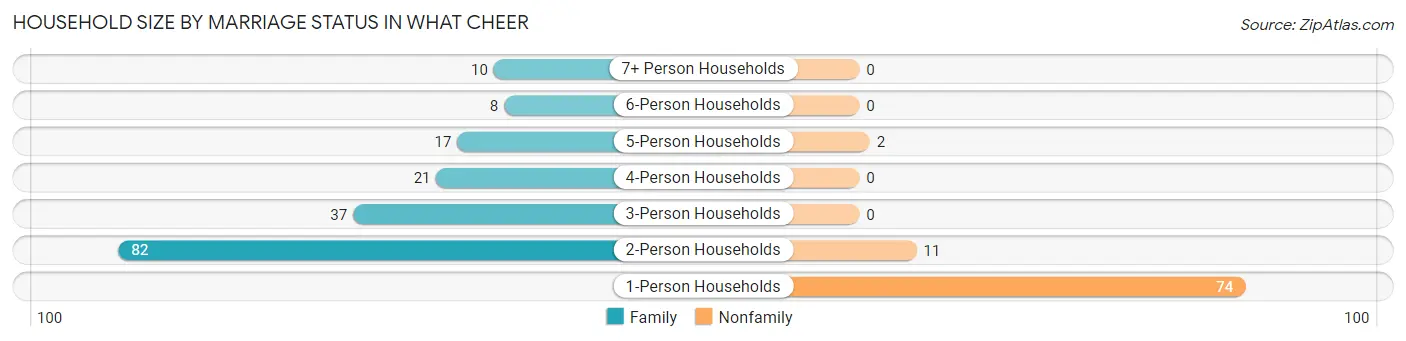
| Household Size | Family Households | Nonfamily Households |
| 1-Person Households | - | 74 (28.2%) |
| 2-Person Households | 82 (31.3%) | 11 (4.2%) |
| 3-Person Households | 37 (14.1%) | 0 (0.0%) |
| 4-Person Households | 21 (8.0%) | 0 (0.0%) |
| 5-Person Households | 17 (6.5%) | 2 (0.8%) |
| 6-Person Households | 8 (3.0%) | 0 (0.0%) |
| 7+ Person Households | 10 (3.8%) | 0 (0.0%) |
| Total | 175 (66.8%) | 87 (33.2%) |
Female Fertility in What Cheer
Fertility by Age in What Cheer
Average fertility rate in What Cheer is 150.0 births per 1,000 women. Women in the age bracket of 20 to 34 years have the highest fertility rate with 370.0 births per 1,000 women. Women in the age bracket of 20 to 34 years acount for 100.0% of all women with births.
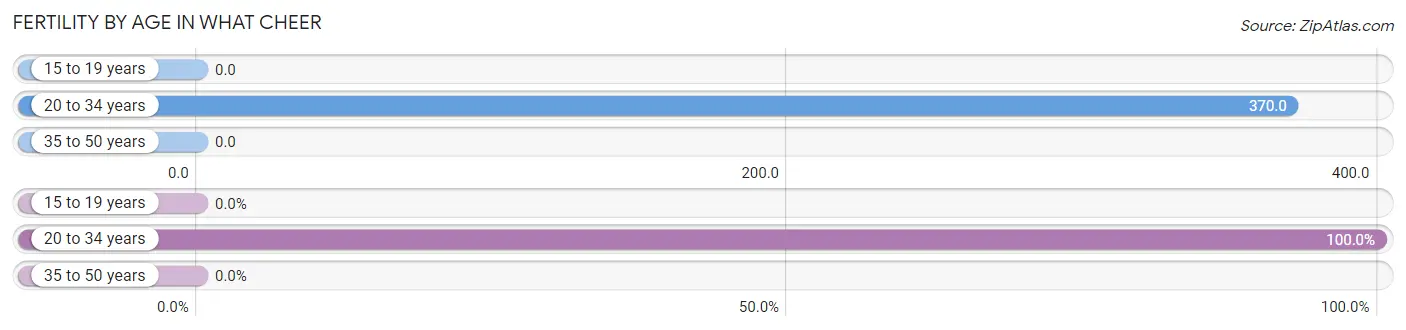
| Age Bracket | Women with Births | Births / 1,000 Women |
| 15 to 19 years | 0 (0.0%) | 0.0 |
| 20 to 34 years | 17 (100.0%) | 370.0 |
| 35 to 50 years | 0 (0.0%) | 0.0 |
| Total | 17 (100.0%) | 150.0 |
Fertility by Age by Marriage Status in What Cheer
76.5% of women with births (17) in What Cheer are married. The highest percentage of unmarried women with births falls into 20 to 34 years age bracket with 23.5% of them unmarried at the time of birth, while the lowest percentage of unmarried women with births belong to 20 to 34 years age bracket with 23.5% of them unmarried.
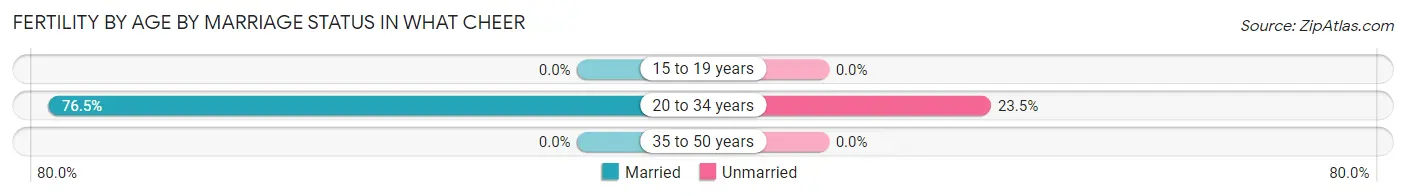
| Age Bracket | Married | Unmarried |
| 15 to 19 years | 0 (0.0%) | 0 (0.0%) |
| 20 to 34 years | 13 (76.5%) | 4 (23.5%) |
| 35 to 50 years | 0 (0.0%) | 0 (0.0%) |
| Total | 13 (76.5%) | 4 (23.5%) |
Fertility by Education in What Cheer
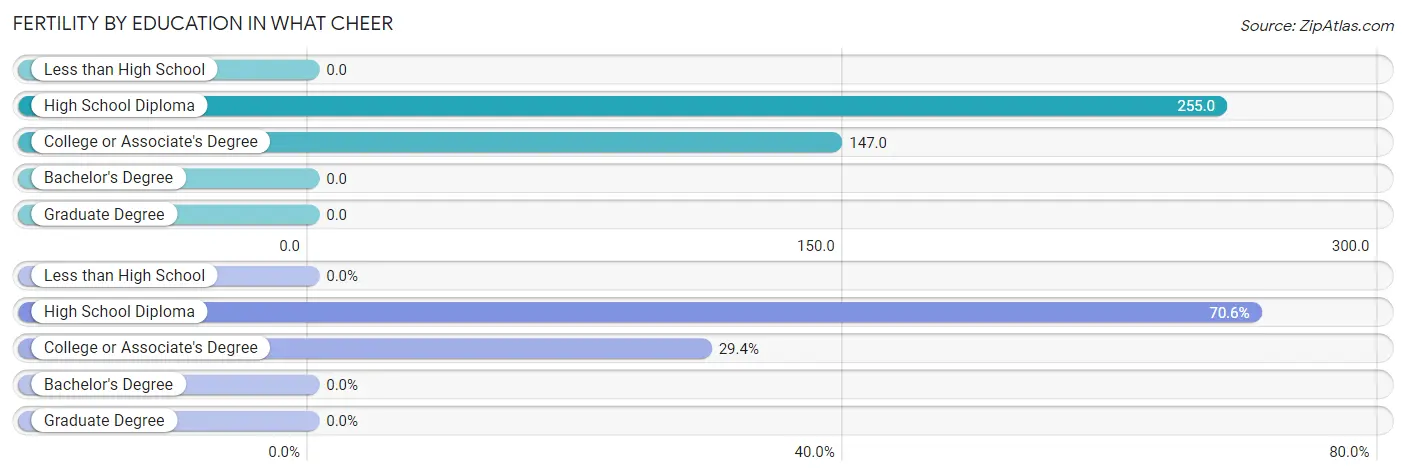
| Educational Attainment | Women with Births | Births / 1,000 Women |
| Less than High School | 0 (0.0%) | 0.0 |
| High School Diploma | 12 (70.6%) | 255.0 |
| College or Associate's Degree | 5 (29.4%) | 147.0 |
| Bachelor's Degree | 0 (0.0%) | 0.0 |
| Graduate Degree | 0 (0.0%) | 0.0 |
| Total | 17 (100.0%) | 150.0 |
Fertility by Education by Marriage Status in What Cheer
23.5% of women with births in What Cheer are unmarried. Women with the educational attainment of college or associate's degree are most likely to be married with 100.0% of them married at childbirth, while women with the educational attainment of high school diploma are least likely to be married with 33.3% of them unmarried at childbirth.
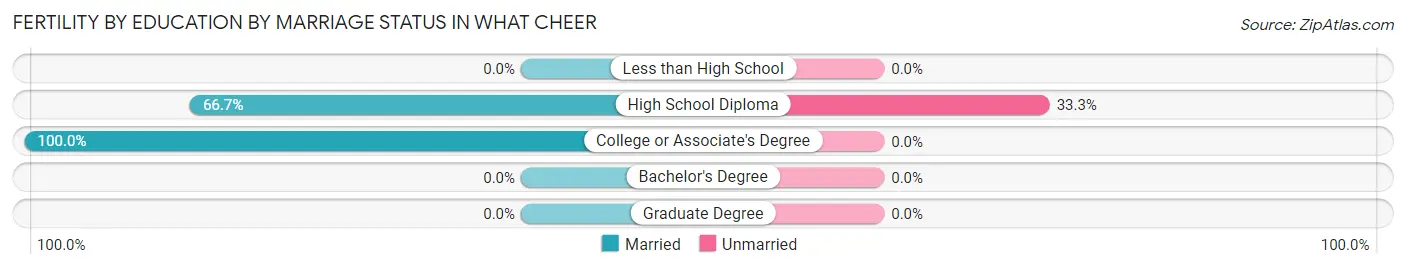
| Educational Attainment | Married | Unmarried |
| Less than High School | 0 (0.0%) | 0 (0.0%) |
| High School Diploma | 8 (66.7%) | 4 (33.3%) |
| College or Associate's Degree | 5 (100.0%) | 0 (0.0%) |
| Bachelor's Degree | 0 (0.0%) | 0 (0.0%) |
| Graduate Degree | 0 (0.0%) | 0 (0.0%) |
| Total | 13 (76.5%) | 4 (23.5%) |
Employment Characteristics in What Cheer
Employment by Class of Employer in What Cheer
Among the 261 employed individuals in What Cheer, private company employees (166 | 63.6%), not-for-profit organizations (28 | 10.7%), and self-employed (incorporated) (24 | 9.2%) make up the most common classes of employment.
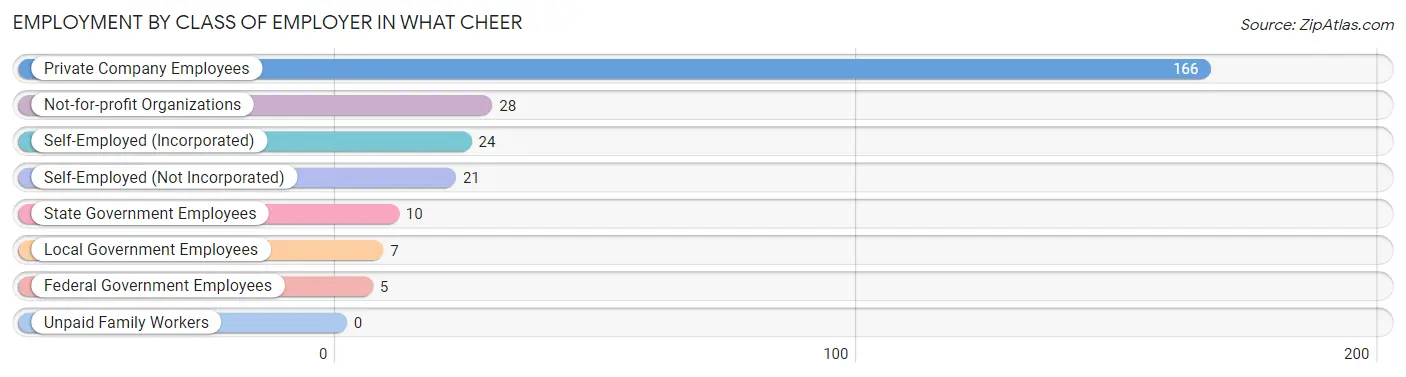
| Employer Class | # Employees | % Employees |
| Private Company Employees | 166 | 63.6% |
| Self-Employed (Incorporated) | 24 | 9.2% |
| Self-Employed (Not Incorporated) | 21 | 8.1% |
| Not-for-profit Organizations | 28 | 10.7% |
| Local Government Employees | 7 | 2.7% |
| State Government Employees | 10 | 3.8% |
| Federal Government Employees | 5 | 1.9% |
| Unpaid Family Workers | 0 | 0.0% |
| Total | 261 | 100.0% |
Employment Status by Age in What Cheer
According to the labor force statistics for What Cheer, out of the total population over 16 years of age (515), 57.1% or 294 individuals are in the labor force, with 9.9% or 29 of them unemployed. The age group with the highest labor force participation rate is 25 to 29 years, with 100.0% or 13 individuals in the labor force. Within the labor force, the 25 to 29 years age range has the highest percentage of unemployed individuals, with 38.5% or 5 of them being unemployed.
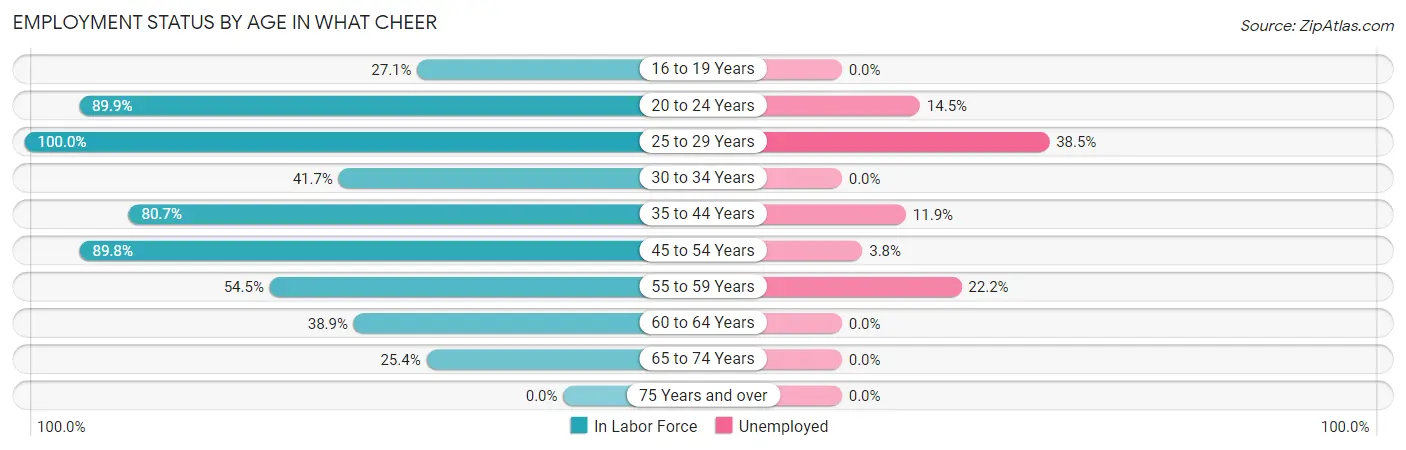
| Age Bracket | In Labor Force | Unemployed |
| 16 to 19 Years | 13 (27.1%) | 0 (0.0%) |
| 20 to 24 Years | 62 (89.9%) | 9 (14.5%) |
| 25 to 29 Years | 13 (100.0%) | 5 (38.5%) |
| 30 to 34 Years | 10 (41.7%) | 0 (0.0%) |
| 35 to 44 Years | 67 (80.7%) | 8 (11.9%) |
| 45 to 54 Years | 79 (89.8%) | 3 (3.8%) |
| 55 to 59 Years | 18 (54.5%) | 4 (22.2%) |
| 60 to 64 Years | 14 (38.9%) | 0 (0.0%) |
| 65 to 74 Years | 18 (25.4%) | 0 (0.0%) |
| 75 Years and over | 0 (0.0%) | 0 (0.0%) |
| Total | 294 (57.1%) | 29 (9.9%) |
Employment Status by Educational Attainment in What Cheer
According to labor force statistics for What Cheer, 72.6% of individuals (201) out of the total population between 25 and 64 years of age (277) are in the labor force, with 10.0% or 20 of them being unemployed. The group with the highest labor force participation rate are those with the educational attainment of college / associate degree, with 84.0% or 68 individuals in the labor force. Within the labor force, individuals with bachelor's degree or higher education have the highest percentage of unemployment, with 25.0% or 4 of them being unemployed.
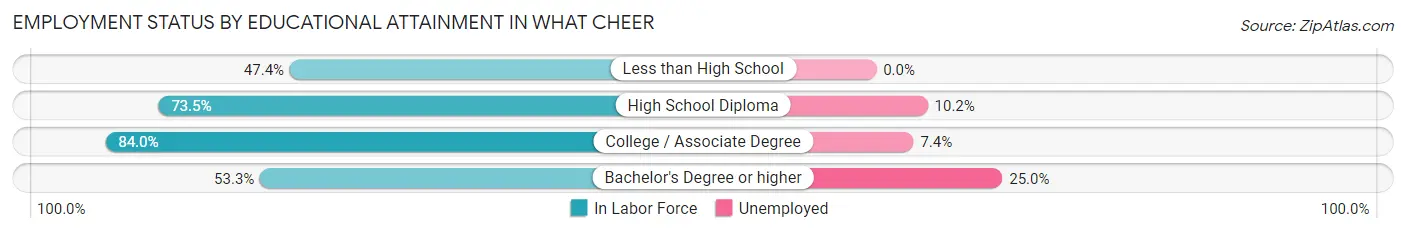
| Educational Attainment | In Labor Force | Unemployed |
| Less than High School | 9 (47.4%) | 0 (0.0%) |
| High School Diploma | 108 (73.5%) | 15 (10.2%) |
| College / Associate Degree | 68 (84.0%) | 6 (7.4%) |
| Bachelor's Degree or higher | 16 (53.3%) | 8 (25.0%) |
| Total | 201 (72.6%) | 28 (10.0%) |
Employment Occupations by Sex in What Cheer
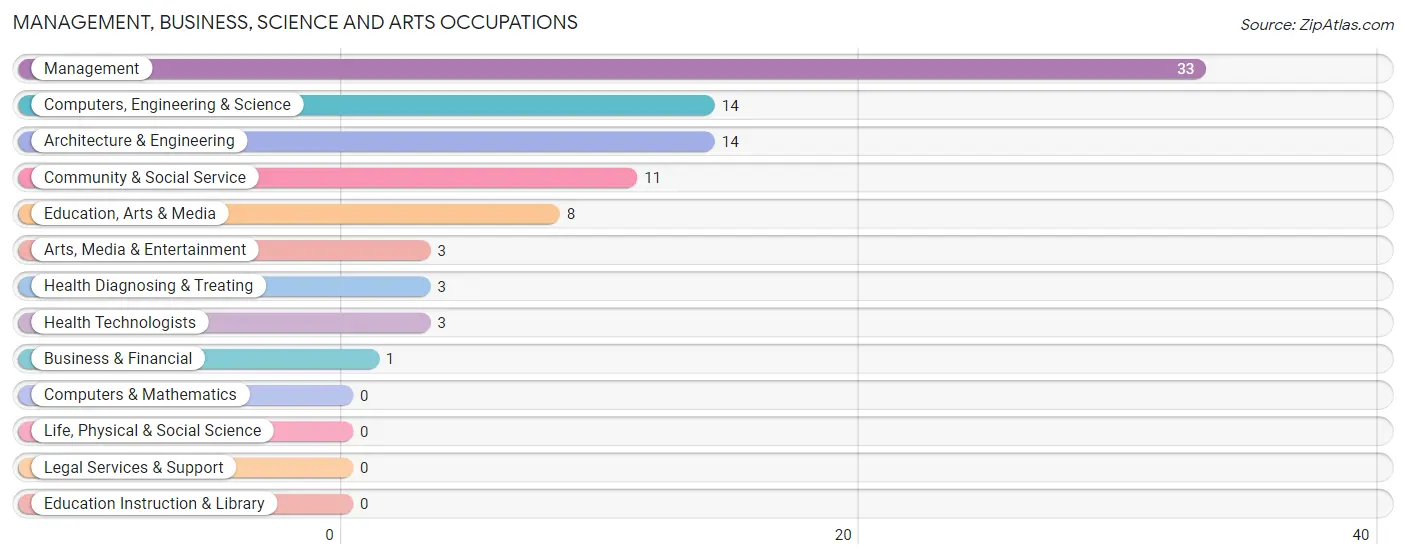
Management, Business, Science and Arts Occupations
The most common Management, Business, Science and Arts occupations in What Cheer are Management (33 | 12.4%), Computers, Engineering & Science (14 | 5.3%), Architecture & Engineering (14 | 5.3%), Community & Social Service (11 | 4.2%), and Education, Arts & Media (8 | 3.0%).
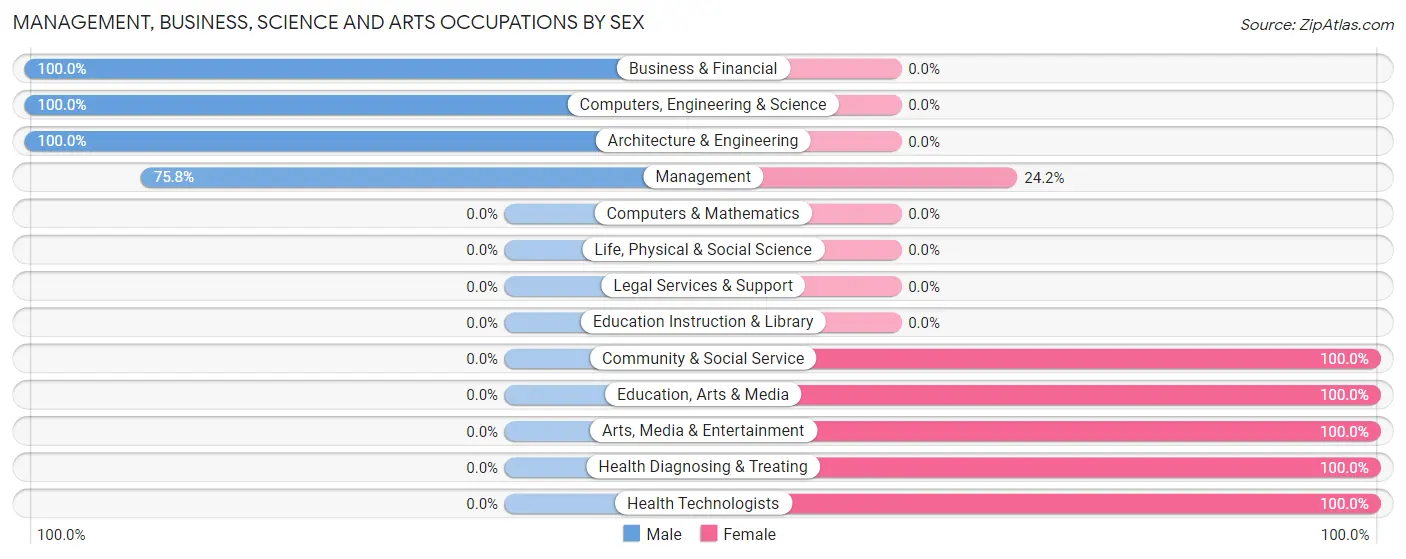
Management, Business, Science and Arts Occupations by Sex
Within the Management, Business, Science and Arts occupations in What Cheer, the most male-oriented occupations are Business & Financial (100.0%), Computers, Engineering & Science (100.0%), and Architecture & Engineering (100.0%), while the most female-oriented occupations are Community & Social Service (100.0%), Education, Arts & Media (100.0%), and Arts, Media & Entertainment (100.0%).
| Occupation | Male | Female |
| Management | 25 (75.8%) | 8 (24.2%) |
| Business & Financial | 1 (100.0%) | 0 (0.0%) |
| Computers, Engineering & Science | 14 (100.0%) | 0 (0.0%) |
| Computers & Mathematics | 0 (0.0%) | 0 (0.0%) |
| Architecture & Engineering | 14 (100.0%) | 0 (0.0%) |
| Life, Physical & Social Science | 0 (0.0%) | 0 (0.0%) |
| Community & Social Service | 0 (0.0%) | 11 (100.0%) |
| Education, Arts & Media | 0 (0.0%) | 8 (100.0%) |
| Legal Services & Support | 0 (0.0%) | 0 (0.0%) |
| Education Instruction & Library | 0 (0.0%) | 0 (0.0%) |
| Arts, Media & Entertainment | 0 (0.0%) | 3 (100.0%) |
| Health Diagnosing & Treating | 0 (0.0%) | 3 (100.0%) |
| Health Technologists | 0 (0.0%) | 3 (100.0%) |
| Total (Category) | 40 (64.5%) | 22 (35.5%) |
| Total (Overall) | 171 (64.5%) | 94 (35.5%) |
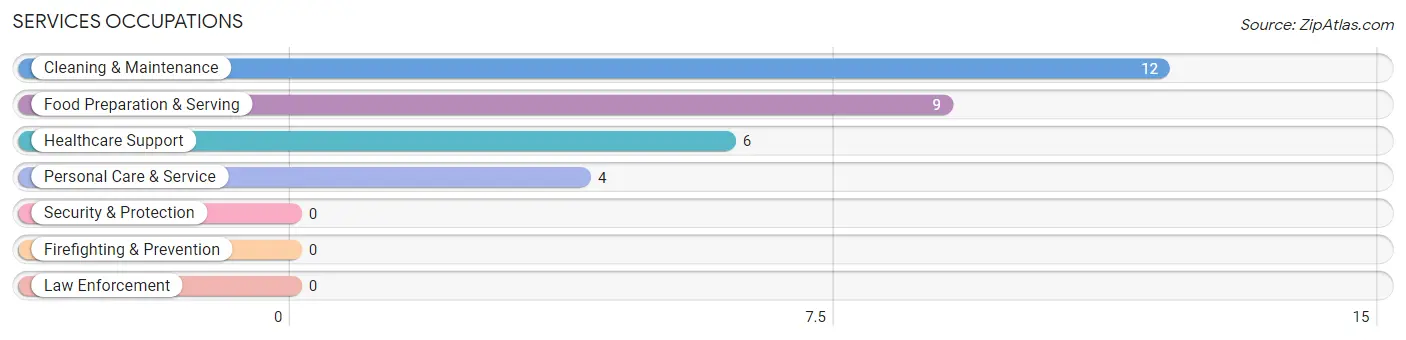
Services Occupations
The most common Services occupations in What Cheer are Cleaning & Maintenance (12 | 4.5%), Food Preparation & Serving (9 | 3.4%), Healthcare Support (6 | 2.3%), and Personal Care & Service (4 | 1.5%).
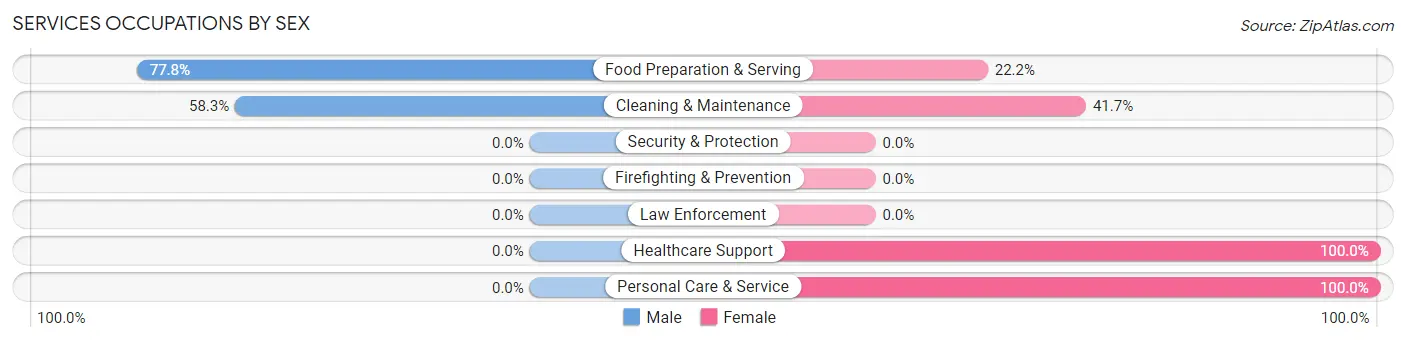
Services Occupations by Sex
Within the Services occupations in What Cheer, the most male-oriented occupations are Food Preparation & Serving (77.8%), and Cleaning & Maintenance (58.3%), while the most female-oriented occupations are Healthcare Support (100.0%), Personal Care & Service (100.0%), and Cleaning & Maintenance (41.7%).
| Occupation | Male | Female |
| Healthcare Support | 0 (0.0%) | 6 (100.0%) |
| Security & Protection | 0 (0.0%) | 0 (0.0%) |
| Firefighting & Prevention | 0 (0.0%) | 0 (0.0%) |
| Law Enforcement | 0 (0.0%) | 0 (0.0%) |
| Food Preparation & Serving | 7 (77.8%) | 2 (22.2%) |
| Cleaning & Maintenance | 7 (58.3%) | 5 (41.7%) |
| Personal Care & Service | 0 (0.0%) | 4 (100.0%) |
| Total (Category) | 14 (45.2%) | 17 (54.8%) |
| Total (Overall) | 171 (64.5%) | 94 (35.5%) |
Sales and Office Occupations
The most common Sales and Office occupations in What Cheer are Sales & Related (40 | 15.1%), and Office & Administration (25 | 9.4%).
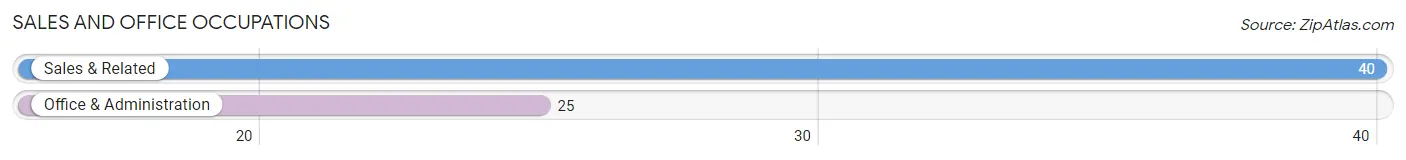
Sales and Office Occupations by Sex
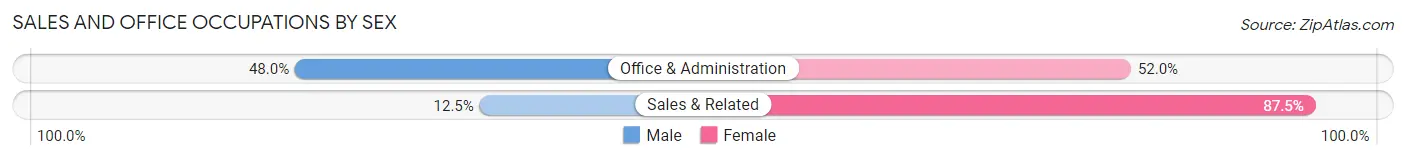
| Occupation | Male | Female |
| Sales & Related | 5 (12.5%) | 35 (87.5%) |
| Office & Administration | 12 (48.0%) | 13 (52.0%) |
| Total (Category) | 17 (26.2%) | 48 (73.9%) |
| Total (Overall) | 171 (64.5%) | 94 (35.5%) |
Natural Resources, Construction and Maintenance Occupations
The most common Natural Resources, Construction and Maintenance occupations in What Cheer are Construction & Extraction (29 | 10.9%), and Installation, Maintenance & Repair (1 | 0.4%).
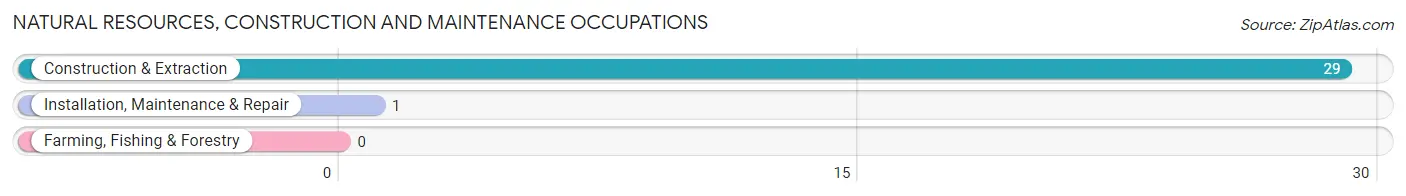
Natural Resources, Construction and Maintenance Occupations by Sex
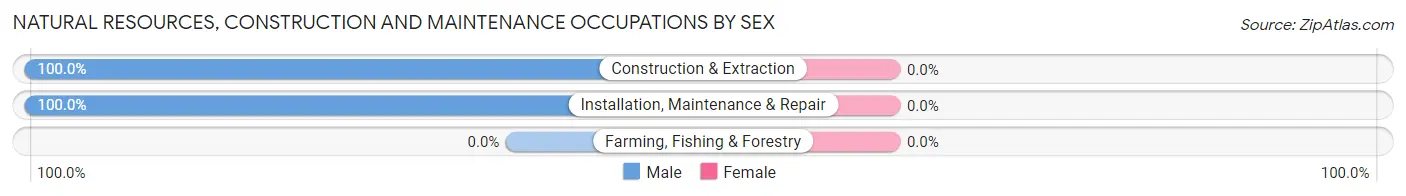
| Occupation | Male | Female |
| Farming, Fishing & Forestry | 0 (0.0%) | 0 (0.0%) |
| Construction & Extraction | 29 (100.0%) | 0 (0.0%) |
| Installation, Maintenance & Repair | 1 (100.0%) | 0 (0.0%) |
| Total (Category) | 30 (100.0%) | 0 (0.0%) |
| Total (Overall) | 171 (64.5%) | 94 (35.5%) |
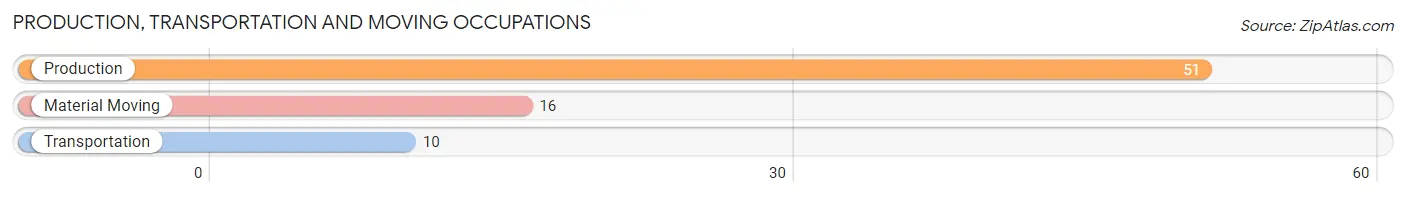
Production, Transportation and Moving Occupations
The most common Production, Transportation and Moving occupations in What Cheer are Production (51 | 19.3%), Material Moving (16 | 6.0%), and Transportation (10 | 3.8%).
Production, Transportation and Moving Occupations by Sex
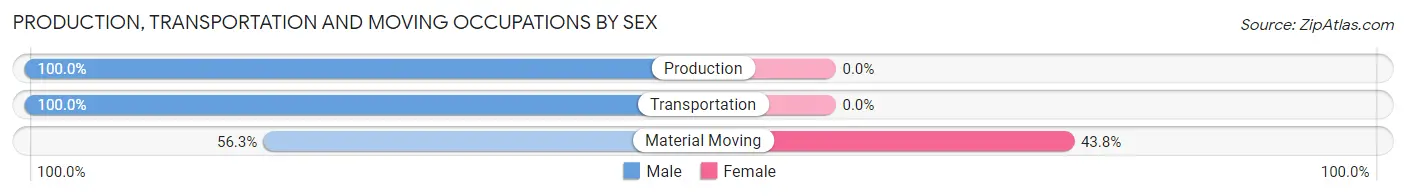
| Occupation | Male | Female |
| Production | 51 (100.0%) | 0 (0.0%) |
| Transportation | 10 (100.0%) | 0 (0.0%) |
| Material Moving | 9 (56.2%) | 7 (43.8%) |
| Total (Category) | 70 (90.9%) | 7 (9.1%) |
| Total (Overall) | 171 (64.5%) | 94 (35.5%) |
Employment Industries by Sex in What Cheer
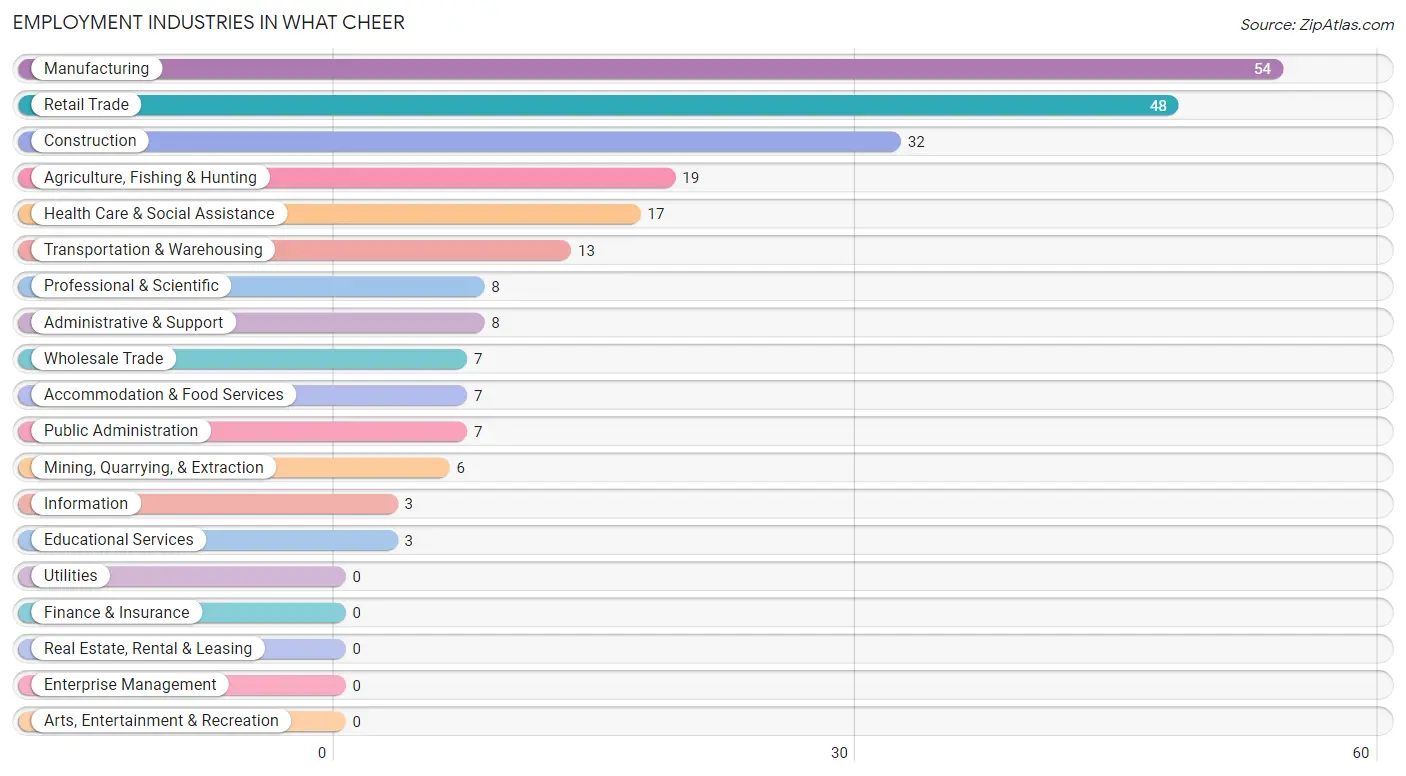
Employment Industries in What Cheer
The major employment industries in What Cheer include Manufacturing (54 | 20.4%), Retail Trade (48 | 18.1%), Construction (32 | 12.1%), Agriculture, Fishing & Hunting (19 | 7.2%), and Health Care & Social Assistance (17 | 6.4%).
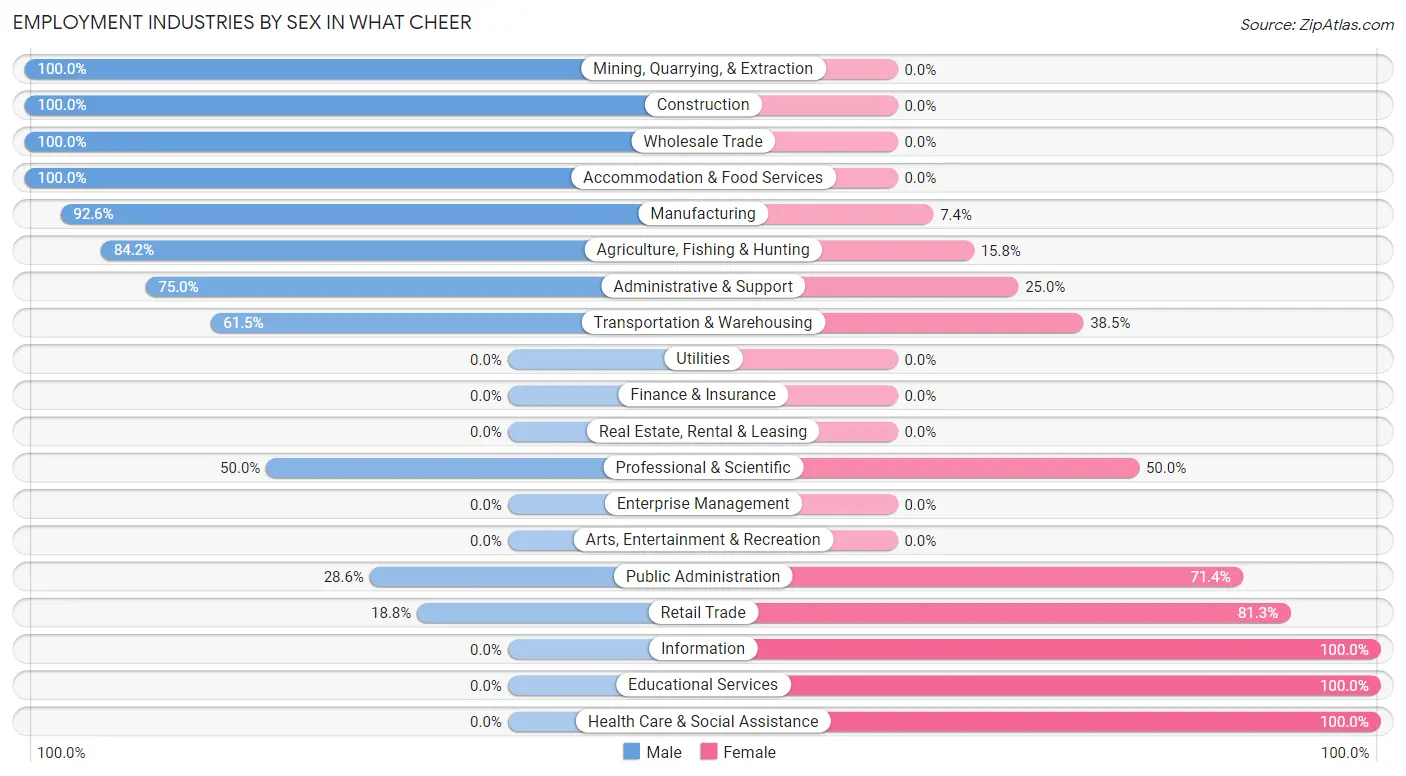
Employment Industries by Sex in What Cheer
The What Cheer industries that see more men than women are Mining, Quarrying, & Extraction (100.0%), Construction (100.0%), and Wholesale Trade (100.0%), whereas the industries that tend to have a higher number of women are Information (100.0%), Educational Services (100.0%), and Health Care & Social Assistance (100.0%).
| Industry | Male | Female |
| Agriculture, Fishing & Hunting | 16 (84.2%) | 3 (15.8%) |
| Mining, Quarrying, & Extraction | 6 (100.0%) | 0 (0.0%) |
| Construction | 32 (100.0%) | 0 (0.0%) |
| Manufacturing | 50 (92.6%) | 4 (7.4%) |
| Wholesale Trade | 7 (100.0%) | 0 (0.0%) |
| Retail Trade | 9 (18.8%) | 39 (81.2%) |
| Transportation & Warehousing | 8 (61.5%) | 5 (38.5%) |
| Utilities | 0 (0.0%) | 0 (0.0%) |
| Information | 0 (0.0%) | 3 (100.0%) |
| Finance & Insurance | 0 (0.0%) | 0 (0.0%) |
| Real Estate, Rental & Leasing | 0 (0.0%) | 0 (0.0%) |
| Professional & Scientific | 4 (50.0%) | 4 (50.0%) |
| Enterprise Management | 0 (0.0%) | 0 (0.0%) |
| Administrative & Support | 6 (75.0%) | 2 (25.0%) |
| Educational Services | 0 (0.0%) | 3 (100.0%) |
| Health Care & Social Assistance | 0 (0.0%) | 17 (100.0%) |
| Arts, Entertainment & Recreation | 0 (0.0%) | 0 (0.0%) |
| Accommodation & Food Services | 7 (100.0%) | 0 (0.0%) |
| Public Administration | 2 (28.6%) | 5 (71.4%) |
| Total | 171 (64.5%) | 94 (35.5%) |
Education in What Cheer
School Enrollment in What Cheer
The most common levels of schooling among the 224 students in What Cheer are elementary school (101 | 45.1%), high school (46 | 20.5%), and middle school (36 | 16.1%).
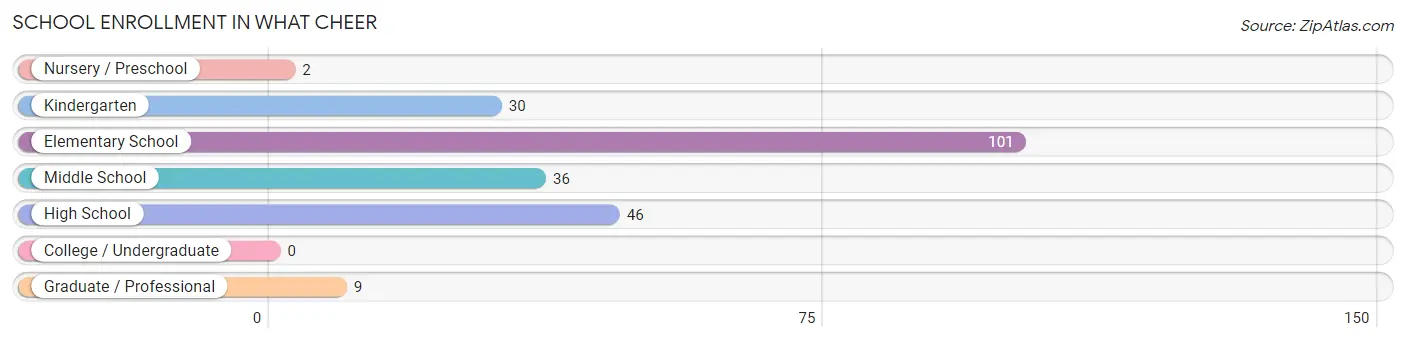
| School Level | # Students | % Students |
| Nursery / Preschool | 2 | 0.9% |
| Kindergarten | 30 | 13.4% |
| Elementary School | 101 | 45.1% |
| Middle School | 36 | 16.1% |
| High School | 46 | 20.5% |
| College / Undergraduate | 0 | 0.0% |
| Graduate / Professional | 9 | 4.0% |
| Total | 224 | 100.0% |
School Enrollment by Age by Funding Source in What Cheer
Out of a total of 224 students who are enrolled in schools in What Cheer, 13 (5.8%) attend a private institution, while the remaining 211 (94.2%) are enrolled in public schools. The age group of 10 to 14 year olds has the highest likelihood of being enrolled in private schools, with 5 (11.1% in the age bracket) enrolled. Conversely, the age group of 20 to 24 year olds has the lowest likelihood of being enrolled in a private school, with 9 (100.0% in the age bracket) attending a public institution.
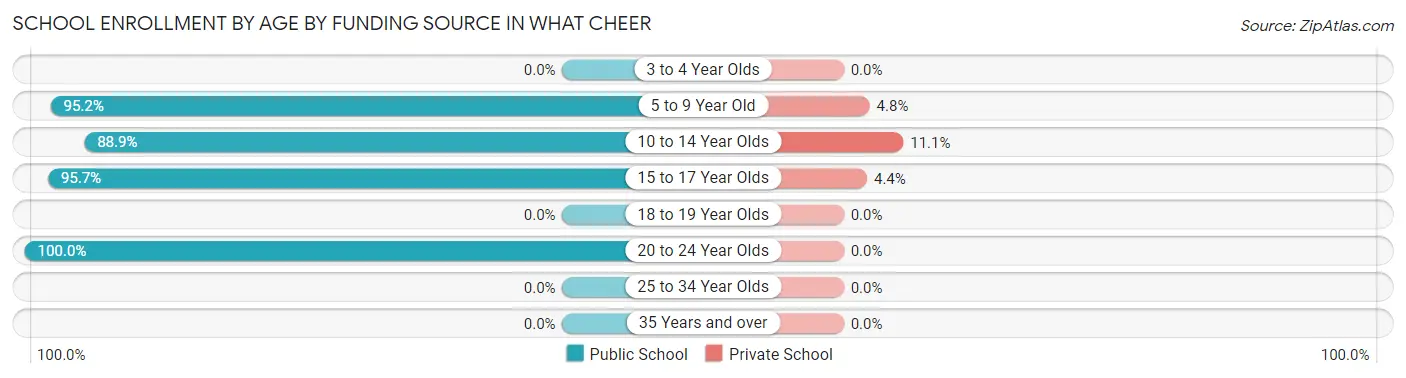
| Age Bracket | Public School | Private School |
| 3 to 4 Year Olds | 0 (0.0%) | 0 (0.0%) |
| 5 to 9 Year Old | 118 (95.2%) | 6 (4.8%) |
| 10 to 14 Year Olds | 40 (88.9%) | 5 (11.1%) |
| 15 to 17 Year Olds | 44 (95.7%) | 2 (4.3%) |
| 18 to 19 Year Olds | 0 (0.0%) | 0 (0.0%) |
| 20 to 24 Year Olds | 9 (100.0%) | 0 (0.0%) |
| 25 to 34 Year Olds | 0 (0.0%) | 0 (0.0%) |
| 35 Years and over | 0 (0.0%) | 0 (0.0%) |
| Total | 211 (94.2%) | 13 (5.8%) |
Educational Attainment by Field of Study in What Cheer
Business (14 | 43.8%), psychology (8 | 25.0%), education (5 | 15.6%), physical & health sciences (2 | 6.2%), and arts & humanities (2 | 6.2%) are the most common fields of study among 32 individuals in What Cheer who have obtained a bachelor's degree or higher.
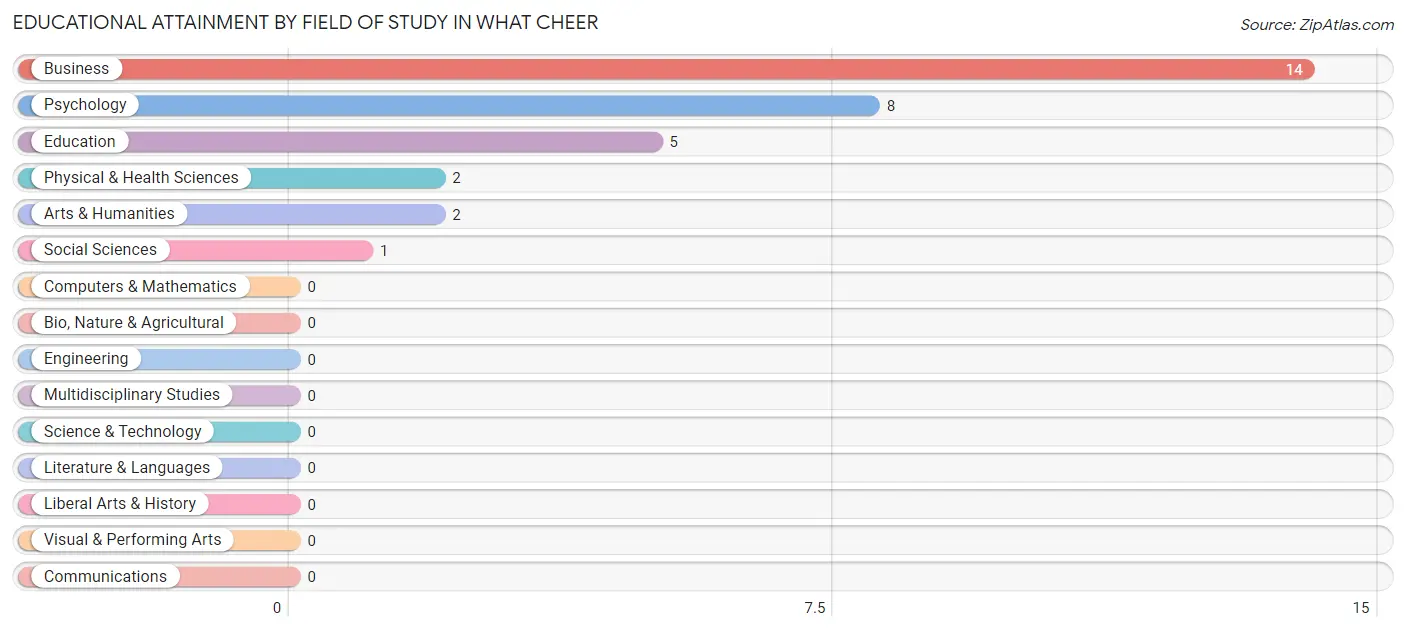
| Field of Study | # Graduates | % Graduates |
| Computers & Mathematics | 0 | 0.0% |
| Bio, Nature & Agricultural | 0 | 0.0% |
| Physical & Health Sciences | 2 | 6.2% |
| Psychology | 8 | 25.0% |
| Social Sciences | 1 | 3.1% |
| Engineering | 0 | 0.0% |
| Multidisciplinary Studies | 0 | 0.0% |
| Science & Technology | 0 | 0.0% |
| Business | 14 | 43.8% |
| Education | 5 | 15.6% |
| Literature & Languages | 0 | 0.0% |
| Liberal Arts & History | 0 | 0.0% |
| Visual & Performing Arts | 0 | 0.0% |
| Communications | 0 | 0.0% |
| Arts & Humanities | 2 | 6.2% |
| Total | 32 | 100.0% |
Transportation & Commute in What Cheer
Vehicle Availability by Sex in What Cheer
The most prevalent vehicle ownership categories in What Cheer are males with 2 vehicles (83, accounting for 48.5%) and females with 2 vehicles (43, making up 92.2%).
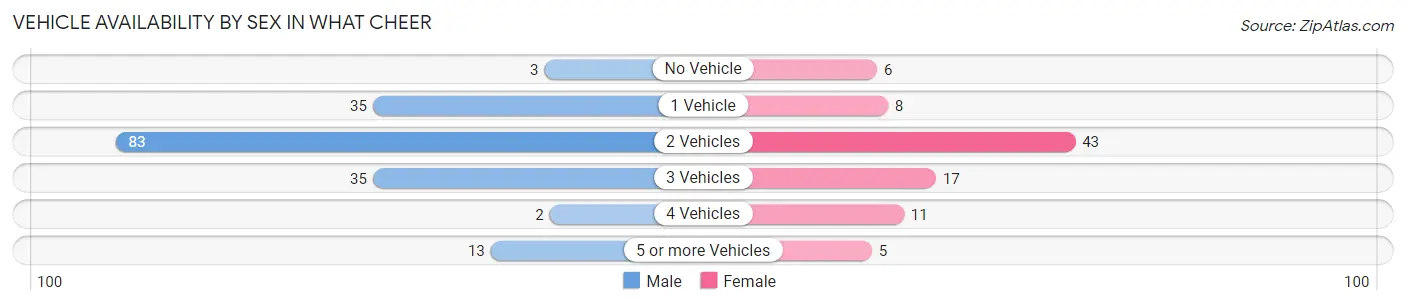
| Vehicles Available | Male | Female |
| No Vehicle | 3 (1.8%) | 6 (6.7%) |
| 1 Vehicle | 35 (20.5%) | 8 (8.9%) |
| 2 Vehicles | 83 (48.5%) | 43 (47.8%) |
| 3 Vehicles | 35 (20.5%) | 17 (18.9%) |
| 4 Vehicles | 2 (1.2%) | 11 (12.2%) |
| 5 or more Vehicles | 13 (7.6%) | 5 (5.6%) |
| Total | 171 (100.0%) | 90 (100.0%) |
Commute Time in What Cheer
The most frequently occuring commute durations in What Cheer are 30 to 34 minutes (40 commuters, 15.6%), 20 to 24 minutes (32 commuters, 12.4%), and 25 to 29 minutes (31 commuters, 12.1%).
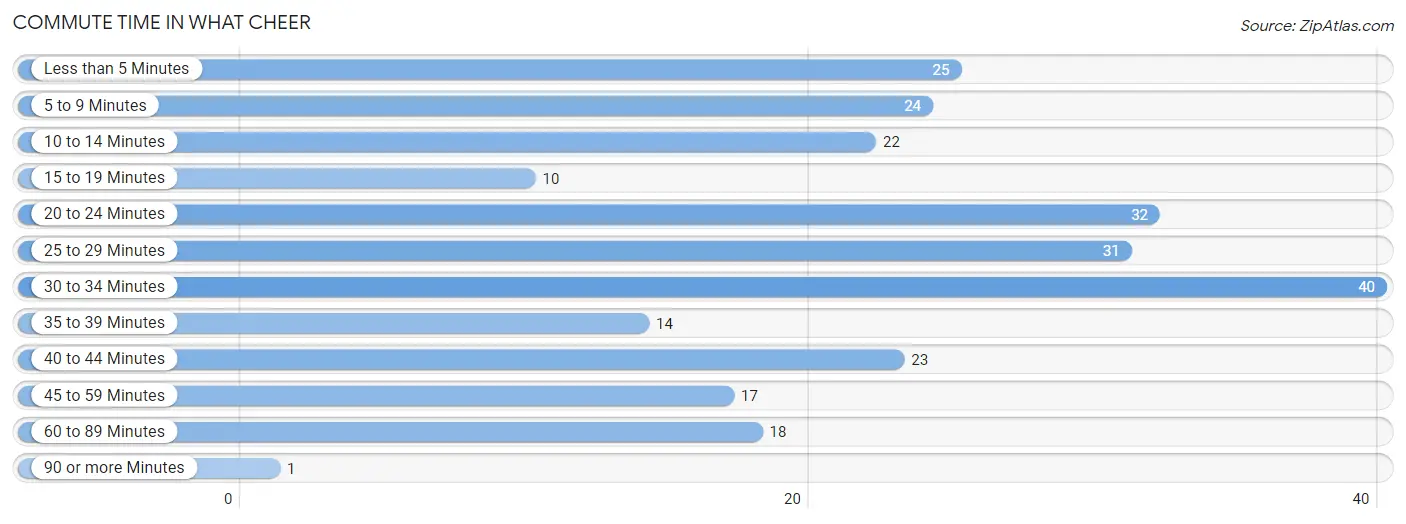
| Commute Time | # Commuters | % Commuters |
| Less than 5 Minutes | 25 | 9.7% |
| 5 to 9 Minutes | 24 | 9.3% |
| 10 to 14 Minutes | 22 | 8.6% |
| 15 to 19 Minutes | 10 | 3.9% |
| 20 to 24 Minutes | 32 | 12.4% |
| 25 to 29 Minutes | 31 | 12.1% |
| 30 to 34 Minutes | 40 | 15.6% |
| 35 to 39 Minutes | 14 | 5.4% |
| 40 to 44 Minutes | 23 | 8.9% |
| 45 to 59 Minutes | 17 | 6.6% |
| 60 to 89 Minutes | 18 | 7.0% |
| 90 or more Minutes | 1 | 0.4% |
Commute Time by Sex in What Cheer
The most common commute times in What Cheer are 30 to 34 minutes (30 commuters, 17.9%) for males and 5 to 9 minutes (20 commuters, 22.5%) for females.
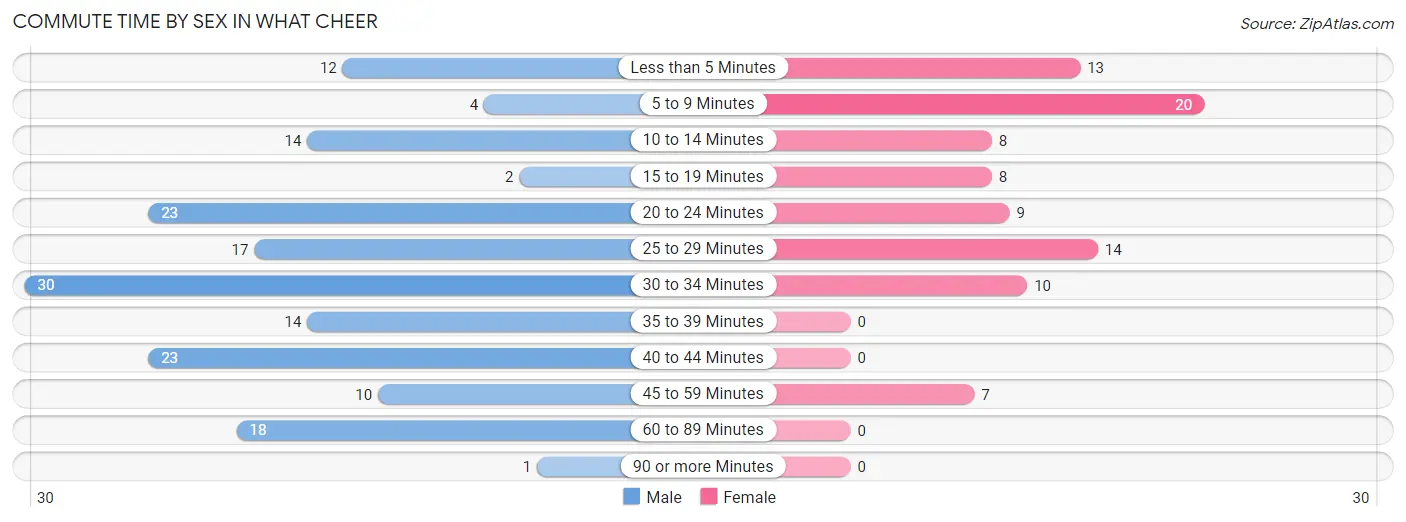
| Commute Time | Male | Female |
| Less than 5 Minutes | 12 (7.1%) | 13 (14.6%) |
| 5 to 9 Minutes | 4 (2.4%) | 20 (22.5%) |
| 10 to 14 Minutes | 14 (8.3%) | 8 (9.0%) |
| 15 to 19 Minutes | 2 (1.2%) | 8 (9.0%) |
| 20 to 24 Minutes | 23 (13.7%) | 9 (10.1%) |
| 25 to 29 Minutes | 17 (10.1%) | 14 (15.7%) |
| 30 to 34 Minutes | 30 (17.9%) | 10 (11.2%) |
| 35 to 39 Minutes | 14 (8.3%) | 0 (0.0%) |
| 40 to 44 Minutes | 23 (13.7%) | 0 (0.0%) |
| 45 to 59 Minutes | 10 (5.9%) | 7 (7.9%) |
| 60 to 89 Minutes | 18 (10.7%) | 0 (0.0%) |
| 90 or more Minutes | 1 (0.6%) | 0 (0.0%) |
Time of Departure to Work by Sex in What Cheer
The most frequent times of departure to work in What Cheer are 5:00 AM to 5:29 AM (40, 23.8%) for males and 7:30 AM to 7:59 AM (20, 22.5%) for females.
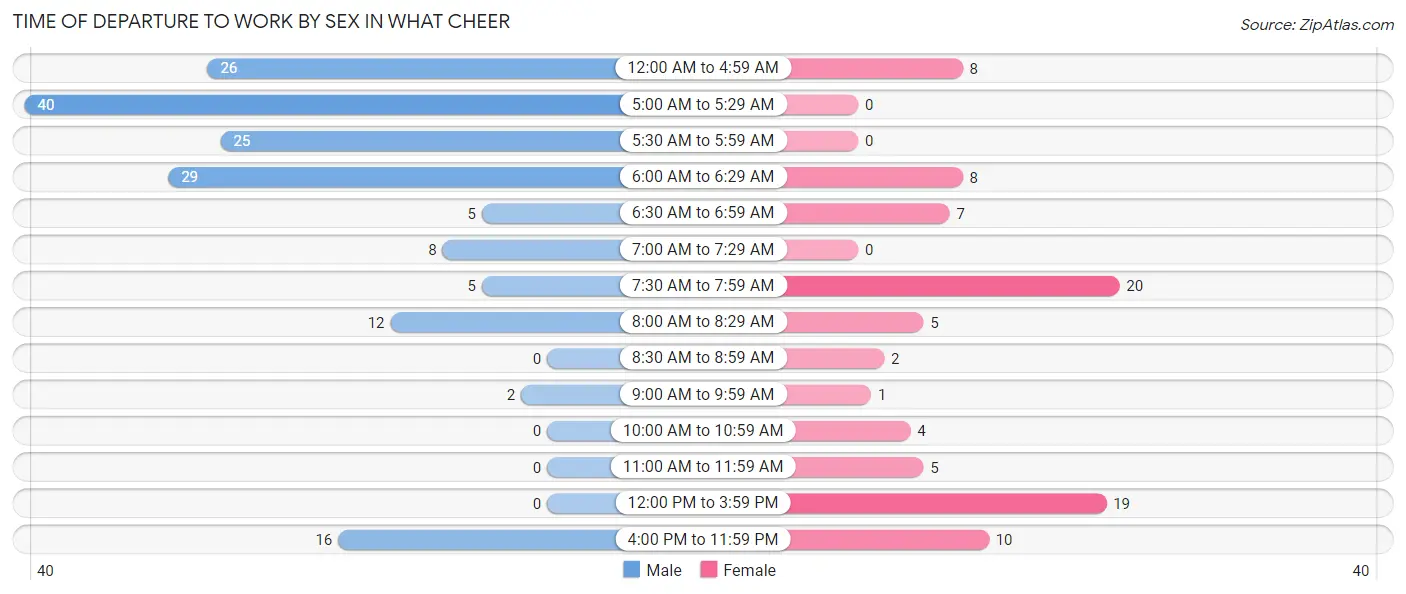
| Time of Departure | Male | Female |
| 12:00 AM to 4:59 AM | 26 (15.5%) | 8 (9.0%) |
| 5:00 AM to 5:29 AM | 40 (23.8%) | 0 (0.0%) |
| 5:30 AM to 5:59 AM | 25 (14.9%) | 0 (0.0%) |
| 6:00 AM to 6:29 AM | 29 (17.3%) | 8 (9.0%) |
| 6:30 AM to 6:59 AM | 5 (3.0%) | 7 (7.9%) |
| 7:00 AM to 7:29 AM | 8 (4.8%) | 0 (0.0%) |
| 7:30 AM to 7:59 AM | 5 (3.0%) | 20 (22.5%) |
| 8:00 AM to 8:29 AM | 12 (7.1%) | 5 (5.6%) |
| 8:30 AM to 8:59 AM | 0 (0.0%) | 2 (2.2%) |
| 9:00 AM to 9:59 AM | 2 (1.2%) | 1 (1.1%) |
| 10:00 AM to 10:59 AM | 0 (0.0%) | 4 (4.5%) |
| 11:00 AM to 11:59 AM | 0 (0.0%) | 5 (5.6%) |
| 12:00 PM to 3:59 PM | 0 (0.0%) | 19 (21.3%) |
| 4:00 PM to 11:59 PM | 16 (9.5%) | 10 (11.2%) |
| Total | 168 (100.0%) | 89 (100.0%) |
Housing Occupancy in What Cheer
Occupancy by Ownership in What Cheer
Of the total 262 dwellings in What Cheer, owner-occupied units account for 182 (69.5%), while renter-occupied units make up 80 (30.5%).
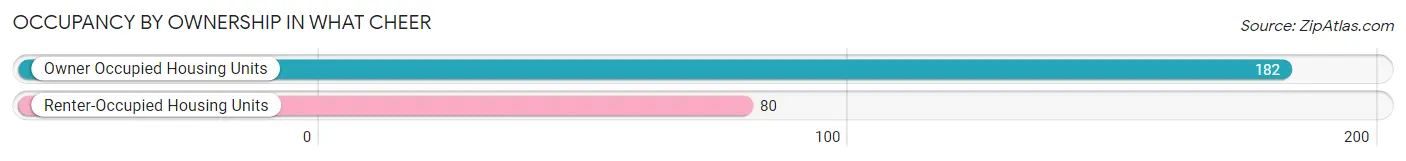
| Occupancy | # Housing Units | % Housing Units |
| Owner Occupied Housing Units | 182 | 69.5% |
| Renter-Occupied Housing Units | 80 | 30.5% |
| Total Occupied Housing Units | 262 | 100.0% |
Occupancy by Household Size in What Cheer
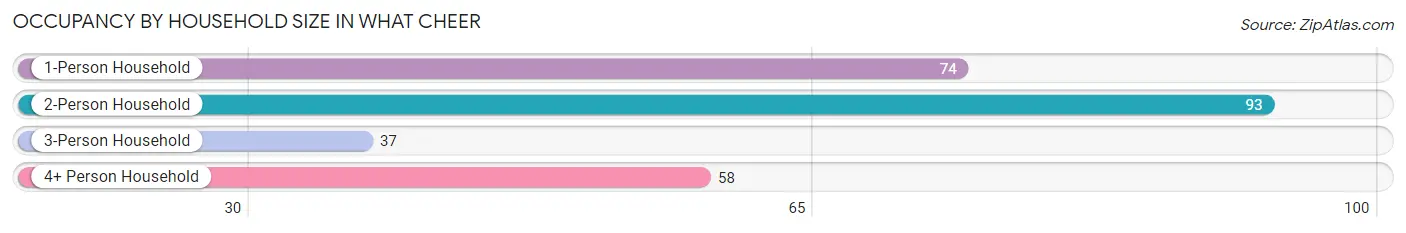
| Household Size | # Housing Units | % Housing Units |
| 1-Person Household | 74 | 28.2% |
| 2-Person Household | 93 | 35.5% |
| 3-Person Household | 37 | 14.1% |
| 4+ Person Household | 58 | 22.1% |
| Total Housing Units | 262 | 100.0% |
Occupancy by Ownership by Household Size in What Cheer
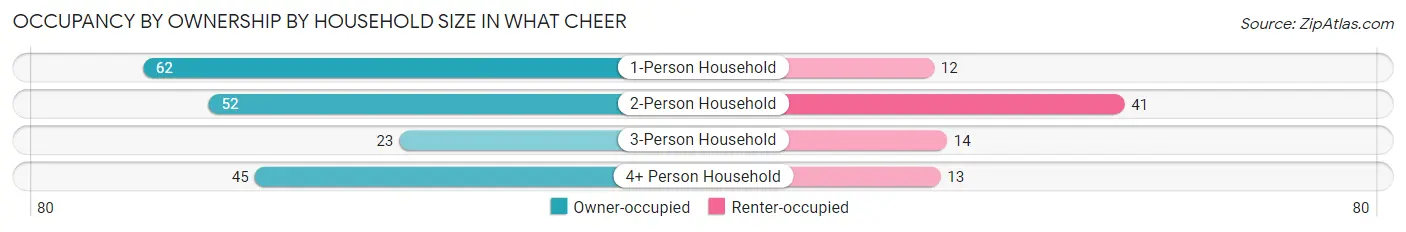
| Household Size | Owner-occupied | Renter-occupied |
| 1-Person Household | 62 (83.8%) | 12 (16.2%) |
| 2-Person Household | 52 (55.9%) | 41 (44.1%) |
| 3-Person Household | 23 (62.2%) | 14 (37.8%) |
| 4+ Person Household | 45 (77.6%) | 13 (22.4%) |
| Total Housing Units | 182 (69.5%) | 80 (30.5%) |
Occupancy by Educational Attainment in What Cheer
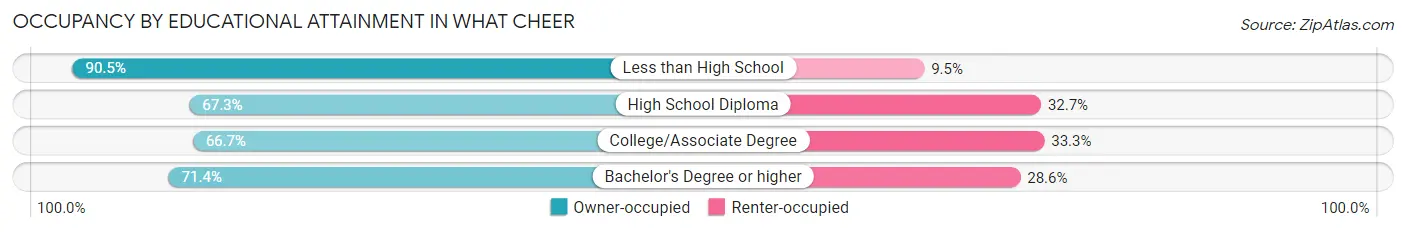
| Household Size | Owner-occupied | Renter-occupied |
| Less than High School | 19 (90.5%) | 2 (9.5%) |
| High School Diploma | 101 (67.3%) | 49 (32.7%) |
| College/Associate Degree | 42 (66.7%) | 21 (33.3%) |
| Bachelor's Degree or higher | 20 (71.4%) | 8 (28.6%) |
Occupancy by Age of Householder in What Cheer
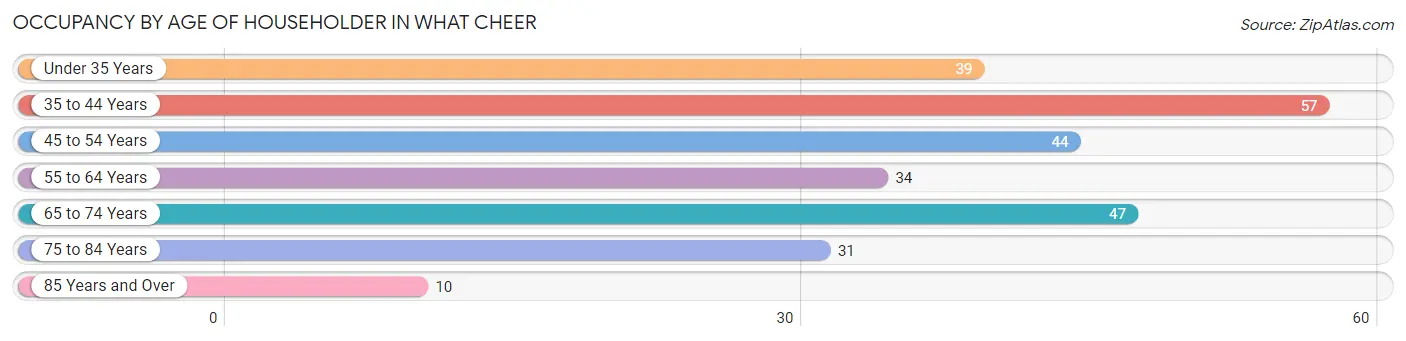
| Age Bracket | # Households | % Households |
| Under 35 Years | 39 | 14.9% |
| 35 to 44 Years | 57 | 21.8% |
| 45 to 54 Years | 44 | 16.8% |
| 55 to 64 Years | 34 | 13.0% |
| 65 to 74 Years | 47 | 17.9% |
| 75 to 84 Years | 31 | 11.8% |
| 85 Years and Over | 10 | 3.8% |
| Total | 262 | 100.0% |
Housing Finances in What Cheer
Median Income by Occupancy in What Cheer
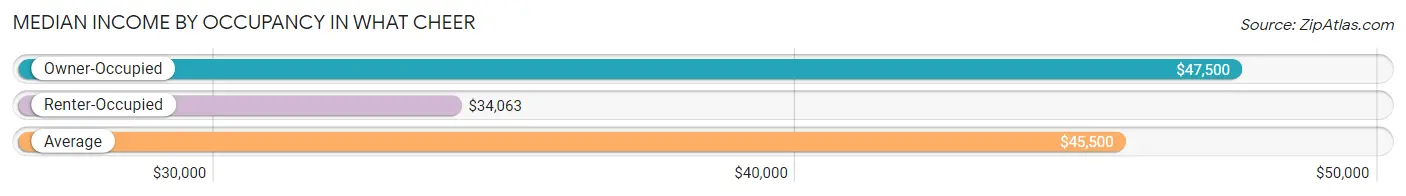
| Occupancy Type | # Households | Median Income |
| Owner-Occupied | 182 (69.5%) | $47,500 |
| Renter-Occupied | 80 (30.5%) | $34,063 |
| Average | 262 (100.0%) | $45,500 |
Occupancy by Householder Income Bracket in What Cheer
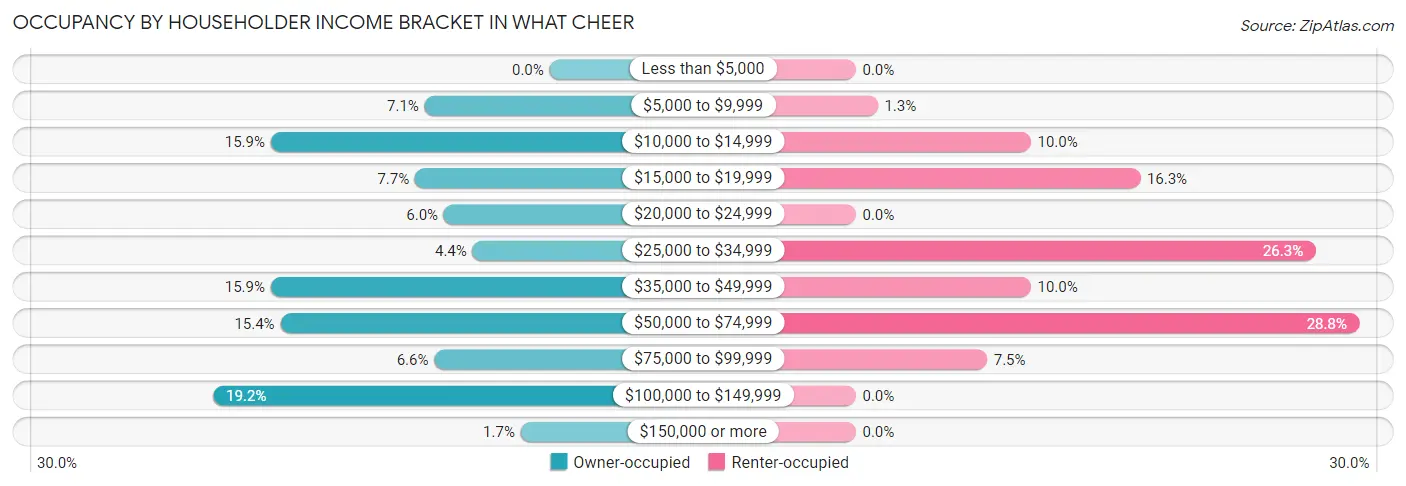
| Income Bracket | Owner-occupied | Renter-occupied |
| Less than $5,000 | 0 (0.0%) | 0 (0.0%) |
| $5,000 to $9,999 | 13 (7.1%) | 1 (1.3%) |
| $10,000 to $14,999 | 29 (15.9%) | 8 (10.0%) |
| $15,000 to $19,999 | 14 (7.7%) | 13 (16.3%) |
| $20,000 to $24,999 | 11 (6.0%) | 0 (0.0%) |
| $25,000 to $34,999 | 8 (4.4%) | 21 (26.3%) |
| $35,000 to $49,999 | 29 (15.9%) | 8 (10.0%) |
| $50,000 to $74,999 | 28 (15.4%) | 23 (28.7%) |
| $75,000 to $99,999 | 12 (6.6%) | 6 (7.5%) |
| $100,000 to $149,999 | 35 (19.2%) | 0 (0.0%) |
| $150,000 or more | 3 (1.7%) | 0 (0.0%) |
| Total | 182 (100.0%) | 80 (100.0%) |
Monthly Housing Cost Tiers in What Cheer
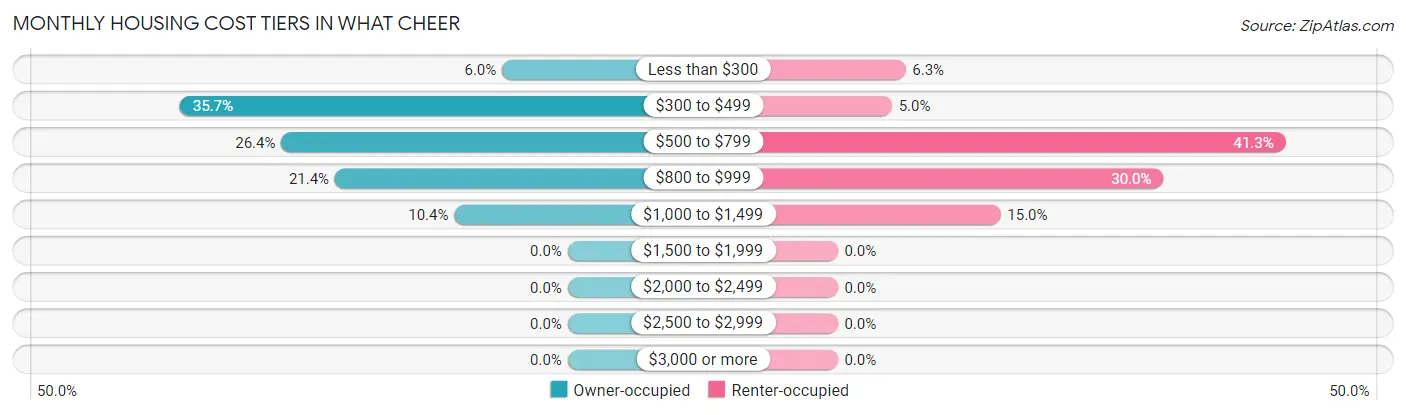
| Monthly Cost | Owner-occupied | Renter-occupied |
| Less than $300 | 11 (6.0%) | 5 (6.2%) |
| $300 to $499 | 65 (35.7%) | 4 (5.0%) |
| $500 to $799 | 48 (26.4%) | 33 (41.2%) |
| $800 to $999 | 39 (21.4%) | 24 (30.0%) |
| $1,000 to $1,499 | 19 (10.4%) | 12 (15.0%) |
| $1,500 to $1,999 | 0 (0.0%) | 0 (0.0%) |
| $2,000 to $2,499 | 0 (0.0%) | 0 (0.0%) |
| $2,500 to $2,999 | 0 (0.0%) | 0 (0.0%) |
| $3,000 or more | 0 (0.0%) | 0 (0.0%) |
| Total | 182 (100.0%) | 80 (100.0%) |
Physical Housing Characteristics in What Cheer
Housing Structures in What Cheer
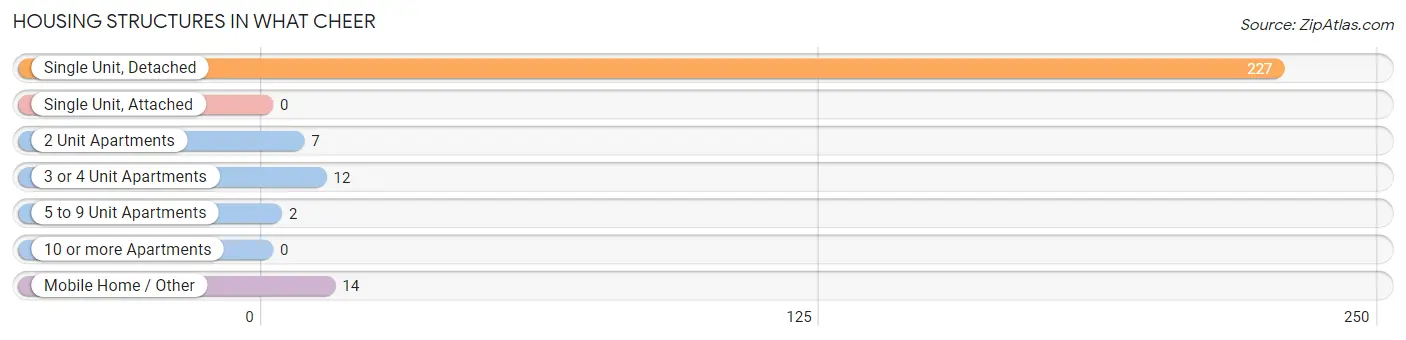
| Structure Type | # Housing Units | % Housing Units |
| Single Unit, Detached | 227 | 86.6% |
| Single Unit, Attached | 0 | 0.0% |
| 2 Unit Apartments | 7 | 2.7% |
| 3 or 4 Unit Apartments | 12 | 4.6% |
| 5 to 9 Unit Apartments | 2 | 0.8% |
| 10 or more Apartments | 0 | 0.0% |
| Mobile Home / Other | 14 | 5.3% |
| Total | 262 | 100.0% |
Housing Structures by Occupancy in What Cheer
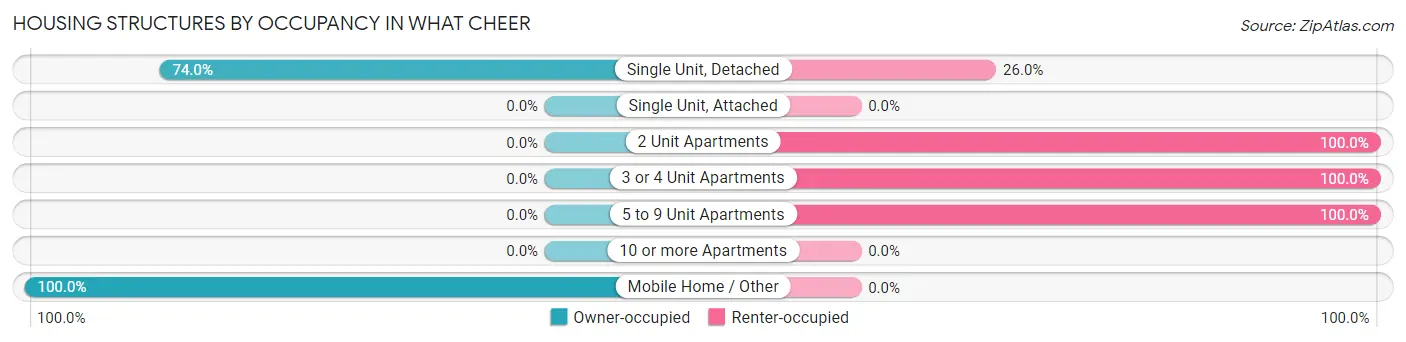
| Structure Type | Owner-occupied | Renter-occupied |
| Single Unit, Detached | 168 (74.0%) | 59 (26.0%) |
| Single Unit, Attached | 0 (0.0%) | 0 (0.0%) |
| 2 Unit Apartments | 0 (0.0%) | 7 (100.0%) |
| 3 or 4 Unit Apartments | 0 (0.0%) | 12 (100.0%) |
| 5 to 9 Unit Apartments | 0 (0.0%) | 2 (100.0%) |
| 10 or more Apartments | 0 (0.0%) | 0 (0.0%) |
| Mobile Home / Other | 14 (100.0%) | 0 (0.0%) |
| Total | 182 (69.5%) | 80 (30.5%) |
Housing Structures by Number of Rooms in What Cheer
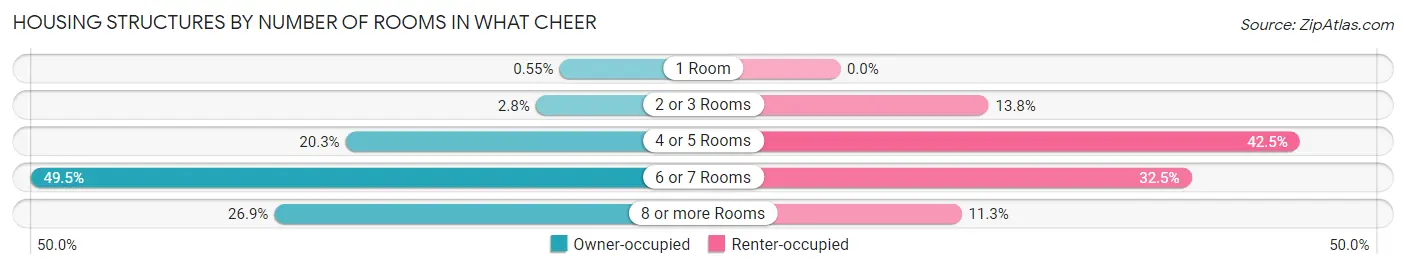
| Number of Rooms | Owner-occupied | Renter-occupied |
| 1 Room | 1 (0.5%) | 0 (0.0%) |
| 2 or 3 Rooms | 5 (2.8%) | 11 (13.8%) |
| 4 or 5 Rooms | 37 (20.3%) | 34 (42.5%) |
| 6 or 7 Rooms | 90 (49.4%) | 26 (32.5%) |
| 8 or more Rooms | 49 (26.9%) | 9 (11.3%) |
| Total | 182 (100.0%) | 80 (100.0%) |
Housing Structure by Heating Type in What Cheer
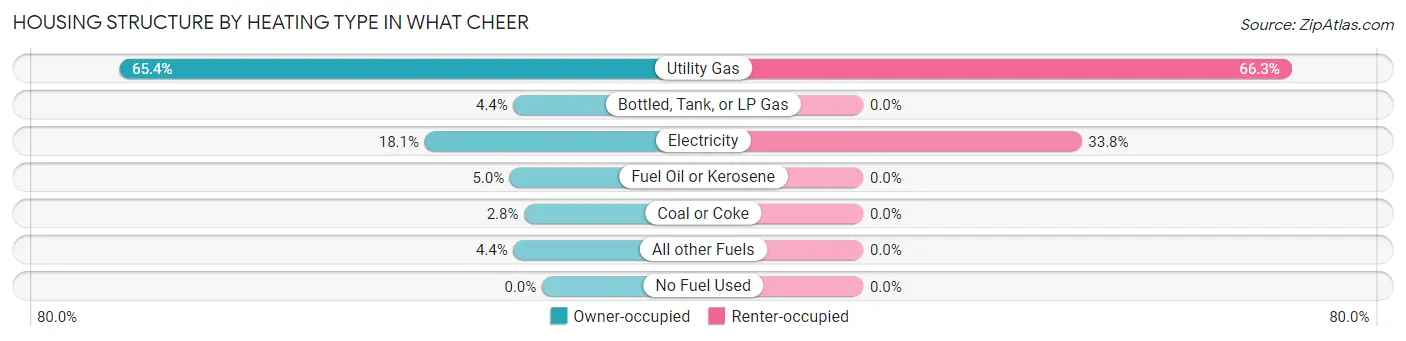
| Heating Type | Owner-occupied | Renter-occupied |
| Utility Gas | 119 (65.4%) | 53 (66.2%) |
| Bottled, Tank, or LP Gas | 8 (4.4%) | 0 (0.0%) |
| Electricity | 33 (18.1%) | 27 (33.8%) |
| Fuel Oil or Kerosene | 9 (5.0%) | 0 (0.0%) |
| Coal or Coke | 5 (2.8%) | 0 (0.0%) |
| All other Fuels | 8 (4.4%) | 0 (0.0%) |
| No Fuel Used | 0 (0.0%) | 0 (0.0%) |
| Total | 182 (100.0%) | 80 (100.0%) |
Household Vehicle Usage in What Cheer
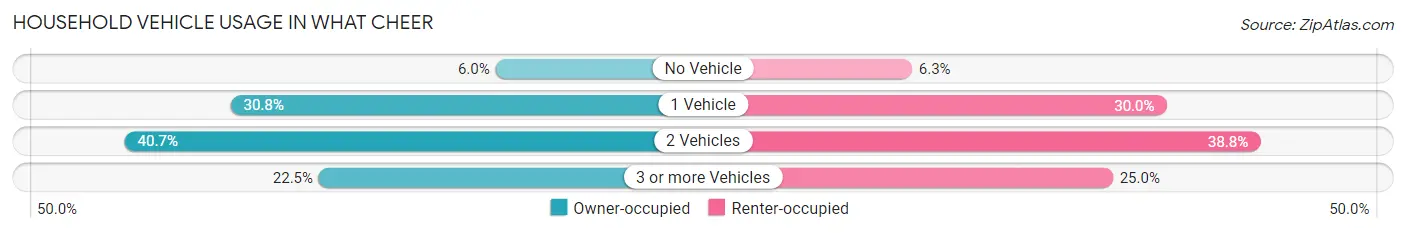
| Vehicles per Household | Owner-occupied | Renter-occupied |
| No Vehicle | 11 (6.0%) | 5 (6.2%) |
| 1 Vehicle | 56 (30.8%) | 24 (30.0%) |
| 2 Vehicles | 74 (40.7%) | 31 (38.8%) |
| 3 or more Vehicles | 41 (22.5%) | 20 (25.0%) |
| Total | 182 (100.0%) | 80 (100.0%) |
Real Estate & Mortgages in What Cheer
Real Estate and Mortgage Overview in What Cheer
| Characteristic | Without Mortgage | With Mortgage |
| Housing Units | 112 | 70 |
| Median Property Value | $34,200 | $62,000 |
| Median Household Income | $28,333 | $2 |
| Monthly Housing Costs | $426 | $0 |
| Real Estate Taxes | $700 | $0 |
Property Value by Mortgage Status in What Cheer
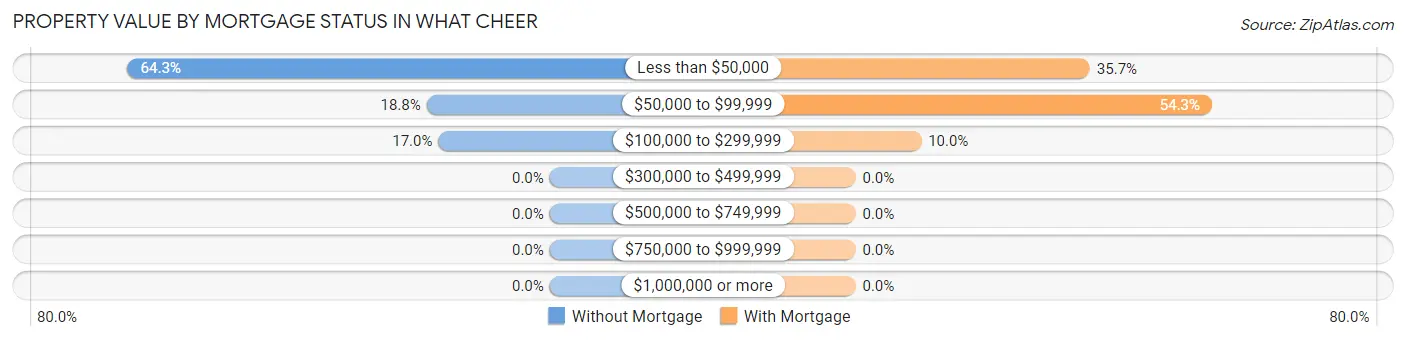
| Property Value | Without Mortgage | With Mortgage |
| Less than $50,000 | 72 (64.3%) | 25 (35.7%) |
| $50,000 to $99,999 | 21 (18.8%) | 38 (54.3%) |
| $100,000 to $299,999 | 19 (17.0%) | 7 (10.0%) |
| $300,000 to $499,999 | 0 (0.0%) | 0 (0.0%) |
| $500,000 to $749,999 | 0 (0.0%) | 0 (0.0%) |
| $750,000 to $999,999 | 0 (0.0%) | 0 (0.0%) |
| $1,000,000 or more | 0 (0.0%) | 0 (0.0%) |
| Total | 112 (100.0%) | 70 (100.0%) |
Household Income by Mortgage Status in What Cheer
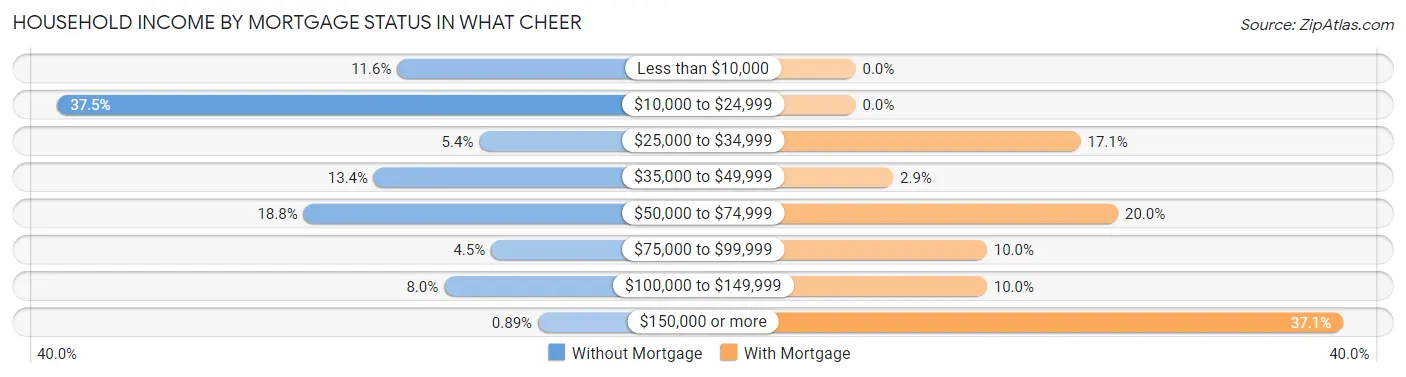
| Household Income | Without Mortgage | With Mortgage |
| Less than $10,000 | 13 (11.6%) | 0 (0.0%) |
| $10,000 to $24,999 | 42 (37.5%) | 0 (0.0%) |
| $25,000 to $34,999 | 6 (5.4%) | 12 (17.1%) |
| $35,000 to $49,999 | 15 (13.4%) | 2 (2.9%) |
| $50,000 to $74,999 | 21 (18.8%) | 14 (20.0%) |
| $75,000 to $99,999 | 5 (4.5%) | 7 (10.0%) |
| $100,000 to $149,999 | 9 (8.0%) | 7 (10.0%) |
| $150,000 or more | 1 (0.9%) | 26 (37.1%) |
| Total | 112 (100.0%) | 70 (100.0%) |
Property Value to Household Income Ratio in What Cheer
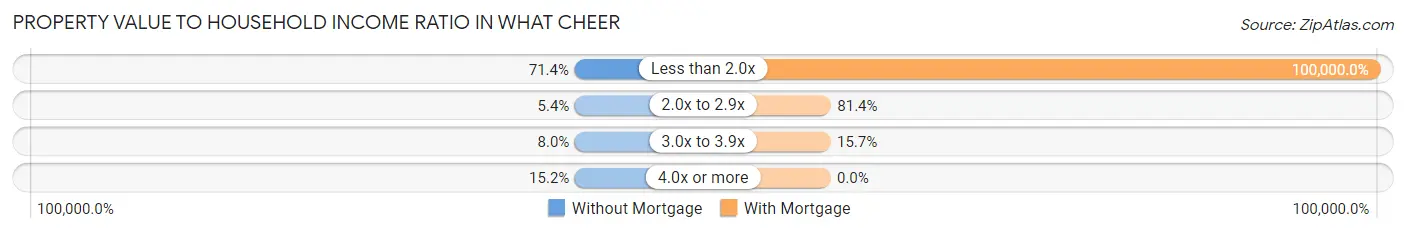
| Value-to-Income Ratio | Without Mortgage | With Mortgage |
| Less than 2.0x | 80 (71.4%) | 70,000 (100,000.0%) |
| 2.0x to 2.9x | 6 (5.4%) | 57 (81.4%) |
| 3.0x to 3.9x | 9 (8.0%) | 11 (15.7%) |
| 4.0x or more | 17 (15.2%) | 0 (0.0%) |
| Total | 112 (100.0%) | 70 (100.0%) |
Real Estate Taxes by Mortgage Status in What Cheer
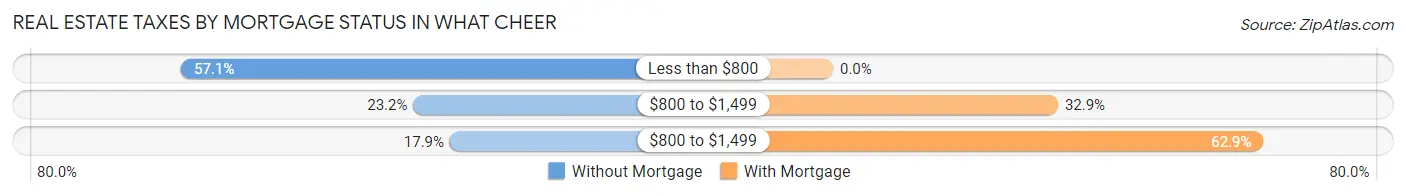
| Property Taxes | Without Mortgage | With Mortgage |
| Less than $800 | 64 (57.1%) | 0 (0.0%) |
| $800 to $1,499 | 26 (23.2%) | 23 (32.9%) |
| $800 to $1,499 | 20 (17.9%) | 44 (62.9%) |
| Total | 112 (100.0%) | 70 (100.0%) |
Health & Disability in What Cheer
Health Insurance Coverage by Age in What Cheer
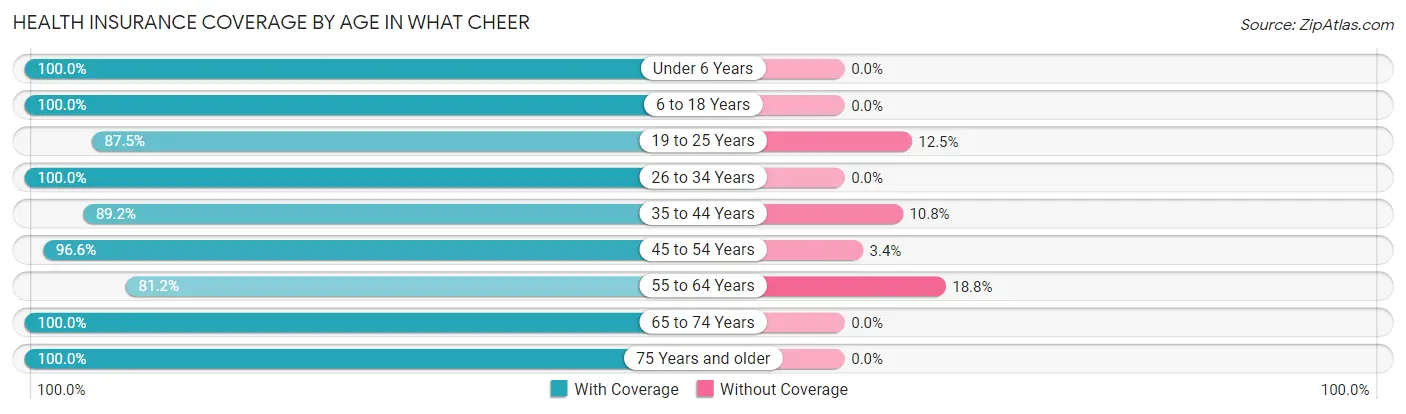
| Age Bracket | With Coverage | Without Coverage |
| Under 6 Years | 30 (100.0%) | 0 (0.0%) |
| 6 to 18 Years | 213 (100.0%) | 0 (0.0%) |
| 19 to 25 Years | 77 (87.5%) | 11 (12.5%) |
| 26 to 34 Years | 32 (100.0%) | 0 (0.0%) |
| 35 to 44 Years | 74 (89.2%) | 9 (10.8%) |
| 45 to 54 Years | 85 (96.6%) | 3 (3.4%) |
| 55 to 64 Years | 56 (81.2%) | 13 (18.8%) |
| 65 to 74 Years | 71 (100.0%) | 0 (0.0%) |
| 75 Years and older | 50 (100.0%) | 0 (0.0%) |
| Total | 688 (95.0%) | 36 (5.0%) |
Health Insurance Coverage by Citizenship Status in What Cheer
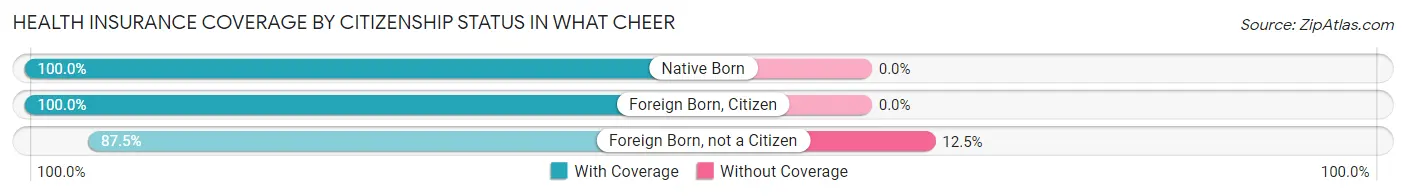
| Citizenship Status | With Coverage | Without Coverage |
| Native Born | 30 (100.0%) | 0 (0.0%) |
| Foreign Born, Citizen | 213 (100.0%) | 0 (0.0%) |
| Foreign Born, not a Citizen | 77 (87.5%) | 11 (12.5%) |
Health Insurance Coverage by Household Income in What Cheer
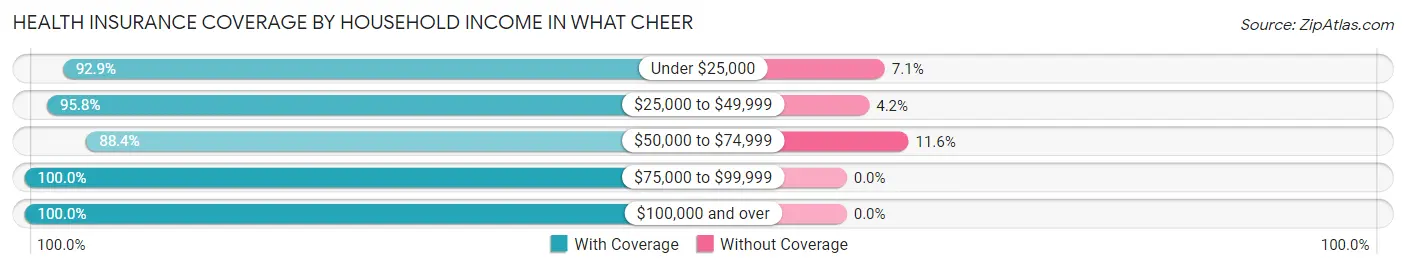
| Household Income | With Coverage | Without Coverage |
| Under $25,000 | 169 (92.9%) | 13 (7.1%) |
| $25,000 to $49,999 | 205 (95.8%) | 9 (4.2%) |
| $50,000 to $74,999 | 107 (88.4%) | 14 (11.6%) |
| $75,000 to $99,999 | 69 (100.0%) | 0 (0.0%) |
| $100,000 and over | 138 (100.0%) | 0 (0.0%) |
Public vs Private Health Insurance Coverage by Age in What Cheer
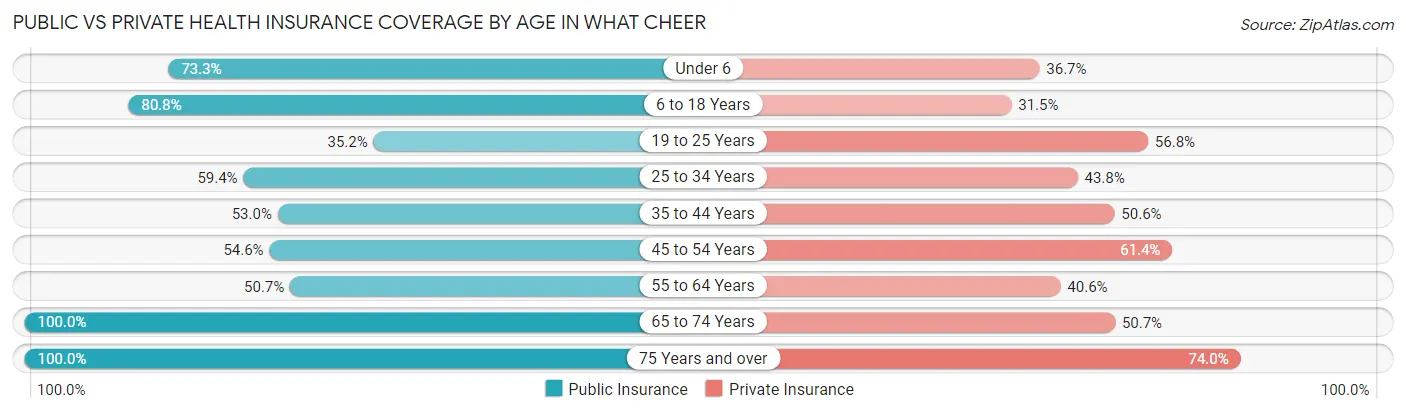
| Age Bracket | Public Insurance | Private Insurance |
| Under 6 | 22 (73.3%) | 11 (36.7%) |
| 6 to 18 Years | 172 (80.7%) | 67 (31.5%) |
| 19 to 25 Years | 31 (35.2%) | 50 (56.8%) |
| 25 to 34 Years | 19 (59.4%) | 14 (43.8%) |
| 35 to 44 Years | 44 (53.0%) | 42 (50.6%) |
| 45 to 54 Years | 48 (54.5%) | 54 (61.4%) |
| 55 to 64 Years | 35 (50.7%) | 28 (40.6%) |
| 65 to 74 Years | 71 (100.0%) | 36 (50.7%) |
| 75 Years and over | 50 (100.0%) | 37 (74.0%) |
| Total | 492 (68.0%) | 339 (46.8%) |
Disability Status by Sex by Age in What Cheer
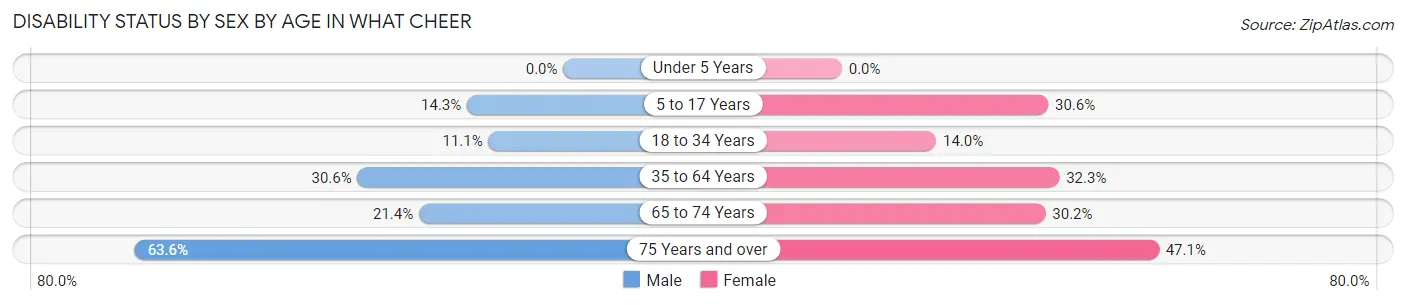
| Age Bracket | Male | Female |
| Under 5 Years | 0 (0.0%) | 0 (0.0%) |
| 5 to 17 Years | 15 (14.3%) | 34 (30.6%) |
| 18 to 34 Years | 8 (11.1%) | 7 (14.0%) |
| 35 to 64 Years | 44 (30.6%) | 31 (32.3%) |
| 65 to 74 Years | 6 (21.4%) | 13 (30.2%) |
| 75 Years and over | 21 (63.6%) | 8 (47.1%) |
Disability Class by Sex by Age in What Cheer
Disability Class: Hearing Difficulty
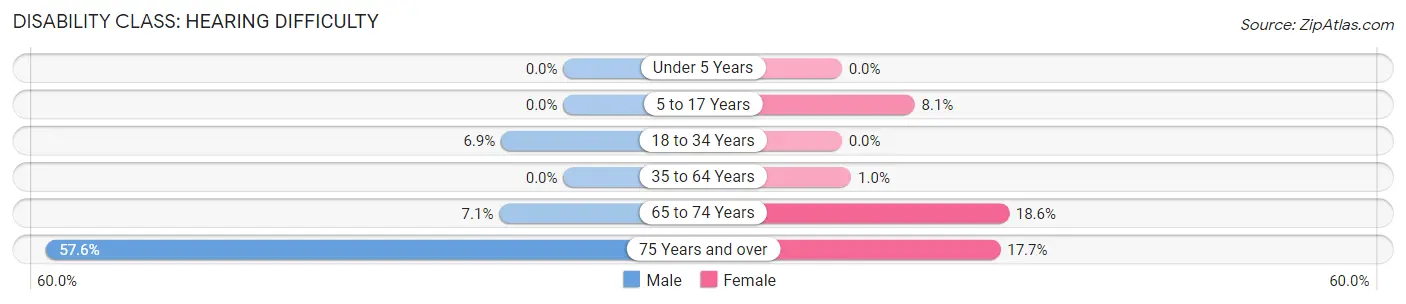
| Age Bracket | Male | Female |
| Under 5 Years | 0 (0.0%) | 0 (0.0%) |
| 5 to 17 Years | 0 (0.0%) | 9 (8.1%) |
| 18 to 34 Years | 5 (6.9%) | 0 (0.0%) |
| 35 to 64 Years | 0 (0.0%) | 1 (1.0%) |
| 65 to 74 Years | 2 (7.1%) | 8 (18.6%) |
| 75 Years and over | 19 (57.6%) | 3 (17.6%) |
Disability Class: Vision Difficulty
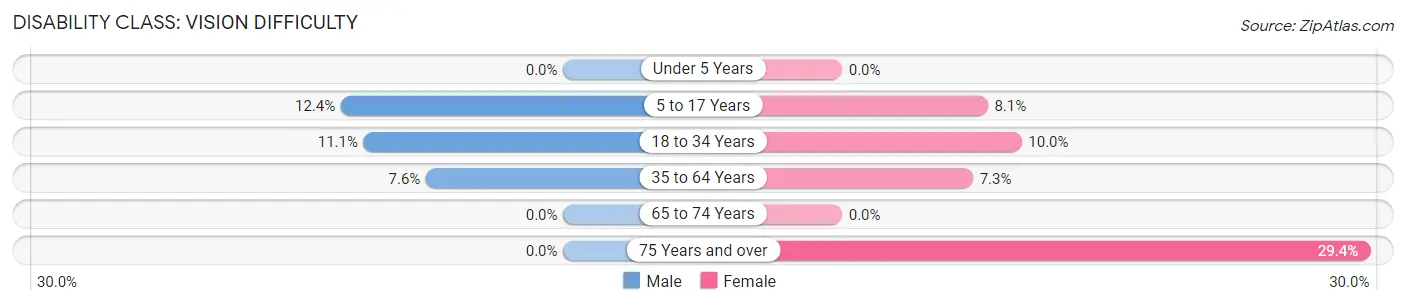
| Age Bracket | Male | Female |
| Under 5 Years | 0 (0.0%) | 0 (0.0%) |
| 5 to 17 Years | 13 (12.4%) | 9 (8.1%) |
| 18 to 34 Years | 8 (11.1%) | 5 (10.0%) |
| 35 to 64 Years | 11 (7.6%) | 7 (7.3%) |
| 65 to 74 Years | 0 (0.0%) | 0 (0.0%) |
| 75 Years and over | 0 (0.0%) | 5 (29.4%) |
Disability Class: Cognitive Difficulty
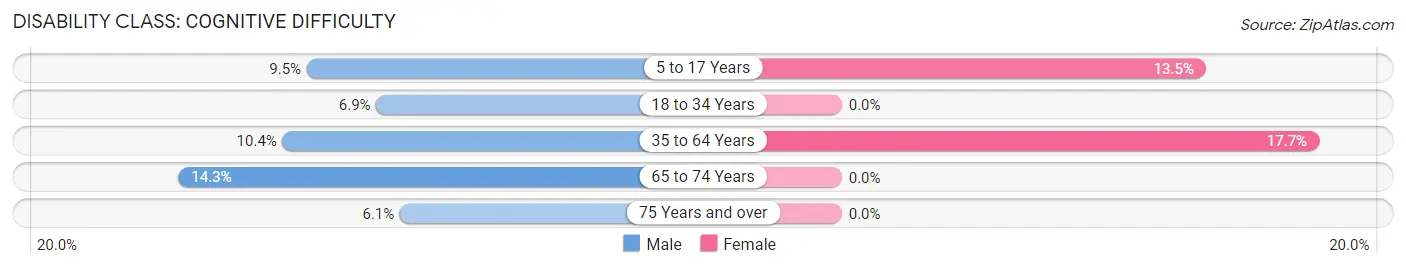
| Age Bracket | Male | Female |
| 5 to 17 Years | 10 (9.5%) | 15 (13.5%) |
| 18 to 34 Years | 5 (6.9%) | 0 (0.0%) |
| 35 to 64 Years | 15 (10.4%) | 17 (17.7%) |
| 65 to 74 Years | 4 (14.3%) | 0 (0.0%) |
| 75 Years and over | 2 (6.1%) | 0 (0.0%) |
Disability Class: Ambulatory Difficulty
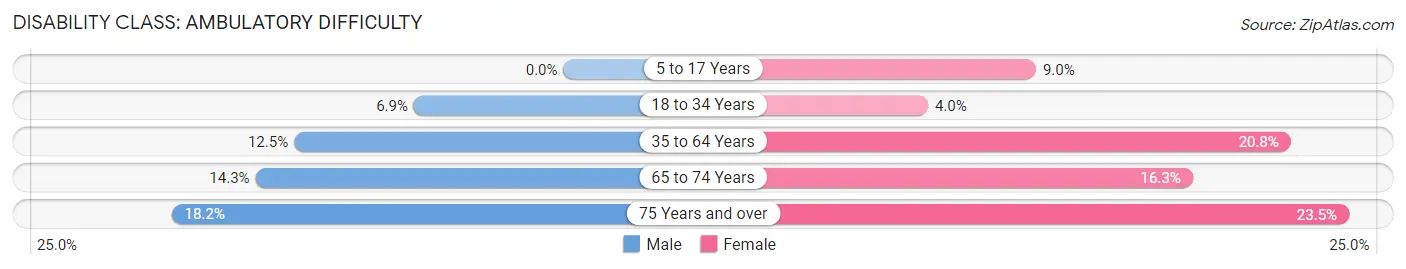
| Age Bracket | Male | Female |
| 5 to 17 Years | 0 (0.0%) | 10 (9.0%) |
| 18 to 34 Years | 5 (6.9%) | 2 (4.0%) |
| 35 to 64 Years | 18 (12.5%) | 20 (20.8%) |
| 65 to 74 Years | 4 (14.3%) | 7 (16.3%) |
| 75 Years and over | 6 (18.2%) | 4 (23.5%) |
Disability Class: Self-Care Difficulty
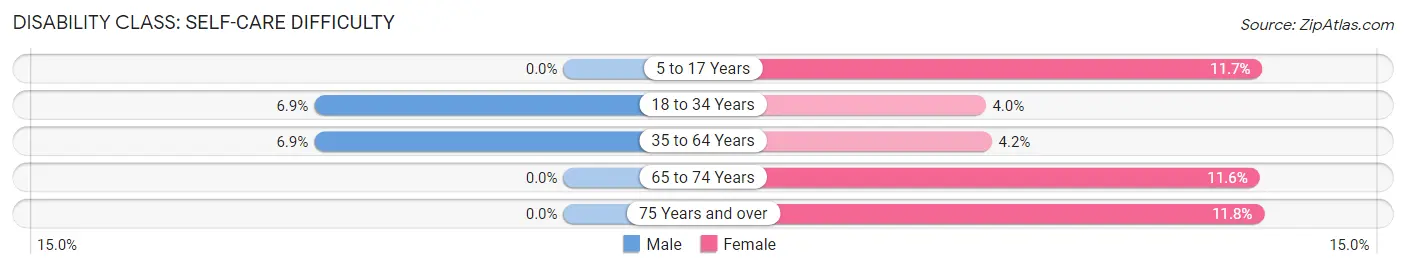
| Age Bracket | Male | Female |
| 5 to 17 Years | 0 (0.0%) | 13 (11.7%) |
| 18 to 34 Years | 5 (6.9%) | 2 (4.0%) |
| 35 to 64 Years | 10 (6.9%) | 4 (4.2%) |
| 65 to 74 Years | 0 (0.0%) | 5 (11.6%) |
| 75 Years and over | 0 (0.0%) | 2 (11.8%) |
Technology Access in What Cheer
Computing Device Access in What Cheer
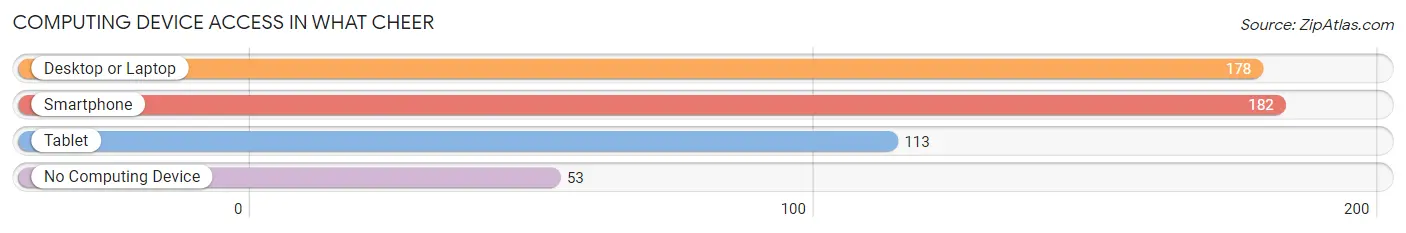
| Device Type | # Households | % Households |
| Desktop or Laptop | 178 | 67.9% |
| Smartphone | 182 | 69.5% |
| Tablet | 113 | 43.1% |
| No Computing Device | 53 | 20.2% |
| Total | 262 | 100.0% |
Internet Access in What Cheer
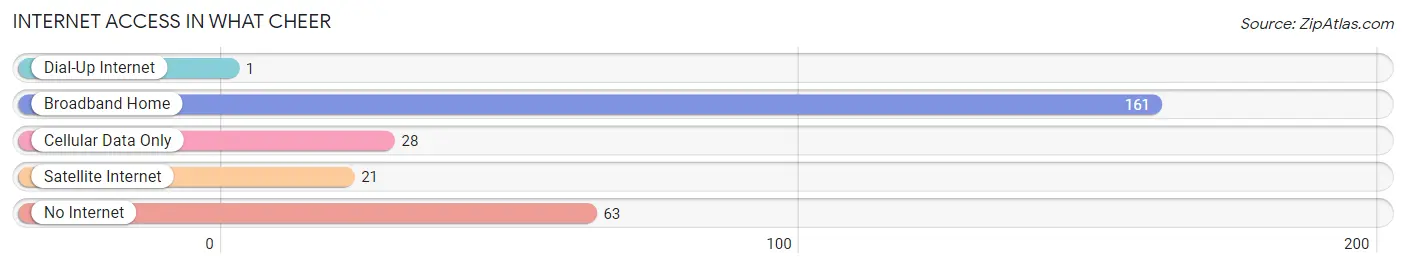
| Internet Type | # Households | % Households |
| Dial-Up Internet | 1 | 0.4% |
| Broadband Home | 161 | 61.5% |
| Cellular Data Only | 28 | 10.7% |
| Satellite Internet | 21 | 8.0% |
| No Internet | 63 | 24.0% |
| Total | 262 | 100.0% |
What Cheer Summary
Cheer, Iowa is a small town located in Keokuk County, Iowa. It is situated on the banks of the Iowa River and is home to a population of just over 500 people. The town was founded in 1854 and has a rich history of farming, industry, and small-town living.
Geography
Cheer is located in the southeastern corner of Keokuk County, Iowa, and is situated on the banks of the Iowa River. The town is located at an elevation of 845 feet above sea level and is surrounded by rolling hills and farmland. The town is located approximately 25 miles from the state capital of Des Moines and is within a two-hour drive of several major cities, including Cedar Rapids, Iowa City, and Davenport.
Economy
Cheer’s economy is largely based on agriculture and small businesses. The town is home to several small businesses, including a grocery store, a hardware store, a restaurant, and a gas station. The town also has a few small manufacturing businesses, including a furniture factory and a machine shop. The town is also home to a few farms, which produce corn, soybeans, and hay.
Demographics
As of the 2010 census, Cheer had a population of 514 people. The population is predominantly white, with a small percentage of African Americans, Hispanics, and Native Americans. The median household income in Cheer is $41,250, and the median age is 44. The town has a high rate of homeownership, with nearly 80% of the population owning their own homes.
History
Cheer was founded in 1854 by a group of settlers from Ohio. The town was originally named “Cheerful Valley”, but the name was later shortened to “Cheer”. The town was originally a farming community, but it soon developed into a small industrial center. In the late 19th century, the town was home to several factories, including a furniture factory, a machine shop, and a brickyard.
The town experienced a period of growth in the early 20th century, but the Great Depression caused the town to decline. The town’s population decreased from a peak of over 1,000 people in the 1920s to just over 500 people in the 2000s. Despite this decline, the town has managed to maintain its small-town charm and is still home to several small businesses and farms.
Conclusion
Cheer, Iowa is a small town located in Keokuk County, Iowa. It is situated on the banks of the Iowa River and is home to a population of just over 500 people. The town was founded in 1854 and has a rich history of farming, industry, and small-town living. The town’s economy is largely based on agriculture and small businesses, and the population is predominantly white. Despite its small size, Cheer has managed to maintain its small-town charm and is still home to several small businesses and farms.
Common Questions
What is Per Capita Income in What Cheer?
Per Capita income in What Cheer is $23,933.
What is the Median Family Income in What Cheer?
Median Family Income in What Cheer is $60,313.
What is the Median Household income in What Cheer?
Median Household Income in What Cheer is $45,500.
What is Income or Wage Gap in What Cheer?
Income or Wage Gap in What Cheer is 24.3%.
Women in What Cheer earn 75.7 cents for every dollar earned by a man.
What is Inequality or Gini Index in What Cheer?
Inequality or Gini Index in What Cheer is 0.45.
What is the Total Population of What Cheer?
Total Population of What Cheer is 724.
What is the Total Male Population of What Cheer?
Total Male Population of What Cheer is 399.
What is the Total Female Population of What Cheer?
Total Female Population of What Cheer is 325.
What is the Ratio of Males per 100 Females in What Cheer?
There are 122.77 Males per 100 Females in What Cheer.
What is the Ratio of Females per 100 Males in What Cheer?
There are 81.45 Females per 100 Males in What Cheer.
What is the Median Population Age in What Cheer?
Median Population Age in What Cheer is 34.8 Years.
What is the Average Family Size in What Cheer
Average Family Size in What Cheer is 3.4 People.
What is the Average Household Size in What Cheer
Average Household Size in What Cheer is 2.8 People.
How Large is the Labor Force in What Cheer?
There are 294 People in the Labor Forcein in What Cheer.
What is the Percentage of People in the Labor Force in What Cheer?
57.1% of People are in the Labor Force in What Cheer.
What is the Unemployment Rate in What Cheer?
Unemployment Rate in What Cheer is 9.9%.