Cherokee, IA Map & Demographics
Cherokee Map
Cherokee Overview
$31,292
PER CAPITA INCOME
$87,396
AVG FAMILY INCOME
$51,651
AVG HOUSEHOLD INCOME
39.0%
WAGE / INCOME GAP [ % ]
61.0¢/ $1
WAGE / INCOME GAP [ $ ]
0.43
INEQUALITY / GINI INDEX
5,154
TOTAL POPULATION
2,542
MALE POPULATION
2,612
FEMALE POPULATION
97.32
MALES / 100 FEMALES
102.75
FEMALES / 100 MALES
45.2
MEDIAN AGE
2.8
AVG FAMILY SIZE
2.0
AVG HOUSEHOLD SIZE
2,618
LABOR FORCE [ PEOPLE ]
62.1%
PERCENT IN LABOR FORCE
3.7%
UNEMPLOYMENT RATE
Cherokee Zip Codes
Cherokee Area Codes
Income in Cherokee
Income Overview in Cherokee
Per Capita Income in Cherokee is $31,292, while median incomes of families and households are $87,396 and $51,651 respectively.
| Characteristic | Number | Measure |
| Per Capita Income | 5,154 | $31,292 |
| Median Family Income | 1,206 | $87,396 |
| Mean Family Income | 1,206 | $93,379 |
| Median Household Income | 2,355 | $51,651 |
| Mean Household Income | 2,355 | $67,834 |
| Income Deficit | 1,206 | $0 |
| Wage / Income Gap (%) | 5,154 | 39.03% |
| Wage / Income Gap ($) | 5,154 | 60.97¢ per $1 |
| Gini / Inequality Index | 5,154 | 0.43 |
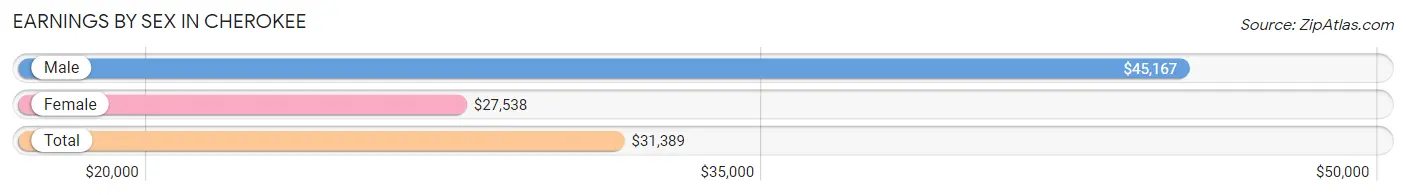
Earnings by Sex in Cherokee
Average Earnings in Cherokee are $31,389, $45,167 for men and $27,538 for women, a difference of 39.0%.
| Sex | Number | Average Earnings |
| Male | 1,374 (50.4%) | $45,167 |
| Female | 1,352 (49.6%) | $27,538 |
| Total | 2,726 (100.0%) | $31,389 |
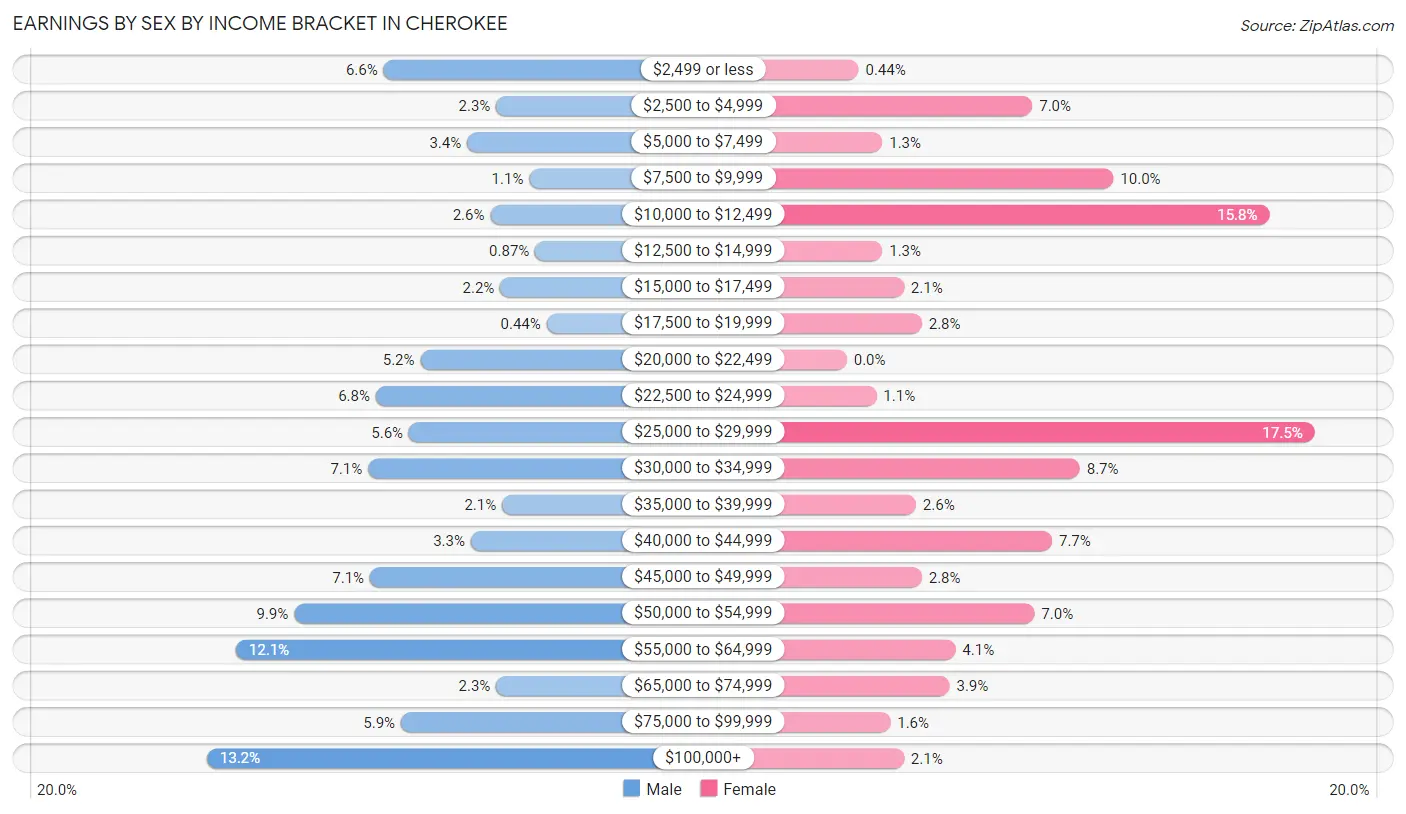
Earnings by Sex by Income Bracket in Cherokee
The most common earnings brackets in Cherokee are $100,000+ for men (181 | 13.2%) and $25,000 to $29,999 for women (237 | 17.5%).
| Income | Male | Female |
| $2,499 or less | 90 (6.6%) | 6 (0.4%) |
| $2,500 to $4,999 | 32 (2.3%) | 94 (7.0%) |
| $5,000 to $7,499 | 47 (3.4%) | 18 (1.3%) |
| $7,500 to $9,999 | 15 (1.1%) | 135 (10.0%) |
| $10,000 to $12,499 | 35 (2.5%) | 214 (15.8%) |
| $12,500 to $14,999 | 12 (0.9%) | 18 (1.3%) |
| $15,000 to $17,499 | 30 (2.2%) | 29 (2.1%) |
| $17,500 to $19,999 | 6 (0.4%) | 38 (2.8%) |
| $20,000 to $22,499 | 71 (5.2%) | 0 (0.0%) |
| $22,500 to $24,999 | 94 (6.8%) | 15 (1.1%) |
| $25,000 to $29,999 | 77 (5.6%) | 237 (17.5%) |
| $30,000 to $34,999 | 98 (7.1%) | 118 (8.7%) |
| $35,000 to $39,999 | 29 (2.1%) | 35 (2.6%) |
| $40,000 to $44,999 | 45 (3.3%) | 104 (7.7%) |
| $45,000 to $49,999 | 97 (7.1%) | 38 (2.8%) |
| $50,000 to $54,999 | 136 (9.9%) | 95 (7.0%) |
| $55,000 to $64,999 | 166 (12.1%) | 55 (4.1%) |
| $65,000 to $74,999 | 32 (2.3%) | 52 (3.8%) |
| $75,000 to $99,999 | 81 (5.9%) | 22 (1.6%) |
| $100,000+ | 181 (13.2%) | 29 (2.1%) |
| Total | 1,374 (100.0%) | 1,352 (100.0%) |
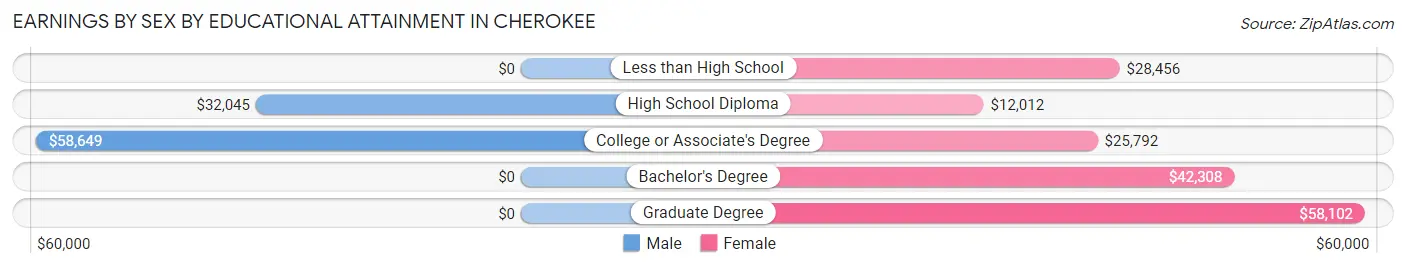
Earnings by Sex by Educational Attainment in Cherokee
Average earnings in Cherokee are $47,389 for men and $27,856 for women, a difference of 41.2%. Men with an educational attainment of college or associate's degree enjoy the highest average annual earnings of $58,649, while those with high school diploma education earn the least with $32,045. Women with an educational attainment of graduate degree earn the most with the average annual earnings of $58,102, while those with high school diploma education have the smallest earnings of $12,012.
| Educational Attainment | Male Income | Female Income |
| Less than High School | - | - |
| High School Diploma | $32,045 | $12,012 |
| College or Associate's Degree | $58,649 | $25,792 |
| Bachelor's Degree | - | - |
| Graduate Degree | - | - |
| Total | $47,389 | $27,856 |
Family Income in Cherokee
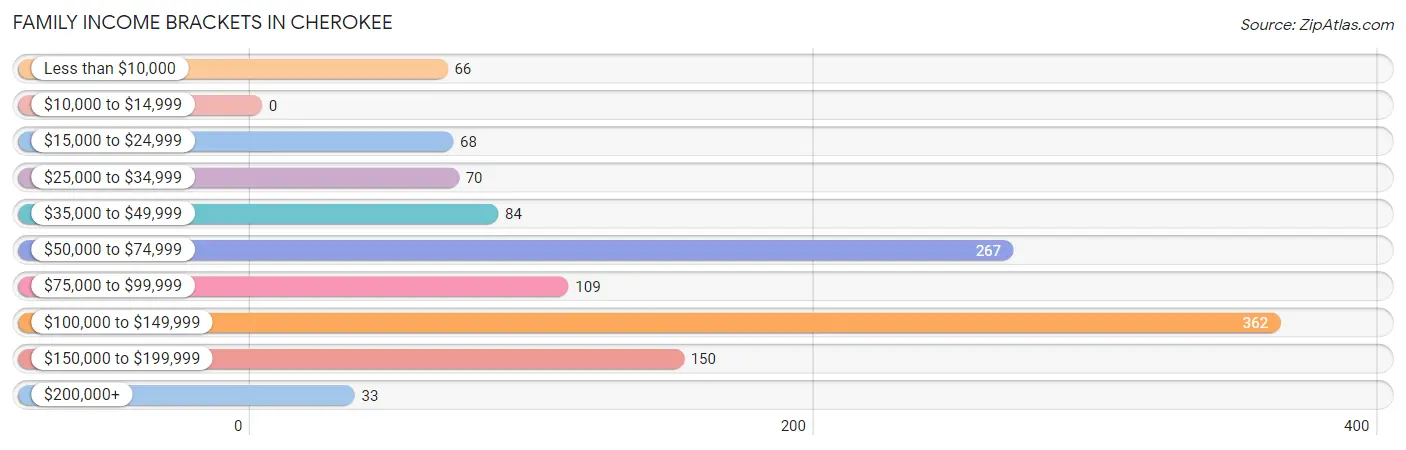
Family Income Brackets in Cherokee
According to the Cherokee family income data, there are 362 families falling into the $100,000 to $149,999 income range, which is the most common income bracket and makes up 30.0% of all families.
| Income Bracket | # Families | % Families |
| Less than $10,000 | 66 | 5.5% |
| $10,000 to $14,999 | 0 | 0.0% |
| $15,000 to $24,999 | 68 | 5.6% |
| $25,000 to $34,999 | 70 | 5.8% |
| $35,000 to $49,999 | 84 | 7.0% |
| $50,000 to $74,999 | 267 | 22.1% |
| $75,000 to $99,999 | 109 | 9.0% |
| $100,000 to $149,999 | 362 | 30.0% |
| $150,000 to $199,999 | 150 | 12.4% |
| $200,000+ | 33 | 2.7% |
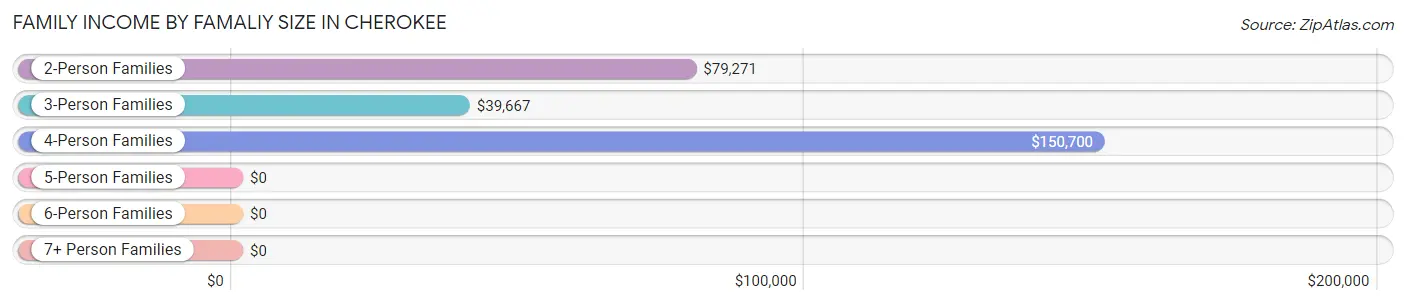
Family Income by Famaliy Size in Cherokee
4-person families (206 | 17.1%) account for the highest median family income in Cherokee with $150,700 per family, while 2-person families (605 | 50.2%) have the highest median income of $39,636 per family member.
| Income Bracket | # Families | Median Income |
| 2-Person Families | 605 (50.2%) | $79,271 |
| 3-Person Families | 300 (24.9%) | $39,667 |
| 4-Person Families | 206 (17.1%) | $150,700 |
| 5-Person Families | 49 (4.1%) | $0 |
| 6-Person Families | 27 (2.2%) | $0 |
| 7+ Person Families | 19 (1.6%) | $0 |
| Total | 1,206 (100.0%) | $87,396 |
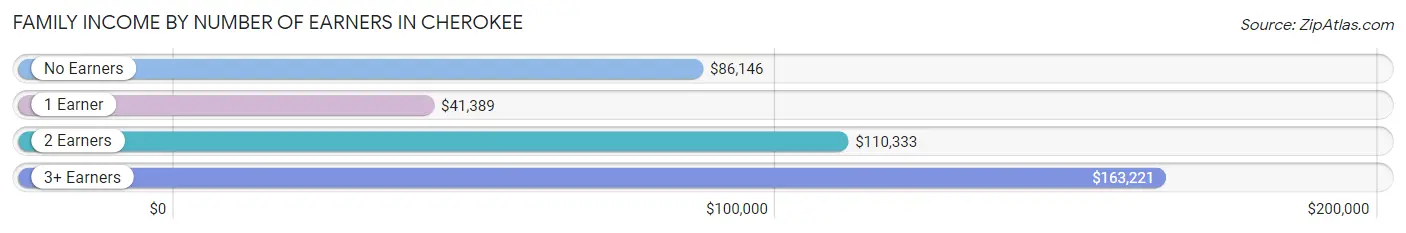
Family Income by Number of Earners in Cherokee
The median family income in Cherokee is $87,396, with families comprising 3+ earners (121) having the highest median family income of $163,221, while families with 1 earner (382) have the lowest median family income of $41,389, accounting for 10.0% and 31.7% of families, respectively.
| Number of Earners | # Families | Median Income |
| No Earners | 137 (11.4%) | $86,146 |
| 1 Earner | 382 (31.7%) | $41,389 |
| 2 Earners | 566 (46.9%) | $110,333 |
| 3+ Earners | 121 (10.0%) | $163,221 |
| Total | 1,206 (100.0%) | $87,396 |
Household Income in Cherokee
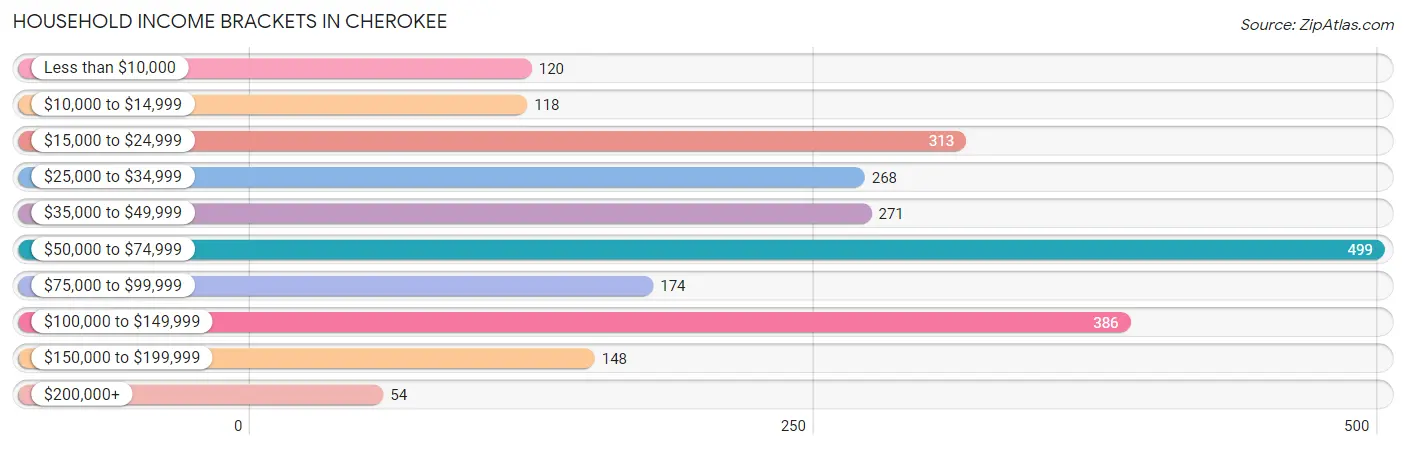
Household Income Brackets in Cherokee
With 499 households falling in the category, the $50,000 to $74,999 income range is the most frequent in Cherokee, accounting for 21.2% of all households. In contrast, only 54 households (2.3%) fall into the $200,000+ income bracket, making it the least populous group.
| Income Bracket | # Households | % Households |
| Less than $10,000 | 120 | 5.1% |
| $10,000 to $14,999 | 118 | 5.0% |
| $15,000 to $24,999 | 313 | 13.3% |
| $25,000 to $34,999 | 268 | 11.4% |
| $35,000 to $49,999 | 271 | 11.5% |
| $50,000 to $74,999 | 499 | 21.2% |
| $75,000 to $99,999 | 174 | 7.4% |
| $100,000 to $149,999 | 386 | 16.4% |
| $150,000 to $199,999 | 148 | 6.3% |
| $200,000+ | 54 | 2.3% |
Household Income by Householder Age in Cherokee
The median household income in Cherokee is $51,651, with the highest median household income of $80,313 found in the 25 to 44 years age bracket for the primary householder. A total of 595 households (25.3%) fall into this category. Meanwhile, the 65+ years age bracket for the primary householder has the lowest median household income of $43,599, with 855 households (36.3%) in this group.
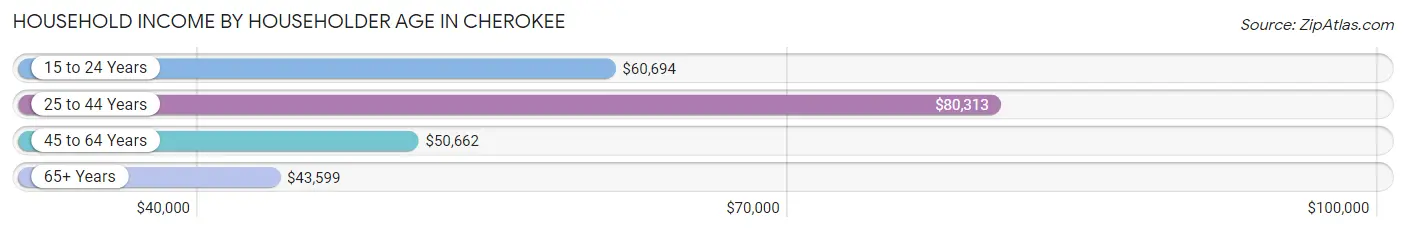
| Income Bracket | # Households | Median Income |
| 15 to 24 Years | 80 (3.4%) | $60,694 |
| 25 to 44 Years | 595 (25.3%) | $80,313 |
| 45 to 64 Years | 825 (35.0%) | $50,662 |
| 65+ Years | 855 (36.3%) | $43,599 |
| Total | 2,355 (100.0%) | $51,651 |
Poverty in Cherokee
Income Below Poverty by Sex and Age in Cherokee
With 16.3% poverty level for males and 28.0% for females among the residents of Cherokee, 6 to 11 year old males and 16 and 17 year old females are the most vulnerable to poverty, with 144 males (43.2%) and 79 females (71.8%) in their respective age groups living below the poverty level.
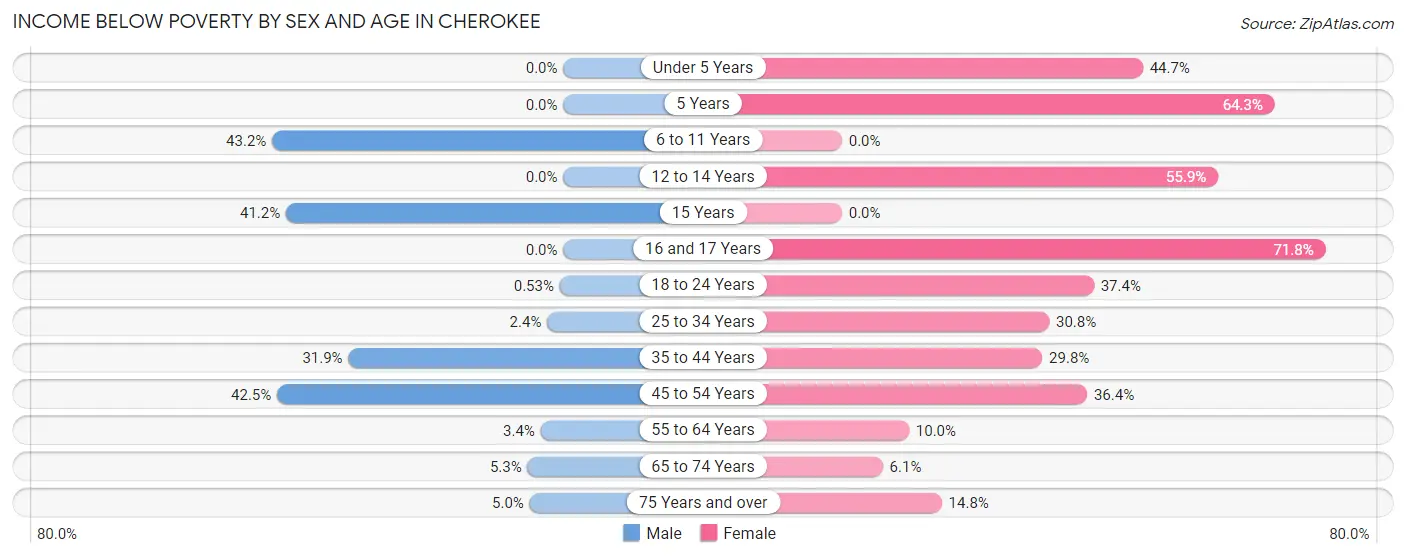
| Age Bracket | Male | Female |
| Under 5 Years | 0 (0.0%) | 42 (44.7%) |
| 5 Years | 0 (0.0%) | 27 (64.3%) |
| 6 to 11 Years | 144 (43.2%) | 0 (0.0%) |
| 12 to 14 Years | 0 (0.0%) | 114 (55.9%) |
| 15 Years | 7 (41.2%) | 0 (0.0%) |
| 16 and 17 Years | 0 (0.0%) | 79 (71.8%) |
| 18 to 24 Years | 1 (0.5%) | 55 (37.4%) |
| 25 to 34 Years | 6 (2.4%) | 76 (30.8%) |
| 35 to 44 Years | 90 (31.9%) | 94 (29.7%) |
| 45 to 54 Years | 102 (42.5%) | 130 (36.4%) |
| 55 to 64 Years | 14 (3.4%) | 28 (10.0%) |
| 65 to 74 Years | 15 (5.3%) | 21 (6.1%) |
| 75 Years and over | 8 (5.0%) | 47 (14.8%) |
| Total | 387 (16.3%) | 713 (28.0%) |
Income Above Poverty by Sex and Age in Cherokee
According to the poverty statistics in Cherokee, males aged under 5 years and females aged 6 to 11 years are the age groups that are most secure financially, with 100.0% of males and 100.0% of females in these age groups living above the poverty line.
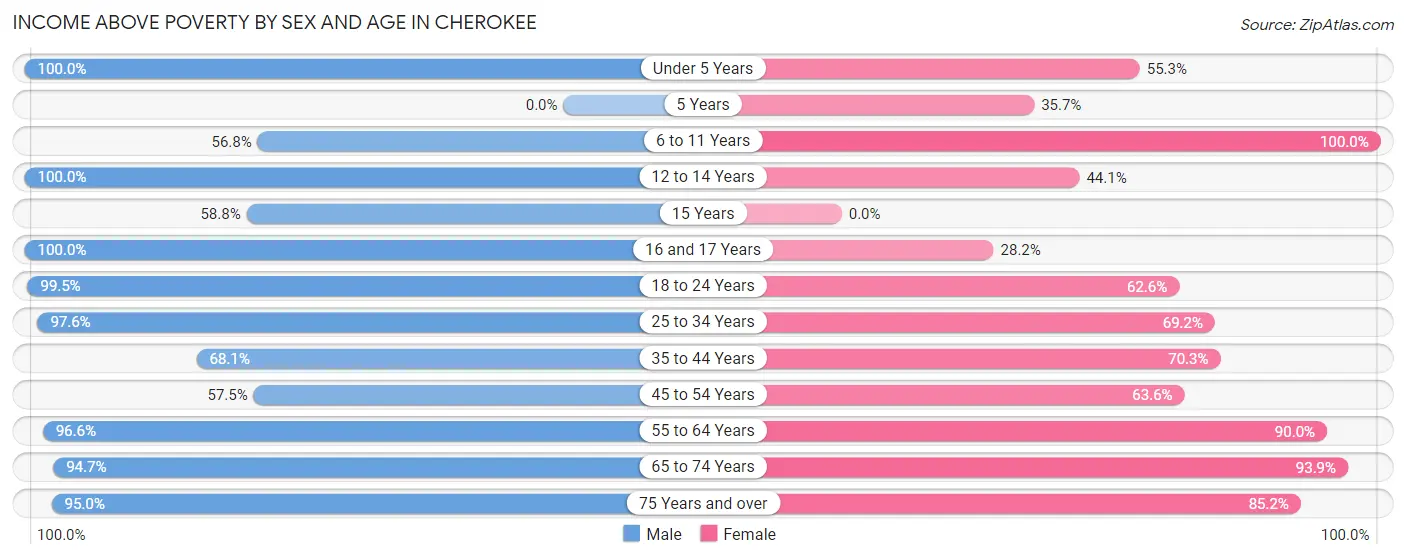
| Age Bracket | Male | Female |
| Under 5 Years | 137 (100.0%) | 52 (55.3%) |
| 5 Years | 0 (0.0%) | 15 (35.7%) |
| 6 to 11 Years | 189 (56.8%) | 84 (100.0%) |
| 12 to 14 Years | 11 (100.0%) | 90 (44.1%) |
| 15 Years | 10 (58.8%) | 0 (0.0%) |
| 16 and 17 Years | 53 (100.0%) | 31 (28.2%) |
| 18 to 24 Years | 187 (99.5%) | 92 (62.6%) |
| 25 to 34 Years | 245 (97.6%) | 171 (69.2%) |
| 35 to 44 Years | 192 (68.1%) | 222 (70.3%) |
| 45 to 54 Years | 138 (57.5%) | 227 (63.6%) |
| 55 to 64 Years | 402 (96.6%) | 253 (90.0%) |
| 65 to 74 Years | 267 (94.7%) | 325 (93.9%) |
| 75 Years and over | 152 (95.0%) | 270 (85.2%) |
| Total | 1,983 (83.7%) | 1,832 (72.0%) |
Income Below Poverty Among Married-Couple Families in Cherokee
The poverty statistics for married-couple families in Cherokee show that 3.8% or 36 of the total 939 families live below the poverty line. Families with 3 or 4 children have the highest poverty rate of 57.1%, comprising of 36 families. On the other hand, families with no children have the lowest poverty rate of 0.0%, which includes 0 families.
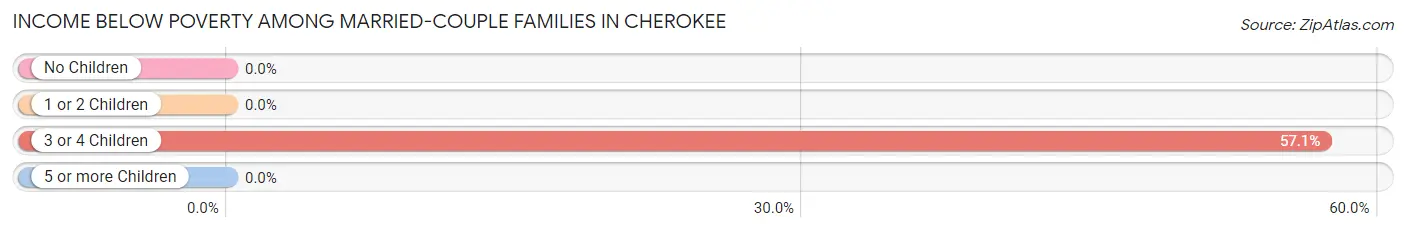
| Children | Above Poverty | Below Poverty |
| No Children | 557 (100.0%) | 0 (0.0%) |
| 1 or 2 Children | 300 (100.0%) | 0 (0.0%) |
| 3 or 4 Children | 27 (42.9%) | 36 (57.1%) |
| 5 or more Children | 19 (100.0%) | 0 (0.0%) |
| Total | 903 (96.2%) | 36 (3.8%) |
Income Below Poverty Among Single-Parent Households in Cherokee
According to the poverty data in Cherokee, 17.3% or 9 single-father households and 60.5% or 130 single-mother households are living below the poverty line. Among single-father households, those with 1 or 2 children have the highest poverty rate, with 9 households (22.5%) experiencing poverty. Likewise, among single-mother households, those with 1 or 2 children have the highest poverty rate, with 130 households (65.7%) falling below the poverty line.
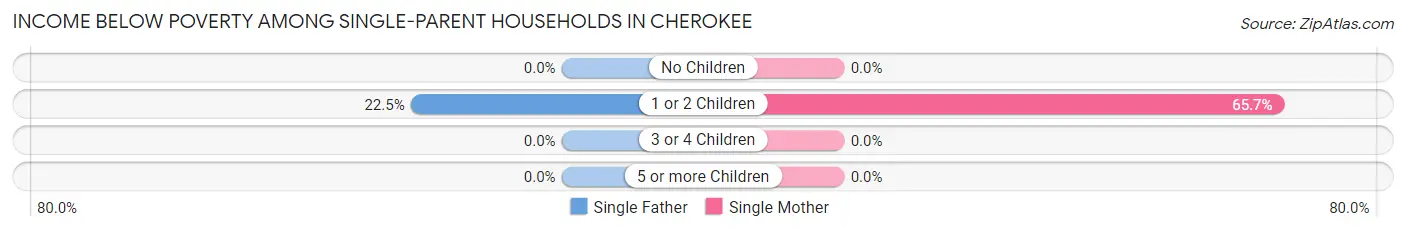
| Children | Single Father | Single Mother |
| No Children | 0 (0.0%) | 0 (0.0%) |
| 1 or 2 Children | 9 (22.5%) | 130 (65.7%) |
| 3 or 4 Children | 0 (0.0%) | 0 (0.0%) |
| 5 or more Children | 0 (0.0%) | 0 (0.0%) |
| Total | 9 (17.3%) | 130 (60.5%) |
Income Below Poverty Among Married-Couple vs Single-Parent Households in Cherokee
The poverty data for Cherokee shows that 36 of the married-couple family households (3.8%) and 139 of the single-parent households (52.1%) are living below the poverty level. Within the married-couple family households, those with 3 or 4 children have the highest poverty rate, with 36 households (57.1%) falling below the poverty line. Among the single-parent households, those with 1 or 2 children have the highest poverty rate, with 139 household (58.4%) living below poverty.
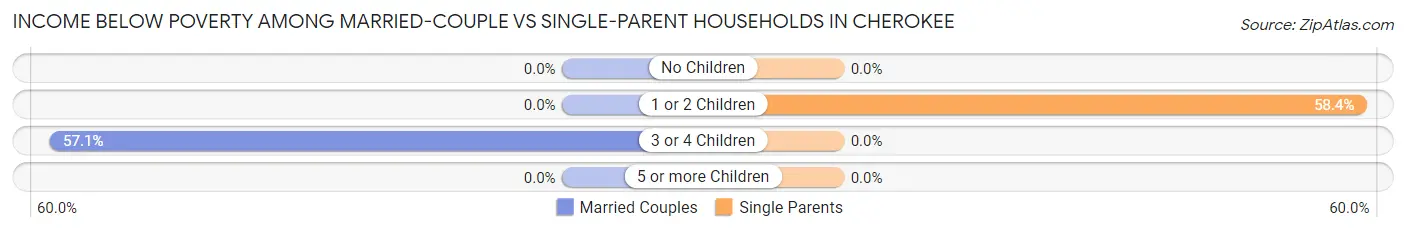
| Children | Married-Couple Families | Single-Parent Households |
| No Children | 0 (0.0%) | 0 (0.0%) |
| 1 or 2 Children | 0 (0.0%) | 139 (58.4%) |
| 3 or 4 Children | 36 (57.1%) | 0 (0.0%) |
| 5 or more Children | 0 (0.0%) | 0 (0.0%) |
| Total | 36 (3.8%) | 139 (52.1%) |
Race in Cherokee
The most populous races in Cherokee are White / Caucasian (4,873 | 94.6%), Two or more Races (218 | 4.2%), and Hispanic or Latino (78 | 1.5%).
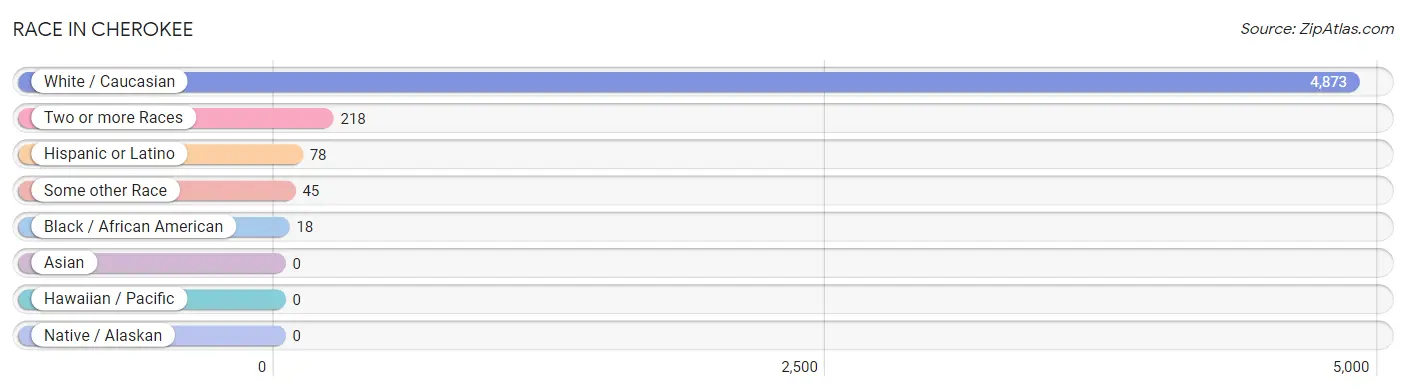
| Race | # Population | % Population |
| Asian | 0 | 0.0% |
| Black / African American | 18 | 0.4% |
| Hawaiian / Pacific | 0 | 0.0% |
| Hispanic or Latino | 78 | 1.5% |
| Native / Alaskan | 0 | 0.0% |
| White / Caucasian | 4,873 | 94.6% |
| Two or more Races | 218 | 4.2% |
| Some other Race | 45 | 0.9% |
| Total | 5,154 | 100.0% |
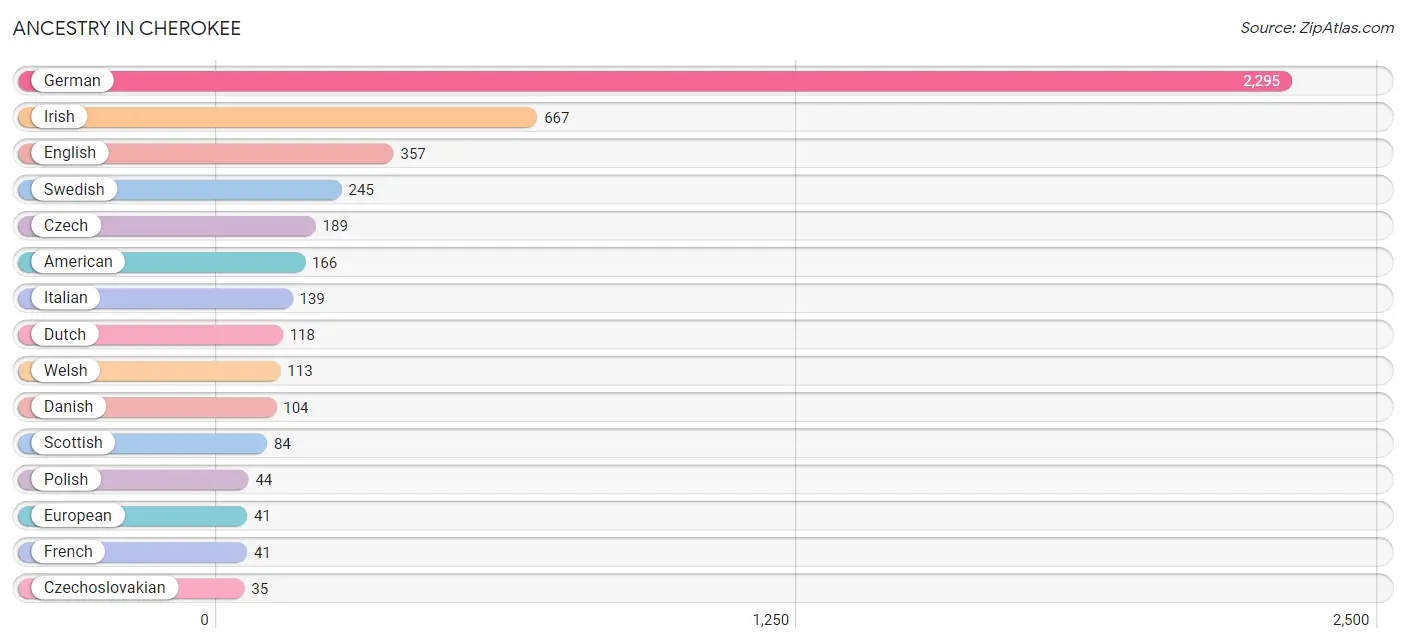
Ancestry in Cherokee
The most populous ancestries reported in Cherokee are German (2,295 | 44.5%), Irish (667 | 12.9%), English (357 | 6.9%), Swedish (245 | 4.8%), and Czech (189 | 3.7%), together accounting for 72.8% of all Cherokee residents.
| Ancestry | # Population | % Population |
| African | 9 | 0.2% |
| American | 166 | 3.2% |
| Bhutanese | 25 | 0.5% |
| British | 17 | 0.3% |
| Cherokee | 4 | 0.1% |
| Chickasaw | 6 | 0.1% |
| Chippewa | 9 | 0.2% |
| Cuban | 1 | 0.0% |
| Czech | 189 | 3.7% |
| Czechoslovakian | 35 | 0.7% |
| Danish | 104 | 2.0% |
| Dutch | 118 | 2.3% |
| English | 357 | 6.9% |
| European | 41 | 0.8% |
| French | 41 | 0.8% |
| German | 2,295 | 44.5% |
| Irish | 667 | 12.9% |
| Italian | 139 | 2.7% |
| Luxembourger | 20 | 0.4% |
| Mexican | 6 | 0.1% |
| Norwegian | 24 | 0.5% |
| Polish | 44 | 0.9% |
| Russian | 14 | 0.3% |
| Scandinavian | 12 | 0.2% |
| Scottish | 84 | 1.6% |
| Subsaharan African | 9 | 0.2% |
| Swedish | 245 | 4.8% |
| Welsh | 113 | 2.2% | View All 28 Rows |
Immigrants in Cherokee
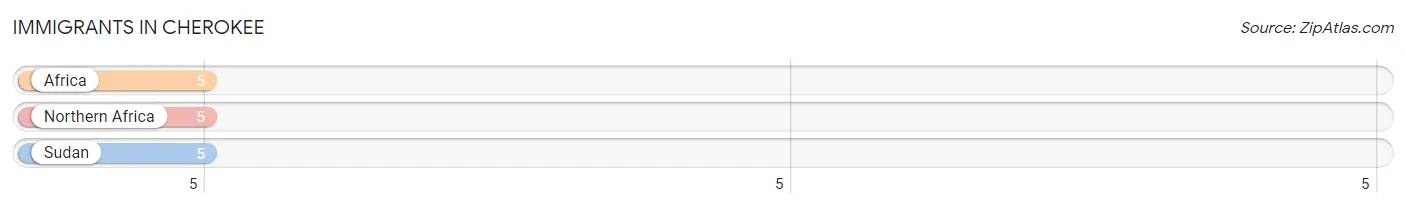
The most numerous immigrant groups reported in Cherokee came from Africa (5 | 0.1%), Northern Africa (5 | 0.1%), and Sudan (5 | 0.1%), together accounting for 0.3% of all Cherokee residents.
| Immigration Origin | # Population | % Population |
| Africa | 5 | 0.1% |
| Northern Africa | 5 | 0.1% |
| Sudan | 5 | 0.1% | View All 3 Rows |
Sex and Age in Cherokee
Sex and Age in Cherokee
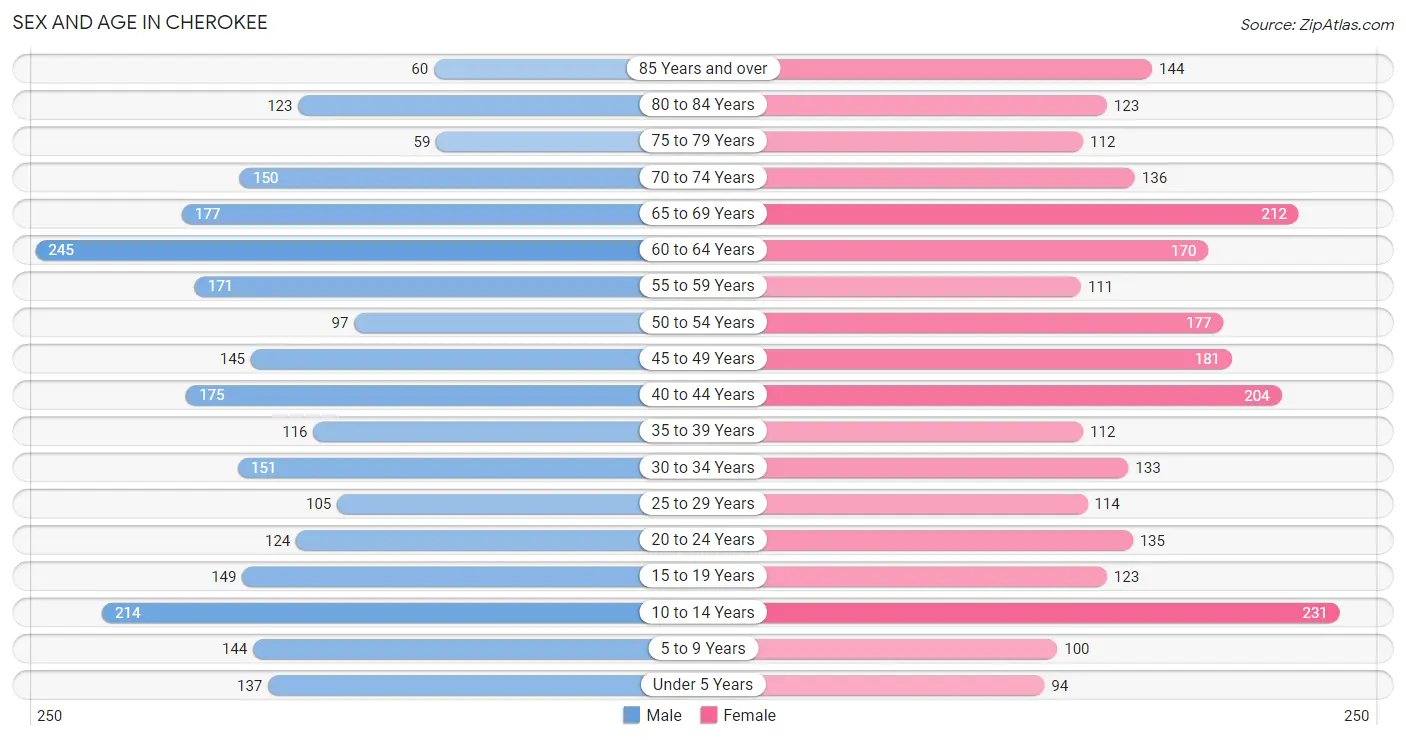
The most populous age groups in Cherokee are 60 to 64 Years (245 | 9.6%) for men and 10 to 14 Years (231 | 8.8%) for women.
| Age Bracket | Male | Female |
| Under 5 Years | 137 (5.4%) | 94 (3.6%) |
| 5 to 9 Years | 144 (5.7%) | 100 (3.8%) |
| 10 to 14 Years | 214 (8.4%) | 231 (8.8%) |
| 15 to 19 Years | 149 (5.9%) | 123 (4.7%) |
| 20 to 24 Years | 124 (4.9%) | 135 (5.2%) |
| 25 to 29 Years | 105 (4.1%) | 114 (4.4%) |
| 30 to 34 Years | 151 (5.9%) | 133 (5.1%) |
| 35 to 39 Years | 116 (4.6%) | 112 (4.3%) |
| 40 to 44 Years | 175 (6.9%) | 204 (7.8%) |
| 45 to 49 Years | 145 (5.7%) | 181 (6.9%) |
| 50 to 54 Years | 97 (3.8%) | 177 (6.8%) |
| 55 to 59 Years | 171 (6.7%) | 111 (4.3%) |
| 60 to 64 Years | 245 (9.6%) | 170 (6.5%) |
| 65 to 69 Years | 177 (7.0%) | 212 (8.1%) |
| 70 to 74 Years | 150 (5.9%) | 136 (5.2%) |
| 75 to 79 Years | 59 (2.3%) | 112 (4.3%) |
| 80 to 84 Years | 123 (4.8%) | 123 (4.7%) |
| 85 Years and over | 60 (2.4%) | 144 (5.5%) |
| Total | 2,542 (100.0%) | 2,612 (100.0%) |
Families and Households in Cherokee
Median Family Size in Cherokee
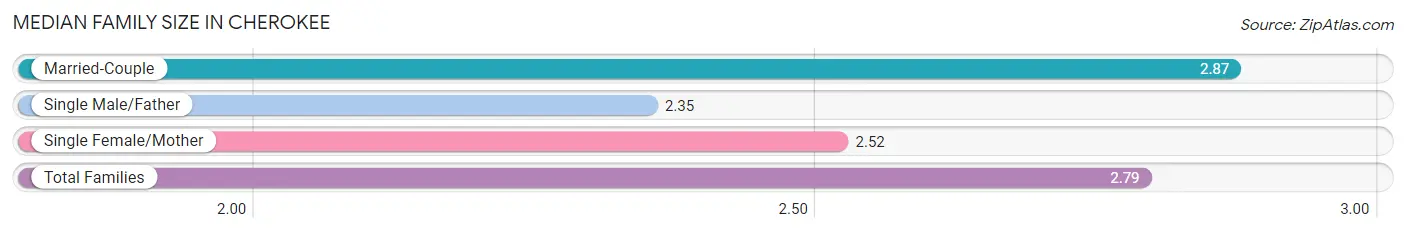
The median family size in Cherokee is 2.79 persons per family, with married-couple families (939 | 77.9%) accounting for the largest median family size of 2.87 persons per family. On the other hand, single male/father families (52 | 4.3%) represent the smallest median family size with 2.35 persons per family.
| Family Type | # Families | Family Size |
| Married-Couple | 939 (77.9%) | 2.87 |
| Single Male/Father | 52 (4.3%) | 2.35 |
| Single Female/Mother | 215 (17.8%) | 2.52 |
| Total Families | 1,206 (100.0%) | 2.79 |
Median Household Size in Cherokee
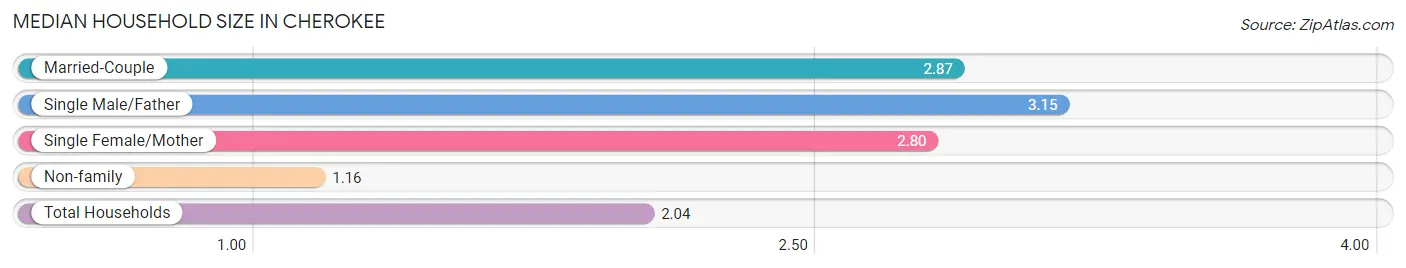
The median household size in Cherokee is 2.04 persons per household, with single male/father households (52 | 2.2%) accounting for the largest median household size of 3.15 persons per household. non-family households (1,149 | 48.8%) represent the smallest median household size with 1.16 persons per household.
| Household Type | # Households | Household Size |
| Married-Couple | 939 (39.9%) | 2.87 |
| Single Male/Father | 52 (2.2%) | 3.15 |
| Single Female/Mother | 215 (9.1%) | 2.80 |
| Non-family | 1,149 (48.8%) | 1.16 |
| Total Households | 2,355 (100.0%) | 2.04 |
Household Size by Marriage Status in Cherokee
Out of a total of 2,355 households in Cherokee, 1,206 (51.2%) are family households, while 1,149 (48.8%) are nonfamily households. The most numerous type of family households are 2-person households, comprising 591, and the most common type of nonfamily households are 1-person households, comprising 1,019.
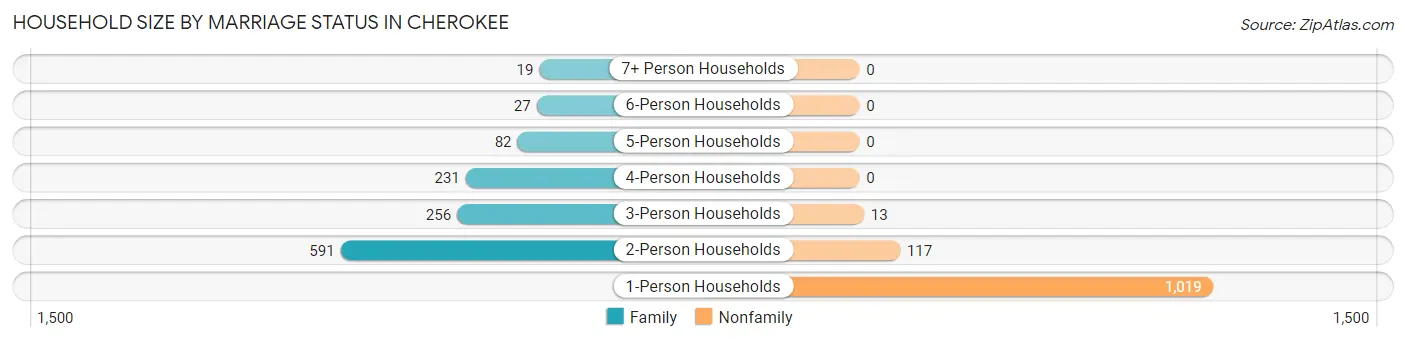
| Household Size | Family Households | Nonfamily Households |
| 1-Person Households | - | 1,019 (43.3%) |
| 2-Person Households | 591 (25.1%) | 117 (5.0%) |
| 3-Person Households | 256 (10.9%) | 13 (0.5%) |
| 4-Person Households | 231 (9.8%) | 0 (0.0%) |
| 5-Person Households | 82 (3.5%) | 0 (0.0%) |
| 6-Person Households | 27 (1.1%) | 0 (0.0%) |
| 7+ Person Households | 19 (0.8%) | 0 (0.0%) |
| Total | 1,206 (51.2%) | 1,149 (48.8%) |
Female Fertility in Cherokee
Fertility by Age in Cherokee
Average fertility rate in Cherokee is 164.0 births per 1,000 women. Women in the age bracket of 20 to 34 years have the highest fertility rate with 374.0 births per 1,000 women. Women in the age bracket of 20 to 34 years acount for 84.1% of all women with births.
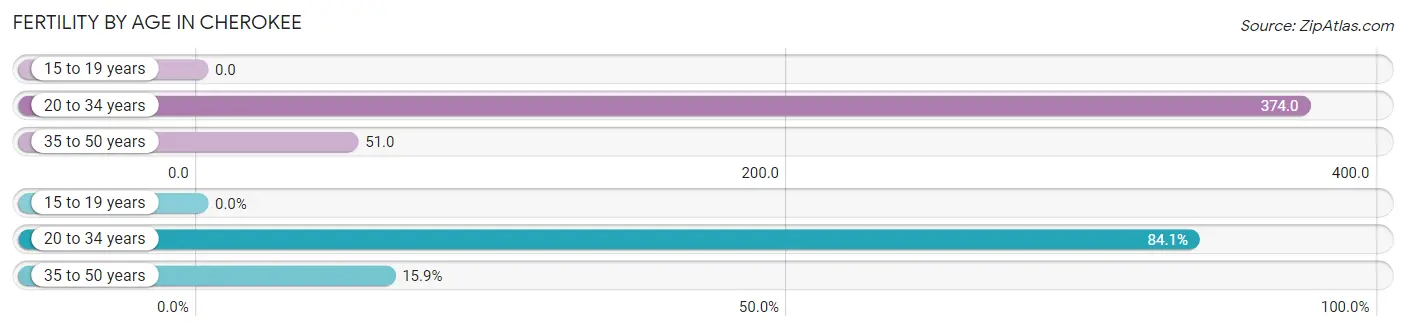
| Age Bracket | Women with Births | Births / 1,000 Women |
| 15 to 19 years | 0 (0.0%) | 0.0 |
| 20 to 34 years | 143 (84.1%) | 374.0 |
| 35 to 50 years | 27 (15.9%) | 51.0 |
| Total | 170 (100.0%) | 164.0 |
Fertility by Age by Marriage Status in Cherokee
28.8% of women with births (170) in Cherokee are married. The highest percentage of unmarried women with births falls into 20 to 34 years age bracket with 84.6% of them unmarried at the time of birth, while the lowest percentage of unmarried women with births belong to 35 to 50 years age bracket with 0.0% of them unmarried.
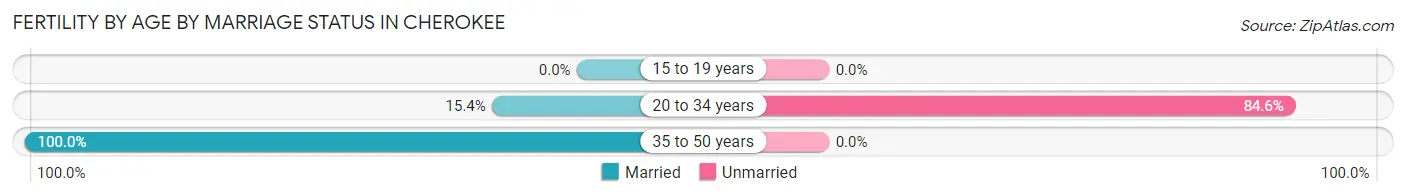
| Age Bracket | Married | Unmarried |
| 15 to 19 years | 0 (0.0%) | 0 (0.0%) |
| 20 to 34 years | 22 (15.4%) | 121 (84.6%) |
| 35 to 50 years | 27 (100.0%) | 0 (0.0%) |
| Total | 49 (28.8%) | 121 (71.2%) |
Fertility by Education in Cherokee
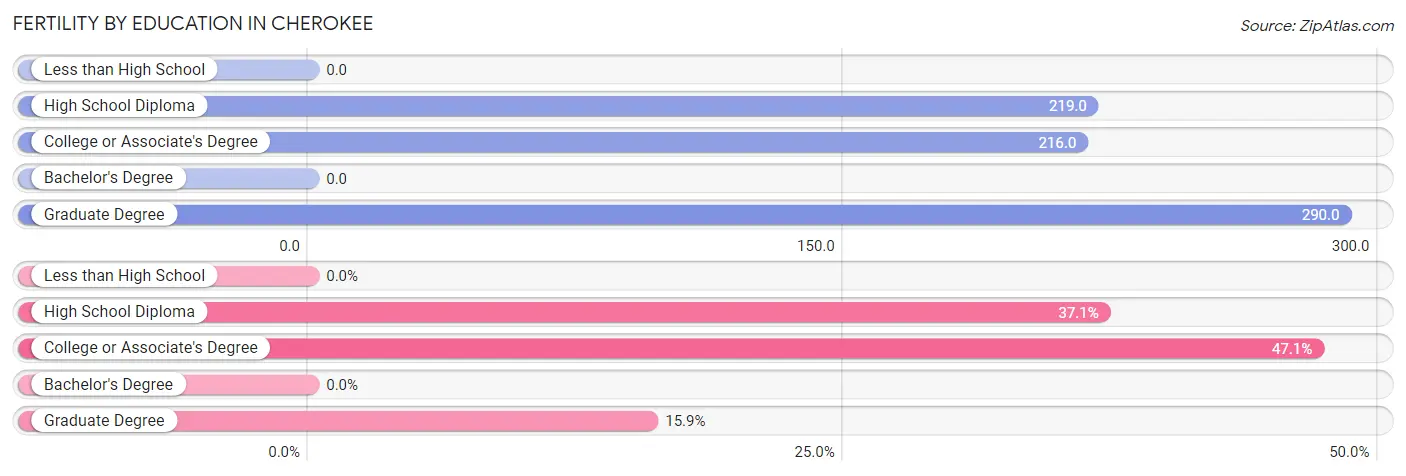
| Educational Attainment | Women with Births | Births / 1,000 Women |
| Less than High School | 0 (0.0%) | 0.0 |
| High School Diploma | 63 (37.1%) | 219.0 |
| College or Associate's Degree | 80 (47.1%) | 216.0 |
| Bachelor's Degree | 0 (0.0%) | 0.0 |
| Graduate Degree | 27 (15.9%) | 290.0 |
| Total | 170 (100.0%) | 164.0 |
Fertility by Education by Marriage Status in Cherokee
71.2% of women with births in Cherokee are unmarried. Women with the educational attainment of graduate degree are most likely to be married with 100.0% of them married at childbirth, while women with the educational attainment of high school diploma are least likely to be married with 100.0% of them unmarried at childbirth.
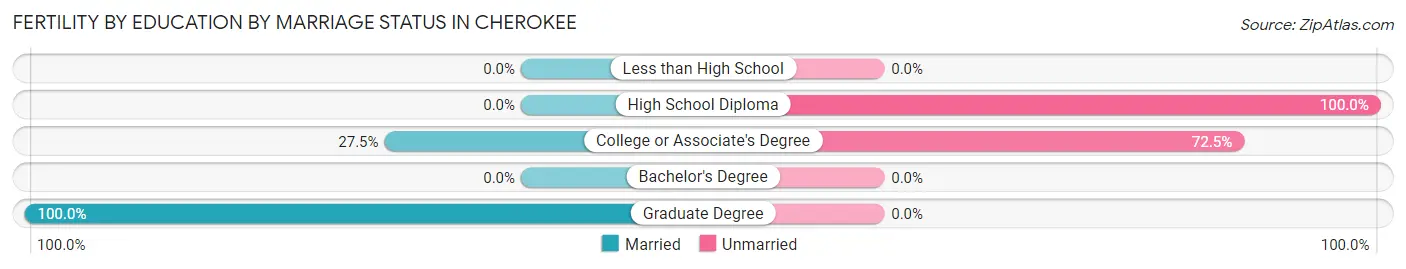
| Educational Attainment | Married | Unmarried |
| Less than High School | 0 (0.0%) | 0 (0.0%) |
| High School Diploma | 0 (0.0%) | 63 (100.0%) |
| College or Associate's Degree | 22 (27.5%) | 58 (72.5%) |
| Bachelor's Degree | 0 (0.0%) | 0 (0.0%) |
| Graduate Degree | 27 (100.0%) | 0 (0.0%) |
| Total | 49 (28.8%) | 121 (71.2%) |
Employment Characteristics in Cherokee
Employment by Class of Employer in Cherokee
Among the 2,461 employed individuals in Cherokee, private company employees (1,602 | 65.1%), local government employees (288 | 11.7%), and self-employed (not incorporated) (192 | 7.8%) make up the most common classes of employment.
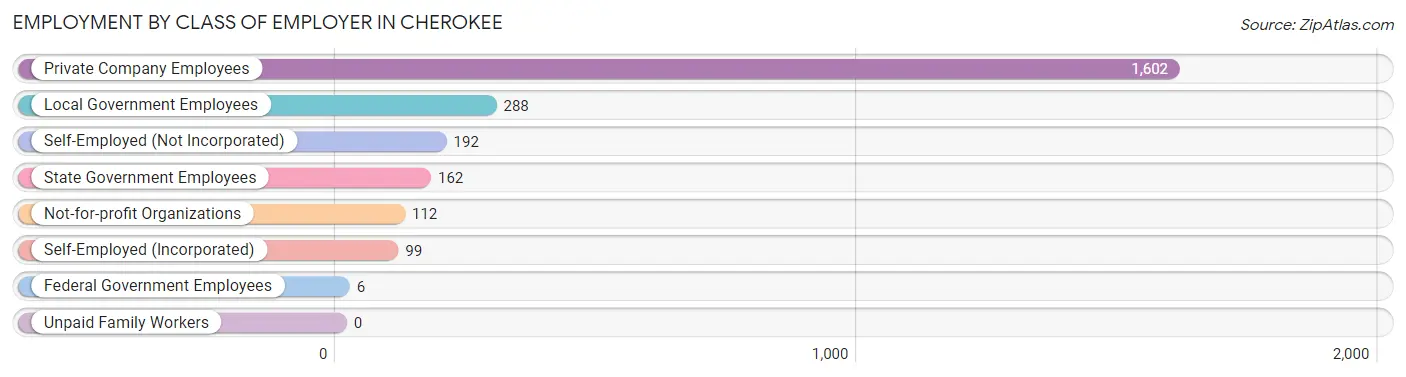
| Employer Class | # Employees | % Employees |
| Private Company Employees | 1,602 | 65.1% |
| Self-Employed (Incorporated) | 99 | 4.0% |
| Self-Employed (Not Incorporated) | 192 | 7.8% |
| Not-for-profit Organizations | 112 | 4.5% |
| Local Government Employees | 288 | 11.7% |
| State Government Employees | 162 | 6.6% |
| Federal Government Employees | 6 | 0.2% |
| Unpaid Family Workers | 0 | 0.0% |
| Total | 2,461 | 100.0% |
Employment Status by Age in Cherokee
According to the labor force statistics for Cherokee, out of the total population over 16 years of age (4,215), 62.1% or 2,618 individuals are in the labor force, with 3.7% or 97 of them unemployed. The age group with the highest labor force participation rate is 35 to 44 years, with 97.4% or 591 individuals in the labor force. Within the labor force, the 16 to 19 years age range has the highest percentage of unemployed individuals, with 19.2% or 14 of them being unemployed.
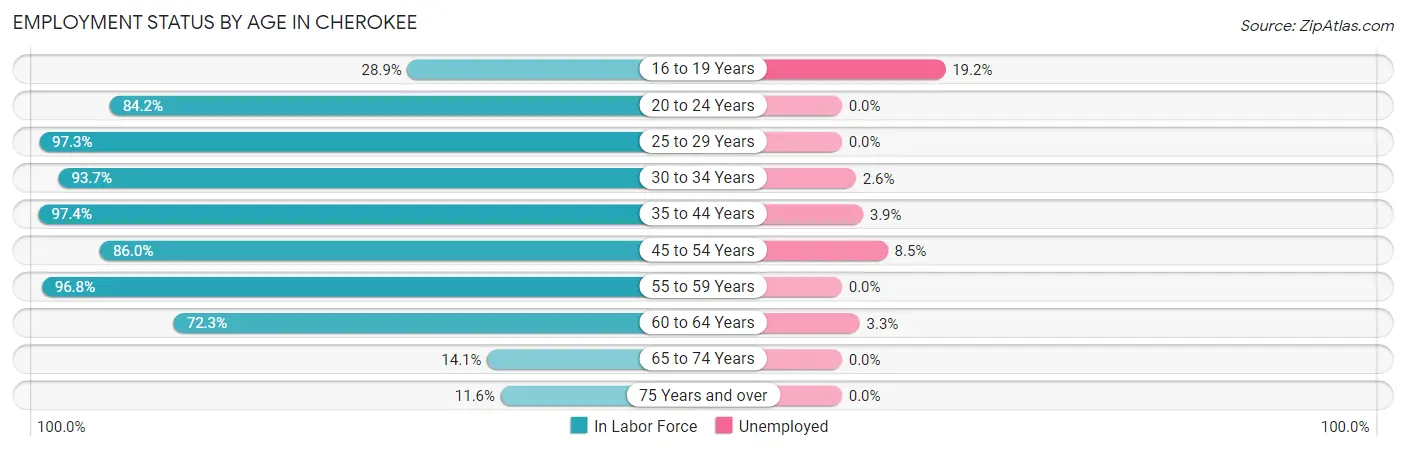
| Age Bracket | In Labor Force | Unemployed |
| 16 to 19 Years | 73 (28.9%) | 14 (19.2%) |
| 20 to 24 Years | 218 (84.2%) | 0 (0.0%) |
| 25 to 29 Years | 213 (97.3%) | 0 (0.0%) |
| 30 to 34 Years | 266 (93.7%) | 7 (2.6%) |
| 35 to 44 Years | 591 (97.4%) | 23 (3.9%) |
| 45 to 54 Years | 516 (86.0%) | 44 (8.5%) |
| 55 to 59 Years | 273 (96.8%) | 0 (0.0%) |
| 60 to 64 Years | 300 (72.3%) | 10 (3.3%) |
| 65 to 74 Years | 95 (14.1%) | 0 (0.0%) |
| 75 Years and over | 72 (11.6%) | 0 (0.0%) |
| Total | 2,618 (62.1%) | 97 (3.7%) |
Employment Status by Educational Attainment in Cherokee
According to labor force statistics for Cherokee, 89.7% of individuals (2,159) out of the total population between 25 and 64 years of age (2,407) are in the labor force, with 3.9% or 84 of them being unemployed. The group with the highest labor force participation rate are those with the educational attainment of bachelor's degree or higher, with 98.8% or 397 individuals in the labor force. Within the labor force, individuals with high school diploma education have the highest percentage of unemployment, with 6.0% or 55 of them being unemployed.
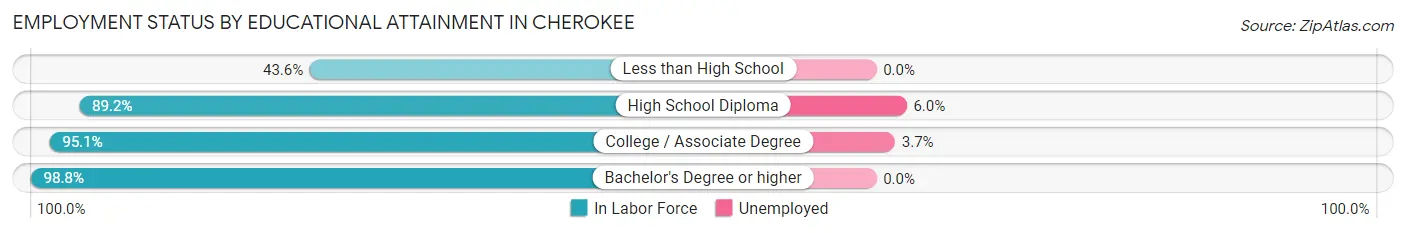
| Educational Attainment | In Labor Force | Unemployed |
| Less than High School | 71 (43.6%) | 0 (0.0%) |
| High School Diploma | 917 (89.2%) | 62 (6.0%) |
| College / Associate Degree | 774 (95.1%) | 30 (3.7%) |
| Bachelor's Degree or higher | 397 (98.8%) | 0 (0.0%) |
| Total | 2,159 (89.7%) | 94 (3.9%) |
Employment Occupations by Sex in Cherokee
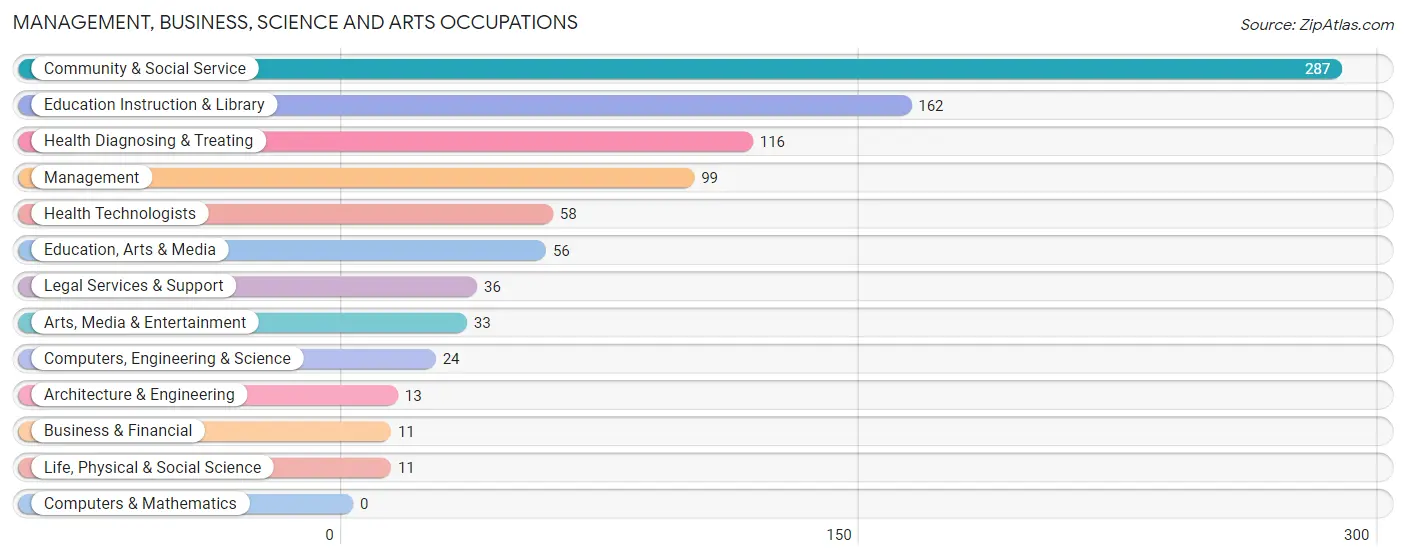
Management, Business, Science and Arts Occupations
The most common Management, Business, Science and Arts occupations in Cherokee are Community & Social Service (287 | 11.4%), Education Instruction & Library (162 | 6.4%), Health Diagnosing & Treating (116 | 4.6%), Management (99 | 3.9%), and Health Technologists (58 | 2.3%).
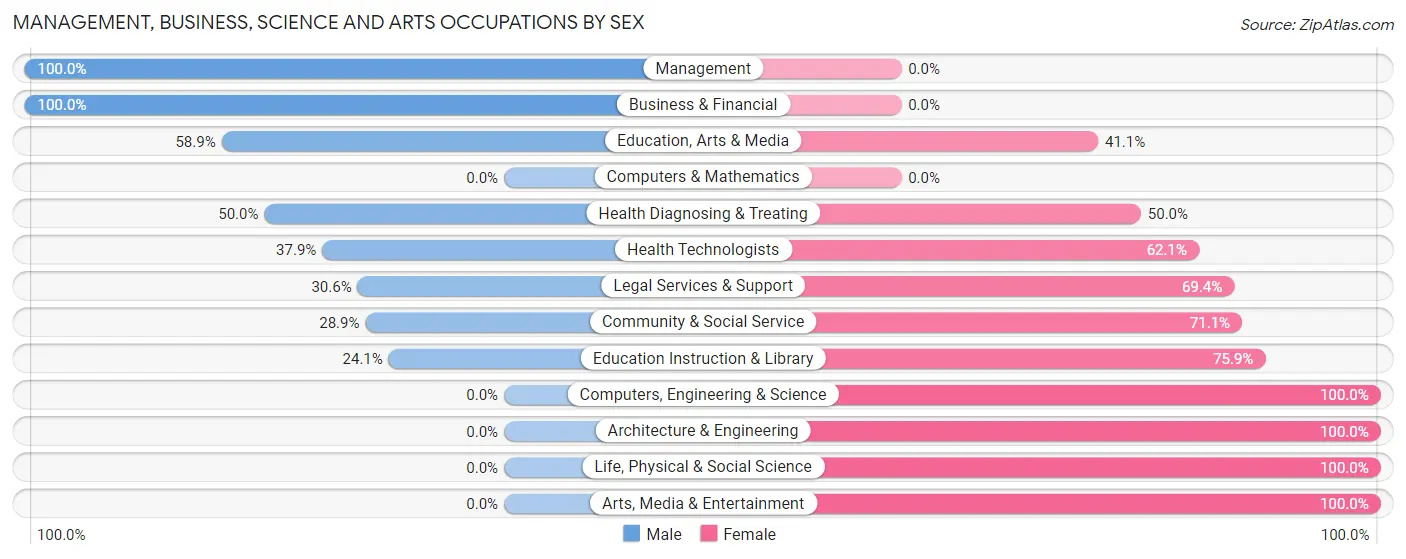
Management, Business, Science and Arts Occupations by Sex
Within the Management, Business, Science and Arts occupations in Cherokee, the most male-oriented occupations are Management (100.0%), Business & Financial (100.0%), and Education, Arts & Media (58.9%), while the most female-oriented occupations are Computers, Engineering & Science (100.0%), Architecture & Engineering (100.0%), and Life, Physical & Social Science (100.0%).
| Occupation | Male | Female |
| Management | 99 (100.0%) | 0 (0.0%) |
| Business & Financial | 11 (100.0%) | 0 (0.0%) |
| Computers, Engineering & Science | 0 (0.0%) | 24 (100.0%) |
| Computers & Mathematics | 0 (0.0%) | 0 (0.0%) |
| Architecture & Engineering | 0 (0.0%) | 13 (100.0%) |
| Life, Physical & Social Science | 0 (0.0%) | 11 (100.0%) |
| Community & Social Service | 83 (28.9%) | 204 (71.1%) |
| Education, Arts & Media | 33 (58.9%) | 23 (41.1%) |
| Legal Services & Support | 11 (30.6%) | 25 (69.4%) |
| Education Instruction & Library | 39 (24.1%) | 123 (75.9%) |
| Arts, Media & Entertainment | 0 (0.0%) | 33 (100.0%) |
| Health Diagnosing & Treating | 58 (50.0%) | 58 (50.0%) |
| Health Technologists | 22 (37.9%) | 36 (62.1%) |
| Total (Category) | 251 (46.7%) | 286 (53.3%) |
| Total (Overall) | 1,254 (49.8%) | 1,265 (50.2%) |
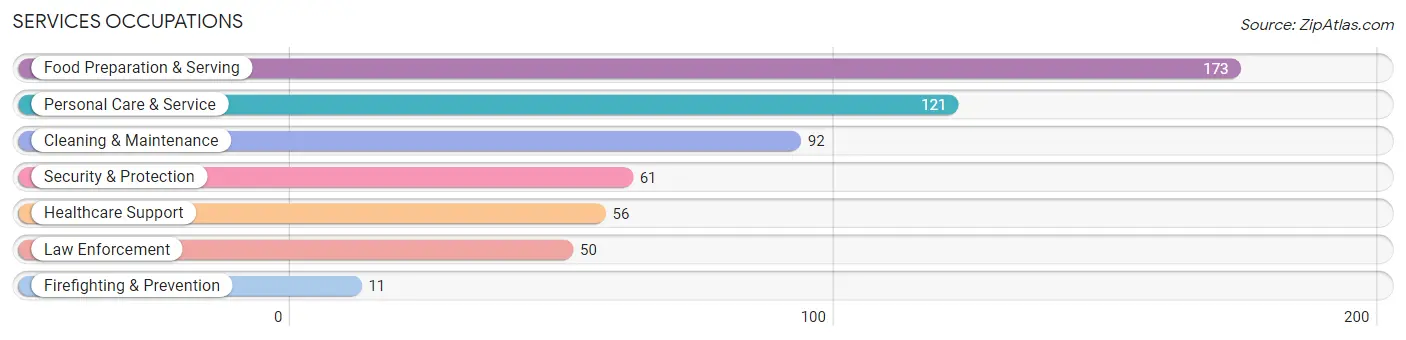
Services Occupations
The most common Services occupations in Cherokee are Food Preparation & Serving (173 | 6.9%), Personal Care & Service (121 | 4.8%), Cleaning & Maintenance (92 | 3.6%), Security & Protection (61 | 2.4%), and Healthcare Support (56 | 2.2%).
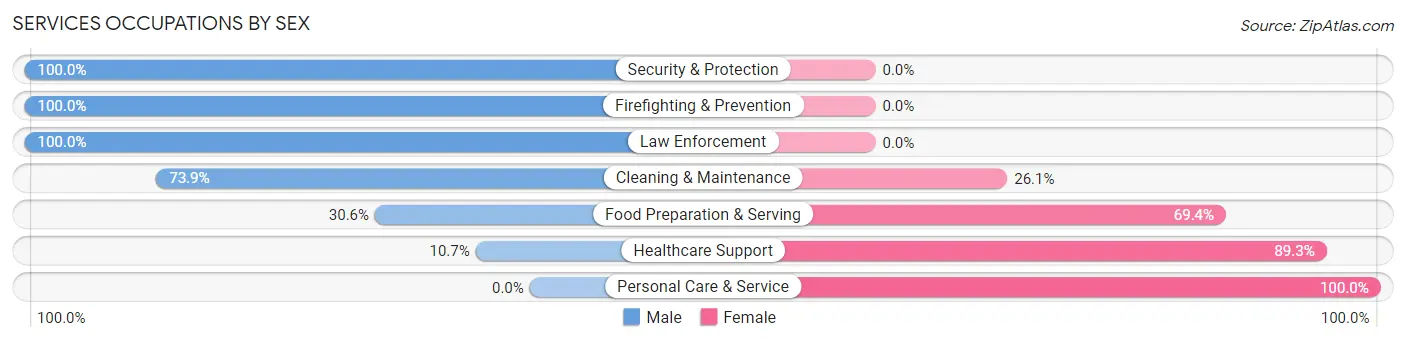
Services Occupations by Sex
Within the Services occupations in Cherokee, the most male-oriented occupations are Security & Protection (100.0%), Firefighting & Prevention (100.0%), and Law Enforcement (100.0%), while the most female-oriented occupations are Personal Care & Service (100.0%), Healthcare Support (89.3%), and Food Preparation & Serving (69.4%).
| Occupation | Male | Female |
| Healthcare Support | 6 (10.7%) | 50 (89.3%) |
| Security & Protection | 61 (100.0%) | 0 (0.0%) |
| Firefighting & Prevention | 11 (100.0%) | 0 (0.0%) |
| Law Enforcement | 50 (100.0%) | 0 (0.0%) |
| Food Preparation & Serving | 53 (30.6%) | 120 (69.4%) |
| Cleaning & Maintenance | 68 (73.9%) | 24 (26.1%) |
| Personal Care & Service | 0 (0.0%) | 121 (100.0%) |
| Total (Category) | 188 (37.4%) | 315 (62.6%) |
| Total (Overall) | 1,254 (49.8%) | 1,265 (50.2%) |
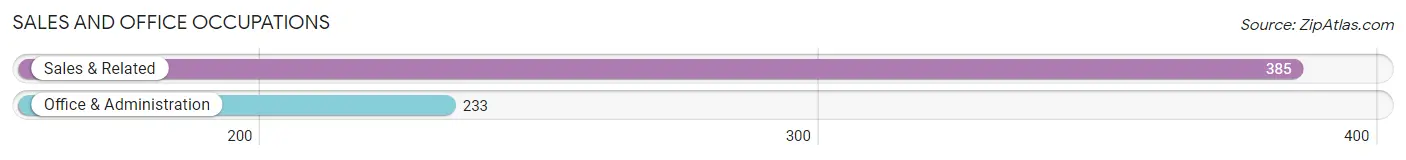
Sales and Office Occupations
The most common Sales and Office occupations in Cherokee are Sales & Related (385 | 15.3%), and Office & Administration (233 | 9.2%).
Sales and Office Occupations by Sex
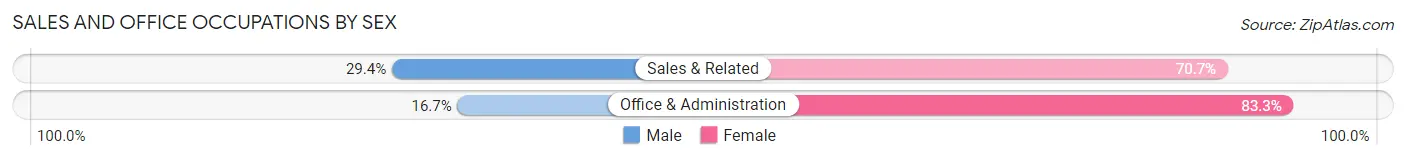
| Occupation | Male | Female |
| Sales & Related | 113 (29.3%) | 272 (70.7%) |
| Office & Administration | 39 (16.7%) | 194 (83.3%) |
| Total (Category) | 152 (24.6%) | 466 (75.4%) |
| Total (Overall) | 1,254 (49.8%) | 1,265 (50.2%) |
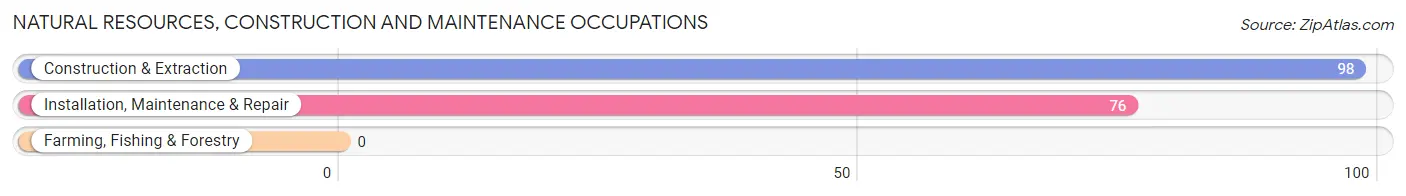
Natural Resources, Construction and Maintenance Occupations
The most common Natural Resources, Construction and Maintenance occupations in Cherokee are Construction & Extraction (98 | 3.9%), and Installation, Maintenance & Repair (76 | 3.0%).
Natural Resources, Construction and Maintenance Occupations by Sex
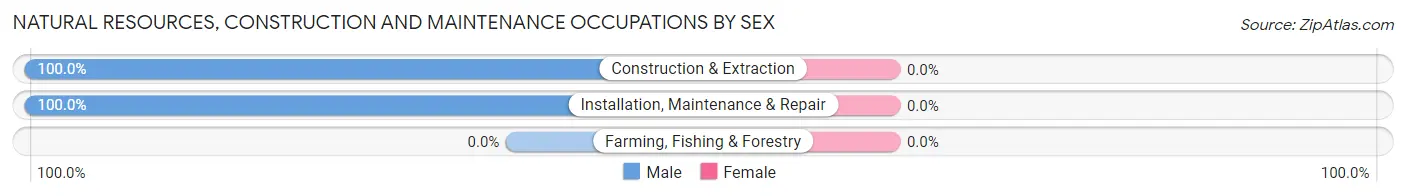
| Occupation | Male | Female |
| Farming, Fishing & Forestry | 0 (0.0%) | 0 (0.0%) |
| Construction & Extraction | 98 (100.0%) | 0 (0.0%) |
| Installation, Maintenance & Repair | 76 (100.0%) | 0 (0.0%) |
| Total (Category) | 174 (100.0%) | 0 (0.0%) |
| Total (Overall) | 1,254 (49.8%) | 1,265 (50.2%) |
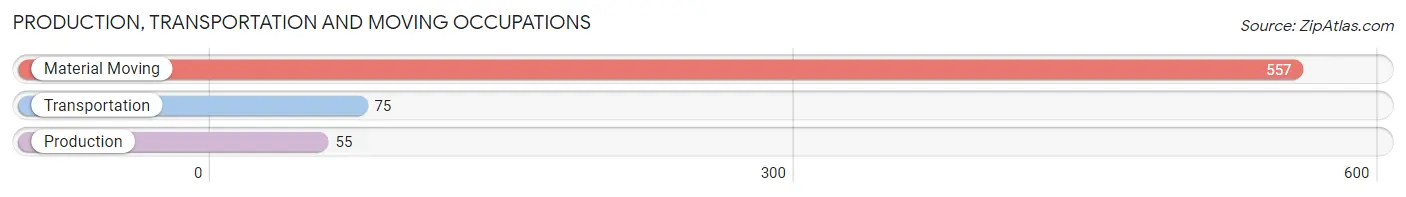
Production, Transportation and Moving Occupations
The most common Production, Transportation and Moving occupations in Cherokee are Material Moving (557 | 22.1%), Transportation (75 | 3.0%), and Production (55 | 2.2%).
Production, Transportation and Moving Occupations by Sex
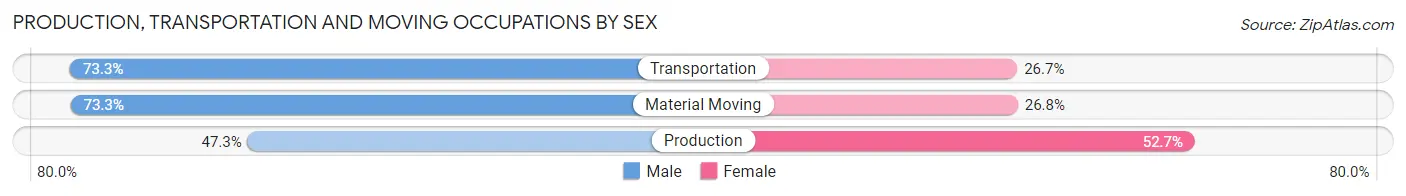
| Occupation | Male | Female |
| Production | 26 (47.3%) | 29 (52.7%) |
| Transportation | 55 (73.3%) | 20 (26.7%) |
| Material Moving | 408 (73.3%) | 149 (26.8%) |
| Total (Category) | 489 (71.2%) | 198 (28.8%) |
| Total (Overall) | 1,254 (49.8%) | 1,265 (50.2%) |
Employment Industries by Sex in Cherokee
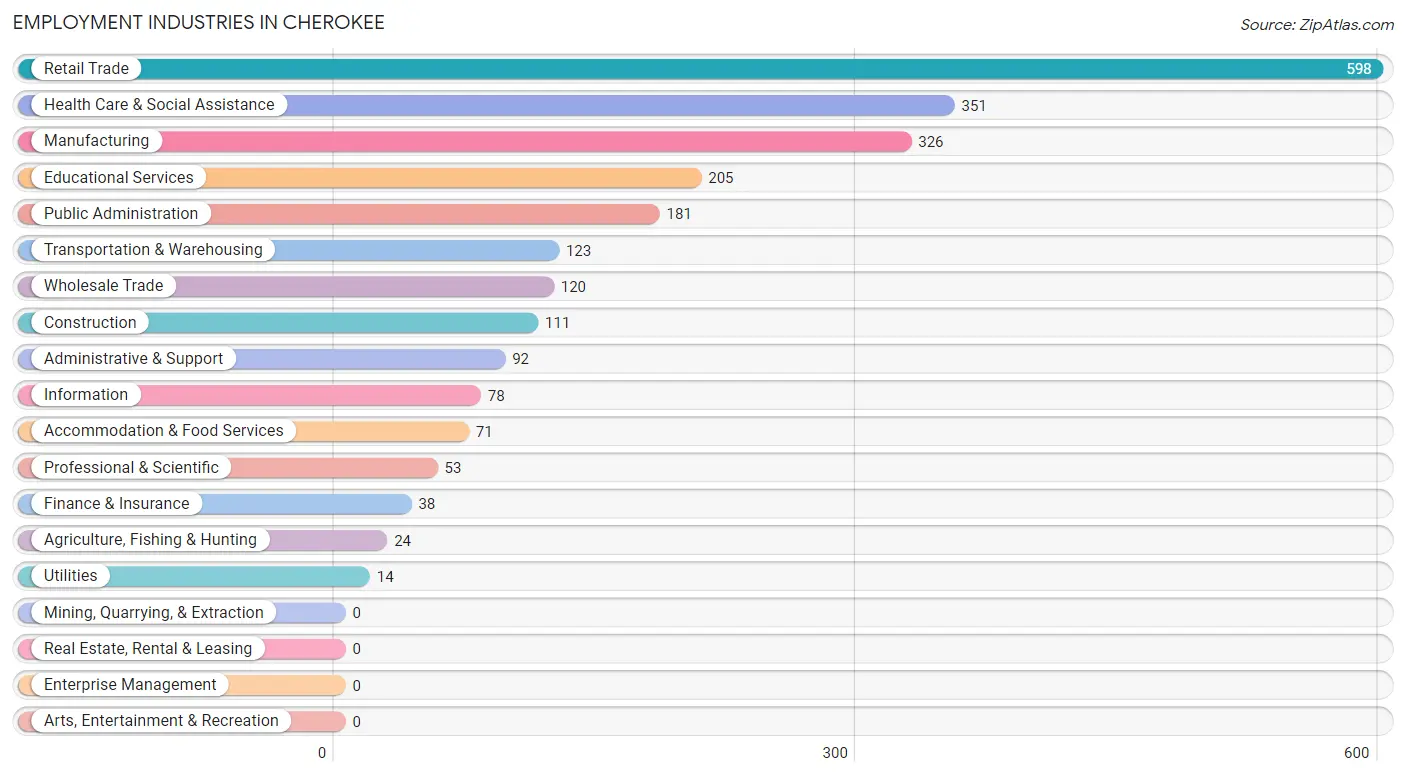
Employment Industries in Cherokee
The major employment industries in Cherokee include Retail Trade (598 | 23.7%), Health Care & Social Assistance (351 | 13.9%), Manufacturing (326 | 12.9%), Educational Services (205 | 8.1%), and Public Administration (181 | 7.2%).
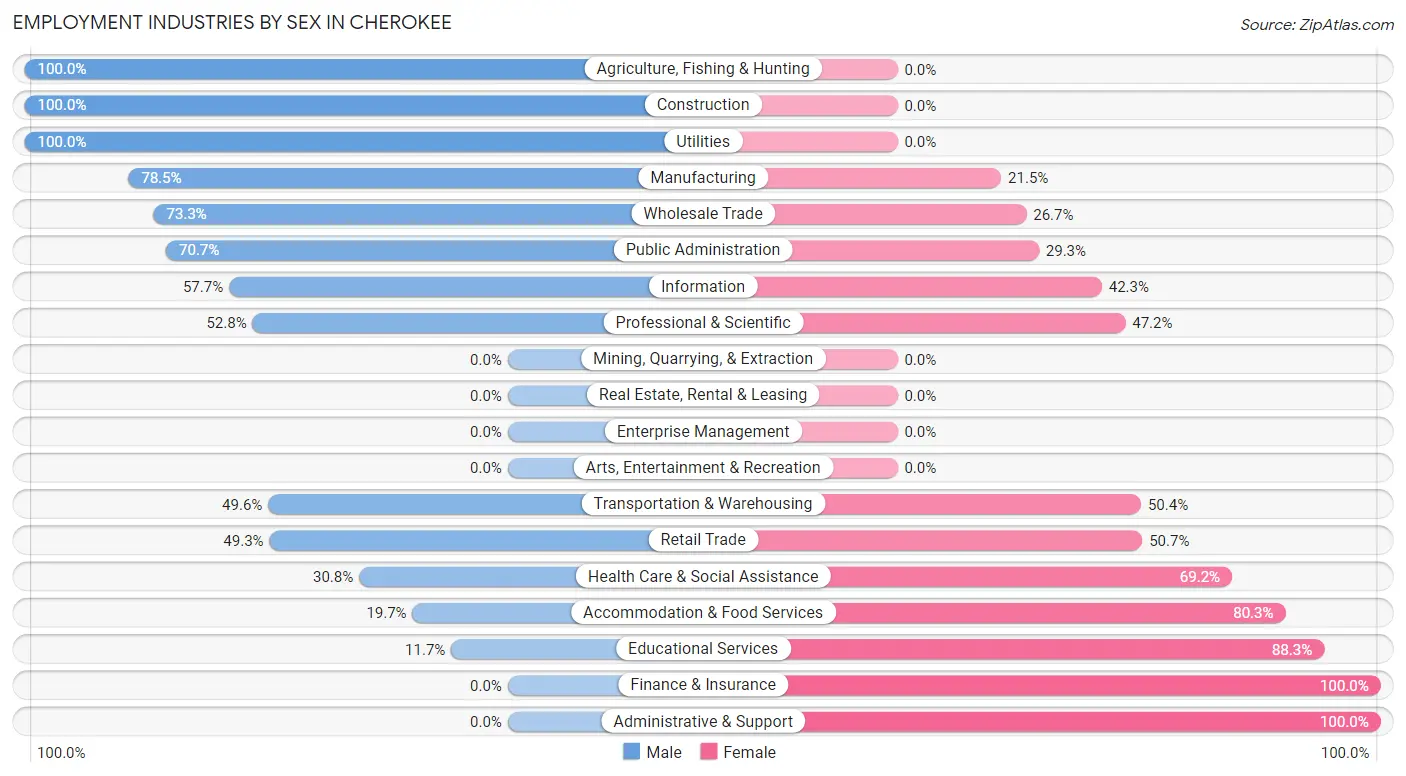
Employment Industries by Sex in Cherokee
The Cherokee industries that see more men than women are Agriculture, Fishing & Hunting (100.0%), Construction (100.0%), and Utilities (100.0%), whereas the industries that tend to have a higher number of women are Finance & Insurance (100.0%), Administrative & Support (100.0%), and Educational Services (88.3%).
| Industry | Male | Female |
| Agriculture, Fishing & Hunting | 24 (100.0%) | 0 (0.0%) |
| Mining, Quarrying, & Extraction | 0 (0.0%) | 0 (0.0%) |
| Construction | 111 (100.0%) | 0 (0.0%) |
| Manufacturing | 256 (78.5%) | 70 (21.5%) |
| Wholesale Trade | 88 (73.3%) | 32 (26.7%) |
| Retail Trade | 295 (49.3%) | 303 (50.7%) |
| Transportation & Warehousing | 61 (49.6%) | 62 (50.4%) |
| Utilities | 14 (100.0%) | 0 (0.0%) |
| Information | 45 (57.7%) | 33 (42.3%) |
| Finance & Insurance | 0 (0.0%) | 38 (100.0%) |
| Real Estate, Rental & Leasing | 0 (0.0%) | 0 (0.0%) |
| Professional & Scientific | 28 (52.8%) | 25 (47.2%) |
| Enterprise Management | 0 (0.0%) | 0 (0.0%) |
| Administrative & Support | 0 (0.0%) | 92 (100.0%) |
| Educational Services | 24 (11.7%) | 181 (88.3%) |
| Health Care & Social Assistance | 108 (30.8%) | 243 (69.2%) |
| Arts, Entertainment & Recreation | 0 (0.0%) | 0 (0.0%) |
| Accommodation & Food Services | 14 (19.7%) | 57 (80.3%) |
| Public Administration | 128 (70.7%) | 53 (29.3%) |
| Total | 1,254 (49.8%) | 1,265 (50.2%) |
Education in Cherokee
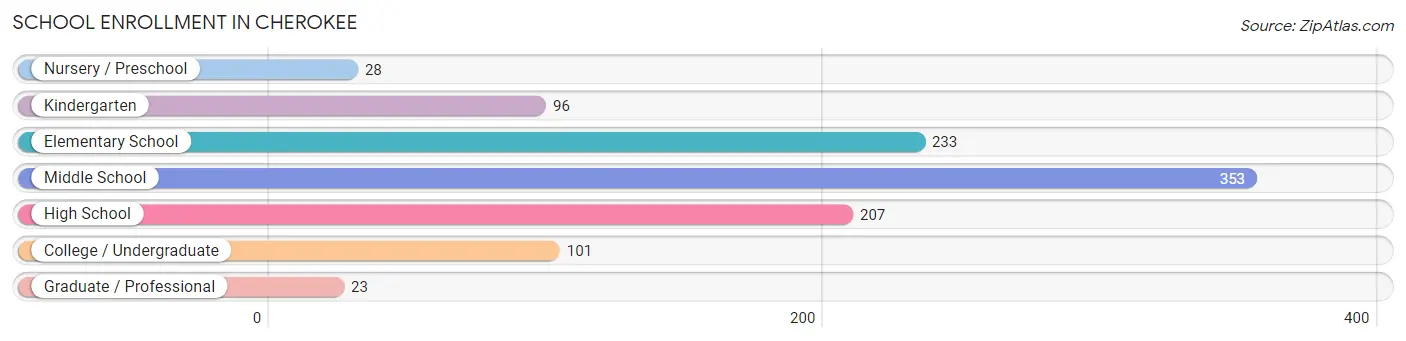
School Enrollment in Cherokee
The most common levels of schooling among the 1,041 students in Cherokee are middle school (353 | 33.9%), elementary school (233 | 22.4%), and high school (207 | 19.9%).
| School Level | # Students | % Students |
| Nursery / Preschool | 28 | 2.7% |
| Kindergarten | 96 | 9.2% |
| Elementary School | 233 | 22.4% |
| Middle School | 353 | 33.9% |
| High School | 207 | 19.9% |
| College / Undergraduate | 101 | 9.7% |
| Graduate / Professional | 23 | 2.2% |
| Total | 1,041 | 100.0% |
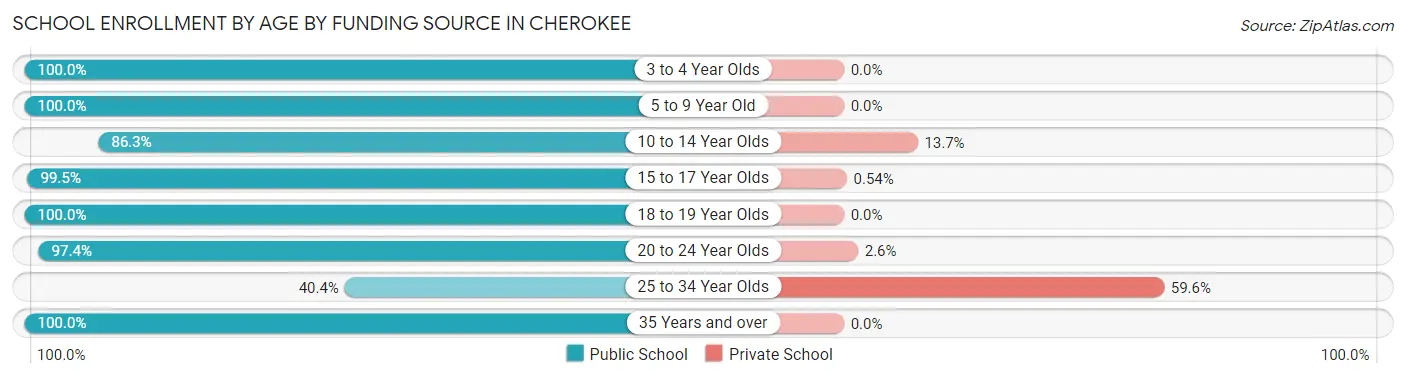
School Enrollment by Age by Funding Source in Cherokee
Out of a total of 1,041 students who are enrolled in schools in Cherokee, 94 (9.0%) attend a private institution, while the remaining 947 (91.0%) are enrolled in public schools. The age group of 25 to 34 year olds has the highest likelihood of being enrolled in private schools, with 31 (59.6% in the age bracket) enrolled. Conversely, the age group of 3 to 4 year olds has the lowest likelihood of being enrolled in a private school, with 13 (100.0% in the age bracket) attending a public institution.
| Age Bracket | Public School | Private School |
| 3 to 4 Year Olds | 13 (100.0%) | 0 (0.0%) |
| 5 to 9 Year Old | 244 (100.0%) | 0 (0.0%) |
| 10 to 14 Year Olds | 383 (86.3%) | 61 (13.7%) |
| 15 to 17 Year Olds | 184 (99.5%) | 1 (0.5%) |
| 18 to 19 Year Olds | 24 (100.0%) | 0 (0.0%) |
| 20 to 24 Year Olds | 37 (97.4%) | 1 (2.6%) |
| 25 to 34 Year Olds | 21 (40.4%) | 31 (59.6%) |
| 35 Years and over | 41 (100.0%) | 0 (0.0%) |
| Total | 947 (91.0%) | 94 (9.0%) |
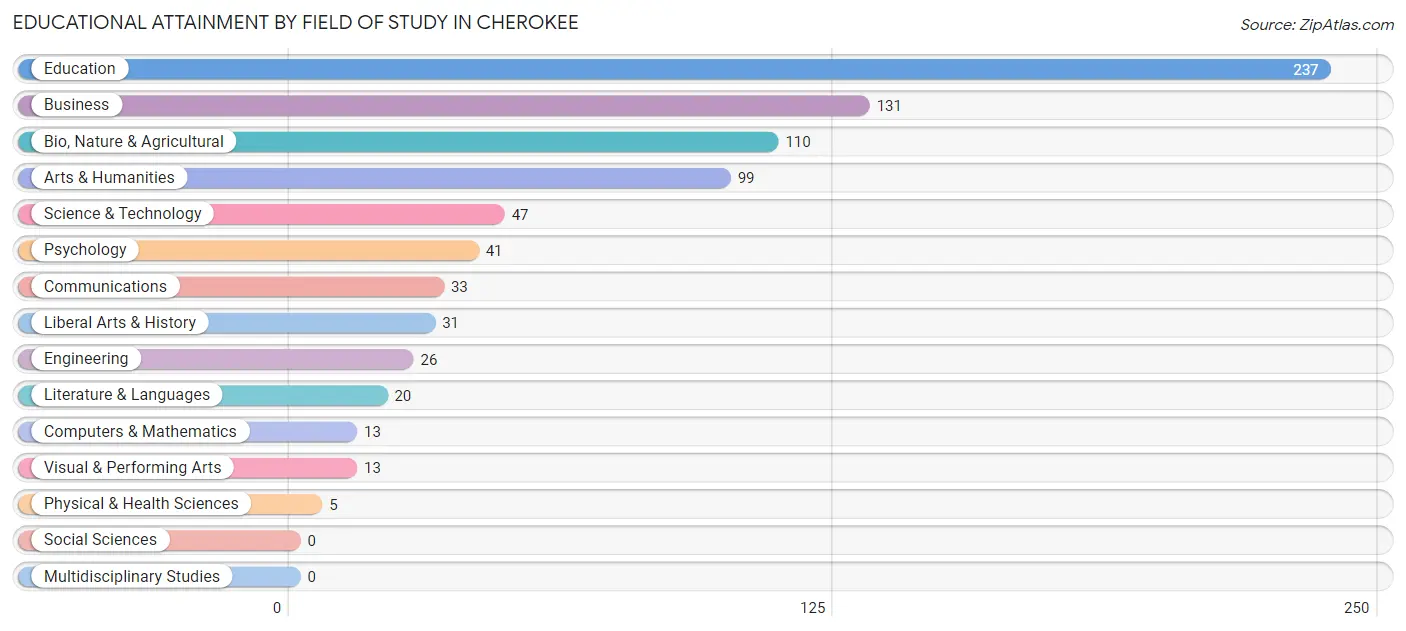
Educational Attainment by Field of Study in Cherokee
Education (237 | 29.4%), business (131 | 16.3%), bio, nature & agricultural (110 | 13.7%), arts & humanities (99 | 12.3%), and science & technology (47 | 5.8%) are the most common fields of study among 806 individuals in Cherokee who have obtained a bachelor's degree or higher.
| Field of Study | # Graduates | % Graduates |
| Computers & Mathematics | 13 | 1.6% |
| Bio, Nature & Agricultural | 110 | 13.7% |
| Physical & Health Sciences | 5 | 0.6% |
| Psychology | 41 | 5.1% |
| Social Sciences | 0 | 0.0% |
| Engineering | 26 | 3.2% |
| Multidisciplinary Studies | 0 | 0.0% |
| Science & Technology | 47 | 5.8% |
| Business | 131 | 16.3% |
| Education | 237 | 29.4% |
| Literature & Languages | 20 | 2.5% |
| Liberal Arts & History | 31 | 3.8% |
| Visual & Performing Arts | 13 | 1.6% |
| Communications | 33 | 4.1% |
| Arts & Humanities | 99 | 12.3% |
| Total | 806 | 100.0% |
Transportation & Commute in Cherokee
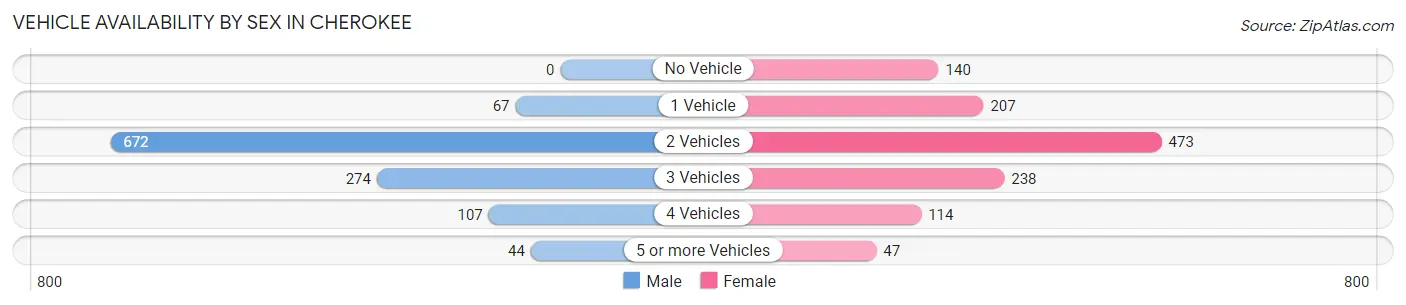
Vehicle Availability by Sex in Cherokee
The most prevalent vehicle ownership categories in Cherokee are males with 2 vehicles (672, accounting for 57.7%) and females with 2 vehicles (473, making up 55.1%).
| Vehicles Available | Male | Female |
| No Vehicle | 0 (0.0%) | 140 (11.5%) |
| 1 Vehicle | 67 (5.8%) | 207 (17.0%) |
| 2 Vehicles | 672 (57.7%) | 473 (38.8%) |
| 3 Vehicles | 274 (23.5%) | 238 (19.5%) |
| 4 Vehicles | 107 (9.2%) | 114 (9.3%) |
| 5 or more Vehicles | 44 (3.8%) | 47 (3.9%) |
| Total | 1,164 (100.0%) | 1,219 (100.0%) |
Commute Time in Cherokee
The most frequently occuring commute durations in Cherokee are 5 to 9 minutes (1,006 commuters, 44.6%), less than 5 minutes (443 commuters, 19.7%), and 10 to 14 minutes (212 commuters, 9.4%).
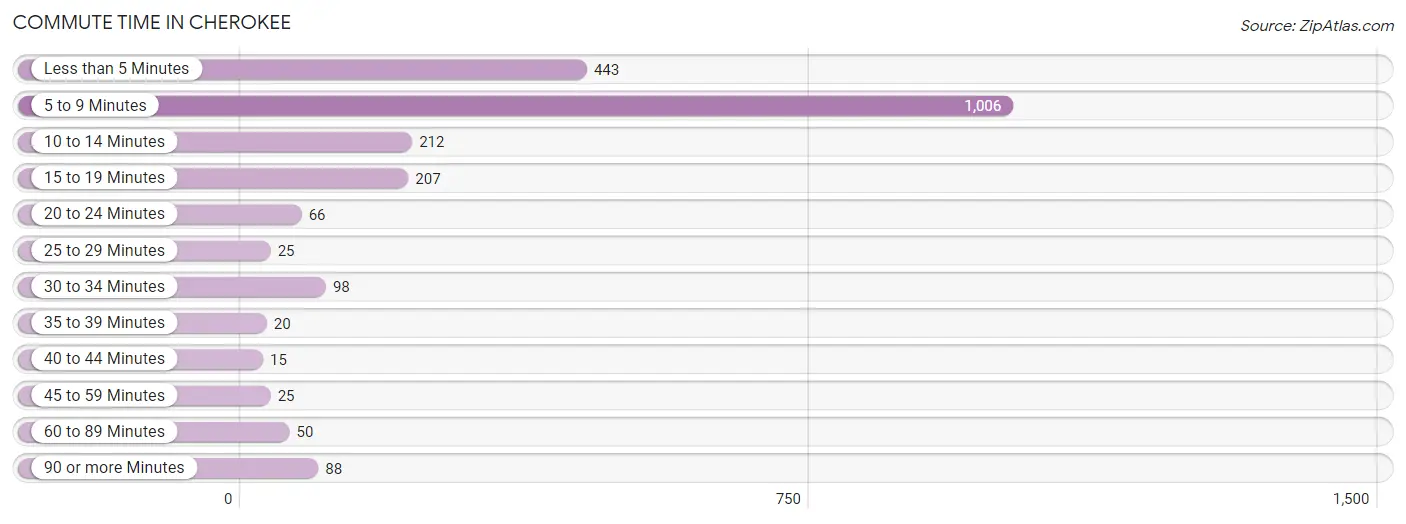
| Commute Time | # Commuters | % Commuters |
| Less than 5 Minutes | 443 | 19.7% |
| 5 to 9 Minutes | 1,006 | 44.6% |
| 10 to 14 Minutes | 212 | 9.4% |
| 15 to 19 Minutes | 207 | 9.2% |
| 20 to 24 Minutes | 66 | 2.9% |
| 25 to 29 Minutes | 25 | 1.1% |
| 30 to 34 Minutes | 98 | 4.3% |
| 35 to 39 Minutes | 20 | 0.9% |
| 40 to 44 Minutes | 15 | 0.7% |
| 45 to 59 Minutes | 25 | 1.1% |
| 60 to 89 Minutes | 50 | 2.2% |
| 90 or more Minutes | 88 | 3.9% |
Commute Time by Sex in Cherokee
The most common commute times in Cherokee are 5 to 9 minutes (466 commuters, 40.6%) for males and 5 to 9 minutes (540 commuters, 48.7%) for females.
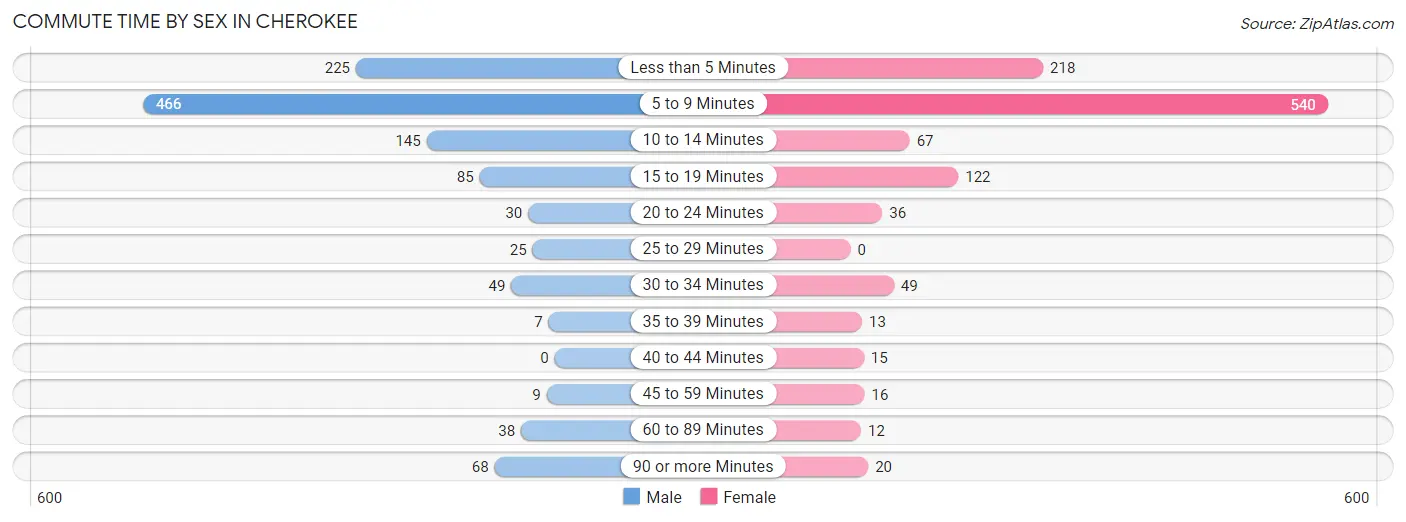
| Commute Time | Male | Female |
| Less than 5 Minutes | 225 (19.6%) | 218 (19.7%) |
| 5 to 9 Minutes | 466 (40.6%) | 540 (48.7%) |
| 10 to 14 Minutes | 145 (12.6%) | 67 (6.0%) |
| 15 to 19 Minutes | 85 (7.4%) | 122 (11.0%) |
| 20 to 24 Minutes | 30 (2.6%) | 36 (3.3%) |
| 25 to 29 Minutes | 25 (2.2%) | 0 (0.0%) |
| 30 to 34 Minutes | 49 (4.3%) | 49 (4.4%) |
| 35 to 39 Minutes | 7 (0.6%) | 13 (1.2%) |
| 40 to 44 Minutes | 0 (0.0%) | 15 (1.3%) |
| 45 to 59 Minutes | 9 (0.8%) | 16 (1.4%) |
| 60 to 89 Minutes | 38 (3.3%) | 12 (1.1%) |
| 90 or more Minutes | 68 (5.9%) | 20 (1.8%) |
Time of Departure to Work by Sex in Cherokee
The most frequent times of departure to work in Cherokee are 4:00 PM to 11:59 PM (234, 20.4%) for males and 7:30 AM to 7:59 AM (195, 17.6%) for females.
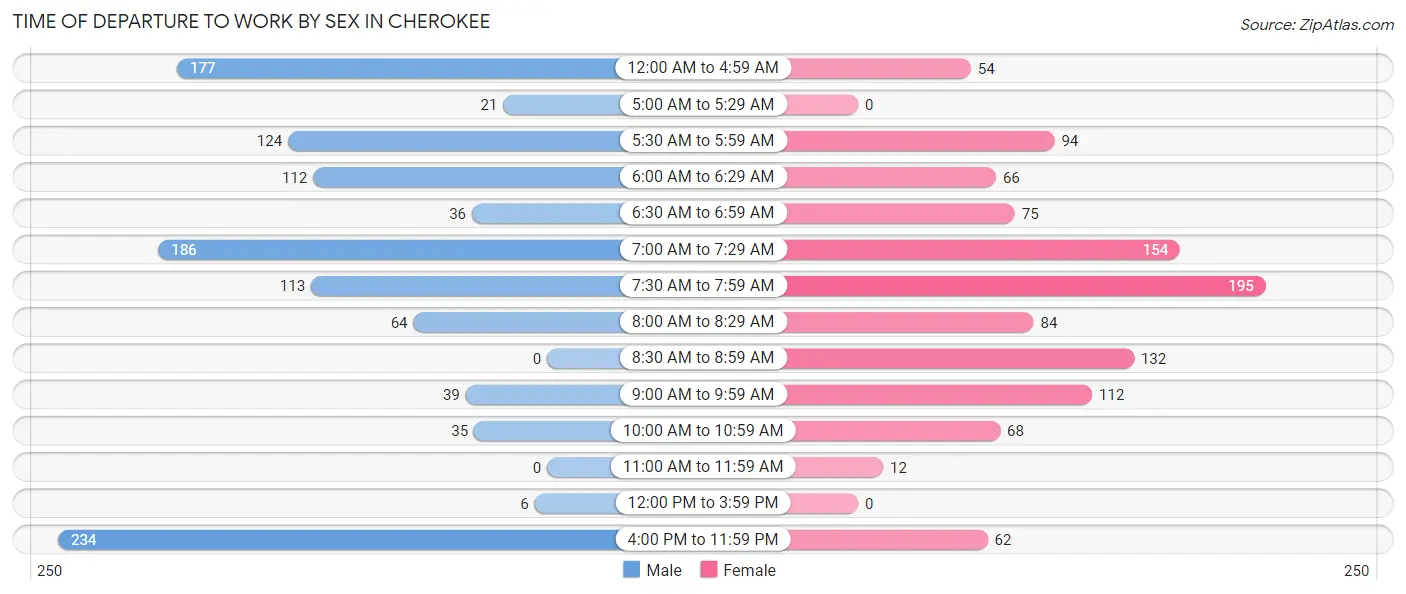
| Time of Departure | Male | Female |
| 12:00 AM to 4:59 AM | 177 (15.4%) | 54 (4.9%) |
| 5:00 AM to 5:29 AM | 21 (1.8%) | 0 (0.0%) |
| 5:30 AM to 5:59 AM | 124 (10.8%) | 94 (8.5%) |
| 6:00 AM to 6:29 AM | 112 (9.8%) | 66 (6.0%) |
| 6:30 AM to 6:59 AM | 36 (3.1%) | 75 (6.8%) |
| 7:00 AM to 7:29 AM | 186 (16.2%) | 154 (13.9%) |
| 7:30 AM to 7:59 AM | 113 (9.9%) | 195 (17.6%) |
| 8:00 AM to 8:29 AM | 64 (5.6%) | 84 (7.6%) |
| 8:30 AM to 8:59 AM | 0 (0.0%) | 132 (11.9%) |
| 9:00 AM to 9:59 AM | 39 (3.4%) | 112 (10.1%) |
| 10:00 AM to 10:59 AM | 35 (3.0%) | 68 (6.1%) |
| 11:00 AM to 11:59 AM | 0 (0.0%) | 12 (1.1%) |
| 12:00 PM to 3:59 PM | 6 (0.5%) | 0 (0.0%) |
| 4:00 PM to 11:59 PM | 234 (20.4%) | 62 (5.6%) |
| Total | 1,147 (100.0%) | 1,108 (100.0%) |
Housing Occupancy in Cherokee
Occupancy by Ownership in Cherokee
Of the total 2,355 dwellings in Cherokee, owner-occupied units account for 1,528 (64.9%), while renter-occupied units make up 827 (35.1%).
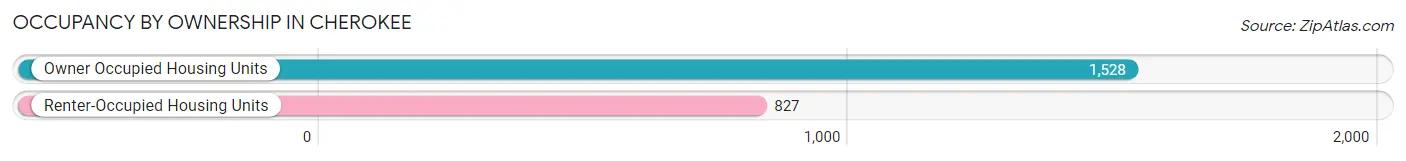
| Occupancy | # Housing Units | % Housing Units |
| Owner Occupied Housing Units | 1,528 | 64.9% |
| Renter-Occupied Housing Units | 827 | 35.1% |
| Total Occupied Housing Units | 2,355 | 100.0% |
Occupancy by Household Size in Cherokee
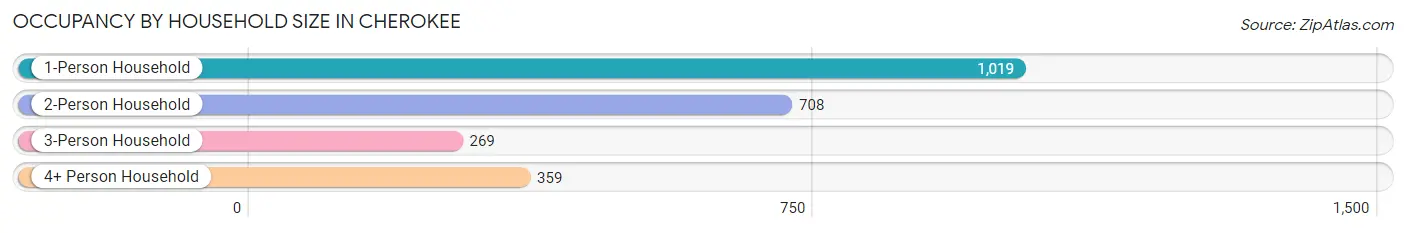
| Household Size | # Housing Units | % Housing Units |
| 1-Person Household | 1,019 | 43.3% |
| 2-Person Household | 708 | 30.1% |
| 3-Person Household | 269 | 11.4% |
| 4+ Person Household | 359 | 15.2% |
| Total Housing Units | 2,355 | 100.0% |
Occupancy by Ownership by Household Size in Cherokee
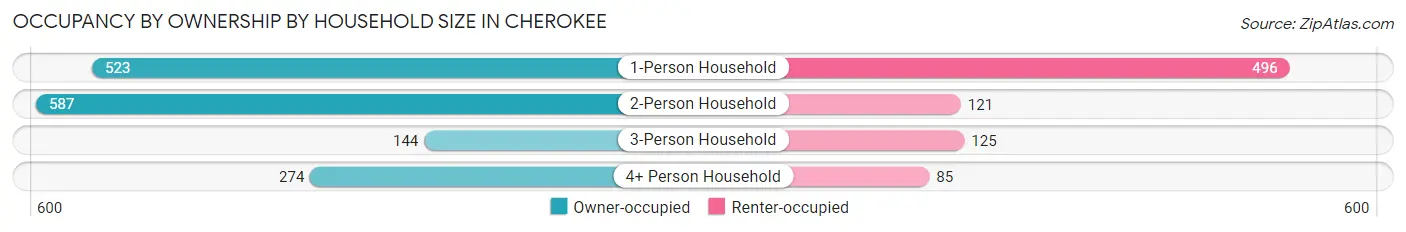
| Household Size | Owner-occupied | Renter-occupied |
| 1-Person Household | 523 (51.3%) | 496 (48.7%) |
| 2-Person Household | 587 (82.9%) | 121 (17.1%) |
| 3-Person Household | 144 (53.5%) | 125 (46.5%) |
| 4+ Person Household | 274 (76.3%) | 85 (23.7%) |
| Total Housing Units | 1,528 (64.9%) | 827 (35.1%) |
Occupancy by Educational Attainment in Cherokee
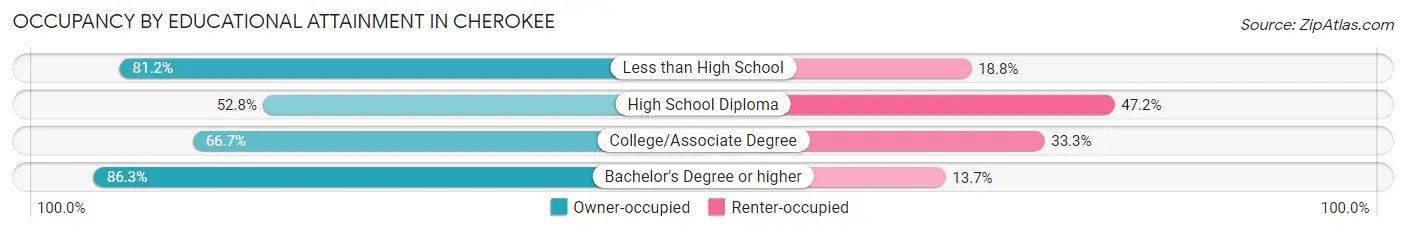
| Household Size | Owner-occupied | Renter-occupied |
| Less than High School | 56 (81.2%) | 13 (18.8%) |
| High School Diploma | 578 (52.8%) | 517 (47.2%) |
| College/Associate Degree | 454 (66.7%) | 227 (33.3%) |
| Bachelor's Degree or higher | 440 (86.3%) | 70 (13.7%) |
Occupancy by Age of Householder in Cherokee
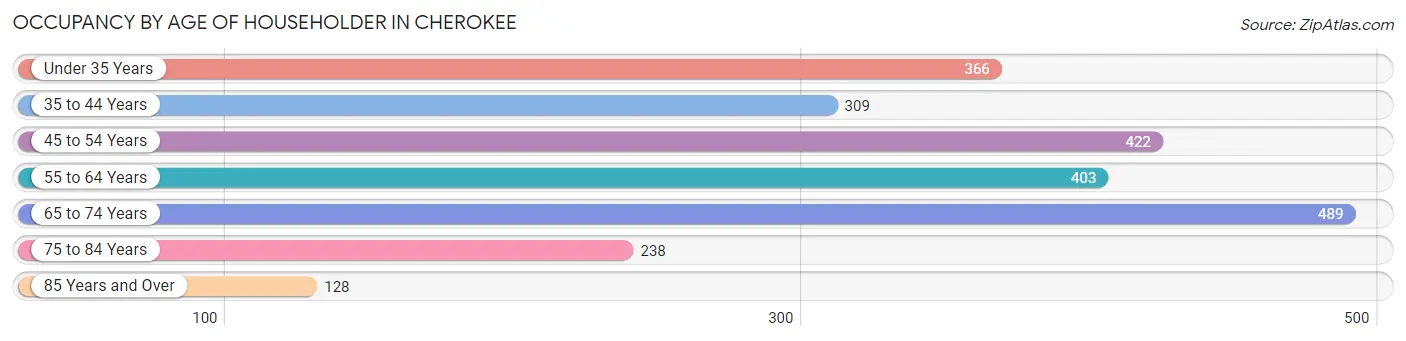
| Age Bracket | # Households | % Households |
| Under 35 Years | 366 | 15.5% |
| 35 to 44 Years | 309 | 13.1% |
| 45 to 54 Years | 422 | 17.9% |
| 55 to 64 Years | 403 | 17.1% |
| 65 to 74 Years | 489 | 20.8% |
| 75 to 84 Years | 238 | 10.1% |
| 85 Years and Over | 128 | 5.4% |
| Total | 2,355 | 100.0% |
Housing Finances in Cherokee
Median Income by Occupancy in Cherokee
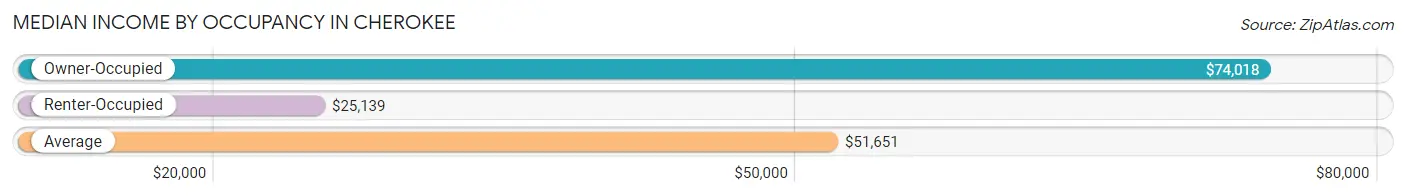
| Occupancy Type | # Households | Median Income |
| Owner-Occupied | 1,528 (64.9%) | $74,018 |
| Renter-Occupied | 827 (35.1%) | $25,139 |
| Average | 2,355 (100.0%) | $51,651 |
Occupancy by Householder Income Bracket in Cherokee
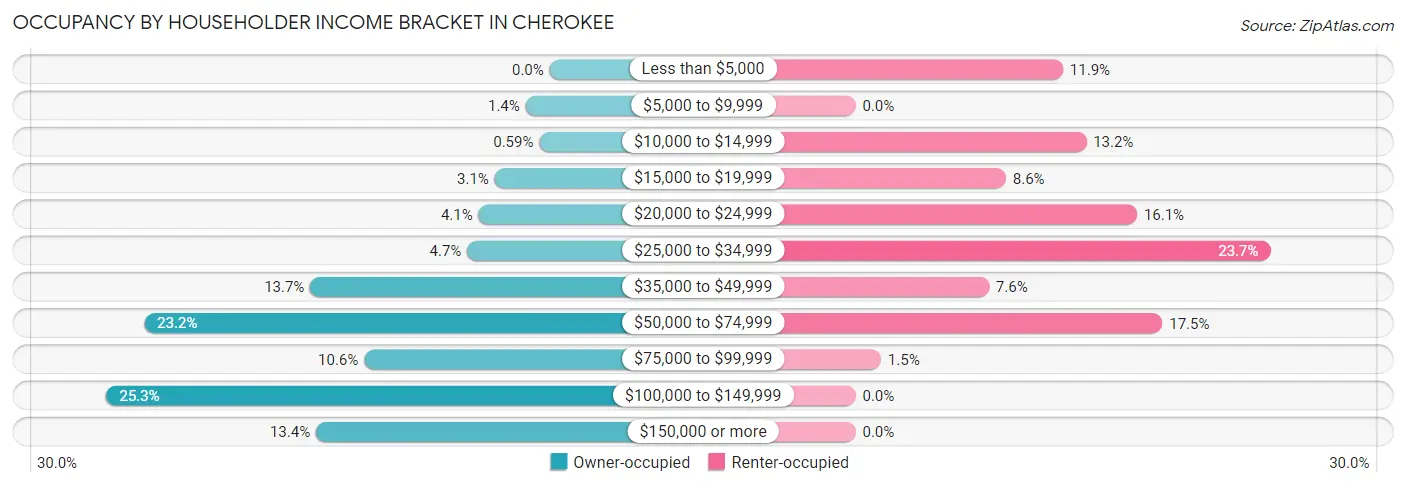
| Income Bracket | Owner-occupied | Renter-occupied |
| Less than $5,000 | 0 (0.0%) | 98 (11.8%) |
| $5,000 to $9,999 | 21 (1.4%) | 0 (0.0%) |
| $10,000 to $14,999 | 9 (0.6%) | 109 (13.2%) |
| $15,000 to $19,999 | 48 (3.1%) | 71 (8.6%) |
| $20,000 to $24,999 | 62 (4.1%) | 133 (16.1%) |
| $25,000 to $34,999 | 72 (4.7%) | 196 (23.7%) |
| $35,000 to $49,999 | 209 (13.7%) | 63 (7.6%) |
| $50,000 to $74,999 | 354 (23.2%) | 145 (17.5%) |
| $75,000 to $99,999 | 162 (10.6%) | 12 (1.5%) |
| $100,000 to $149,999 | 387 (25.3%) | 0 (0.0%) |
| $150,000 or more | 204 (13.4%) | 0 (0.0%) |
| Total | 1,528 (100.0%) | 827 (100.0%) |
Monthly Housing Cost Tiers in Cherokee
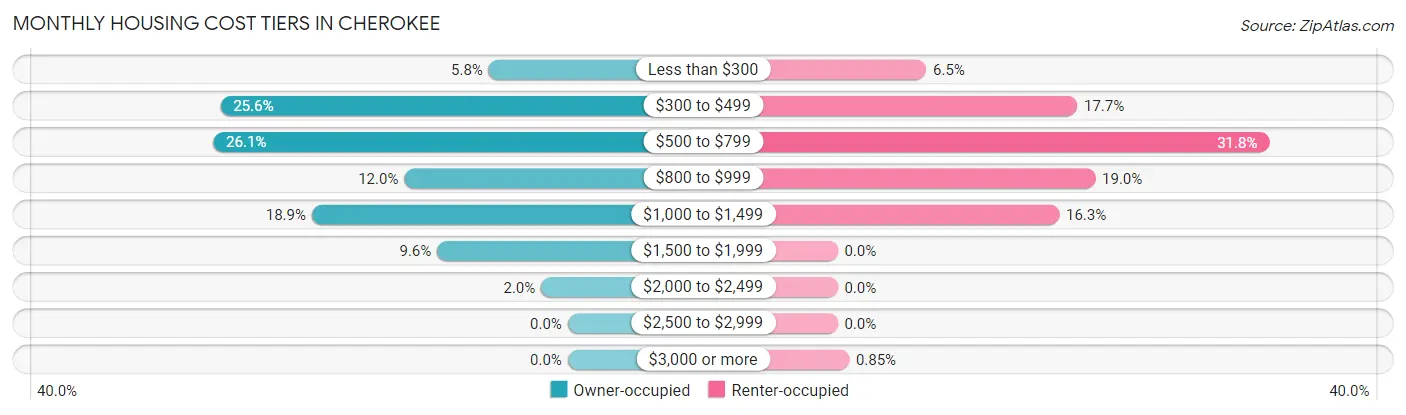
| Monthly Cost | Owner-occupied | Renter-occupied |
| Less than $300 | 89 (5.8%) | 54 (6.5%) |
| $300 to $499 | 391 (25.6%) | 146 (17.6%) |
| $500 to $799 | 399 (26.1%) | 263 (31.8%) |
| $800 to $999 | 184 (12.0%) | 157 (19.0%) |
| $1,000 to $1,499 | 288 (18.9%) | 135 (16.3%) |
| $1,500 to $1,999 | 147 (9.6%) | 0 (0.0%) |
| $2,000 to $2,499 | 30 (2.0%) | 0 (0.0%) |
| $2,500 to $2,999 | 0 (0.0%) | 0 (0.0%) |
| $3,000 or more | 0 (0.0%) | 7 (0.9%) |
| Total | 1,528 (100.0%) | 827 (100.0%) |
Physical Housing Characteristics in Cherokee
Housing Structures in Cherokee
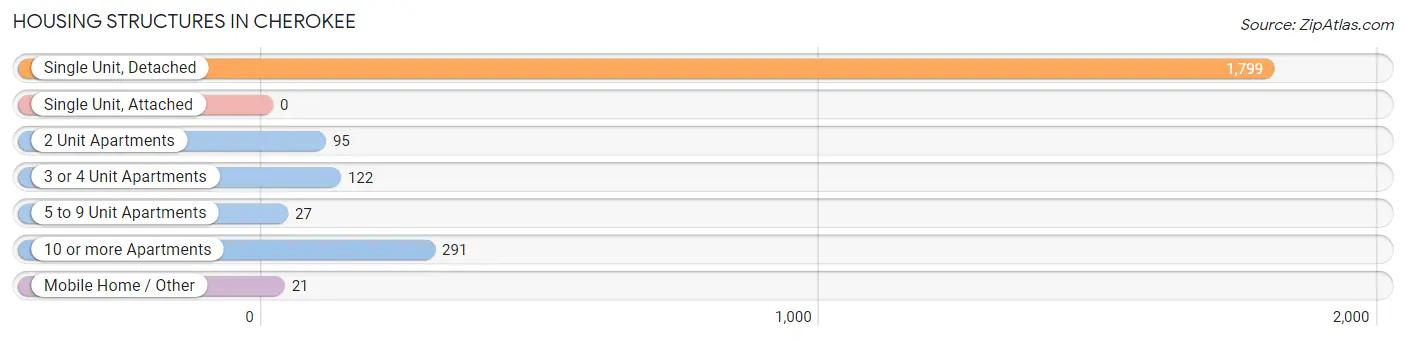
| Structure Type | # Housing Units | % Housing Units |
| Single Unit, Detached | 1,799 | 76.4% |
| Single Unit, Attached | 0 | 0.0% |
| 2 Unit Apartments | 95 | 4.0% |
| 3 or 4 Unit Apartments | 122 | 5.2% |
| 5 to 9 Unit Apartments | 27 | 1.1% |
| 10 or more Apartments | 291 | 12.4% |
| Mobile Home / Other | 21 | 0.9% |
| Total | 2,355 | 100.0% |
Housing Structures by Occupancy in Cherokee
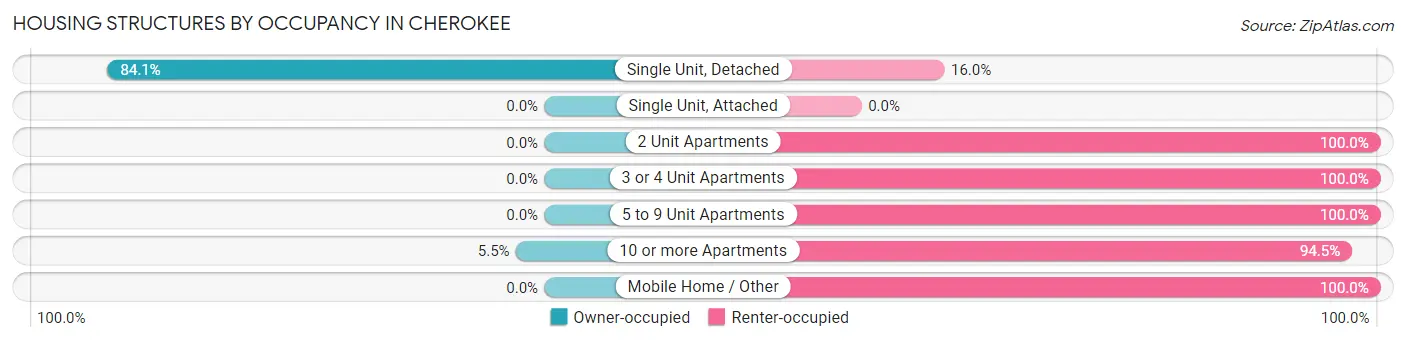
| Structure Type | Owner-occupied | Renter-occupied |
| Single Unit, Detached | 1,512 (84.1%) | 287 (16.0%) |
| Single Unit, Attached | 0 (0.0%) | 0 (0.0%) |
| 2 Unit Apartments | 0 (0.0%) | 95 (100.0%) |
| 3 or 4 Unit Apartments | 0 (0.0%) | 122 (100.0%) |
| 5 to 9 Unit Apartments | 0 (0.0%) | 27 (100.0%) |
| 10 or more Apartments | 16 (5.5%) | 275 (94.5%) |
| Mobile Home / Other | 0 (0.0%) | 21 (100.0%) |
| Total | 1,528 (64.9%) | 827 (35.1%) |
Housing Structures by Number of Rooms in Cherokee
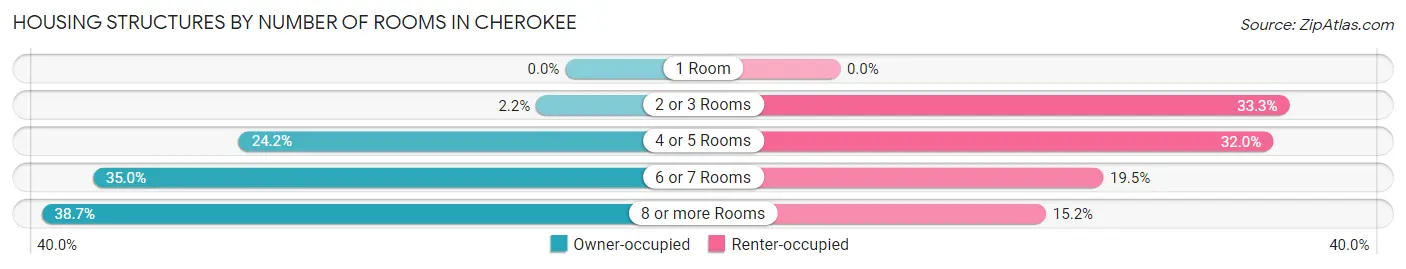
| Number of Rooms | Owner-occupied | Renter-occupied |
| 1 Room | 0 (0.0%) | 0 (0.0%) |
| 2 or 3 Rooms | 33 (2.2%) | 275 (33.3%) |
| 4 or 5 Rooms | 369 (24.1%) | 265 (32.0%) |
| 6 or 7 Rooms | 534 (34.9%) | 161 (19.5%) |
| 8 or more Rooms | 592 (38.7%) | 126 (15.2%) |
| Total | 1,528 (100.0%) | 827 (100.0%) |
Housing Structure by Heating Type in Cherokee
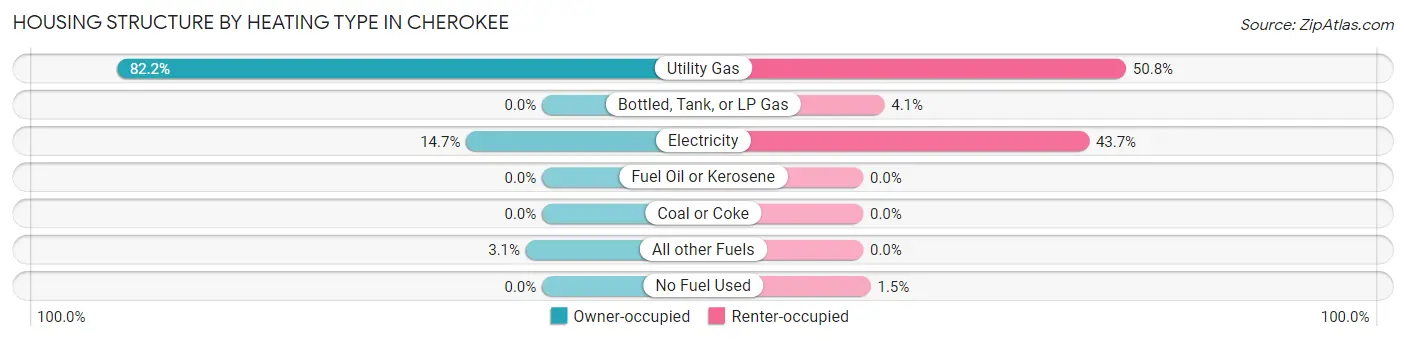
| Heating Type | Owner-occupied | Renter-occupied |
| Utility Gas | 1,256 (82.2%) | 420 (50.8%) |
| Bottled, Tank, or LP Gas | 0 (0.0%) | 34 (4.1%) |
| Electricity | 224 (14.7%) | 361 (43.6%) |
| Fuel Oil or Kerosene | 0 (0.0%) | 0 (0.0%) |
| Coal or Coke | 0 (0.0%) | 0 (0.0%) |
| All other Fuels | 48 (3.1%) | 0 (0.0%) |
| No Fuel Used | 0 (0.0%) | 12 (1.5%) |
| Total | 1,528 (100.0%) | 827 (100.0%) |
Household Vehicle Usage in Cherokee
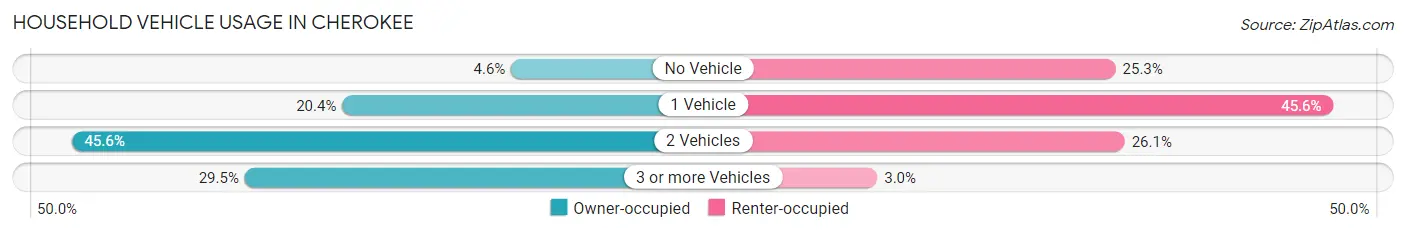
| Vehicles per Household | Owner-occupied | Renter-occupied |
| No Vehicle | 70 (4.6%) | 209 (25.3%) |
| 1 Vehicle | 311 (20.3%) | 377 (45.6%) |
| 2 Vehicles | 697 (45.6%) | 216 (26.1%) |
| 3 or more Vehicles | 450 (29.4%) | 25 (3.0%) |
| Total | 1,528 (100.0%) | 827 (100.0%) |
Real Estate & Mortgages in Cherokee
Real Estate and Mortgage Overview in Cherokee
| Characteristic | Without Mortgage | With Mortgage |
| Housing Units | 728 | 800 |
| Median Property Value | $101,800 | $138,700 |
| Median Household Income | $53,362 | $127 |
| Monthly Housing Costs | $443 | $0 |
| Real Estate Taxes | $1,482 | $21 |
Property Value by Mortgage Status in Cherokee
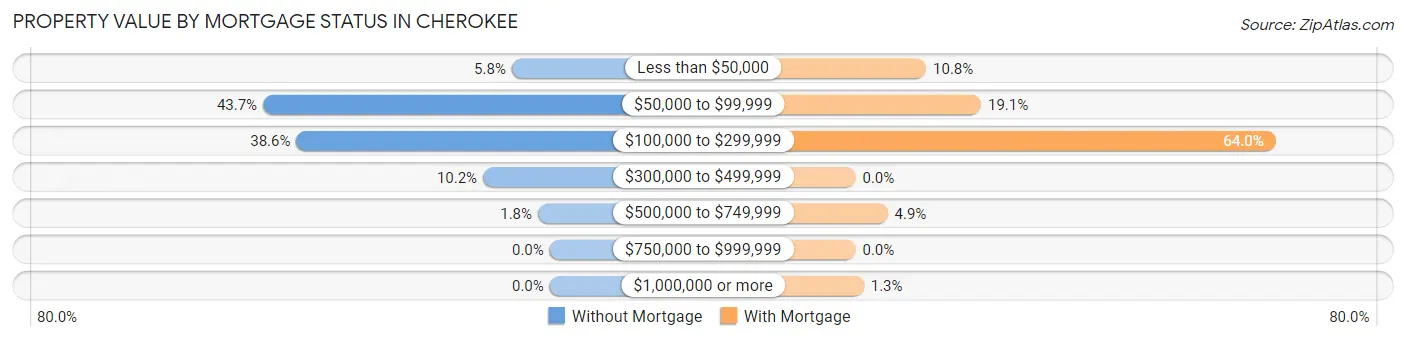
| Property Value | Without Mortgage | With Mortgage |
| Less than $50,000 | 42 (5.8%) | 86 (10.7%) |
| $50,000 to $99,999 | 318 (43.7%) | 153 (19.1%) |
| $100,000 to $299,999 | 281 (38.6%) | 512 (64.0%) |
| $300,000 to $499,999 | 74 (10.2%) | 0 (0.0%) |
| $500,000 to $749,999 | 13 (1.8%) | 39 (4.9%) |
| $750,000 to $999,999 | 0 (0.0%) | 0 (0.0%) |
| $1,000,000 or more | 0 (0.0%) | 10 (1.3%) |
| Total | 728 (100.0%) | 800 (100.0%) |
Household Income by Mortgage Status in Cherokee
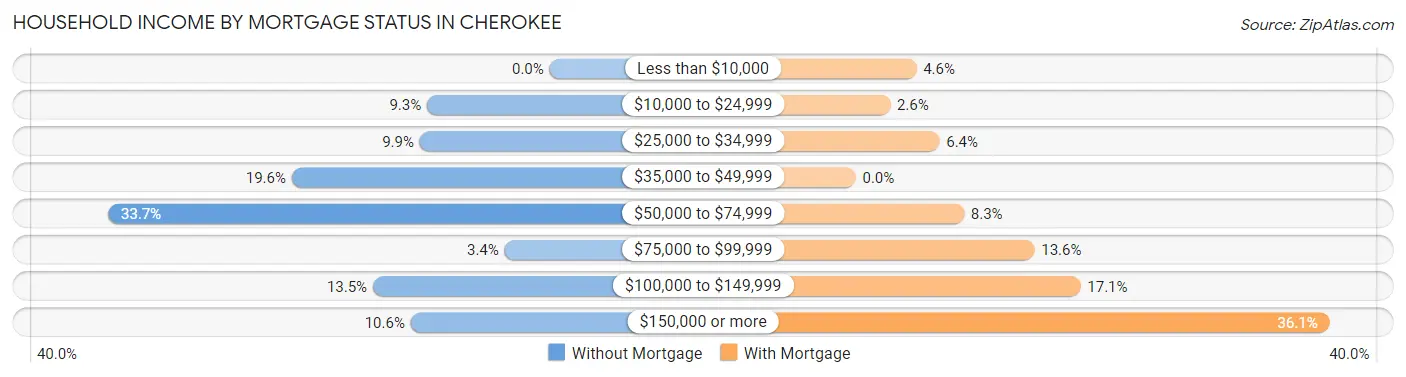
| Household Income | Without Mortgage | With Mortgage |
| Less than $10,000 | 0 (0.0%) | 37 (4.6%) |
| $10,000 to $24,999 | 68 (9.3%) | 21 (2.6%) |
| $25,000 to $34,999 | 72 (9.9%) | 51 (6.4%) |
| $35,000 to $49,999 | 143 (19.6%) | 0 (0.0%) |
| $50,000 to $74,999 | 245 (33.7%) | 66 (8.3%) |
| $75,000 to $99,999 | 25 (3.4%) | 109 (13.6%) |
| $100,000 to $149,999 | 98 (13.5%) | 137 (17.1%) |
| $150,000 or more | 77 (10.6%) | 289 (36.1%) |
| Total | 728 (100.0%) | 800 (100.0%) |
Property Value to Household Income Ratio in Cherokee
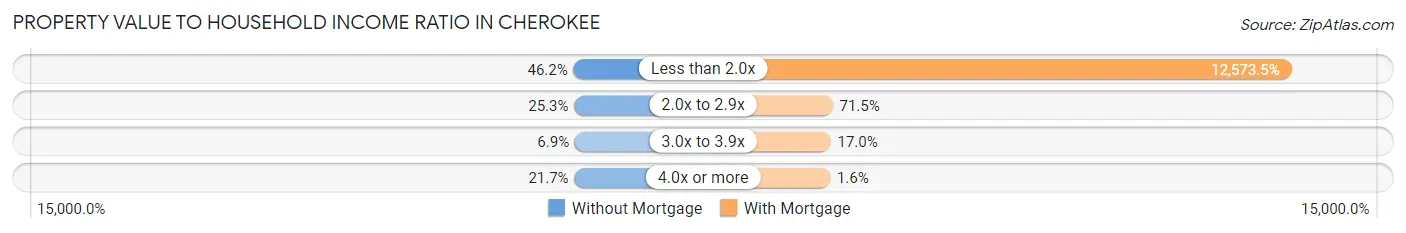
| Value-to-Income Ratio | Without Mortgage | With Mortgage |
| Less than 2.0x | 336 (46.2%) | 100,588 (12,573.5%) |
| 2.0x to 2.9x | 184 (25.3%) | 572 (71.5%) |
| 3.0x to 3.9x | 50 (6.9%) | 136 (17.0%) |
| 4.0x or more | 158 (21.7%) | 13 (1.6%) |
| Total | 728 (100.0%) | 800 (100.0%) |
Real Estate Taxes by Mortgage Status in Cherokee
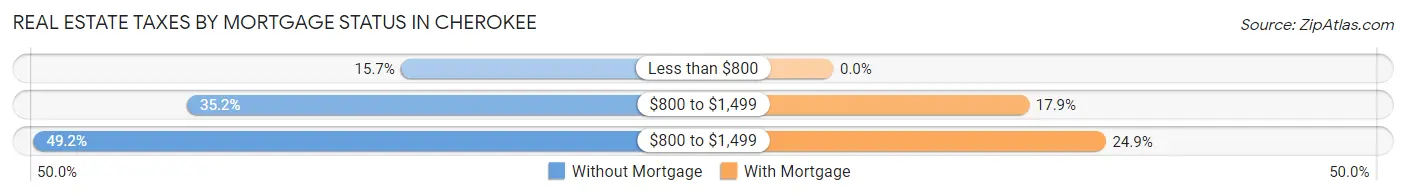
| Property Taxes | Without Mortgage | With Mortgage |
| Less than $800 | 114 (15.7%) | 0 (0.0%) |
| $800 to $1,499 | 256 (35.2%) | 143 (17.9%) |
| $800 to $1,499 | 358 (49.2%) | 199 (24.9%) |
| Total | 728 (100.0%) | 800 (100.0%) |
Health & Disability in Cherokee
Health Insurance Coverage by Age in Cherokee
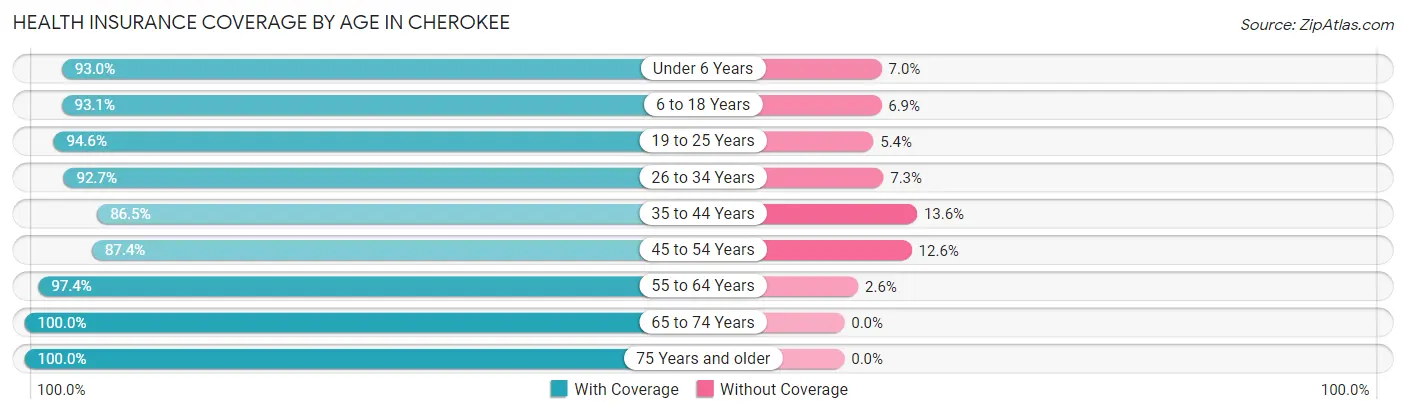
| Age Bracket | With Coverage | Without Coverage |
| Under 6 Years | 254 (93.0%) | 19 (7.0%) |
| 6 to 18 Years | 823 (93.1%) | 61 (6.9%) |
| 19 to 25 Years | 315 (94.6%) | 18 (5.4%) |
| 26 to 34 Years | 408 (92.7%) | 32 (7.3%) |
| 35 to 44 Years | 517 (86.5%) | 81 (13.6%) |
| 45 to 54 Years | 522 (87.4%) | 75 (12.6%) |
| 55 to 64 Years | 679 (97.4%) | 18 (2.6%) |
| 65 to 74 Years | 628 (100.0%) | 0 (0.0%) |
| 75 Years and older | 477 (100.0%) | 0 (0.0%) |
| Total | 4,623 (93.8%) | 304 (6.2%) |
Health Insurance Coverage by Citizenship Status in Cherokee
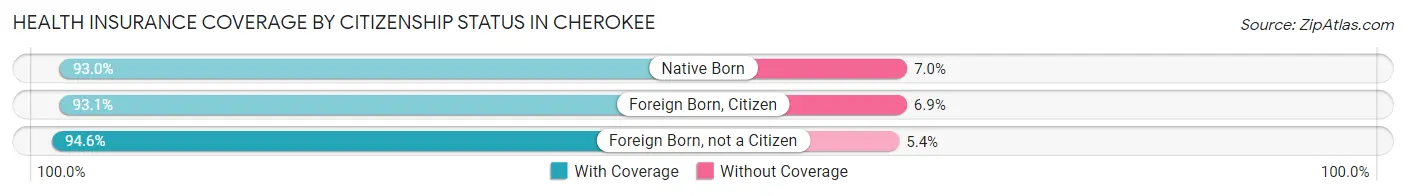
| Citizenship Status | With Coverage | Without Coverage |
| Native Born | 254 (93.0%) | 19 (7.0%) |
| Foreign Born, Citizen | 823 (93.1%) | 61 (6.9%) |
| Foreign Born, not a Citizen | 315 (94.6%) | 18 (5.4%) |
Health Insurance Coverage by Household Income in Cherokee
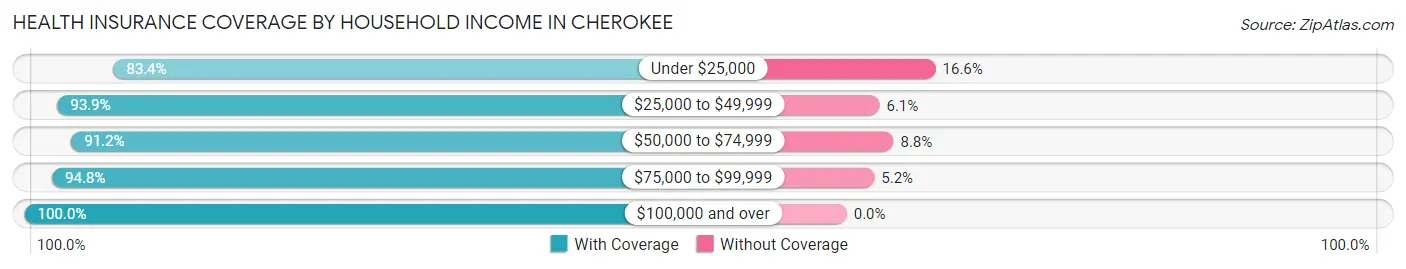
| Household Income | With Coverage | Without Coverage |
| Under $25,000 | 636 (83.4%) | 127 (16.6%) |
| $25,000 to $49,999 | 1,054 (93.9%) | 69 (6.1%) |
| $50,000 to $74,999 | 844 (91.2%) | 81 (8.8%) |
| $75,000 to $99,999 | 331 (94.8%) | 18 (5.2%) |
| $100,000 and over | 1,634 (100.0%) | 0 (0.0%) |
Public vs Private Health Insurance Coverage by Age in Cherokee
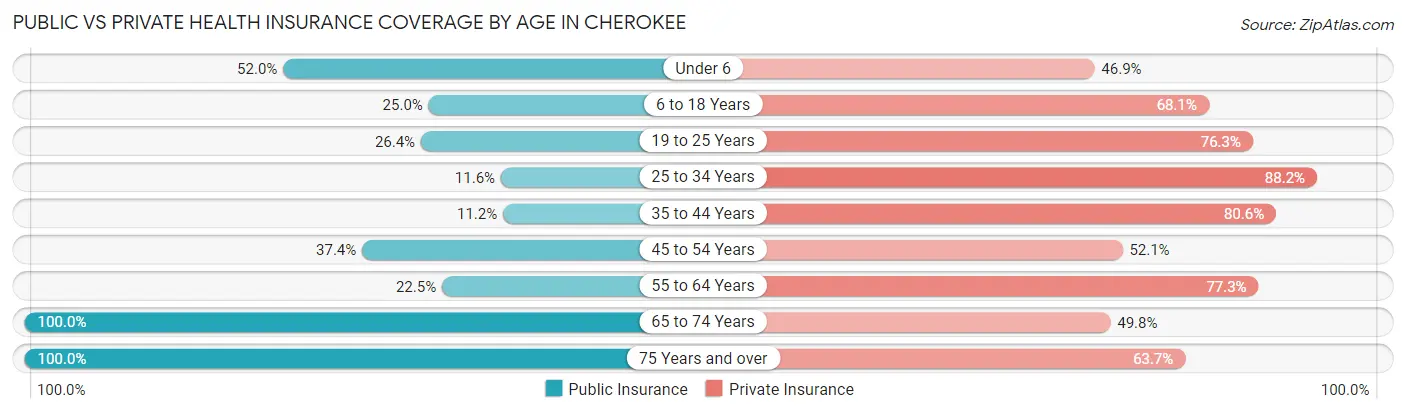
| Age Bracket | Public Insurance | Private Insurance |
| Under 6 | 142 (52.0%) | 128 (46.9%) |
| 6 to 18 Years | 221 (25.0%) | 602 (68.1%) |
| 19 to 25 Years | 88 (26.4%) | 254 (76.3%) |
| 25 to 34 Years | 51 (11.6%) | 388 (88.2%) |
| 35 to 44 Years | 67 (11.2%) | 482 (80.6%) |
| 45 to 54 Years | 223 (37.3%) | 311 (52.1%) |
| 55 to 64 Years | 157 (22.5%) | 539 (77.3%) |
| 65 to 74 Years | 628 (100.0%) | 313 (49.8%) |
| 75 Years and over | 477 (100.0%) | 304 (63.7%) |
| Total | 2,054 (41.7%) | 3,321 (67.4%) |
Disability Status by Sex by Age in Cherokee
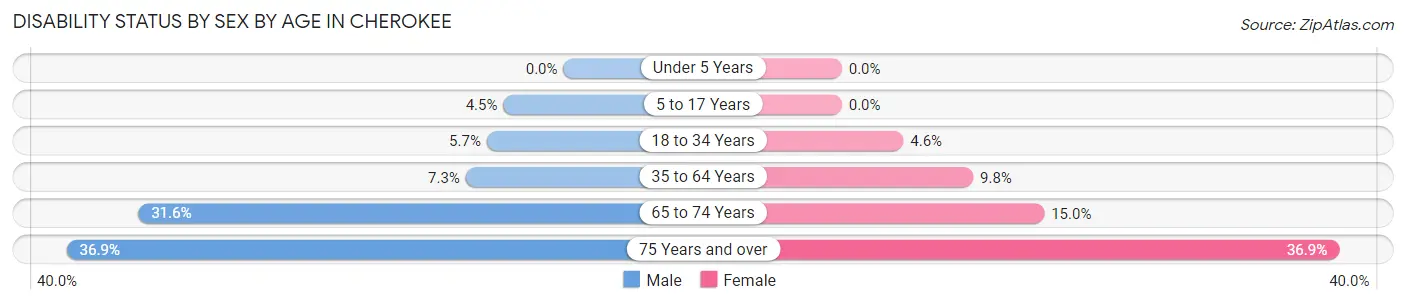
| Age Bracket | Male | Female |
| Under 5 Years | 0 (0.0%) | 0 (0.0%) |
| 5 to 17 Years | 19 (4.5%) | 0 (0.0%) |
| 18 to 34 Years | 25 (5.7%) | 18 (4.6%) |
| 35 to 64 Years | 68 (7.2%) | 93 (9.8%) |
| 65 to 74 Years | 89 (31.6%) | 52 (15.0%) |
| 75 Years and over | 59 (36.9%) | 117 (36.9%) |
Disability Class by Sex by Age in Cherokee
Disability Class: Hearing Difficulty
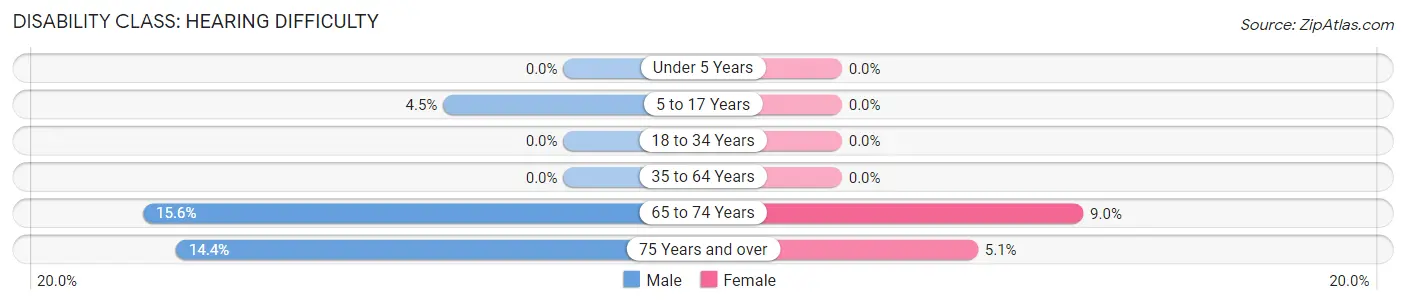
| Age Bracket | Male | Female |
| Under 5 Years | 0 (0.0%) | 0 (0.0%) |
| 5 to 17 Years | 19 (4.5%) | 0 (0.0%) |
| 18 to 34 Years | 0 (0.0%) | 0 (0.0%) |
| 35 to 64 Years | 0 (0.0%) | 0 (0.0%) |
| 65 to 74 Years | 44 (15.6%) | 31 (9.0%) |
| 75 Years and over | 23 (14.4%) | 16 (5.1%) |
Disability Class: Vision Difficulty
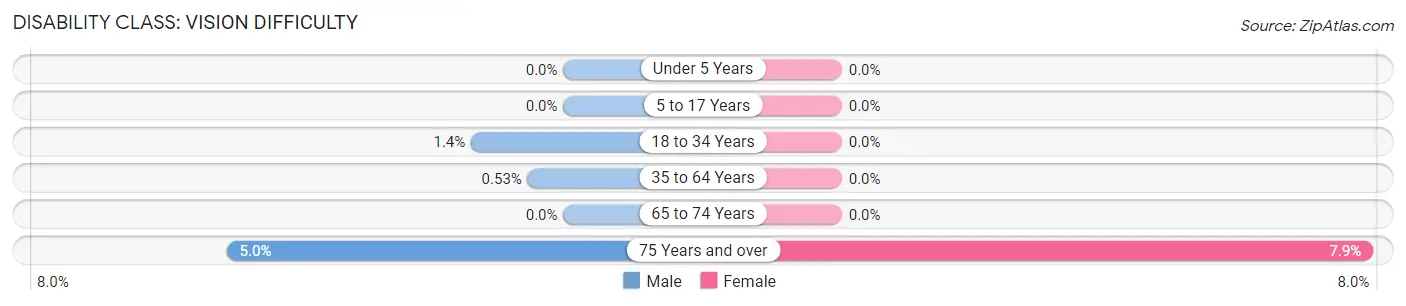
| Age Bracket | Male | Female |
| Under 5 Years | 0 (0.0%) | 0 (0.0%) |
| 5 to 17 Years | 0 (0.0%) | 0 (0.0%) |
| 18 to 34 Years | 6 (1.4%) | 0 (0.0%) |
| 35 to 64 Years | 5 (0.5%) | 0 (0.0%) |
| 65 to 74 Years | 0 (0.0%) | 0 (0.0%) |
| 75 Years and over | 8 (5.0%) | 25 (7.9%) |
Disability Class: Cognitive Difficulty
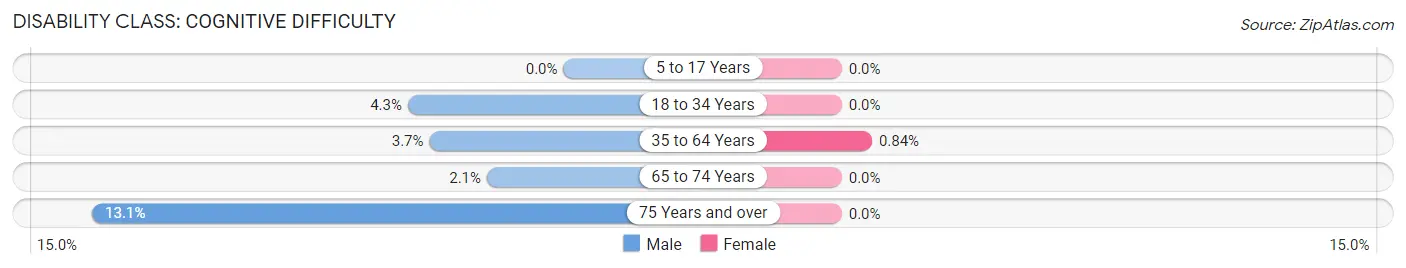
| Age Bracket | Male | Female |
| 5 to 17 Years | 0 (0.0%) | 0 (0.0%) |
| 18 to 34 Years | 19 (4.3%) | 0 (0.0%) |
| 35 to 64 Years | 35 (3.7%) | 8 (0.8%) |
| 65 to 74 Years | 6 (2.1%) | 0 (0.0%) |
| 75 Years and over | 21 (13.1%) | 0 (0.0%) |
Disability Class: Ambulatory Difficulty
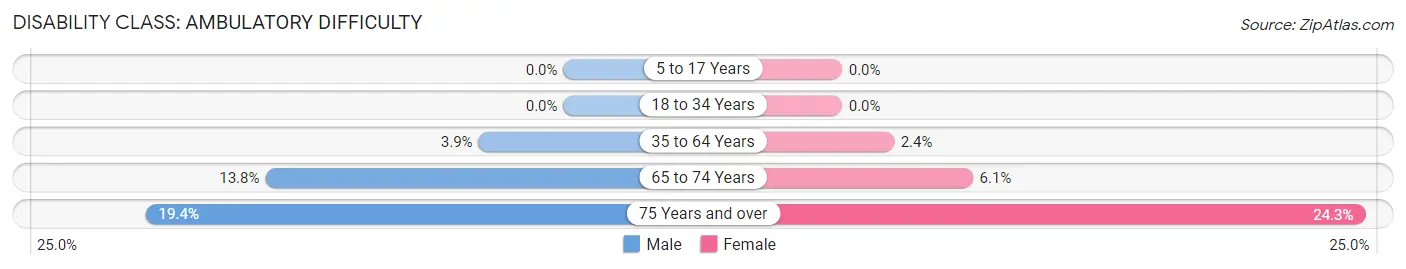
| Age Bracket | Male | Female |
| 5 to 17 Years | 0 (0.0%) | 0 (0.0%) |
| 18 to 34 Years | 0 (0.0%) | 0 (0.0%) |
| 35 to 64 Years | 37 (3.9%) | 23 (2.4%) |
| 65 to 74 Years | 39 (13.8%) | 21 (6.1%) |
| 75 Years and over | 31 (19.4%) | 77 (24.3%) |
Disability Class: Self-Care Difficulty
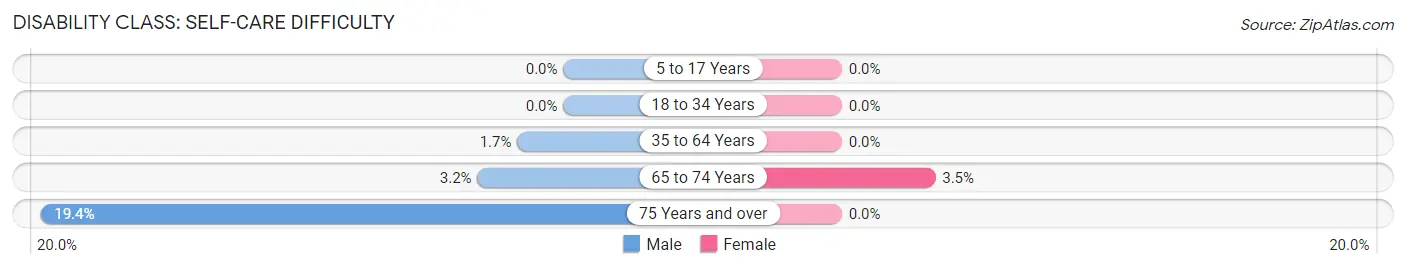
| Age Bracket | Male | Female |
| 5 to 17 Years | 0 (0.0%) | 0 (0.0%) |
| 18 to 34 Years | 0 (0.0%) | 0 (0.0%) |
| 35 to 64 Years | 16 (1.7%) | 0 (0.0%) |
| 65 to 74 Years | 9 (3.2%) | 12 (3.5%) |
| 75 Years and over | 31 (19.4%) | 0 (0.0%) |
Technology Access in Cherokee
Computing Device Access in Cherokee
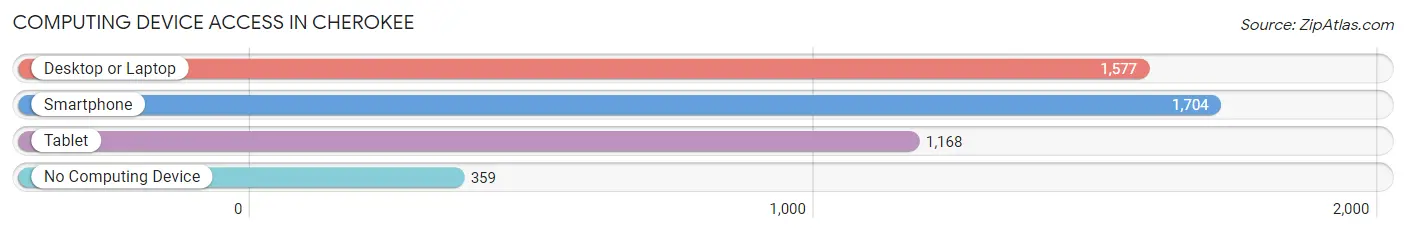
| Device Type | # Households | % Households |
| Desktop or Laptop | 1,577 | 67.0% |
| Smartphone | 1,704 | 72.4% |
| Tablet | 1,168 | 49.6% |
| No Computing Device | 359 | 15.2% |
| Total | 2,355 | 100.0% |
Internet Access in Cherokee
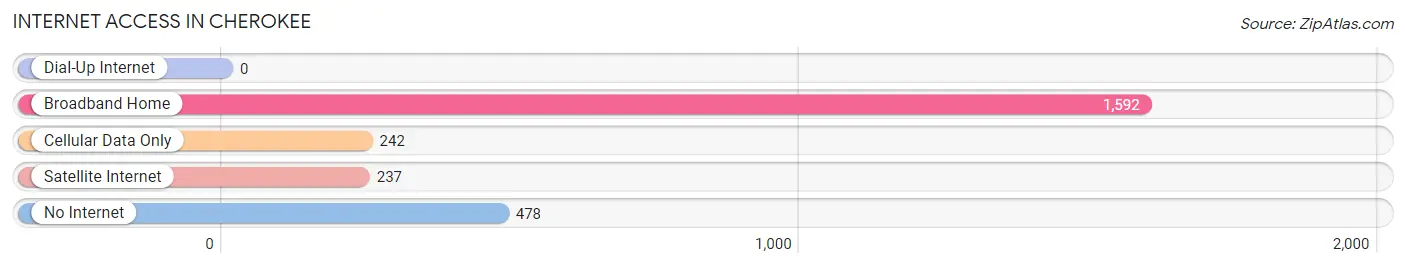
| Internet Type | # Households | % Households |
| Dial-Up Internet | 0 | 0.0% |
| Broadband Home | 1,592 | 67.6% |
| Cellular Data Only | 242 | 10.3% |
| Satellite Internet | 237 | 10.1% |
| No Internet | 478 | 20.3% |
| Total | 2,355 | 100.0% |
Cherokee Summary
Cherokee, Iowa is a city located in the northwest corner of the state, in the heart of the Loess Hills. It is the county seat of Cherokee County and is home to a population of just over 5,000 people. The city is known for its rich history, beautiful geography, and vibrant economy.
History
Cherokee was founded in 1869 by a group of settlers from the eastern United States. The city was named after the Cherokee Indians, who had been living in the area for centuries. The first settlers were mostly farmers, and the city quickly grew to become a major agricultural center. In 1872, the Chicago and North Western Railway arrived in Cherokee, connecting the city to the rest of the country. This allowed for the growth of the city’s economy and population.
In the late 19th century, Cherokee became a major center for the production of brick and tile. The city was also home to a number of other industries, including a flour mill, a creamery, and a furniture factory. In the early 20th century, the city’s economy shifted to focus more on tourism. The city was home to a number of popular tourist attractions, including the Cherokee Speedway, the Cherokee County Fairgrounds, and the Cherokee County Historical Museum.
Geography
Cherokee is located in the northwest corner of Iowa, in the heart of the Loess Hills. The city is situated on the Little Sioux River, which flows through the city and provides a number of recreational opportunities. The city is surrounded by rolling hills and lush farmland, making it a popular destination for outdoor enthusiasts.
The city is located just over an hour from Sioux City, Iowa, and two hours from Omaha, Nebraska. It is also within driving distance of several major cities, including Des Moines, Iowa, and Minneapolis, Minnesota.
Economy
Cherokee’s economy is largely based on agriculture and tourism. The city is home to a number of farms, which produce a variety of crops, including corn, soybeans, and hay. The city is also home to a number of tourist attractions, including the Cherokee Speedway, the Cherokee County Fairgrounds, and the Cherokee County Historical Museum.
The city is also home to a number of businesses, including manufacturing, retail, and healthcare. The city is home to a number of major employers, including Tyson Foods, Cherokee Regional Medical Center, and the Cherokee County Courthouse.
Demographics
As of the 2010 census, the population of Cherokee was 5,039. The city is predominantly white, with a population that is 94.3% white, 1.2% African American, 0.7% Native American, 0.5% Asian, and 2.3% from other races. The median household income in the city is $41,945, and the median age is 40.7 years.
Cherokee is a small city with a rich history, beautiful geography, and vibrant economy. The city is home to a diverse population and a number of businesses and attractions. It is a great place to live, work, and visit.
Common Questions
What is Per Capita Income in Cherokee?
Per Capita income in Cherokee is $31,292.
What is the Median Family Income in Cherokee?
Median Family Income in Cherokee is $87,396.
What is the Median Household income in Cherokee?
Median Household Income in Cherokee is $51,651.
What is Income or Wage Gap in Cherokee?
Income or Wage Gap in Cherokee is 39.0%.
Women in Cherokee earn 61.0 cents for every dollar earned by a man.
What is Inequality or Gini Index in Cherokee?
Inequality or Gini Index in Cherokee is 0.43.
What is the Total Population of Cherokee?
Total Population of Cherokee is 5,154.
What is the Total Male Population of Cherokee?
Total Male Population of Cherokee is 2,542.
What is the Total Female Population of Cherokee?
Total Female Population of Cherokee is 2,612.
What is the Ratio of Males per 100 Females in Cherokee?
There are 97.32 Males per 100 Females in Cherokee.
What is the Ratio of Females per 100 Males in Cherokee?
There are 102.75 Females per 100 Males in Cherokee.
What is the Median Population Age in Cherokee?
Median Population Age in Cherokee is 45.2 Years.
What is the Average Family Size in Cherokee
Average Family Size in Cherokee is 2.8 People.
What is the Average Household Size in Cherokee
Average Household Size in Cherokee is 2.0 People.
How Large is the Labor Force in Cherokee?
There are 2,618 People in the Labor Forcein in Cherokee.
What is the Percentage of People in the Labor Force in Cherokee?
62.1% of People are in the Labor Force in Cherokee.
What is the Unemployment Rate in Cherokee?
Unemployment Rate in Cherokee is 3.7%.