Hedrick, IA Map & Demographics
Hedrick Map
Hedrick Overview
$24,073
PER CAPITA INCOME
$79,688
AVG FAMILY INCOME
$59,375
AVG HOUSEHOLD INCOME
41.7%
WAGE / INCOME GAP [ % ]
58.3¢/ $1
WAGE / INCOME GAP [ $ ]
0.39
INEQUALITY / GINI INDEX
813
TOTAL POPULATION
426
MALE POPULATION
387
FEMALE POPULATION
110.08
MALES / 100 FEMALES
90.85
FEMALES / 100 MALES
38.5
MEDIAN AGE
3.9
AVG FAMILY SIZE
3.1
AVG HOUSEHOLD SIZE
333
LABOR FORCE [ PEOPLE ]
50.5%
PERCENT IN LABOR FORCE
9.3%
UNEMPLOYMENT RATE
Hedrick Zip Codes
Hedrick Area Codes
Income in Hedrick
Income Overview in Hedrick
Per Capita Income in Hedrick is $24,073, while median incomes of families and households are $79,688 and $59,375 respectively.
| Characteristic | Number | Measure |
| Per Capita Income | 813 | $24,073 |
| Median Family Income | 175 | $79,688 |
| Mean Family Income | 175 | $81,333 |
| Median Household Income | 260 | $59,375 |
| Mean Household Income | 260 | $71,483 |
| Income Deficit | 175 | $0 |
| Wage / Income Gap (%) | 813 | 41.67% |
| Wage / Income Gap ($) | 813 | 58.33¢ per $1 |
| Gini / Inequality Index | 813 | 0.39 |
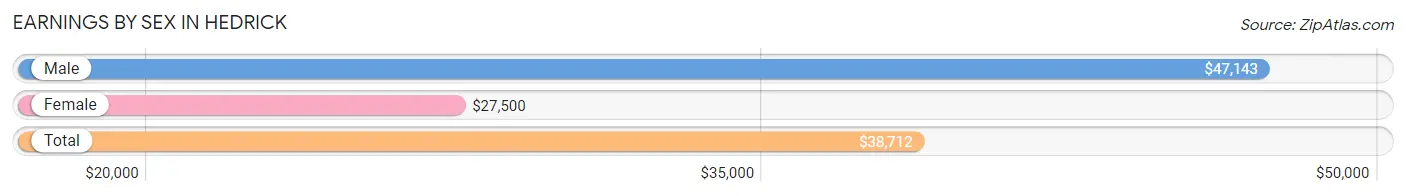
Earnings by Sex in Hedrick
Average Earnings in Hedrick are $38,712, $47,143 for men and $27,500 for women, a difference of 41.7%.
| Sex | Number | Average Earnings |
| Male | 190 (53.1%) | $47,143 |
| Female | 168 (46.9%) | $27,500 |
| Total | 358 (100.0%) | $38,712 |
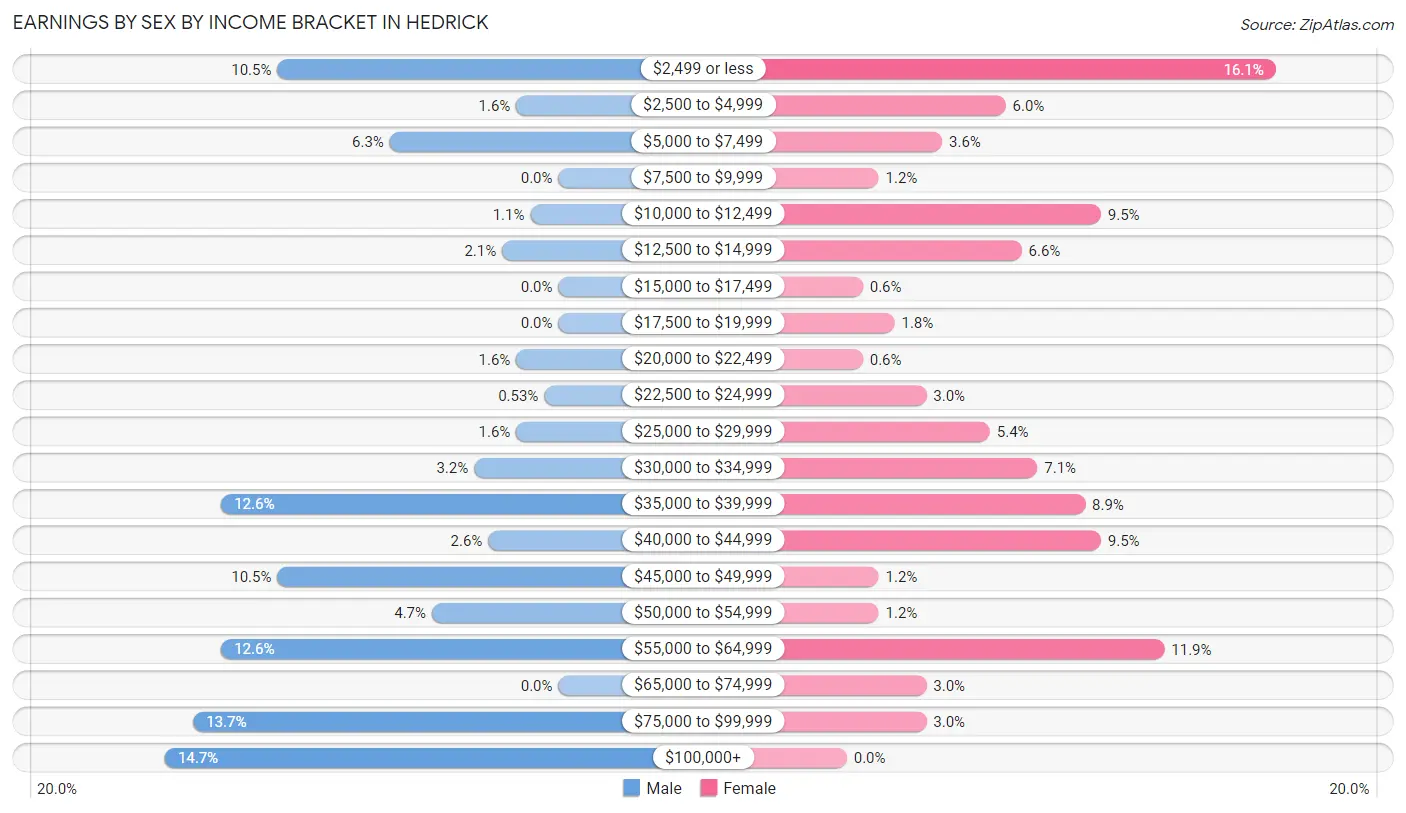
Earnings by Sex by Income Bracket in Hedrick
The most common earnings brackets in Hedrick are $100,000+ for men (28 | 14.7%) and $2,499 or less for women (27 | 16.1%).
| Income | Male | Female |
| $2,499 or less | 20 (10.5%) | 27 (16.1%) |
| $2,500 to $4,999 | 3 (1.6%) | 10 (5.9%) |
| $5,000 to $7,499 | 12 (6.3%) | 6 (3.6%) |
| $7,500 to $9,999 | 0 (0.0%) | 2 (1.2%) |
| $10,000 to $12,499 | 2 (1.1%) | 16 (9.5%) |
| $12,500 to $14,999 | 4 (2.1%) | 11 (6.6%) |
| $15,000 to $17,499 | 0 (0.0%) | 1 (0.6%) |
| $17,500 to $19,999 | 0 (0.0%) | 3 (1.8%) |
| $20,000 to $22,499 | 3 (1.6%) | 1 (0.6%) |
| $22,500 to $24,999 | 1 (0.5%) | 5 (3.0%) |
| $25,000 to $29,999 | 3 (1.6%) | 9 (5.4%) |
| $30,000 to $34,999 | 6 (3.2%) | 12 (7.1%) |
| $35,000 to $39,999 | 24 (12.6%) | 15 (8.9%) |
| $40,000 to $44,999 | 5 (2.6%) | 16 (9.5%) |
| $45,000 to $49,999 | 20 (10.5%) | 2 (1.2%) |
| $50,000 to $54,999 | 9 (4.7%) | 2 (1.2%) |
| $55,000 to $64,999 | 24 (12.6%) | 20 (11.9%) |
| $65,000 to $74,999 | 0 (0.0%) | 5 (3.0%) |
| $75,000 to $99,999 | 26 (13.7%) | 5 (3.0%) |
| $100,000+ | 28 (14.7%) | 0 (0.0%) |
| Total | 190 (100.0%) | 168 (100.0%) |
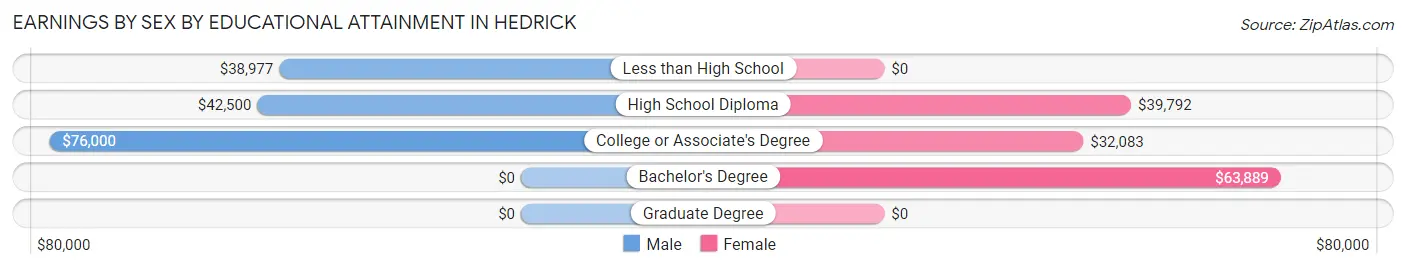
Earnings by Sex by Educational Attainment in Hedrick
Average earnings in Hedrick are $55,096 for men and $38,839 for women, a difference of 29.5%. Men with an educational attainment of college or associate's degree enjoy the highest average annual earnings of $76,000, while those with less than high school education earn the least with $38,977. Women with an educational attainment of bachelor's degree earn the most with the average annual earnings of $63,889, while those with college or associate's degree education have the smallest earnings of $32,083.
| Educational Attainment | Male Income | Female Income |
| Less than High School | $38,977 | $0 |
| High School Diploma | $42,500 | $39,792 |
| College or Associate's Degree | $76,000 | $32,083 |
| Bachelor's Degree | - | - |
| Graduate Degree | - | - |
| Total | $55,096 | $38,839 |
Family Income in Hedrick
Family Income Brackets in Hedrick
According to the Hedrick family income data, there are 49 families falling into the $100,000 to $149,999 income range, which is the most common income bracket and makes up 28.0% of all families.
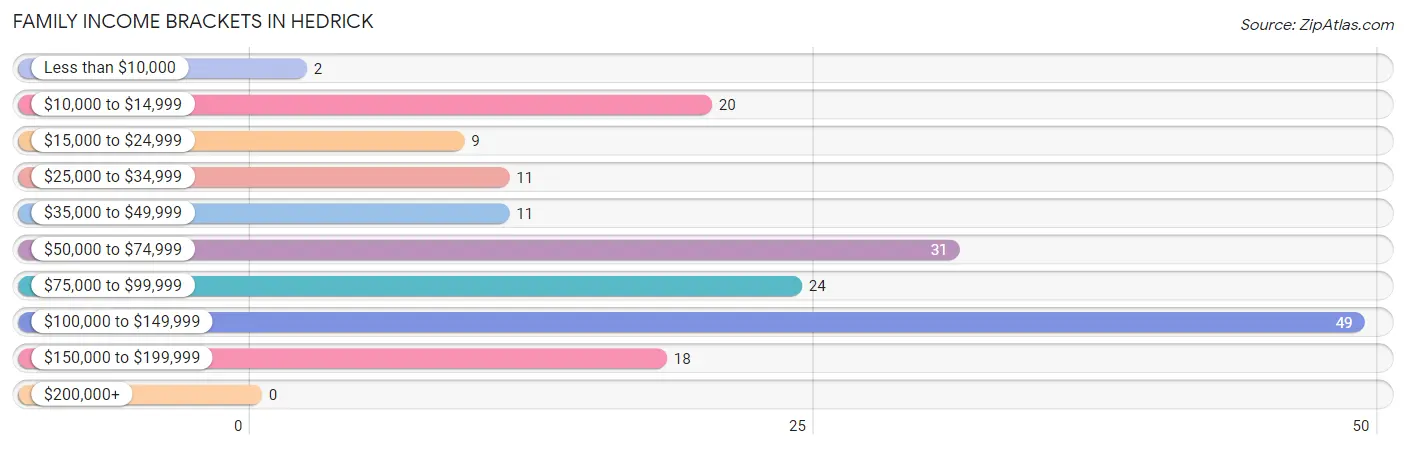
| Income Bracket | # Families | % Families |
| Less than $10,000 | 2 | 1.1% |
| $10,000 to $14,999 | 20 | 11.4% |
| $15,000 to $24,999 | 9 | 5.1% |
| $25,000 to $34,999 | 11 | 6.3% |
| $35,000 to $49,999 | 11 | 6.3% |
| $50,000 to $74,999 | 31 | 17.7% |
| $75,000 to $99,999 | 24 | 13.7% |
| $100,000 to $149,999 | 49 | 28.0% |
| $150,000 to $199,999 | 18 | 10.3% |
| $200,000+ | 0 | 0.0% |
Family Income by Famaliy Size in Hedrick
4-person families (26 | 14.9%) account for the highest median family income in Hedrick with $110,833 per family, while 2-person families (89 | 50.9%) have the highest median income of $39,062 per family member.
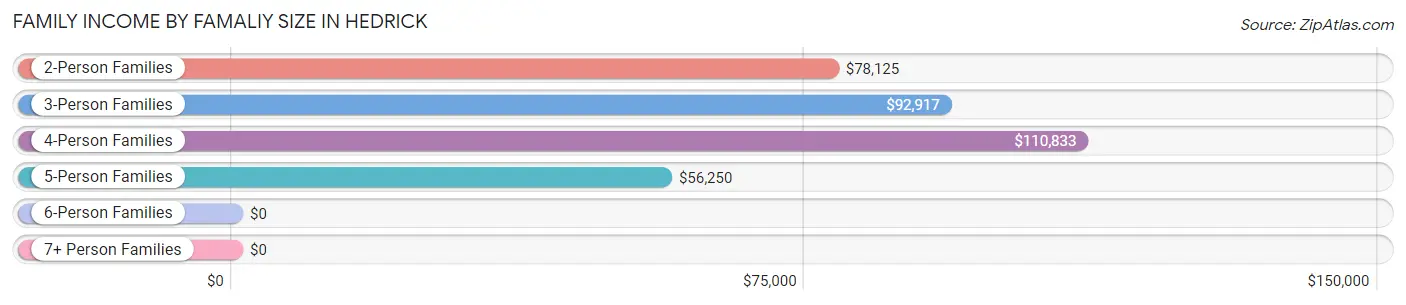
| Income Bracket | # Families | Median Income |
| 2-Person Families | 89 (50.9%) | $78,125 |
| 3-Person Families | 21 (12.0%) | $92,917 |
| 4-Person Families | 26 (14.9%) | $110,833 |
| 5-Person Families | 17 (9.7%) | $56,250 |
| 6-Person Families | 12 (6.9%) | $0 |
| 7+ Person Families | 10 (5.7%) | $0 |
| Total | 175 (100.0%) | $79,688 |
Family Income by Number of Earners in Hedrick
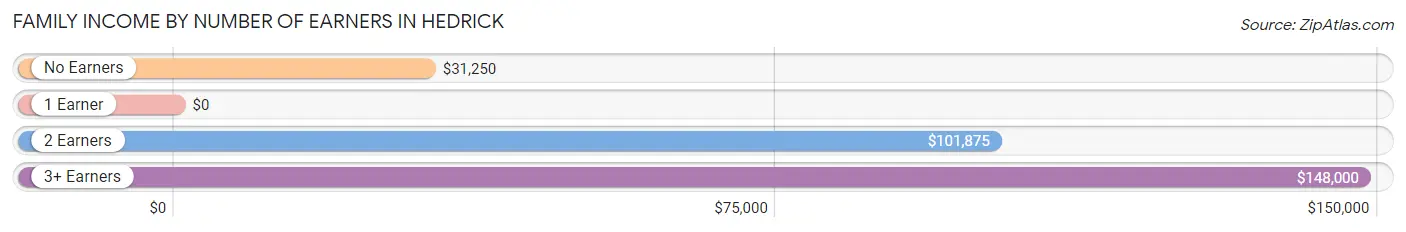
| Number of Earners | # Families | Median Income |
| No Earners | 30 (17.1%) | $31,250 |
| 1 Earner | 53 (30.3%) | $0 |
| 2 Earners | 66 (37.7%) | $101,875 |
| 3+ Earners | 26 (14.9%) | $148,000 |
| Total | 175 (100.0%) | $79,688 |
Household Income in Hedrick
Household Income Brackets in Hedrick
With 52 households falling in the category, the $50,000 to $74,999 income range is the most frequent in Hedrick, accounting for 20.0% of all households.
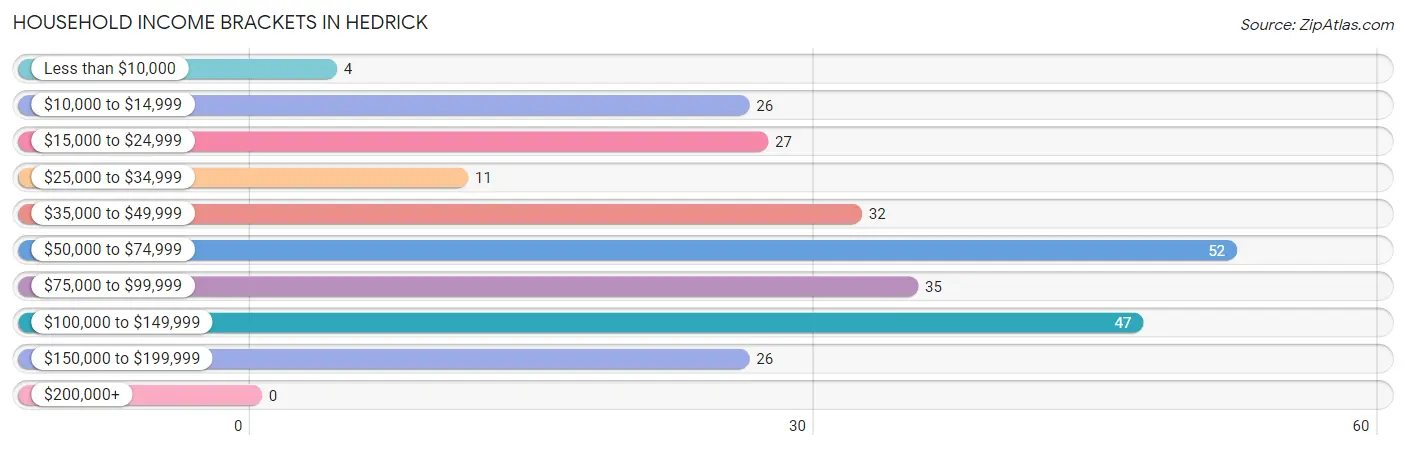
| Income Bracket | # Households | % Households |
| Less than $10,000 | 4 | 1.5% |
| $10,000 to $14,999 | 26 | 10.0% |
| $15,000 to $24,999 | 27 | 10.4% |
| $25,000 to $34,999 | 11 | 4.2% |
| $35,000 to $49,999 | 32 | 12.3% |
| $50,000 to $74,999 | 52 | 20.0% |
| $75,000 to $99,999 | 35 | 13.5% |
| $100,000 to $149,999 | 47 | 18.1% |
| $150,000 to $199,999 | 26 | 10.0% |
| $200,000+ | 0 | 0.0% |
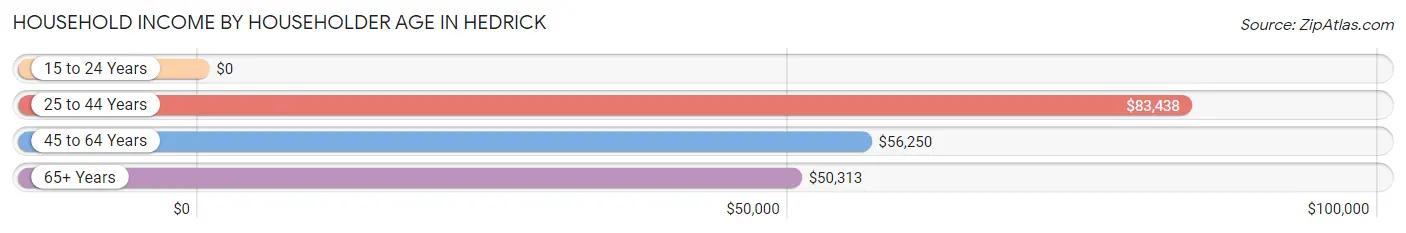
Household Income by Householder Age in Hedrick
The median household income in Hedrick is $59,375, with the highest median household income of $83,438 found in the 25 to 44 years age bracket for the primary householder. A total of 71 households (27.3%) fall into this category. Meanwhile, the 15 to 24 years age bracket for the primary householder has the lowest median household income of $0, with 6 households (2.3%) in this group.
| Income Bracket | # Households | Median Income |
| 15 to 24 Years | 6 (2.3%) | $0 |
| 25 to 44 Years | 71 (27.3%) | $83,438 |
| 45 to 64 Years | 78 (30.0%) | $56,250 |
| 65+ Years | 105 (40.4%) | $50,313 |
| Total | 260 (100.0%) | $59,375 |
Poverty in Hedrick
Income Below Poverty by Sex and Age in Hedrick
With 24.2% poverty level for males and 25.6% for females among the residents of Hedrick, under 5 year old males and 16 and 17 year old females are the most vulnerable to poverty, with 7 males (53.8%) and 16 females (69.6%) in their respective age groups living below the poverty level.
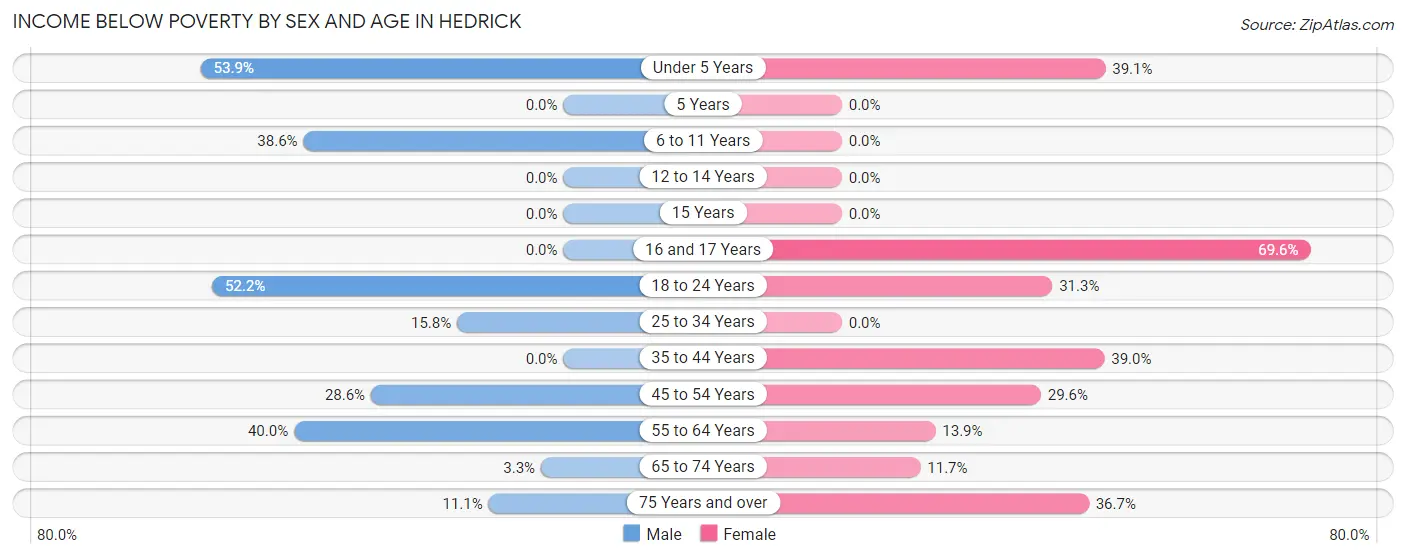
| Age Bracket | Male | Female |
| Under 5 Years | 7 (53.8%) | 9 (39.1%) |
| 5 Years | 0 (0.0%) | 0 (0.0%) |
| 6 to 11 Years | 22 (38.6%) | 0 (0.0%) |
| 12 to 14 Years | 0 (0.0%) | 0 (0.0%) |
| 15 Years | 0 (0.0%) | 0 (0.0%) |
| 16 and 17 Years | 0 (0.0%) | 16 (69.6%) |
| 18 to 24 Years | 36 (52.2%) | 15 (31.2%) |
| 25 to 34 Years | 6 (15.8%) | 0 (0.0%) |
| 35 to 44 Years | 0 (0.0%) | 23 (39.0%) |
| 45 to 54 Years | 12 (28.6%) | 13 (29.5%) |
| 55 to 64 Years | 16 (40.0%) | 5 (13.9%) |
| 65 to 74 Years | 2 (3.3%) | 7 (11.7%) |
| 75 Years and over | 2 (11.1%) | 11 (36.7%) |
| Total | 103 (24.2%) | 99 (25.6%) |
Income Above Poverty by Sex and Age in Hedrick
According to the poverty statistics in Hedrick, males aged 5 years and females aged 5 years are the age groups that are most secure financially, with 100.0% of males and 100.0% of females in these age groups living above the poverty line.
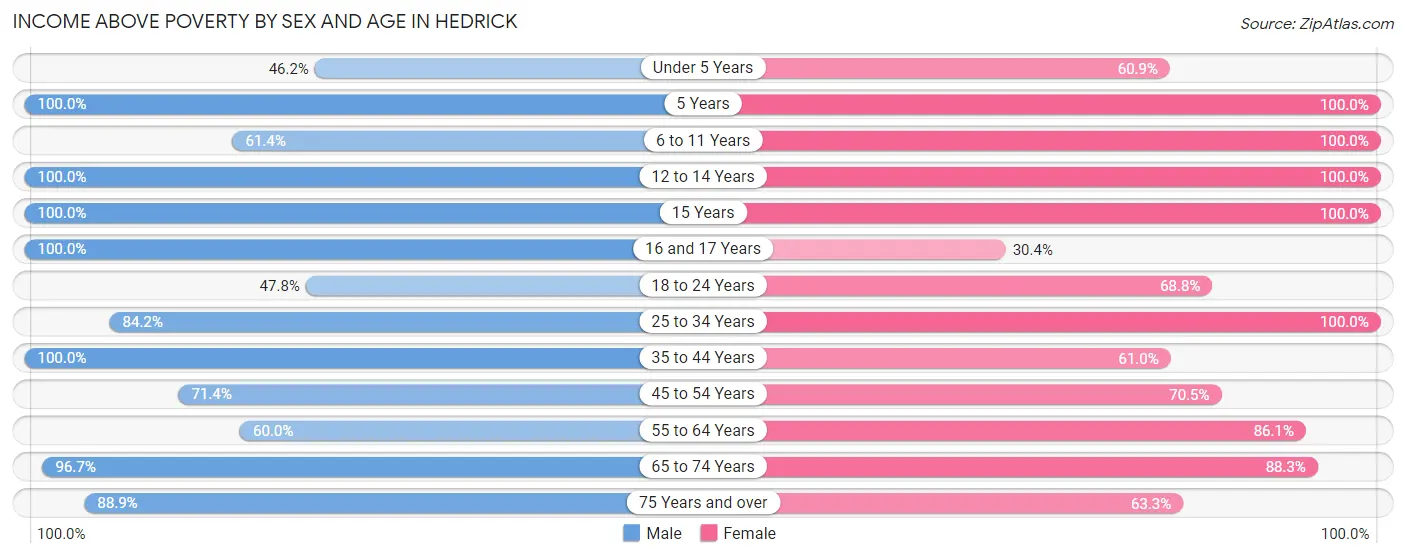
| Age Bracket | Male | Female |
| Under 5 Years | 6 (46.2%) | 14 (60.9%) |
| 5 Years | 3 (100.0%) | 2 (100.0%) |
| 6 to 11 Years | 35 (61.4%) | 5 (100.0%) |
| 12 to 14 Years | 18 (100.0%) | 25 (100.0%) |
| 15 Years | 3 (100.0%) | 4 (100.0%) |
| 16 and 17 Years | 17 (100.0%) | 7 (30.4%) |
| 18 to 24 Years | 33 (47.8%) | 33 (68.8%) |
| 25 to 34 Years | 32 (84.2%) | 28 (100.0%) |
| 35 to 44 Years | 48 (100.0%) | 36 (61.0%) |
| 45 to 54 Years | 30 (71.4%) | 31 (70.5%) |
| 55 to 64 Years | 24 (60.0%) | 31 (86.1%) |
| 65 to 74 Years | 58 (96.7%) | 53 (88.3%) |
| 75 Years and over | 16 (88.9%) | 19 (63.3%) |
| Total | 323 (75.8%) | 288 (74.4%) |
Income Below Poverty Among Married-Couple Families in Hedrick
The poverty statistics for married-couple families in Hedrick show that 8.3% or 12 of the total 144 families live below the poverty line. Families with 1 or 2 children have the highest poverty rate of 14.0%, comprising of 6 families. On the other hand, families with 3 or 4 children have the lowest poverty rate of 0.0%, which includes 0 families.
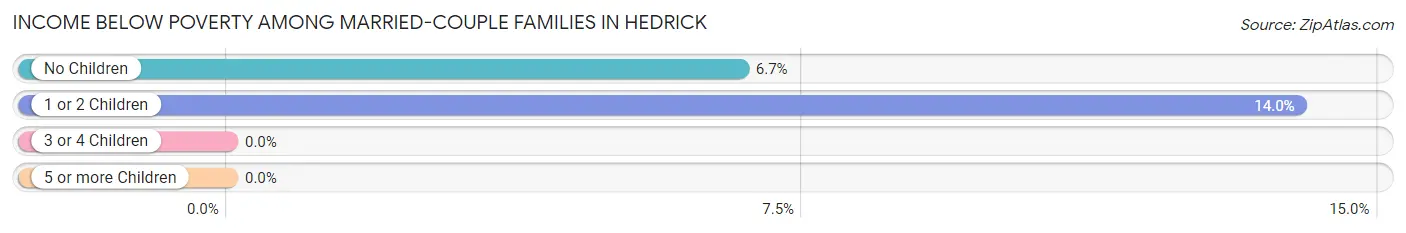
| Children | Above Poverty | Below Poverty |
| No Children | 84 (93.3%) | 6 (6.7%) |
| 1 or 2 Children | 37 (86.1%) | 6 (14.0%) |
| 3 or 4 Children | 8 (100.0%) | 0 (0.0%) |
| 5 or more Children | 3 (100.0%) | 0 (0.0%) |
| Total | 132 (91.7%) | 12 (8.3%) |
Income Below Poverty Among Single-Parent Households in Hedrick
According to the poverty data in Hedrick, 57.1% or 12 single-father households and 10.0% or 1 single-mother households are living below the poverty line. Among single-father households, those with 1 or 2 children have the highest poverty rate, with 12 households (63.2%) experiencing poverty. Likewise, among single-mother households, those with 1 or 2 children have the highest poverty rate, with 1 households (16.7%) falling below the poverty line.
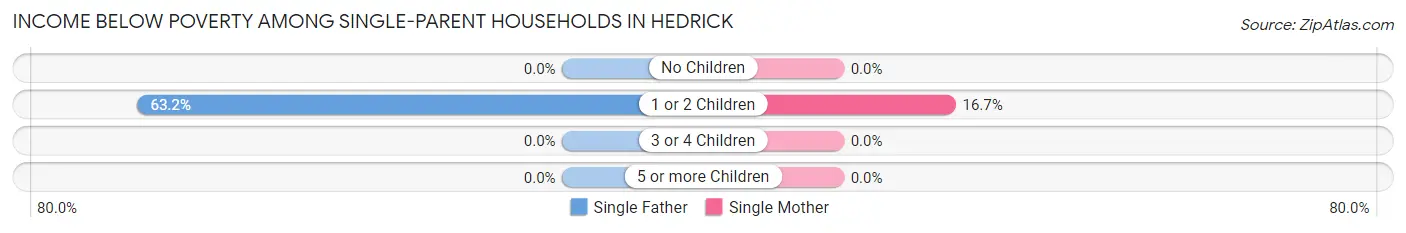
| Children | Single Father | Single Mother |
| No Children | 0 (0.0%) | 0 (0.0%) |
| 1 or 2 Children | 12 (63.2%) | 1 (16.7%) |
| 3 or 4 Children | 0 (0.0%) | 0 (0.0%) |
| 5 or more Children | 0 (0.0%) | 0 (0.0%) |
| Total | 12 (57.1%) | 1 (10.0%) |
Income Below Poverty Among Married-Couple vs Single-Parent Households in Hedrick
The poverty data for Hedrick shows that 12 of the married-couple family households (8.3%) and 13 of the single-parent households (41.9%) are living below the poverty level. Within the married-couple family households, those with 1 or 2 children have the highest poverty rate, with 6 households (14.0%) falling below the poverty line. Among the single-parent households, those with 1 or 2 children have the highest poverty rate, with 13 household (52.0%) living below poverty.
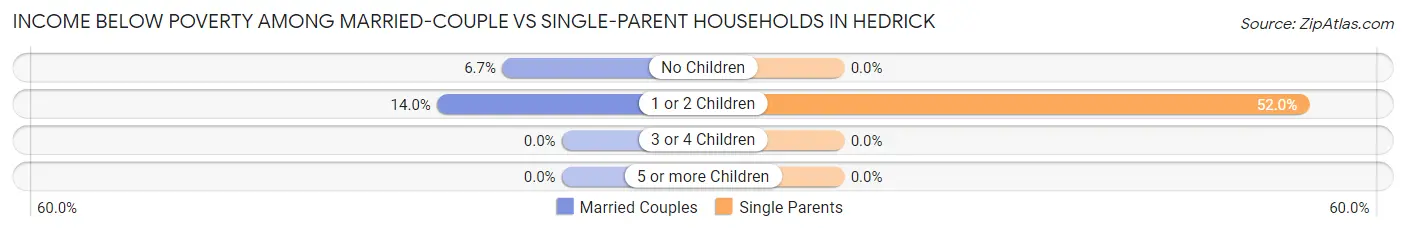
| Children | Married-Couple Families | Single-Parent Households |
| No Children | 6 (6.7%) | 0 (0.0%) |
| 1 or 2 Children | 6 (14.0%) | 13 (52.0%) |
| 3 or 4 Children | 0 (0.0%) | 0 (0.0%) |
| 5 or more Children | 0 (0.0%) | 0 (0.0%) |
| Total | 12 (8.3%) | 13 (41.9%) |
Race in Hedrick
The most populous races in Hedrick are White / Caucasian (777 | 95.6%), Two or more Races (36 | 4.4%), and Hispanic or Latino (2 | 0.3%).
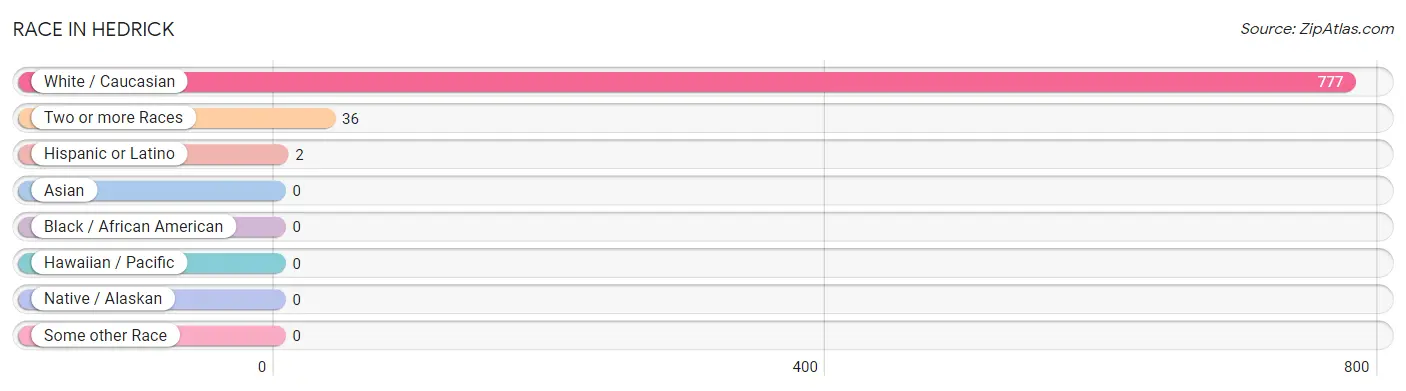
| Race | # Population | % Population |
| Asian | 0 | 0.0% |
| Black / African American | 0 | 0.0% |
| Hawaiian / Pacific | 0 | 0.0% |
| Hispanic or Latino | 2 | 0.3% |
| Native / Alaskan | 0 | 0.0% |
| White / Caucasian | 777 | 95.6% |
| Two or more Races | 36 | 4.4% |
| Some other Race | 0 | 0.0% |
| Total | 813 | 100.0% |
Ancestry in Hedrick
The most populous ancestries reported in Hedrick are German (250 | 30.7%), Irish (101 | 12.4%), English (59 | 7.3%), American (40 | 4.9%), and Dutch (35 | 4.3%), together accounting for 59.7% of all Hedrick residents.
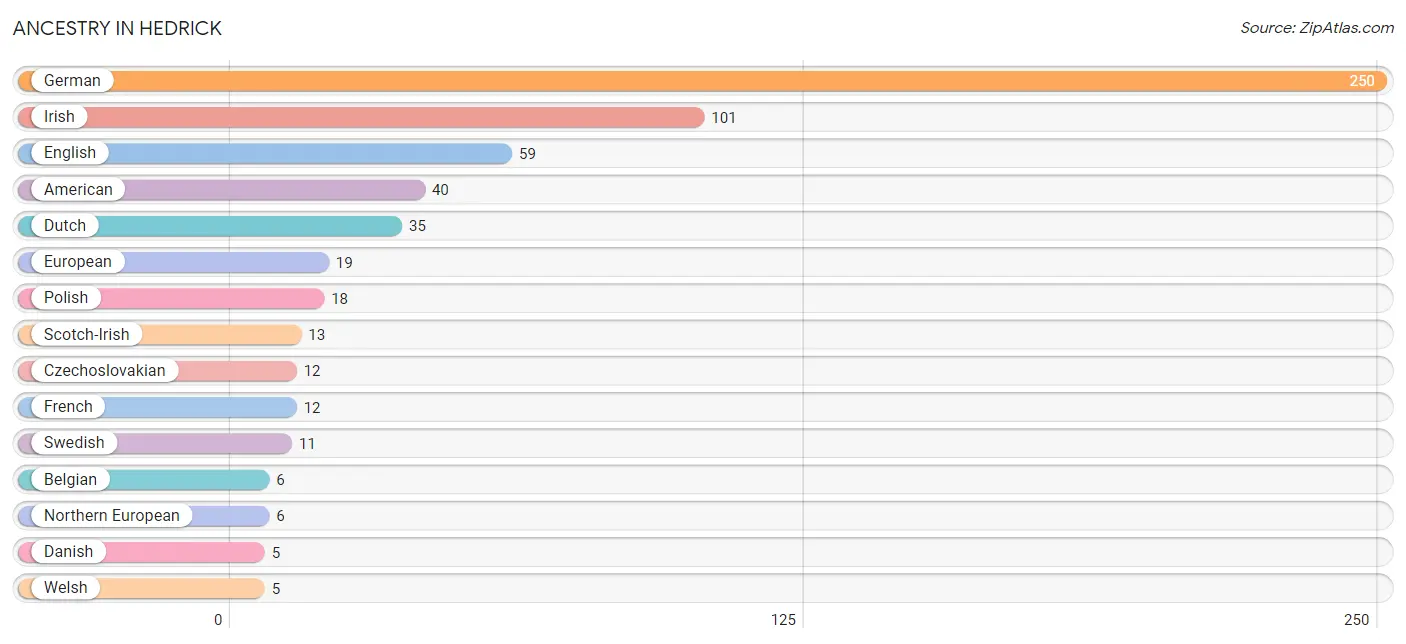
| Ancestry | # Population | % Population |
| American | 40 | 4.9% |
| Belgian | 6 | 0.7% |
| Czechoslovakian | 12 | 1.5% |
| Danish | 5 | 0.6% |
| Dutch | 35 | 4.3% |
| English | 59 | 7.3% |
| European | 19 | 2.3% |
| French | 12 | 1.5% |
| French Canadian | 1 | 0.1% |
| German | 250 | 30.7% |
| Irish | 101 | 12.4% |
| Lithuanian | 3 | 0.4% |
| Mexican | 2 | 0.3% |
| Northern European | 6 | 0.7% |
| Norwegian | 1 | 0.1% |
| Pennsylvania German | 4 | 0.5% |
| Polish | 18 | 2.2% |
| Portuguese | 2 | 0.3% |
| Scotch-Irish | 13 | 1.6% |
| Swedish | 11 | 1.3% |
| Welsh | 5 | 0.6% | View All 21 Rows |
Immigrants in Hedrick

| Immigration Origin | # Population | % Population | View All 0 Rows |
Sex and Age in Hedrick
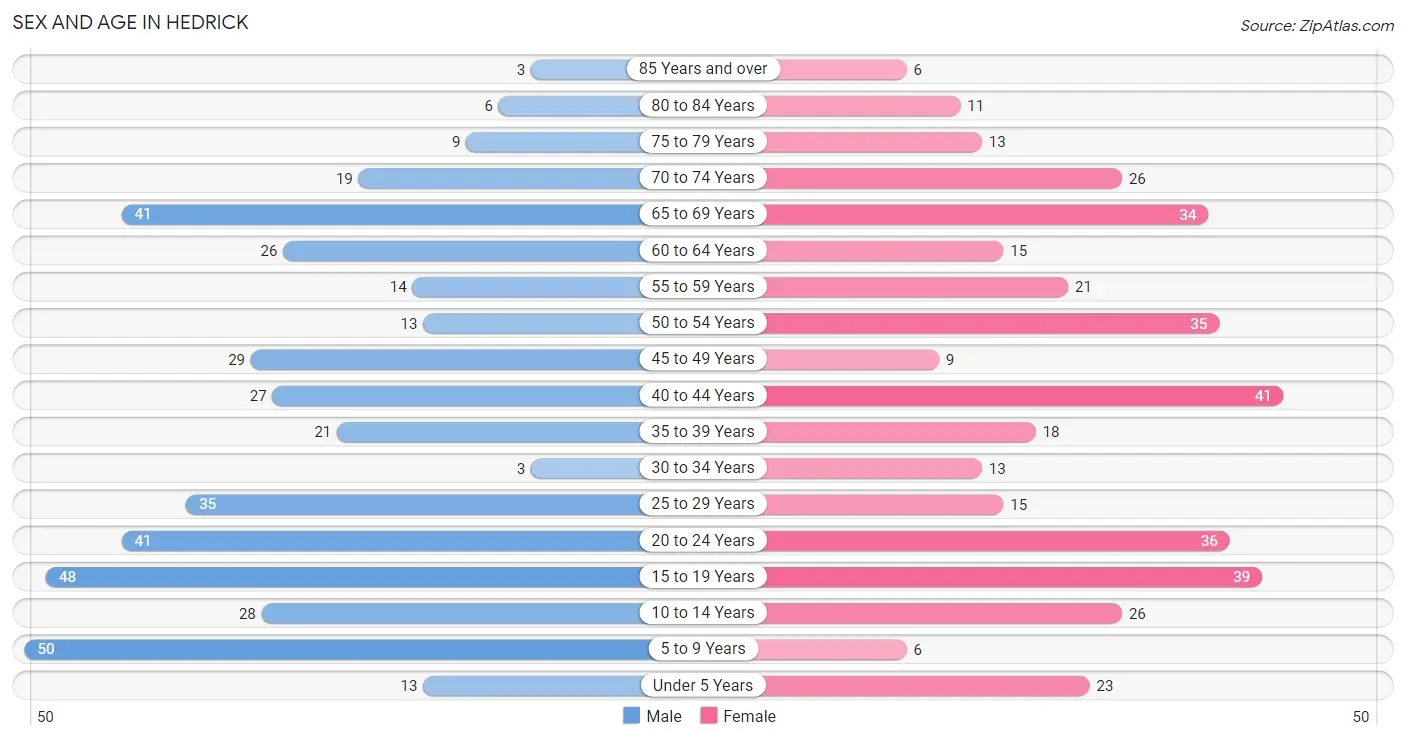
Sex and Age in Hedrick
The most populous age groups in Hedrick are 5 to 9 Years (50 | 11.7%) for men and 40 to 44 Years (41 | 10.6%) for women.
| Age Bracket | Male | Female |
| Under 5 Years | 13 (3.0%) | 23 (5.9%) |
| 5 to 9 Years | 50 (11.7%) | 6 (1.5%) |
| 10 to 14 Years | 28 (6.6%) | 26 (6.7%) |
| 15 to 19 Years | 48 (11.3%) | 39 (10.1%) |
| 20 to 24 Years | 41 (9.6%) | 36 (9.3%) |
| 25 to 29 Years | 35 (8.2%) | 15 (3.9%) |
| 30 to 34 Years | 3 (0.7%) | 13 (3.4%) |
| 35 to 39 Years | 21 (4.9%) | 18 (4.6%) |
| 40 to 44 Years | 27 (6.3%) | 41 (10.6%) |
| 45 to 49 Years | 29 (6.8%) | 9 (2.3%) |
| 50 to 54 Years | 13 (3.0%) | 35 (9.0%) |
| 55 to 59 Years | 14 (3.3%) | 21 (5.4%) |
| 60 to 64 Years | 26 (6.1%) | 15 (3.9%) |
| 65 to 69 Years | 41 (9.6%) | 34 (8.8%) |
| 70 to 74 Years | 19 (4.5%) | 26 (6.7%) |
| 75 to 79 Years | 9 (2.1%) | 13 (3.4%) |
| 80 to 84 Years | 6 (1.4%) | 11 (2.8%) |
| 85 Years and over | 3 (0.7%) | 6 (1.5%) |
| Total | 426 (100.0%) | 387 (100.0%) |
Families and Households in Hedrick
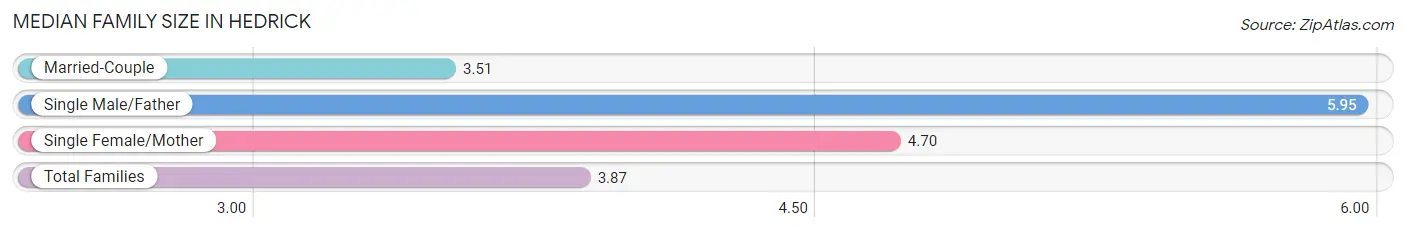
Median Family Size in Hedrick
The median family size in Hedrick is 3.87 persons per family, with single male/father families (21 | 12.0%) accounting for the largest median family size of 5.95 persons per family. On the other hand, married-couple families (144 | 82.3%) represent the smallest median family size with 3.51 persons per family.
| Family Type | # Families | Family Size |
| Married-Couple | 144 (82.3%) | 3.51 |
| Single Male/Father | 21 (12.0%) | 5.95 |
| Single Female/Mother | 10 (5.7%) | 4.70 |
| Total Families | 175 (100.0%) | 3.87 |
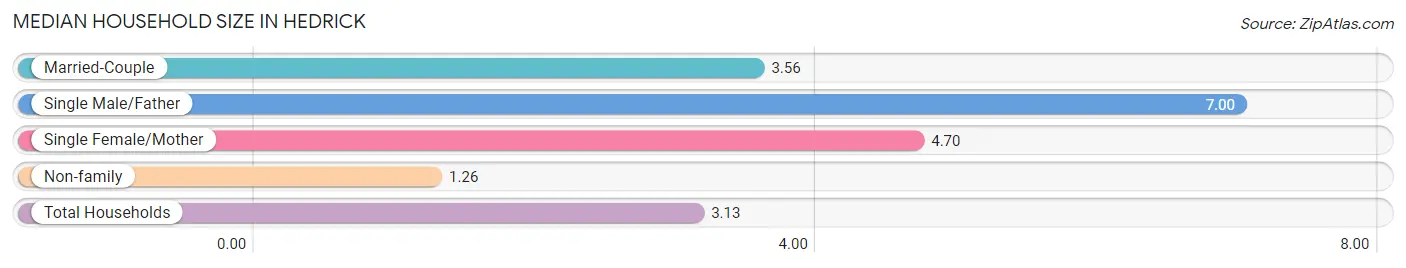
Median Household Size in Hedrick
The median household size in Hedrick is 3.13 persons per household, with single male/father households (21 | 8.1%) accounting for the largest median household size of 7 persons per household. non-family households (85 | 32.7%) represent the smallest median household size with 1.26 persons per household.
| Household Type | # Households | Household Size |
| Married-Couple | 144 (55.4%) | 3.56 |
| Single Male/Father | 21 (8.1%) | 7.00 |
| Single Female/Mother | 10 (3.8%) | 4.70 |
| Non-family | 85 (32.7%) | 1.26 |
| Total Households | 260 (100.0%) | 3.13 |
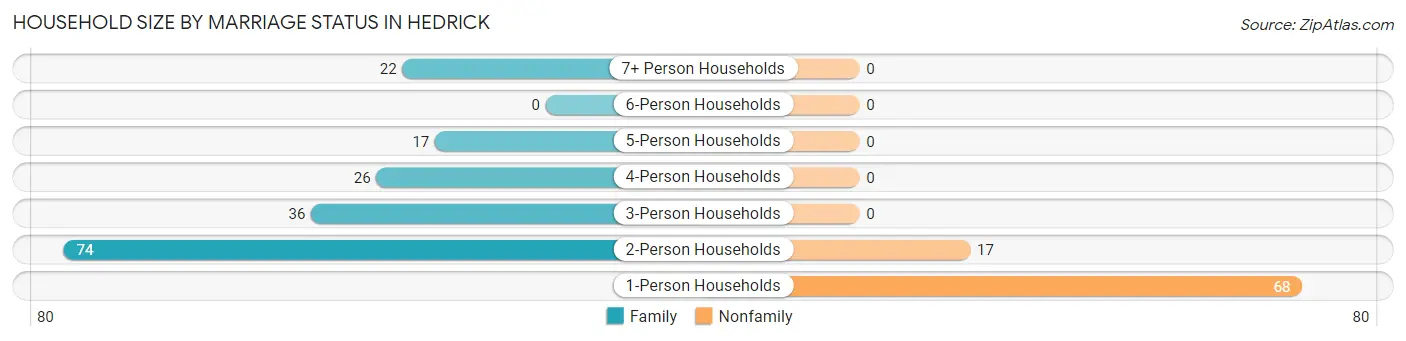
Household Size by Marriage Status in Hedrick
Out of a total of 260 households in Hedrick, 175 (67.3%) are family households, while 85 (32.7%) are nonfamily households. The most numerous type of family households are 2-person households, comprising 74, and the most common type of nonfamily households are 1-person households, comprising 68.
| Household Size | Family Households | Nonfamily Households |
| 1-Person Households | - | 68 (26.2%) |
| 2-Person Households | 74 (28.5%) | 17 (6.5%) |
| 3-Person Households | 36 (13.9%) | 0 (0.0%) |
| 4-Person Households | 26 (10.0%) | 0 (0.0%) |
| 5-Person Households | 17 (6.5%) | 0 (0.0%) |
| 6-Person Households | 0 (0.0%) | 0 (0.0%) |
| 7+ Person Households | 22 (8.5%) | 0 (0.0%) |
| Total | 175 (67.3%) | 85 (32.7%) |
Female Fertility in Hedrick
Fertility by Age in Hedrick
Average fertility rate in Hedrick is 29.0 births per 1,000 women. Women in the age bracket of 20 to 34 years have the highest fertility rate with 78.0 births per 1,000 women. Women in the age bracket of 20 to 34 years acount for 100.0% of all women with births.
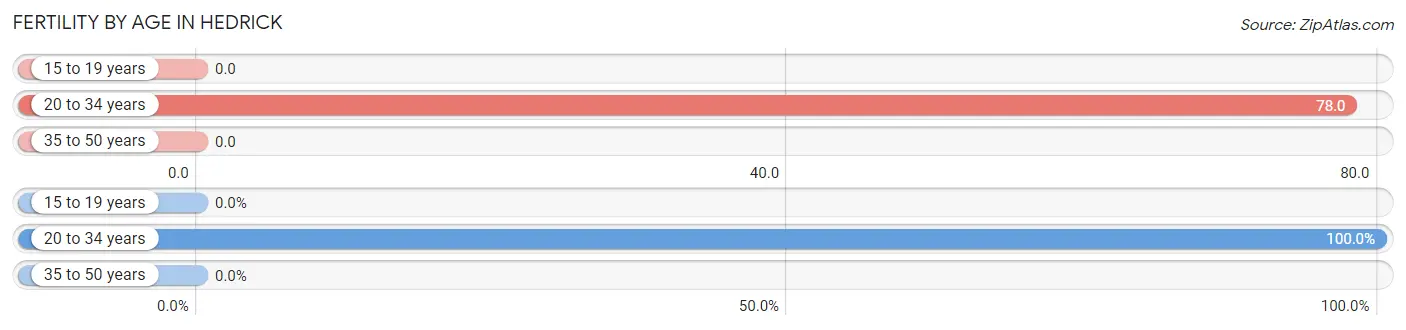
| Age Bracket | Women with Births | Births / 1,000 Women |
| 15 to 19 years | 0 (0.0%) | 0.0 |
| 20 to 34 years | 5 (100.0%) | 78.0 |
| 35 to 50 years | 0 (0.0%) | 0.0 |
| Total | 5 (100.0%) | 29.0 |
Fertility by Age by Marriage Status in Hedrick
80.0% of women with births (5) in Hedrick are married. The highest percentage of unmarried women with births falls into 20 to 34 years age bracket with 20.0% of them unmarried at the time of birth, while the lowest percentage of unmarried women with births belong to 20 to 34 years age bracket with 20.0% of them unmarried.
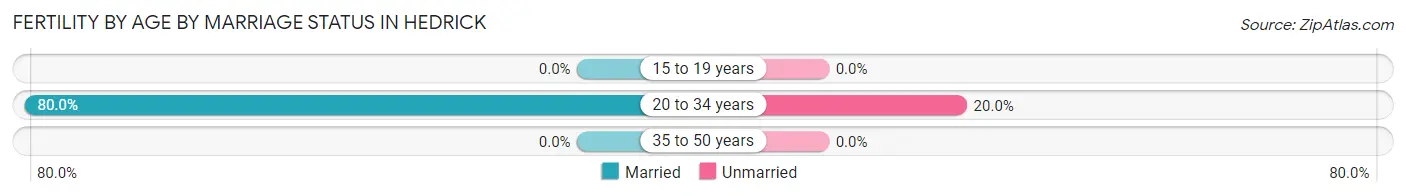
| Age Bracket | Married | Unmarried |
| 15 to 19 years | 0 (0.0%) | 0 (0.0%) |
| 20 to 34 years | 4 (80.0%) | 1 (20.0%) |
| 35 to 50 years | 0 (0.0%) | 0 (0.0%) |
| Total | 4 (80.0%) | 1 (20.0%) |
Fertility by Education in Hedrick
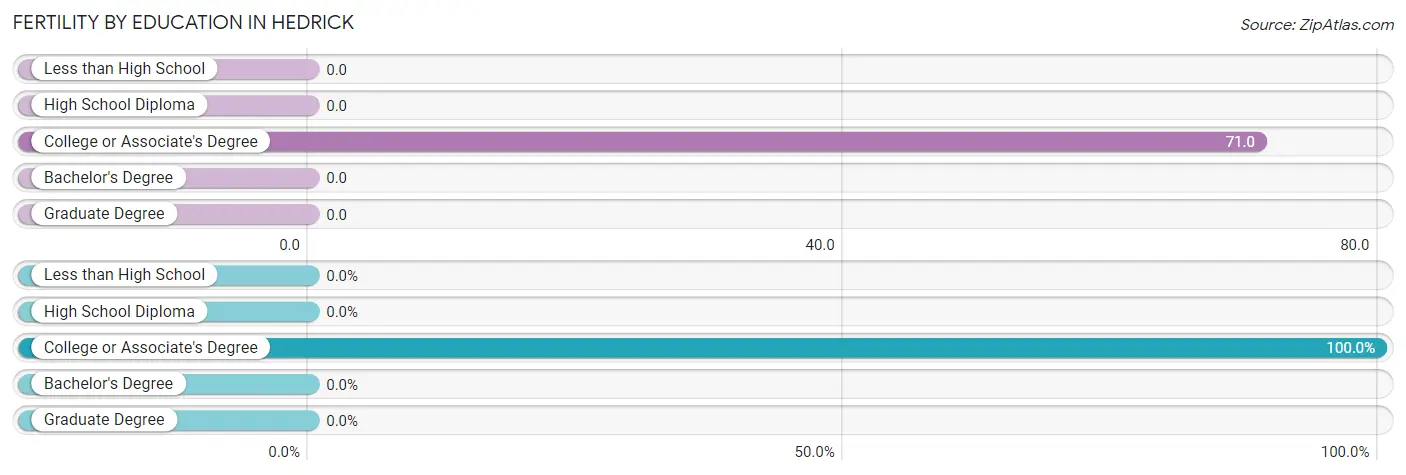
| Educational Attainment | Women with Births | Births / 1,000 Women |
| Less than High School | 0 (0.0%) | 0.0 |
| High School Diploma | 0 (0.0%) | 0.0 |
| College or Associate's Degree | 5 (100.0%) | 71.0 |
| Bachelor's Degree | 0 (0.0%) | 0.0 |
| Graduate Degree | 0 (0.0%) | 0.0 |
| Total | 5 (100.0%) | 29.0 |
Fertility by Education by Marriage Status in Hedrick
20.0% of women with births in Hedrick are unmarried. Women with the educational attainment of college or associate's degree are most likely to be married with 80.0% of them married at childbirth, while women with the educational attainment of college or associate's degree are least likely to be married with 20.0% of them unmarried at childbirth.
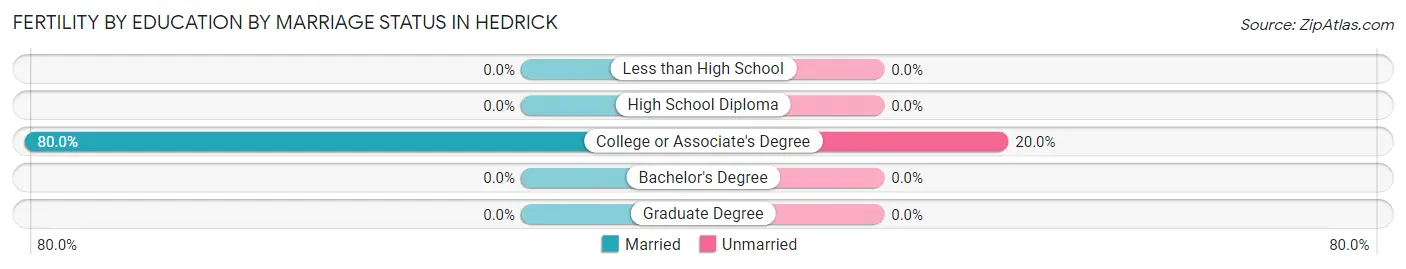
| Educational Attainment | Married | Unmarried |
| Less than High School | 0 (0.0%) | 0 (0.0%) |
| High School Diploma | 0 (0.0%) | 0 (0.0%) |
| College or Associate's Degree | 4 (80.0%) | 1 (20.0%) |
| Bachelor's Degree | 0 (0.0%) | 0 (0.0%) |
| Graduate Degree | 0 (0.0%) | 0 (0.0%) |
| Total | 4 (80.0%) | 1 (20.0%) |
Employment Characteristics in Hedrick
Employment by Class of Employer in Hedrick
Among the 301 employed individuals in Hedrick, private company employees (222 | 73.8%), local government employees (31 | 10.3%), and not-for-profit organizations (21 | 7.0%) make up the most common classes of employment.
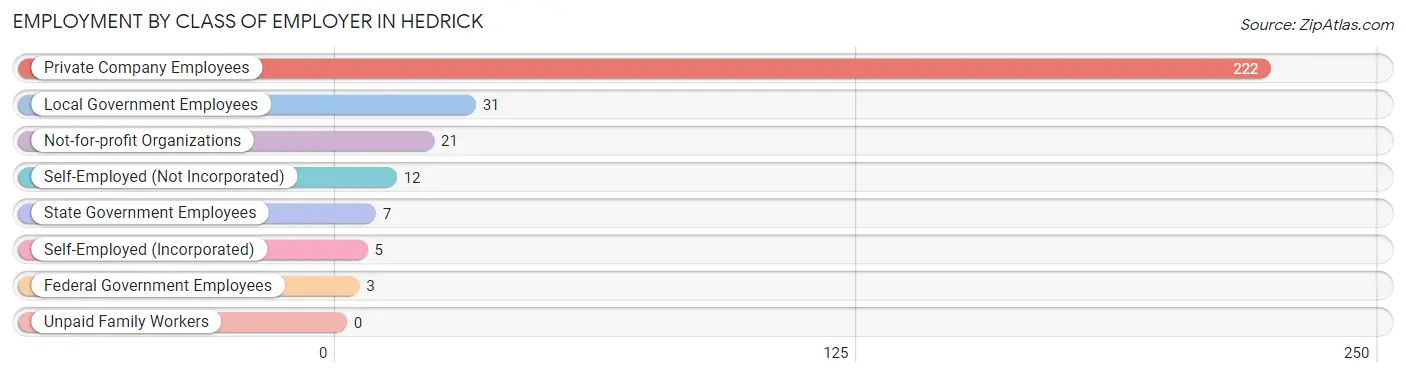
| Employer Class | # Employees | % Employees |
| Private Company Employees | 222 | 73.8% |
| Self-Employed (Incorporated) | 5 | 1.7% |
| Self-Employed (Not Incorporated) | 12 | 4.0% |
| Not-for-profit Organizations | 21 | 7.0% |
| Local Government Employees | 31 | 10.3% |
| State Government Employees | 7 | 2.3% |
| Federal Government Employees | 3 | 1.0% |
| Unpaid Family Workers | 0 | 0.0% |
| Total | 301 | 100.0% |
Employment Status by Age in Hedrick
According to the labor force statistics for Hedrick, out of the total population over 16 years of age (660), 50.5% or 333 individuals are in the labor force, with 9.3% or 31 of them unemployed. The age group with the highest labor force participation rate is 25 to 29 years, with 94.0% or 47 individuals in the labor force. Within the labor force, the 20 to 24 years age range has the highest percentage of unemployed individuals, with 20.8% or 11 of them being unemployed.
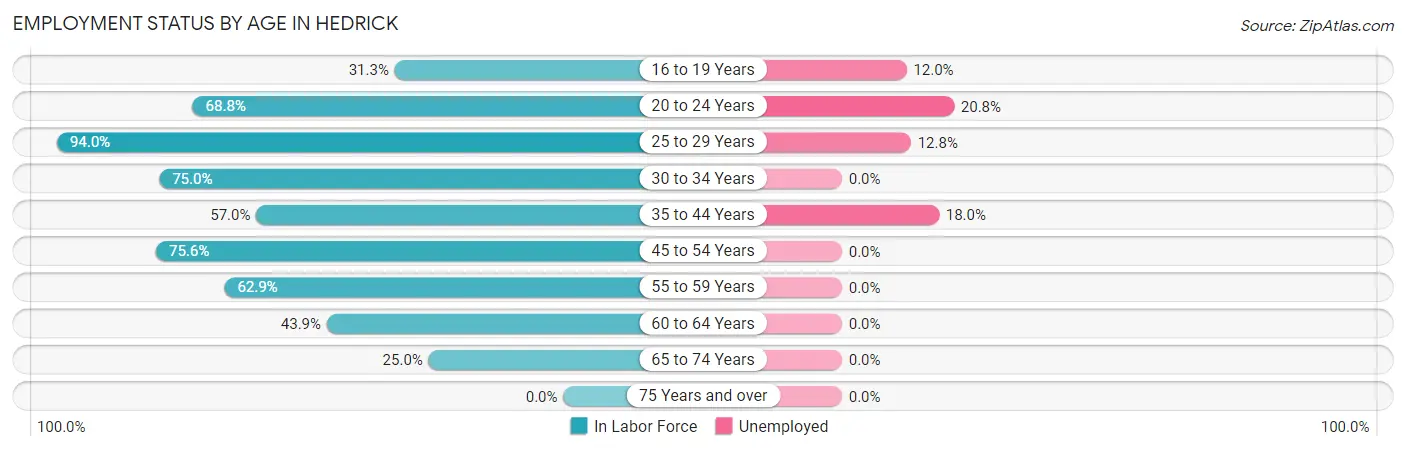
| Age Bracket | In Labor Force | Unemployed |
| 16 to 19 Years | 25 (31.3%) | 3 (12.0%) |
| 20 to 24 Years | 53 (68.8%) | 11 (20.8%) |
| 25 to 29 Years | 47 (94.0%) | 6 (12.8%) |
| 30 to 34 Years | 12 (75.0%) | 0 (0.0%) |
| 35 to 44 Years | 61 (57.0%) | 11 (18.0%) |
| 45 to 54 Years | 65 (75.6%) | 0 (0.0%) |
| 55 to 59 Years | 22 (62.9%) | 0 (0.0%) |
| 60 to 64 Years | 18 (43.9%) | 0 (0.0%) |
| 65 to 74 Years | 30 (25.0%) | 0 (0.0%) |
| 75 Years and over | 0 (0.0%) | 0 (0.0%) |
| Total | 333 (50.5%) | 31 (9.3%) |
Employment Status by Educational Attainment in Hedrick
According to labor force statistics for Hedrick, 67.2% of individuals (225) out of the total population between 25 and 64 years of age (335) are in the labor force, with 7.6% or 17 of them being unemployed. The group with the highest labor force participation rate are those with the educational attainment of college / associate degree, with 82.1% or 92 individuals in the labor force. Within the labor force, individuals with less than high school education have the highest percentage of unemployment, with 73.3% or 11 of them being unemployed.
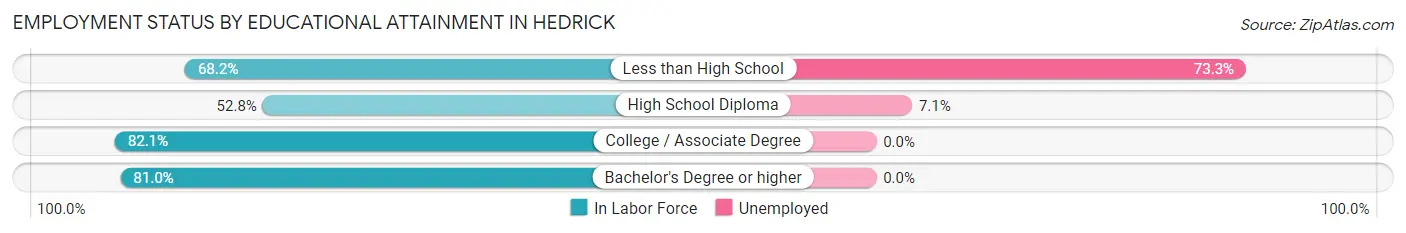
| Educational Attainment | In Labor Force | Unemployed |
| Less than High School | 15 (68.2%) | 16 (73.3%) |
| High School Diploma | 84 (52.8%) | 11 (7.1%) |
| College / Associate Degree | 92 (82.1%) | 0 (0.0%) |
| Bachelor's Degree or higher | 34 (81.0%) | 0 (0.0%) |
| Total | 225 (67.2%) | 25 (7.6%) |
Employment Occupations by Sex in Hedrick
Management, Business, Science and Arts Occupations
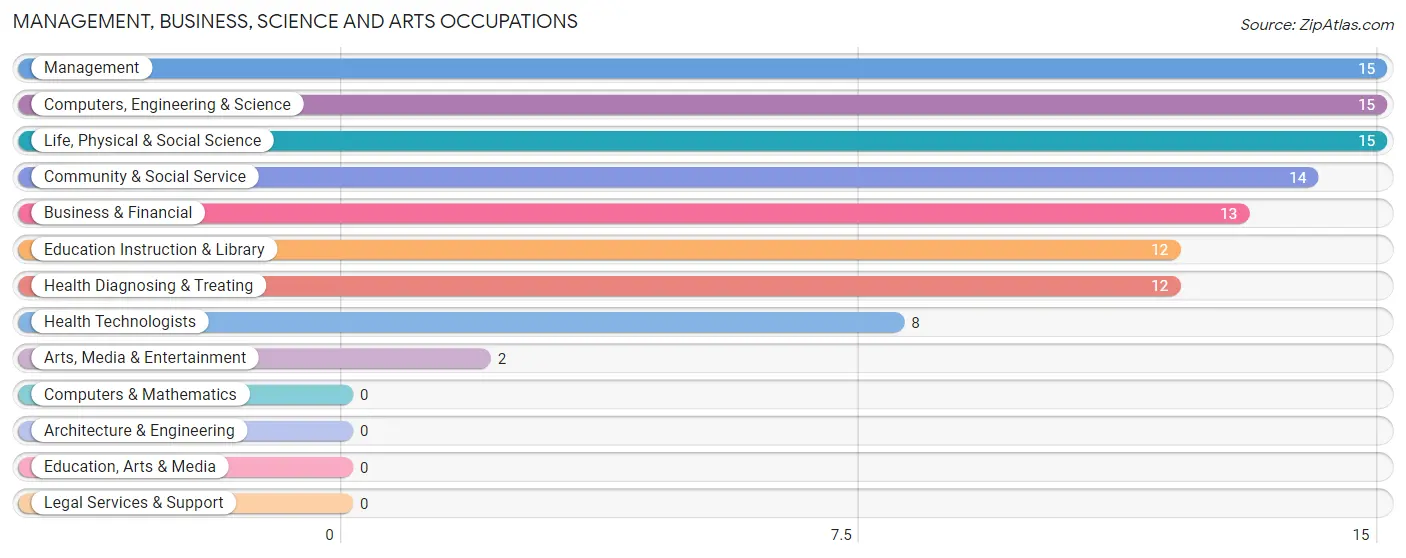
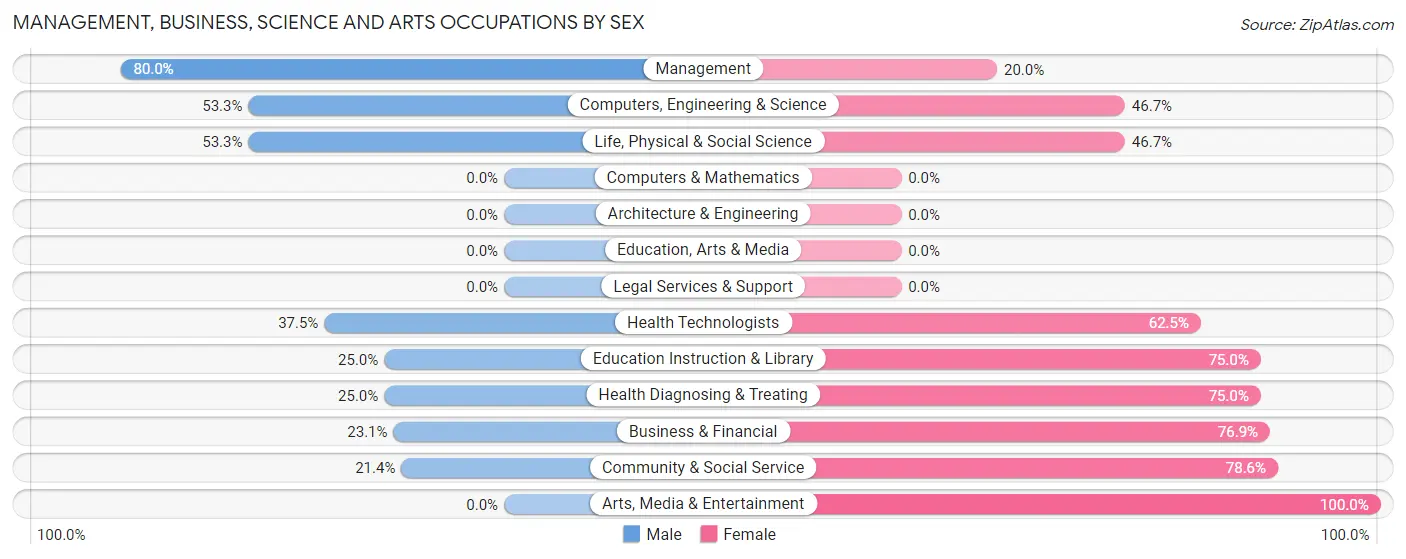
The most common Management, Business, Science and Arts occupations in Hedrick are Management (15 | 5.0%), Computers, Engineering & Science (15 | 5.0%), Life, Physical & Social Science (15 | 5.0%), Community & Social Service (14 | 4.6%), and Business & Financial (13 | 4.3%).
Management, Business, Science and Arts Occupations by Sex
Within the Management, Business, Science and Arts occupations in Hedrick, the most male-oriented occupations are Management (80.0%), Computers, Engineering & Science (53.3%), and Life, Physical & Social Science (53.3%), while the most female-oriented occupations are Arts, Media & Entertainment (100.0%), Community & Social Service (78.6%), and Business & Financial (76.9%).
| Occupation | Male | Female |
| Management | 12 (80.0%) | 3 (20.0%) |
| Business & Financial | 3 (23.1%) | 10 (76.9%) |
| Computers, Engineering & Science | 8 (53.3%) | 7 (46.7%) |
| Computers & Mathematics | 0 (0.0%) | 0 (0.0%) |
| Architecture & Engineering | 0 (0.0%) | 0 (0.0%) |
| Life, Physical & Social Science | 8 (53.3%) | 7 (46.7%) |
| Community & Social Service | 3 (21.4%) | 11 (78.6%) |
| Education, Arts & Media | 0 (0.0%) | 0 (0.0%) |
| Legal Services & Support | 0 (0.0%) | 0 (0.0%) |
| Education Instruction & Library | 3 (25.0%) | 9 (75.0%) |
| Arts, Media & Entertainment | 0 (0.0%) | 2 (100.0%) |
| Health Diagnosing & Treating | 3 (25.0%) | 9 (75.0%) |
| Health Technologists | 3 (37.5%) | 5 (62.5%) |
| Total (Category) | 29 (42.0%) | 40 (58.0%) |
| Total (Overall) | 159 (52.6%) | 143 (47.3%) |
Services Occupations
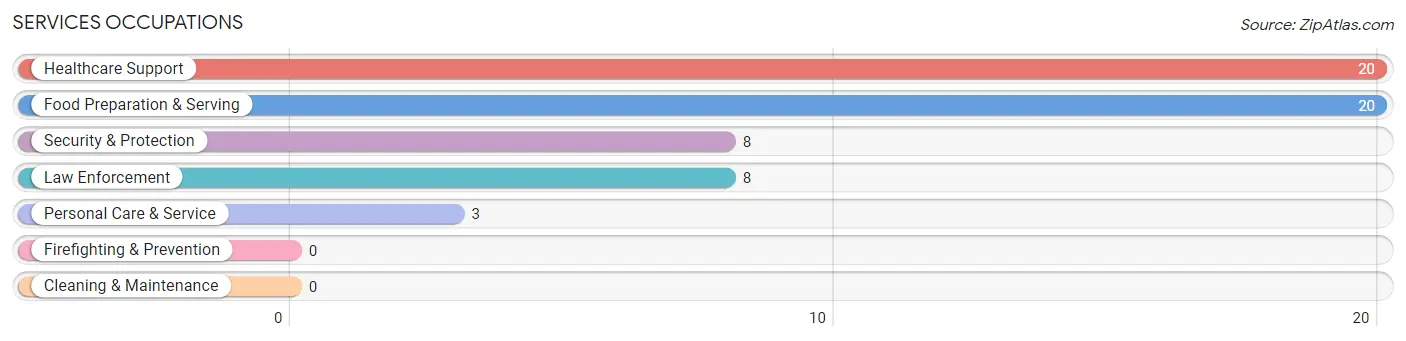
The most common Services occupations in Hedrick are Healthcare Support (20 | 6.6%), Food Preparation & Serving (20 | 6.6%), Security & Protection (8 | 2.6%), Law Enforcement (8 | 2.6%), and Personal Care & Service (3 | 1.0%).
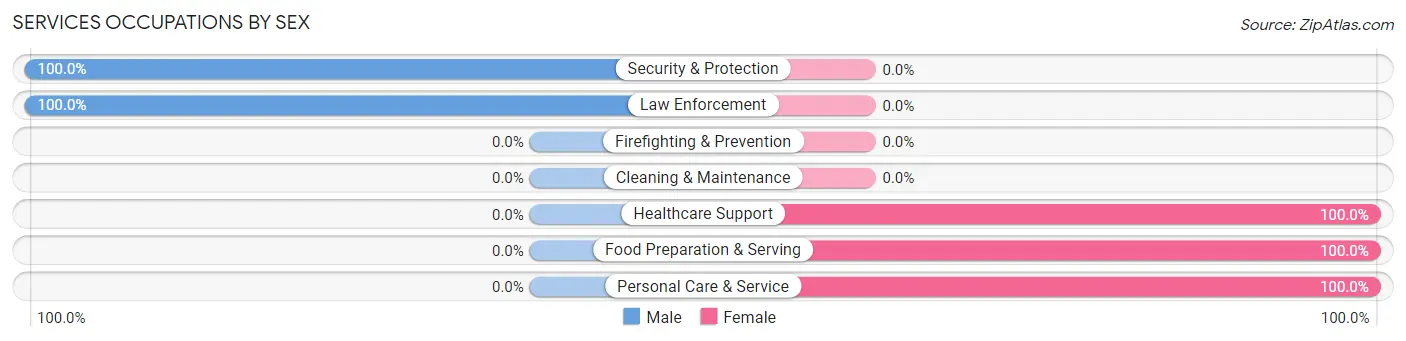
Services Occupations by Sex
Within the Services occupations in Hedrick, the most male-oriented occupations are Security & Protection (100.0%), and Law Enforcement (100.0%), while the most female-oriented occupations are Healthcare Support (100.0%), Food Preparation & Serving (100.0%), and Personal Care & Service (100.0%).
| Occupation | Male | Female |
| Healthcare Support | 0 (0.0%) | 20 (100.0%) |
| Security & Protection | 8 (100.0%) | 0 (0.0%) |
| Firefighting & Prevention | 0 (0.0%) | 0 (0.0%) |
| Law Enforcement | 8 (100.0%) | 0 (0.0%) |
| Food Preparation & Serving | 0 (0.0%) | 20 (100.0%) |
| Cleaning & Maintenance | 0 (0.0%) | 0 (0.0%) |
| Personal Care & Service | 0 (0.0%) | 3 (100.0%) |
| Total (Category) | 8 (15.7%) | 43 (84.3%) |
| Total (Overall) | 159 (52.6%) | 143 (47.3%) |
Sales and Office Occupations
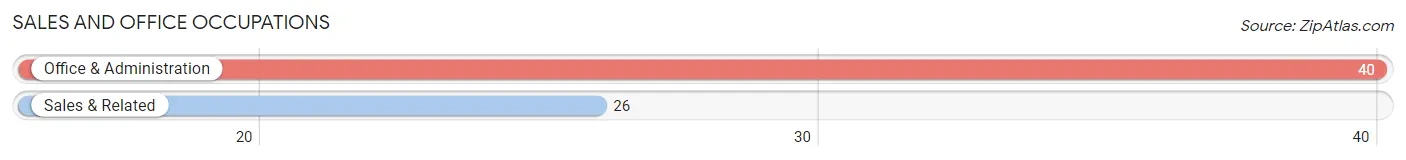
The most common Sales and Office occupations in Hedrick are Office & Administration (40 | 13.3%), and Sales & Related (26 | 8.6%).
Sales and Office Occupations by Sex
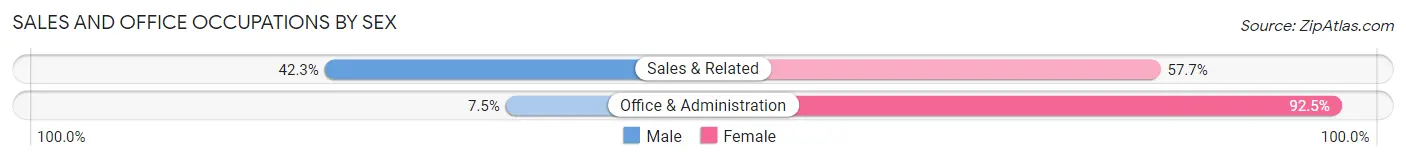
| Occupation | Male | Female |
| Sales & Related | 11 (42.3%) | 15 (57.7%) |
| Office & Administration | 3 (7.5%) | 37 (92.5%) |
| Total (Category) | 14 (21.2%) | 52 (78.8%) |
| Total (Overall) | 159 (52.6%) | 143 (47.3%) |
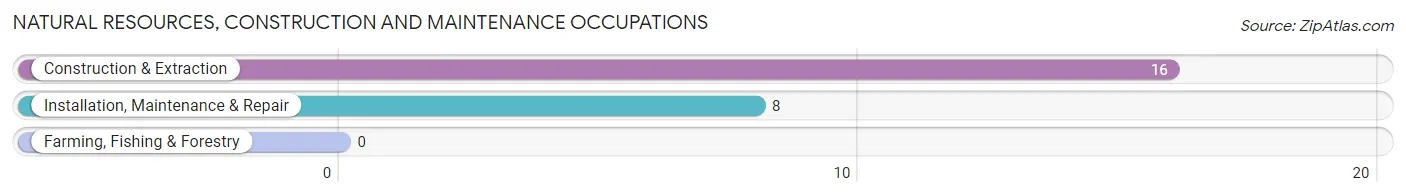
Natural Resources, Construction and Maintenance Occupations
The most common Natural Resources, Construction and Maintenance occupations in Hedrick are Construction & Extraction (16 | 5.3%), and Installation, Maintenance & Repair (8 | 2.6%).
Natural Resources, Construction and Maintenance Occupations by Sex
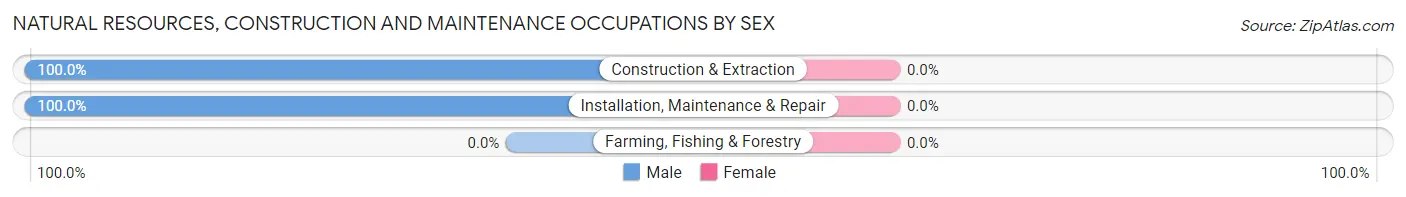
| Occupation | Male | Female |
| Farming, Fishing & Forestry | 0 (0.0%) | 0 (0.0%) |
| Construction & Extraction | 16 (100.0%) | 0 (0.0%) |
| Installation, Maintenance & Repair | 8 (100.0%) | 0 (0.0%) |
| Total (Category) | 24 (100.0%) | 0 (0.0%) |
| Total (Overall) | 159 (52.6%) | 143 (47.3%) |
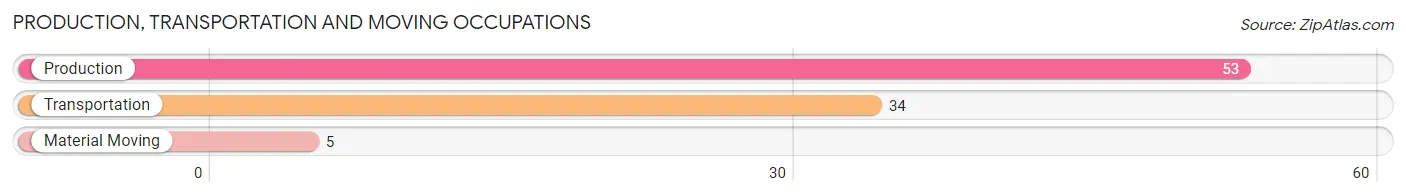
Production, Transportation and Moving Occupations
The most common Production, Transportation and Moving occupations in Hedrick are Production (53 | 17.5%), Transportation (34 | 11.3%), and Material Moving (5 | 1.7%).
Production, Transportation and Moving Occupations by Sex
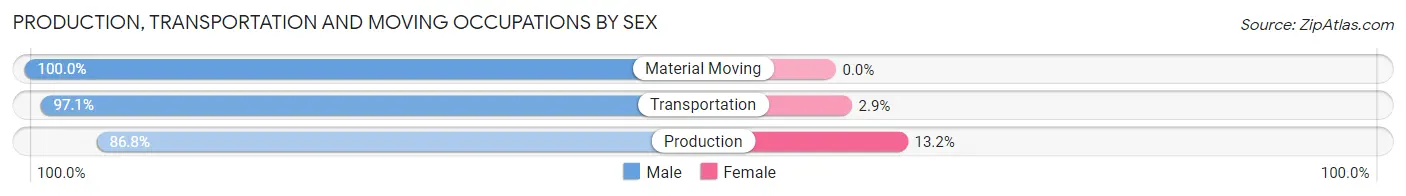
| Occupation | Male | Female |
| Production | 46 (86.8%) | 7 (13.2%) |
| Transportation | 33 (97.1%) | 1 (2.9%) |
| Material Moving | 5 (100.0%) | 0 (0.0%) |
| Total (Category) | 84 (91.3%) | 8 (8.7%) |
| Total (Overall) | 159 (52.6%) | 143 (47.3%) |
Employment Industries by Sex in Hedrick
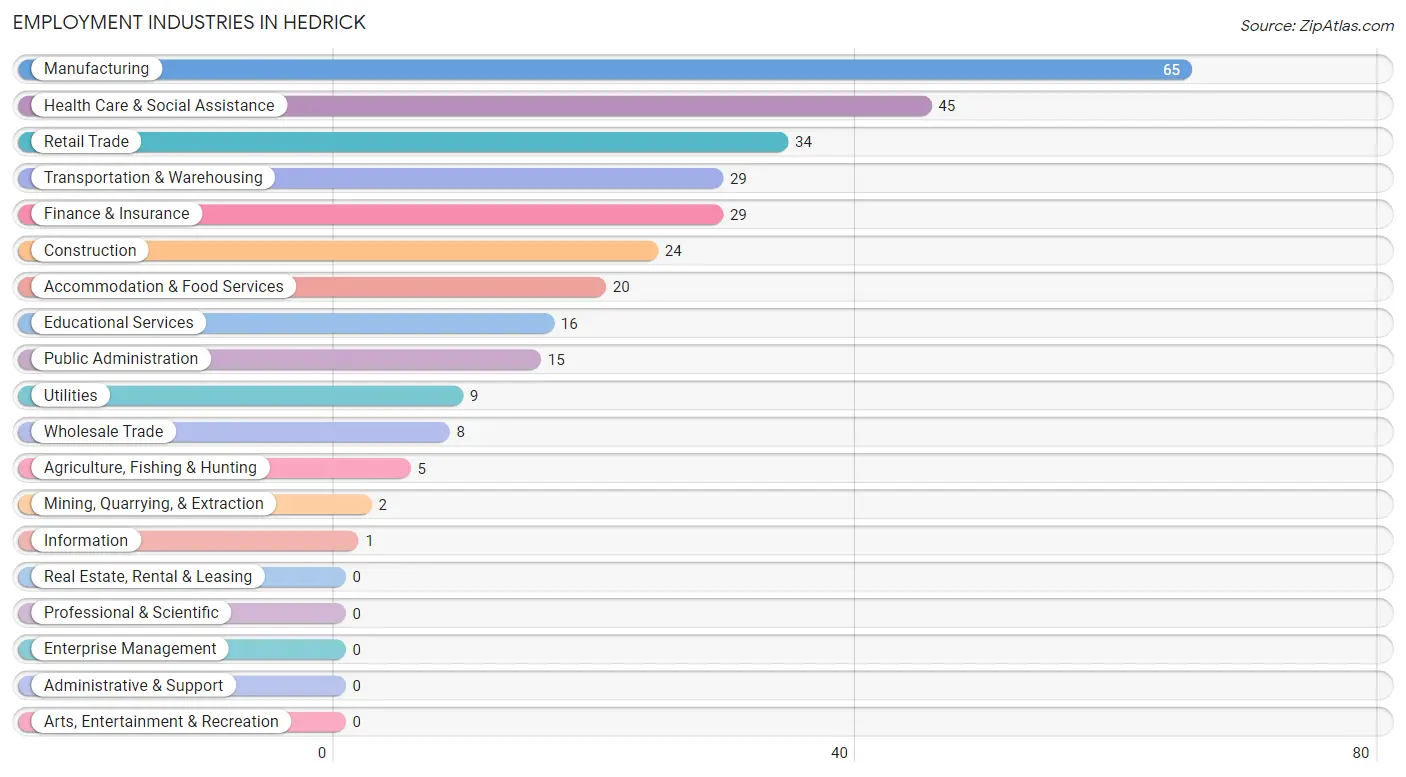
Employment Industries in Hedrick
The major employment industries in Hedrick include Manufacturing (65 | 21.5%), Health Care & Social Assistance (45 | 14.9%), Retail Trade (34 | 11.3%), Transportation & Warehousing (29 | 9.6%), and Finance & Insurance (29 | 9.6%).
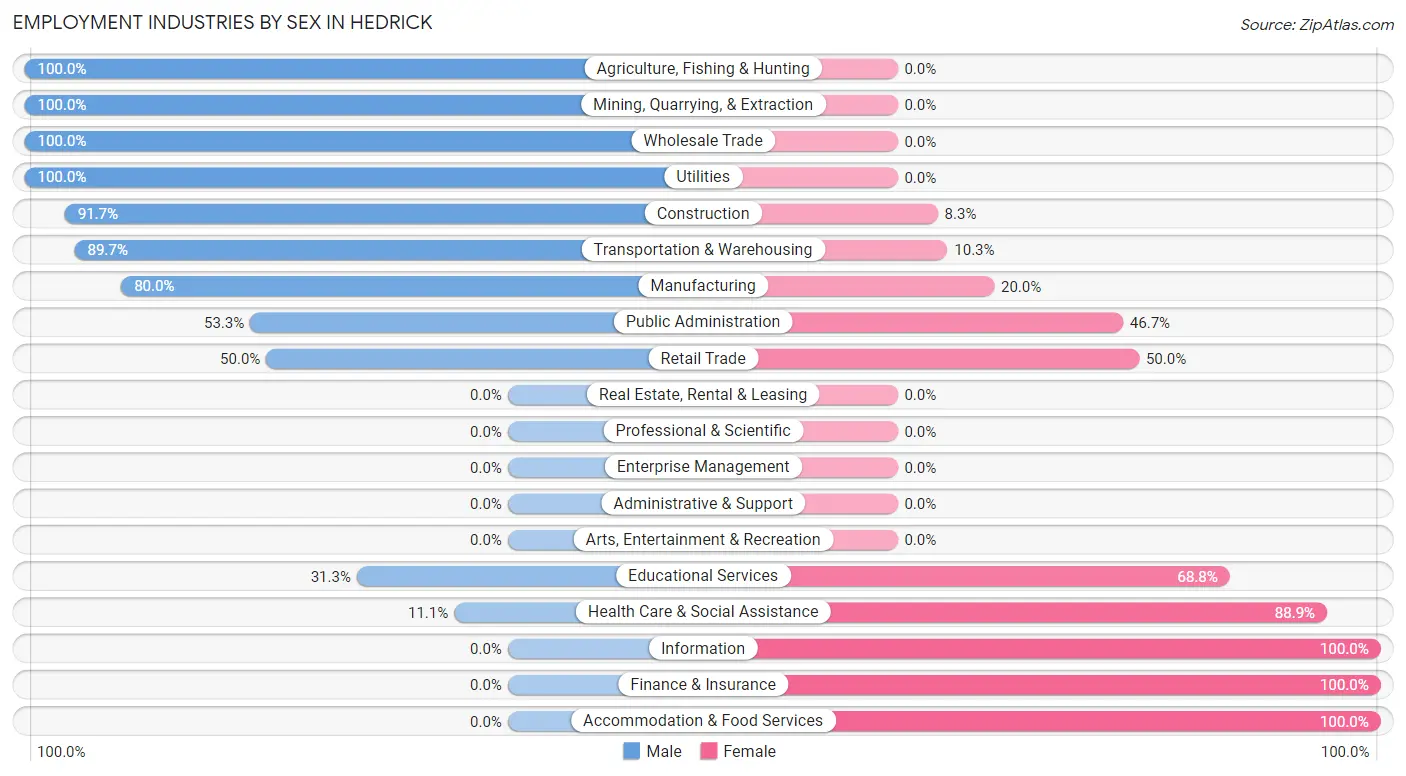
Employment Industries by Sex in Hedrick
The Hedrick industries that see more men than women are Agriculture, Fishing & Hunting (100.0%), Mining, Quarrying, & Extraction (100.0%), and Wholesale Trade (100.0%), whereas the industries that tend to have a higher number of women are Information (100.0%), Finance & Insurance (100.0%), and Accommodation & Food Services (100.0%).
| Industry | Male | Female |
| Agriculture, Fishing & Hunting | 5 (100.0%) | 0 (0.0%) |
| Mining, Quarrying, & Extraction | 2 (100.0%) | 0 (0.0%) |
| Construction | 22 (91.7%) | 2 (8.3%) |
| Manufacturing | 52 (80.0%) | 13 (20.0%) |
| Wholesale Trade | 8 (100.0%) | 0 (0.0%) |
| Retail Trade | 17 (50.0%) | 17 (50.0%) |
| Transportation & Warehousing | 26 (89.7%) | 3 (10.3%) |
| Utilities | 9 (100.0%) | 0 (0.0%) |
| Information | 0 (0.0%) | 1 (100.0%) |
| Finance & Insurance | 0 (0.0%) | 29 (100.0%) |
| Real Estate, Rental & Leasing | 0 (0.0%) | 0 (0.0%) |
| Professional & Scientific | 0 (0.0%) | 0 (0.0%) |
| Enterprise Management | 0 (0.0%) | 0 (0.0%) |
| Administrative & Support | 0 (0.0%) | 0 (0.0%) |
| Educational Services | 5 (31.2%) | 11 (68.8%) |
| Health Care & Social Assistance | 5 (11.1%) | 40 (88.9%) |
| Arts, Entertainment & Recreation | 0 (0.0%) | 0 (0.0%) |
| Accommodation & Food Services | 0 (0.0%) | 20 (100.0%) |
| Public Administration | 8 (53.3%) | 7 (46.7%) |
| Total | 159 (52.6%) | 143 (47.3%) |
Education in Hedrick
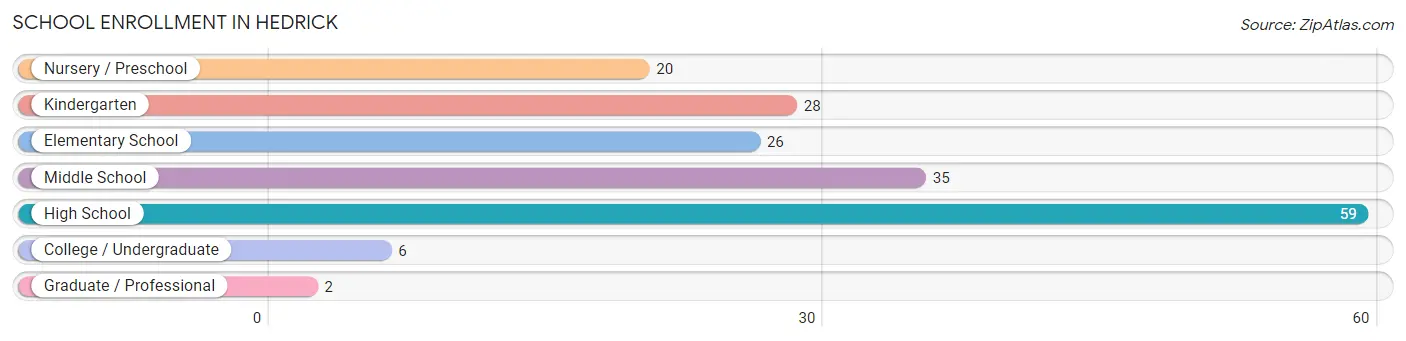
School Enrollment in Hedrick
The most common levels of schooling among the 176 students in Hedrick are high school (59 | 33.5%), middle school (35 | 19.9%), and kindergarten (28 | 15.9%).
| School Level | # Students | % Students |
| Nursery / Preschool | 20 | 11.4% |
| Kindergarten | 28 | 15.9% |
| Elementary School | 26 | 14.8% |
| Middle School | 35 | 19.9% |
| High School | 59 | 33.5% |
| College / Undergraduate | 6 | 3.4% |
| Graduate / Professional | 2 | 1.1% |
| Total | 176 | 100.0% |
School Enrollment by Age by Funding Source in Hedrick
Out of a total of 176 students who are enrolled in schools in Hedrick, 21 (11.9%) attend a private institution, while the remaining 155 (88.1%) are enrolled in public schools. The age group of 15 to 17 year olds has the highest likelihood of being enrolled in private schools, with 12 (40.0% in the age bracket) enrolled. Conversely, the age group of 5 to 9 year old has the lowest likelihood of being enrolled in a private school, with 56 (100.0% in the age bracket) attending a public institution.
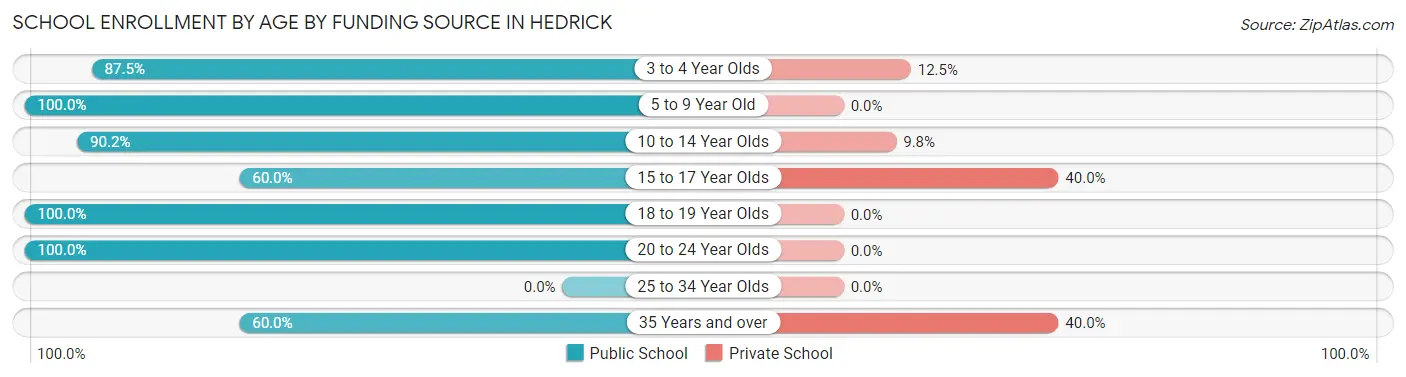
| Age Bracket | Public School | Private School |
| 3 to 4 Year Olds | 14 (87.5%) | 2 (12.5%) |
| 5 to 9 Year Old | 56 (100.0%) | 0 (0.0%) |
| 10 to 14 Year Olds | 46 (90.2%) | 5 (9.8%) |
| 15 to 17 Year Olds | 18 (60.0%) | 12 (40.0%) |
| 18 to 19 Year Olds | 15 (100.0%) | 0 (0.0%) |
| 20 to 24 Year Olds | 3 (100.0%) | 0 (0.0%) |
| 25 to 34 Year Olds | 0 (0.0%) | 0 (0.0%) |
| 35 Years and over | 3 (60.0%) | 2 (40.0%) |
| Total | 155 (88.1%) | 21 (11.9%) |
Educational Attainment by Field of Study in Hedrick
Education (18 | 26.1%), social sciences (16 | 23.2%), arts & humanities (13 | 18.8%), science & technology (10 | 14.5%), and psychology (8 | 11.6%) are the most common fields of study among 69 individuals in Hedrick who have obtained a bachelor's degree or higher.
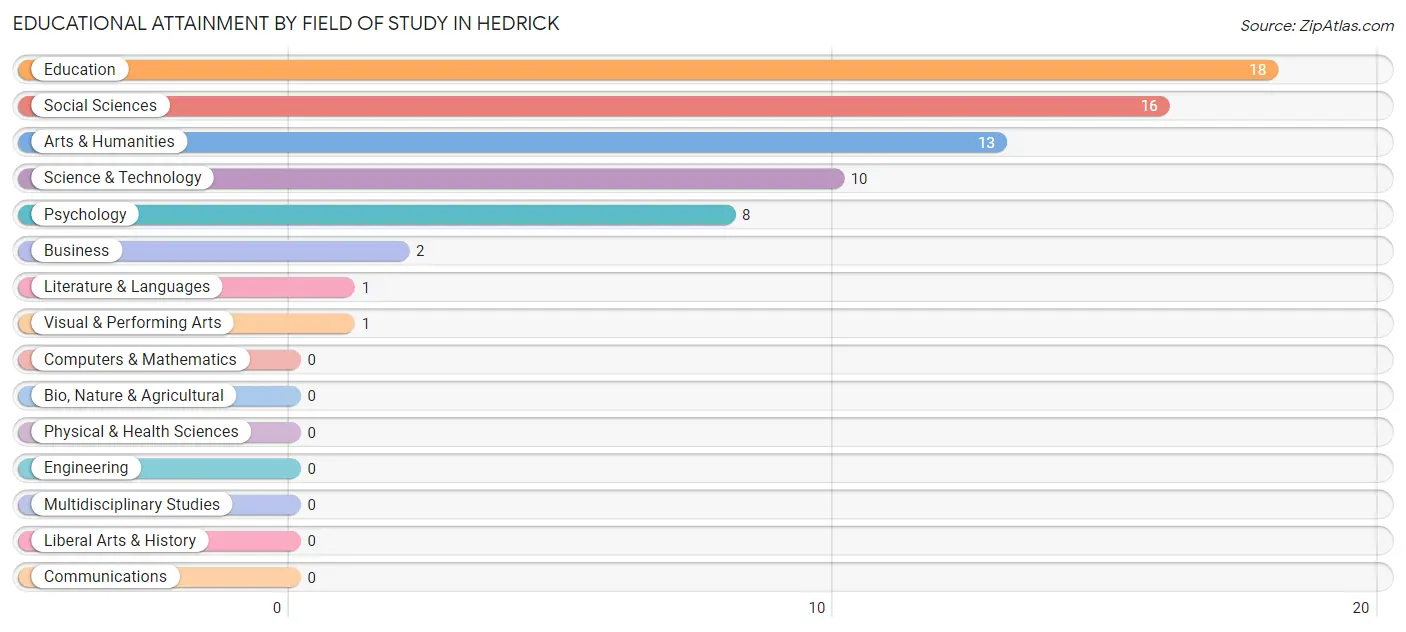
| Field of Study | # Graduates | % Graduates |
| Computers & Mathematics | 0 | 0.0% |
| Bio, Nature & Agricultural | 0 | 0.0% |
| Physical & Health Sciences | 0 | 0.0% |
| Psychology | 8 | 11.6% |
| Social Sciences | 16 | 23.2% |
| Engineering | 0 | 0.0% |
| Multidisciplinary Studies | 0 | 0.0% |
| Science & Technology | 10 | 14.5% |
| Business | 2 | 2.9% |
| Education | 18 | 26.1% |
| Literature & Languages | 1 | 1.5% |
| Liberal Arts & History | 0 | 0.0% |
| Visual & Performing Arts | 1 | 1.5% |
| Communications | 0 | 0.0% |
| Arts & Humanities | 13 | 18.8% |
| Total | 69 | 100.0% |
Transportation & Commute in Hedrick
Vehicle Availability by Sex in Hedrick
The most prevalent vehicle ownership categories in Hedrick are males with 2 vehicles (67, accounting for 42.1%) and females with 2 vehicles (52, making up 47.2%).
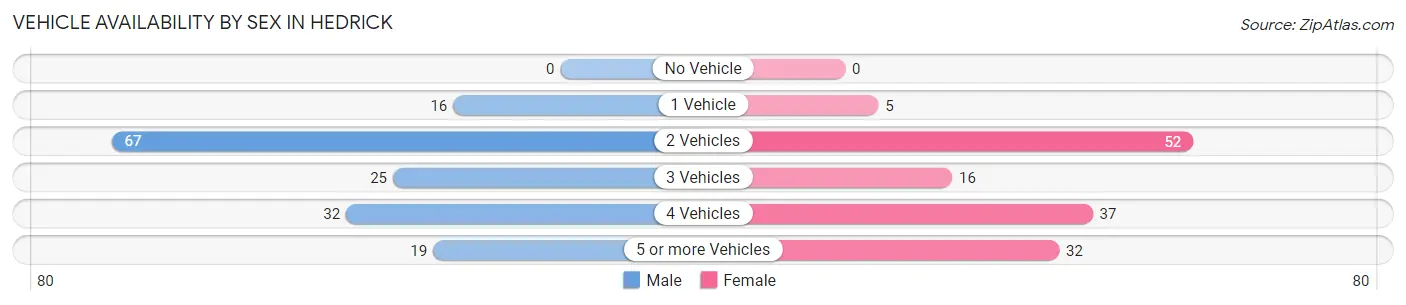
| Vehicles Available | Male | Female |
| No Vehicle | 0 (0.0%) | 0 (0.0%) |
| 1 Vehicle | 16 (10.1%) | 5 (3.5%) |
| 2 Vehicles | 67 (42.1%) | 52 (36.6%) |
| 3 Vehicles | 25 (15.7%) | 16 (11.3%) |
| 4 Vehicles | 32 (20.1%) | 37 (26.1%) |
| 5 or more Vehicles | 19 (11.9%) | 32 (22.5%) |
| Total | 159 (100.0%) | 142 (100.0%) |
Commute Time in Hedrick
The most frequently occuring commute durations in Hedrick are 25 to 29 minutes (74 commuters, 28.1%), 20 to 24 minutes (43 commuters, 16.4%), and 30 to 34 minutes (34 commuters, 12.9%).
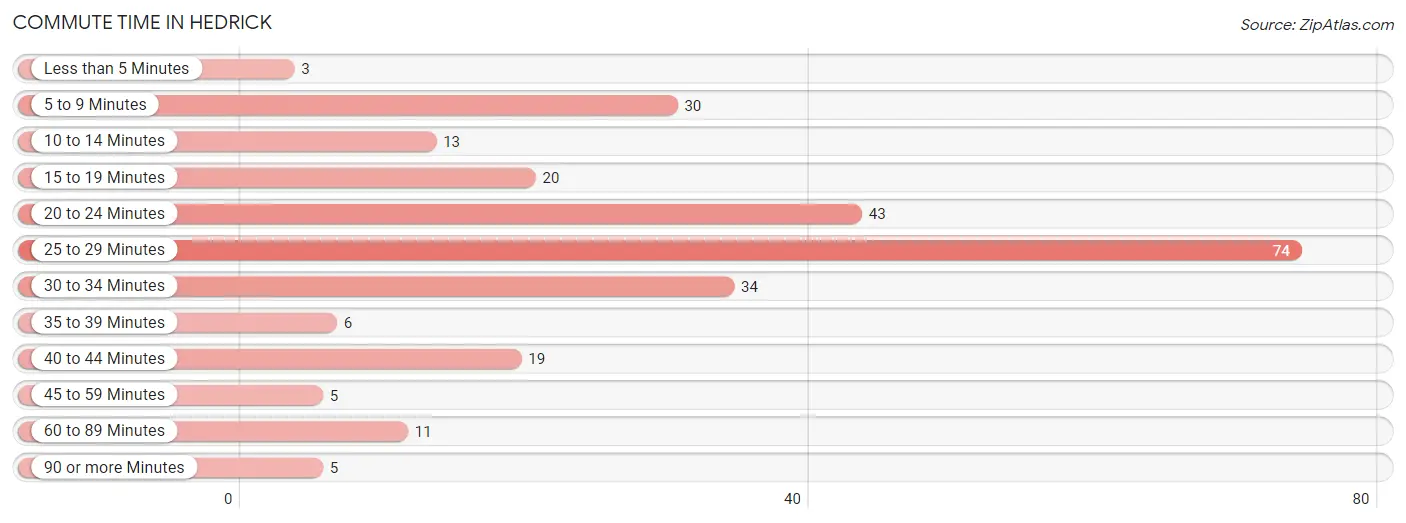
| Commute Time | # Commuters | % Commuters |
| Less than 5 Minutes | 3 | 1.1% |
| 5 to 9 Minutes | 30 | 11.4% |
| 10 to 14 Minutes | 13 | 4.9% |
| 15 to 19 Minutes | 20 | 7.6% |
| 20 to 24 Minutes | 43 | 16.4% |
| 25 to 29 Minutes | 74 | 28.1% |
| 30 to 34 Minutes | 34 | 12.9% |
| 35 to 39 Minutes | 6 | 2.3% |
| 40 to 44 Minutes | 19 | 7.2% |
| 45 to 59 Minutes | 5 | 1.9% |
| 60 to 89 Minutes | 11 | 4.2% |
| 90 or more Minutes | 5 | 1.9% |
Commute Time by Sex in Hedrick
The most common commute times in Hedrick are 25 to 29 minutes (39 commuters, 26.5%) for males and 25 to 29 minutes (35 commuters, 30.2%) for females.
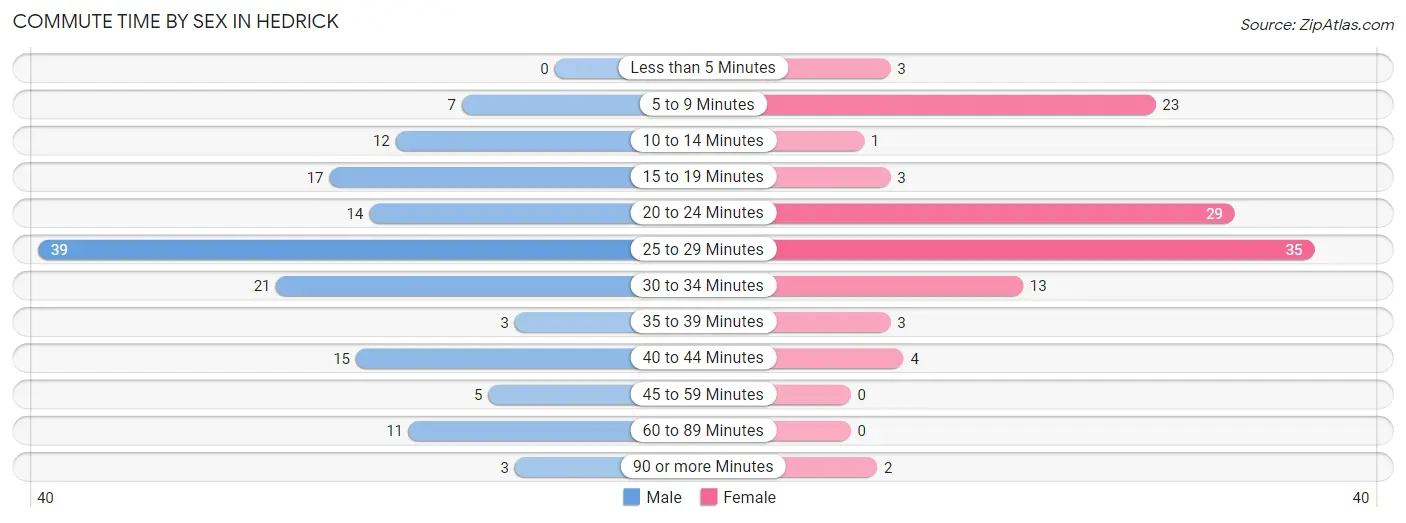
| Commute Time | Male | Female |
| Less than 5 Minutes | 0 (0.0%) | 3 (2.6%) |
| 5 to 9 Minutes | 7 (4.8%) | 23 (19.8%) |
| 10 to 14 Minutes | 12 (8.2%) | 1 (0.9%) |
| 15 to 19 Minutes | 17 (11.6%) | 3 (2.6%) |
| 20 to 24 Minutes | 14 (9.5%) | 29 (25.0%) |
| 25 to 29 Minutes | 39 (26.5%) | 35 (30.2%) |
| 30 to 34 Minutes | 21 (14.3%) | 13 (11.2%) |
| 35 to 39 Minutes | 3 (2.0%) | 3 (2.6%) |
| 40 to 44 Minutes | 15 (10.2%) | 4 (3.5%) |
| 45 to 59 Minutes | 5 (3.4%) | 0 (0.0%) |
| 60 to 89 Minutes | 11 (7.5%) | 0 (0.0%) |
| 90 or more Minutes | 3 (2.0%) | 2 (1.7%) |
Time of Departure to Work by Sex in Hedrick
The most frequent times of departure to work in Hedrick are 5:00 AM to 5:29 AM (42, 28.6%) for males and 7:30 AM to 7:59 AM (31, 26.7%) for females.
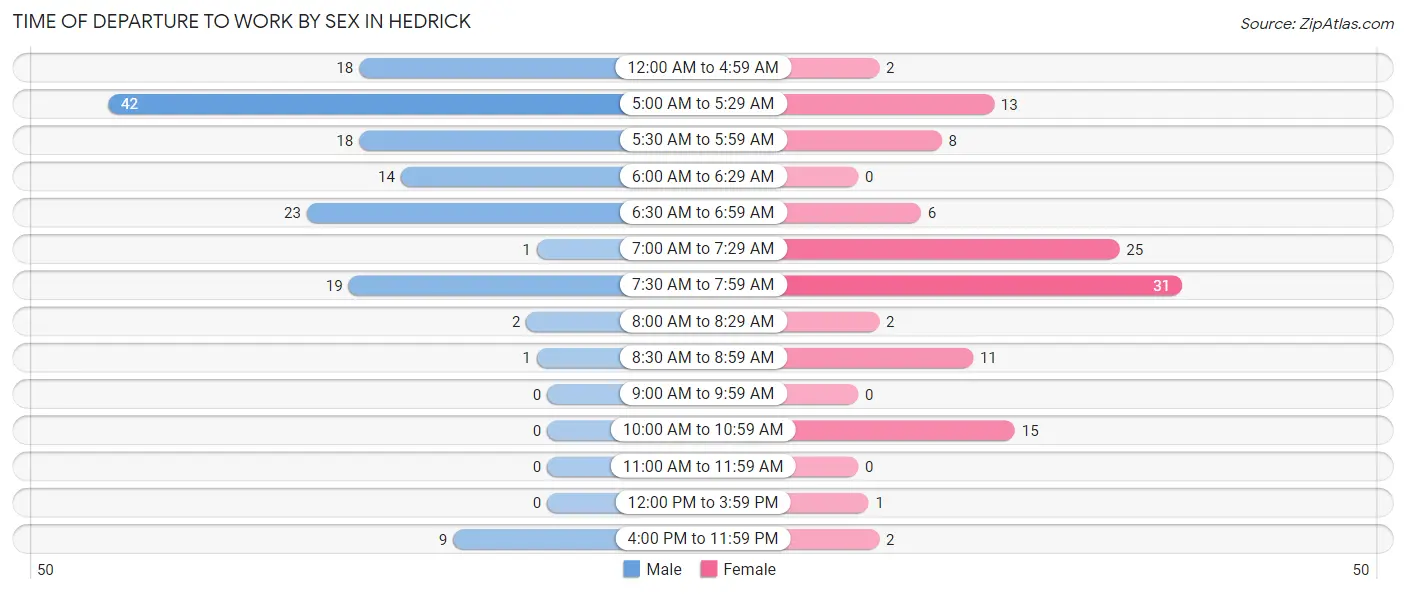
| Time of Departure | Male | Female |
| 12:00 AM to 4:59 AM | 18 (12.2%) | 2 (1.7%) |
| 5:00 AM to 5:29 AM | 42 (28.6%) | 13 (11.2%) |
| 5:30 AM to 5:59 AM | 18 (12.2%) | 8 (6.9%) |
| 6:00 AM to 6:29 AM | 14 (9.5%) | 0 (0.0%) |
| 6:30 AM to 6:59 AM | 23 (15.7%) | 6 (5.2%) |
| 7:00 AM to 7:29 AM | 1 (0.7%) | 25 (21.5%) |
| 7:30 AM to 7:59 AM | 19 (12.9%) | 31 (26.7%) |
| 8:00 AM to 8:29 AM | 2 (1.4%) | 2 (1.7%) |
| 8:30 AM to 8:59 AM | 1 (0.7%) | 11 (9.5%) |
| 9:00 AM to 9:59 AM | 0 (0.0%) | 0 (0.0%) |
| 10:00 AM to 10:59 AM | 0 (0.0%) | 15 (12.9%) |
| 11:00 AM to 11:59 AM | 0 (0.0%) | 0 (0.0%) |
| 12:00 PM to 3:59 PM | 0 (0.0%) | 1 (0.9%) |
| 4:00 PM to 11:59 PM | 9 (6.1%) | 2 (1.7%) |
| Total | 147 (100.0%) | 116 (100.0%) |
Housing Occupancy in Hedrick
Occupancy by Ownership in Hedrick
Of the total 260 dwellings in Hedrick, owner-occupied units account for 194 (74.6%), while renter-occupied units make up 66 (25.4%).
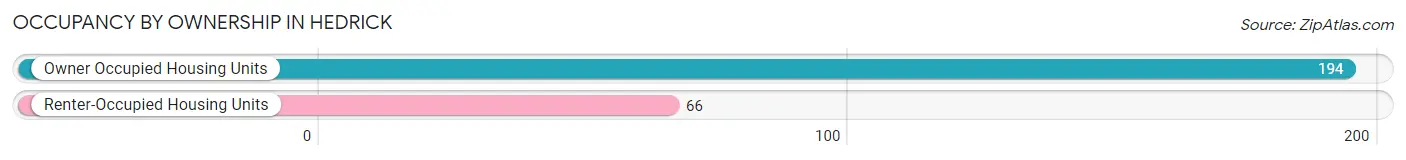
| Occupancy | # Housing Units | % Housing Units |
| Owner Occupied Housing Units | 194 | 74.6% |
| Renter-Occupied Housing Units | 66 | 25.4% |
| Total Occupied Housing Units | 260 | 100.0% |
Occupancy by Household Size in Hedrick
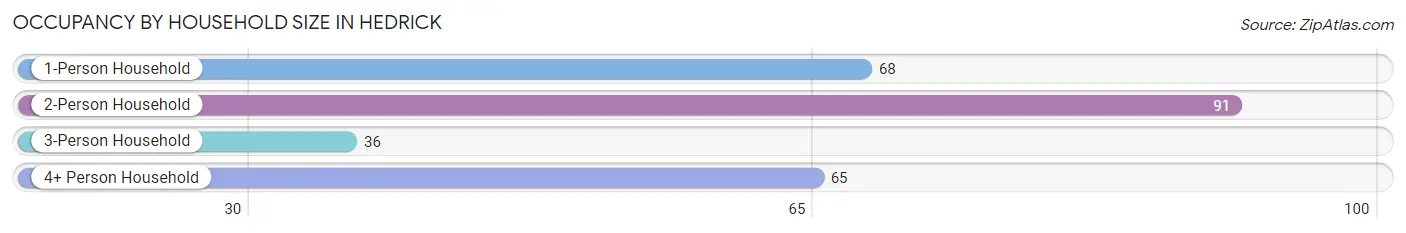
| Household Size | # Housing Units | % Housing Units |
| 1-Person Household | 68 | 26.2% |
| 2-Person Household | 91 | 35.0% |
| 3-Person Household | 36 | 13.9% |
| 4+ Person Household | 65 | 25.0% |
| Total Housing Units | 260 | 100.0% |
Occupancy by Ownership by Household Size in Hedrick
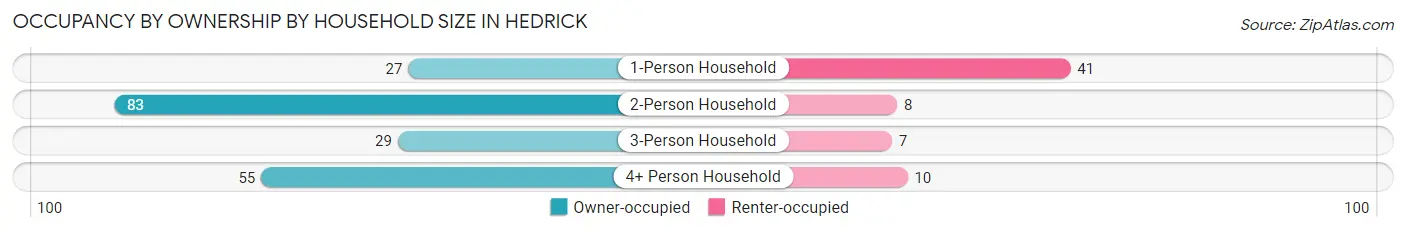
| Household Size | Owner-occupied | Renter-occupied |
| 1-Person Household | 27 (39.7%) | 41 (60.3%) |
| 2-Person Household | 83 (91.2%) | 8 (8.8%) |
| 3-Person Household | 29 (80.6%) | 7 (19.4%) |
| 4+ Person Household | 55 (84.6%) | 10 (15.4%) |
| Total Housing Units | 194 (74.6%) | 66 (25.4%) |
Occupancy by Educational Attainment in Hedrick
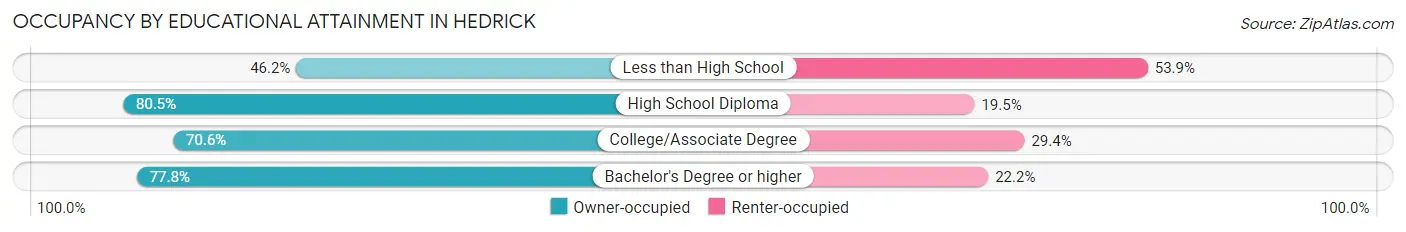
| Household Size | Owner-occupied | Renter-occupied |
| Less than High School | 6 (46.2%) | 7 (53.8%) |
| High School Diploma | 95 (80.5%) | 23 (19.5%) |
| College/Associate Degree | 72 (70.6%) | 30 (29.4%) |
| Bachelor's Degree or higher | 21 (77.8%) | 6 (22.2%) |
Occupancy by Age of Householder in Hedrick
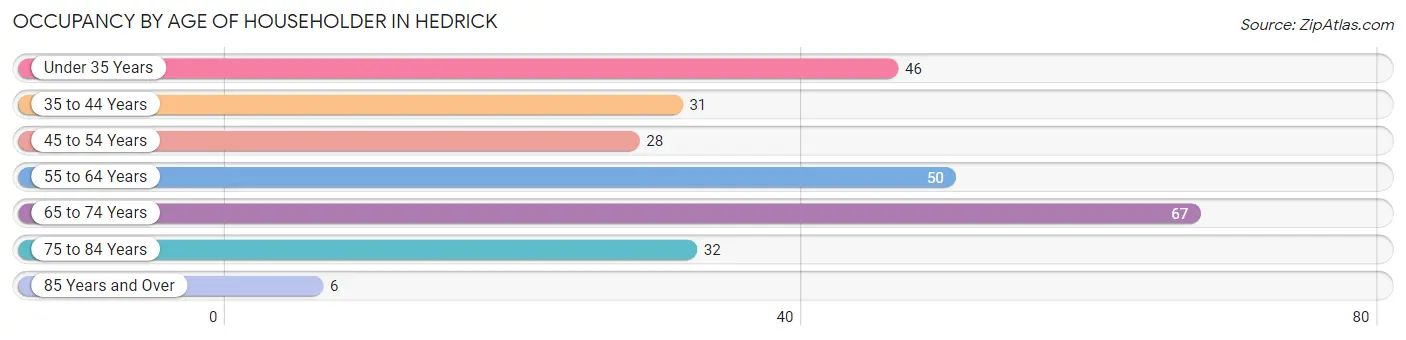
| Age Bracket | # Households | % Households |
| Under 35 Years | 46 | 17.7% |
| 35 to 44 Years | 31 | 11.9% |
| 45 to 54 Years | 28 | 10.8% |
| 55 to 64 Years | 50 | 19.2% |
| 65 to 74 Years | 67 | 25.8% |
| 75 to 84 Years | 32 | 12.3% |
| 85 Years and Over | 6 | 2.3% |
| Total | 260 | 100.0% |
Housing Finances in Hedrick
Median Income by Occupancy in Hedrick
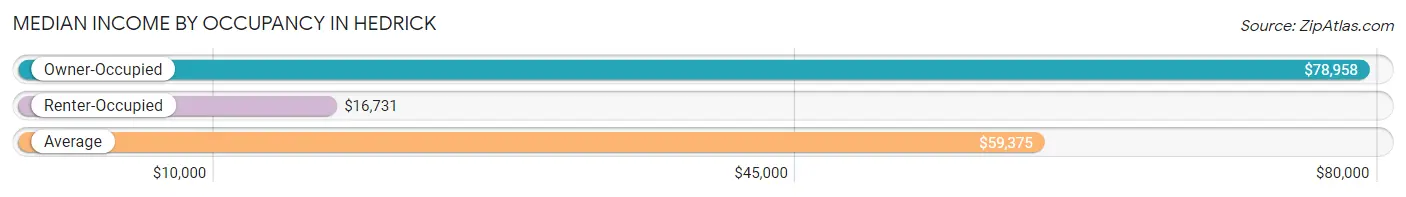
| Occupancy Type | # Households | Median Income |
| Owner-Occupied | 194 (74.6%) | $78,958 |
| Renter-Occupied | 66 (25.4%) | $16,731 |
| Average | 260 (100.0%) | $59,375 |
Occupancy by Householder Income Bracket in Hedrick
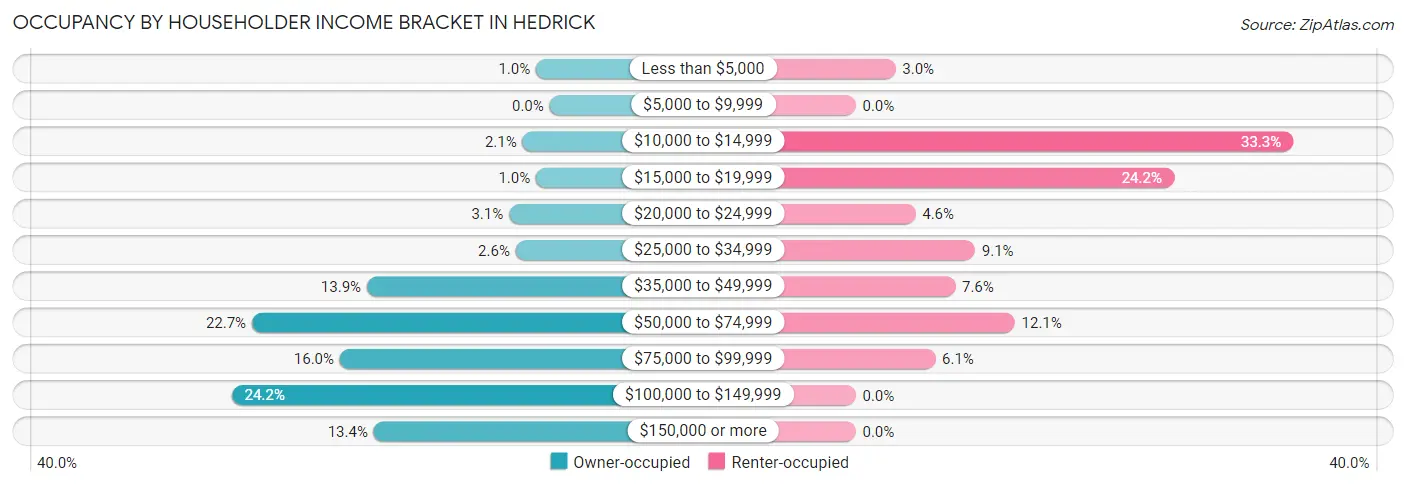
| Income Bracket | Owner-occupied | Renter-occupied |
| Less than $5,000 | 2 (1.0%) | 2 (3.0%) |
| $5,000 to $9,999 | 0 (0.0%) | 0 (0.0%) |
| $10,000 to $14,999 | 4 (2.1%) | 22 (33.3%) |
| $15,000 to $19,999 | 2 (1.0%) | 16 (24.2%) |
| $20,000 to $24,999 | 6 (3.1%) | 3 (4.5%) |
| $25,000 to $34,999 | 5 (2.6%) | 6 (9.1%) |
| $35,000 to $49,999 | 27 (13.9%) | 5 (7.6%) |
| $50,000 to $74,999 | 44 (22.7%) | 8 (12.1%) |
| $75,000 to $99,999 | 31 (16.0%) | 4 (6.1%) |
| $100,000 to $149,999 | 47 (24.2%) | 0 (0.0%) |
| $150,000 or more | 26 (13.4%) | 0 (0.0%) |
| Total | 194 (100.0%) | 66 (100.0%) |
Monthly Housing Cost Tiers in Hedrick
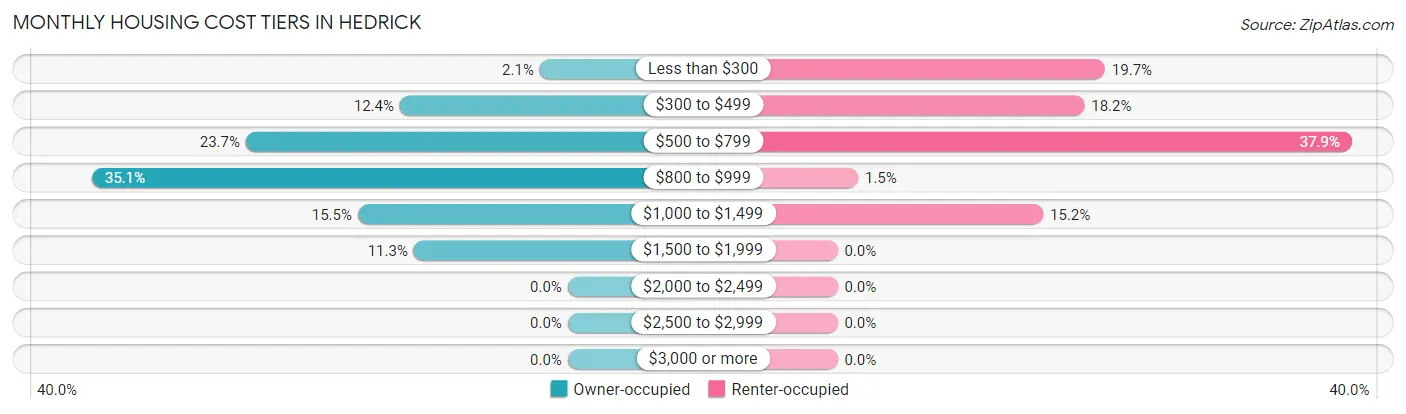
| Monthly Cost | Owner-occupied | Renter-occupied |
| Less than $300 | 4 (2.1%) | 13 (19.7%) |
| $300 to $499 | 24 (12.4%) | 12 (18.2%) |
| $500 to $799 | 46 (23.7%) | 25 (37.9%) |
| $800 to $999 | 68 (35.0%) | 1 (1.5%) |
| $1,000 to $1,499 | 30 (15.5%) | 10 (15.1%) |
| $1,500 to $1,999 | 22 (11.3%) | 0 (0.0%) |
| $2,000 to $2,499 | 0 (0.0%) | 0 (0.0%) |
| $2,500 to $2,999 | 0 (0.0%) | 0 (0.0%) |
| $3,000 or more | 0 (0.0%) | 0 (0.0%) |
| Total | 194 (100.0%) | 66 (100.0%) |
Physical Housing Characteristics in Hedrick
Housing Structures in Hedrick
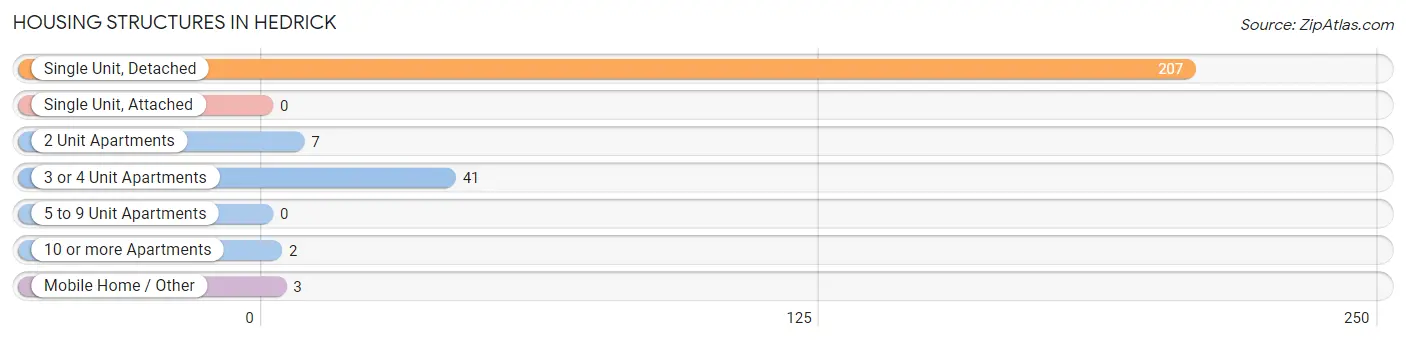
| Structure Type | # Housing Units | % Housing Units |
| Single Unit, Detached | 207 | 79.6% |
| Single Unit, Attached | 0 | 0.0% |
| 2 Unit Apartments | 7 | 2.7% |
| 3 or 4 Unit Apartments | 41 | 15.8% |
| 5 to 9 Unit Apartments | 0 | 0.0% |
| 10 or more Apartments | 2 | 0.8% |
| Mobile Home / Other | 3 | 1.1% |
| Total | 260 | 100.0% |
Housing Structures by Occupancy in Hedrick
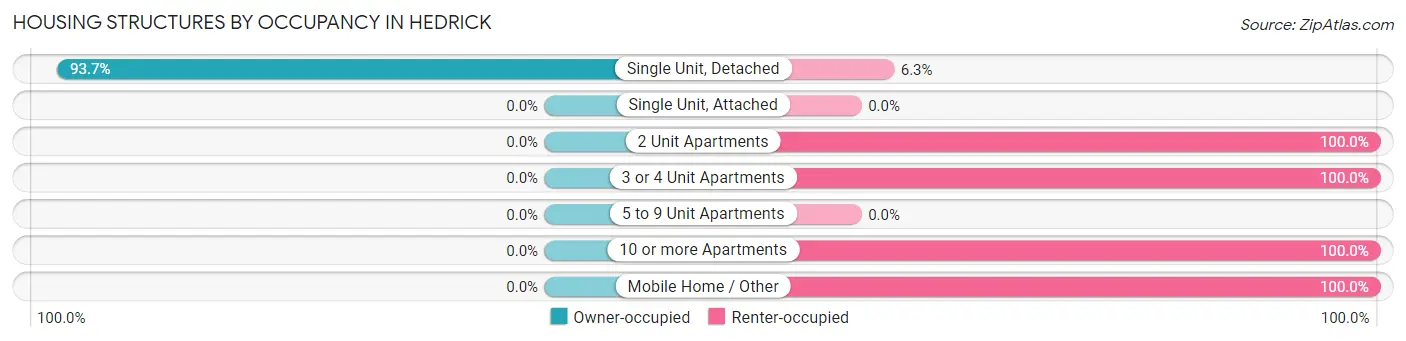
| Structure Type | Owner-occupied | Renter-occupied |
| Single Unit, Detached | 194 (93.7%) | 13 (6.3%) |
| Single Unit, Attached | 0 (0.0%) | 0 (0.0%) |
| 2 Unit Apartments | 0 (0.0%) | 7 (100.0%) |
| 3 or 4 Unit Apartments | 0 (0.0%) | 41 (100.0%) |
| 5 to 9 Unit Apartments | 0 (0.0%) | 0 (0.0%) |
| 10 or more Apartments | 0 (0.0%) | 2 (100.0%) |
| Mobile Home / Other | 0 (0.0%) | 3 (100.0%) |
| Total | 194 (74.6%) | 66 (25.4%) |
Housing Structures by Number of Rooms in Hedrick
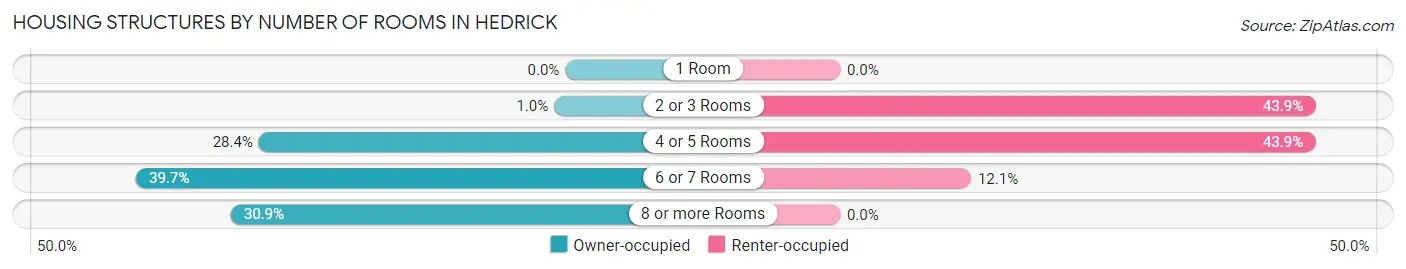
| Number of Rooms | Owner-occupied | Renter-occupied |
| 1 Room | 0 (0.0%) | 0 (0.0%) |
| 2 or 3 Rooms | 2 (1.0%) | 29 (43.9%) |
| 4 or 5 Rooms | 55 (28.3%) | 29 (43.9%) |
| 6 or 7 Rooms | 77 (39.7%) | 8 (12.1%) |
| 8 or more Rooms | 60 (30.9%) | 0 (0.0%) |
| Total | 194 (100.0%) | 66 (100.0%) |
Housing Structure by Heating Type in Hedrick
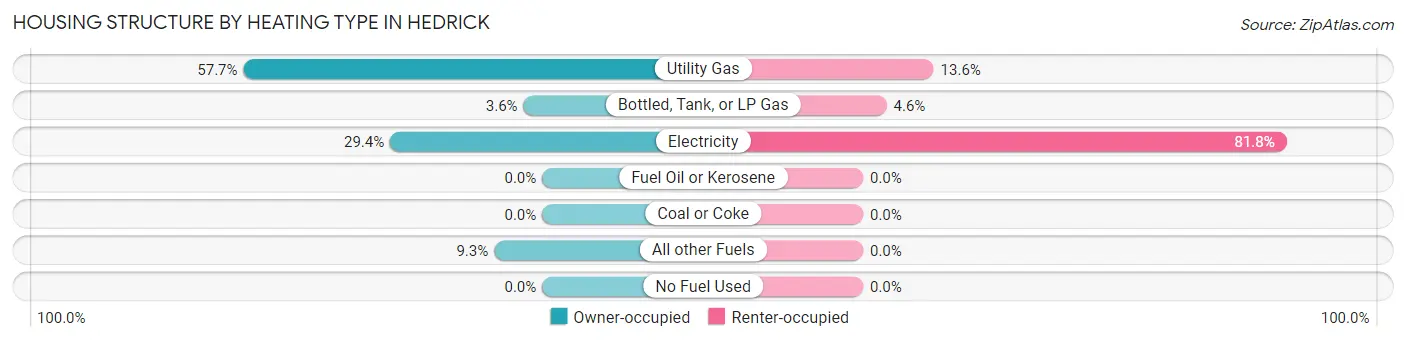
| Heating Type | Owner-occupied | Renter-occupied |
| Utility Gas | 112 (57.7%) | 9 (13.6%) |
| Bottled, Tank, or LP Gas | 7 (3.6%) | 3 (4.5%) |
| Electricity | 57 (29.4%) | 54 (81.8%) |
| Fuel Oil or Kerosene | 0 (0.0%) | 0 (0.0%) |
| Coal or Coke | 0 (0.0%) | 0 (0.0%) |
| All other Fuels | 18 (9.3%) | 0 (0.0%) |
| No Fuel Used | 0 (0.0%) | 0 (0.0%) |
| Total | 194 (100.0%) | 66 (100.0%) |
Household Vehicle Usage in Hedrick
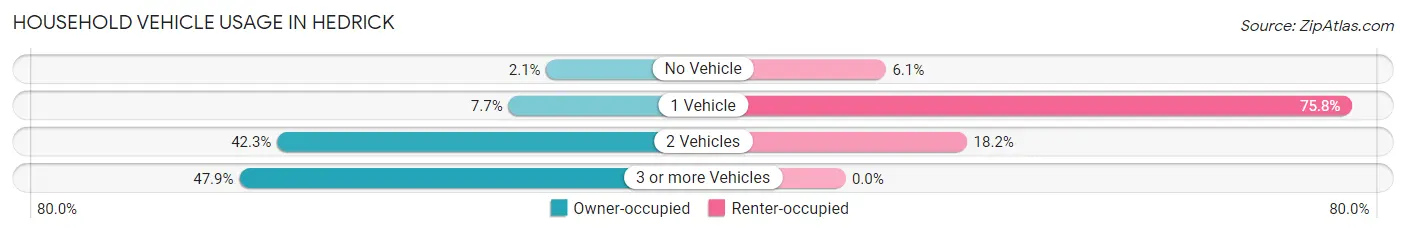
| Vehicles per Household | Owner-occupied | Renter-occupied |
| No Vehicle | 4 (2.1%) | 4 (6.1%) |
| 1 Vehicle | 15 (7.7%) | 50 (75.8%) |
| 2 Vehicles | 82 (42.3%) | 12 (18.2%) |
| 3 or more Vehicles | 93 (47.9%) | 0 (0.0%) |
| Total | 194 (100.0%) | 66 (100.0%) |
Real Estate & Mortgages in Hedrick
Real Estate and Mortgage Overview in Hedrick
| Characteristic | Without Mortgage | With Mortgage |
| Housing Units | 68 | 126 |
| Median Property Value | $75,000 | $77,000 |
| Median Household Income | $79,500 | $19 |
| Monthly Housing Costs | $600 | $0 |
| Real Estate Taxes | $1,227 | $2 |
Property Value by Mortgage Status in Hedrick
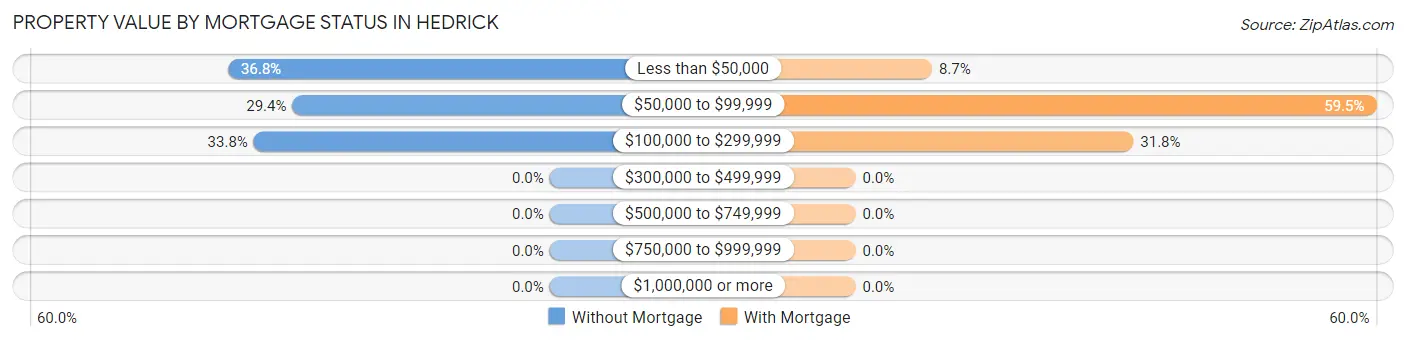
| Property Value | Without Mortgage | With Mortgage |
| Less than $50,000 | 25 (36.8%) | 11 (8.7%) |
| $50,000 to $99,999 | 20 (29.4%) | 75 (59.5%) |
| $100,000 to $299,999 | 23 (33.8%) | 40 (31.8%) |
| $300,000 to $499,999 | 0 (0.0%) | 0 (0.0%) |
| $500,000 to $749,999 | 0 (0.0%) | 0 (0.0%) |
| $750,000 to $999,999 | 0 (0.0%) | 0 (0.0%) |
| $1,000,000 or more | 0 (0.0%) | 0 (0.0%) |
| Total | 68 (100.0%) | 126 (100.0%) |
Household Income by Mortgage Status in Hedrick
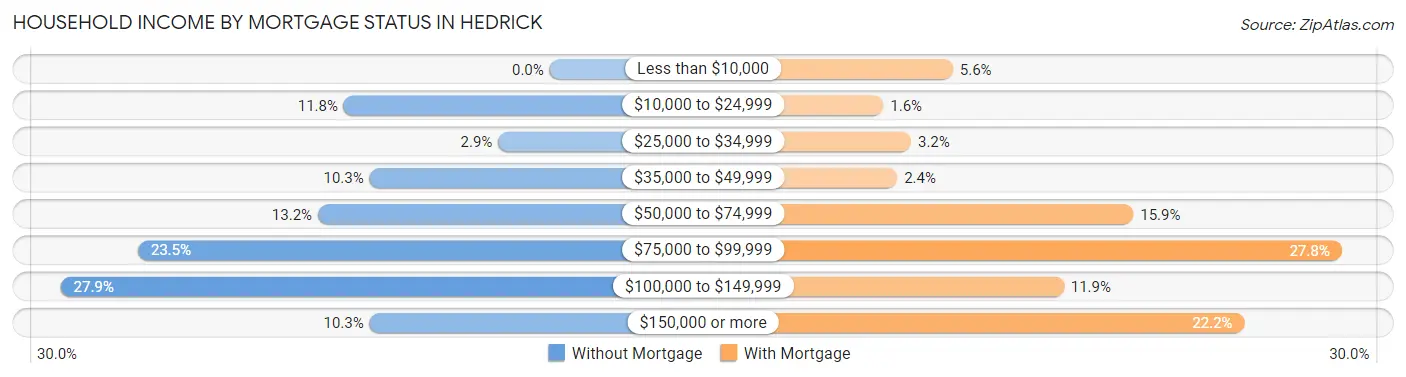
| Household Income | Without Mortgage | With Mortgage |
| Less than $10,000 | 0 (0.0%) | 7 (5.6%) |
| $10,000 to $24,999 | 8 (11.8%) | 2 (1.6%) |
| $25,000 to $34,999 | 2 (2.9%) | 4 (3.2%) |
| $35,000 to $49,999 | 7 (10.3%) | 3 (2.4%) |
| $50,000 to $74,999 | 9 (13.2%) | 20 (15.9%) |
| $75,000 to $99,999 | 16 (23.5%) | 35 (27.8%) |
| $100,000 to $149,999 | 19 (27.9%) | 15 (11.9%) |
| $150,000 or more | 7 (10.3%) | 28 (22.2%) |
| Total | 68 (100.0%) | 126 (100.0%) |
Property Value to Household Income Ratio in Hedrick
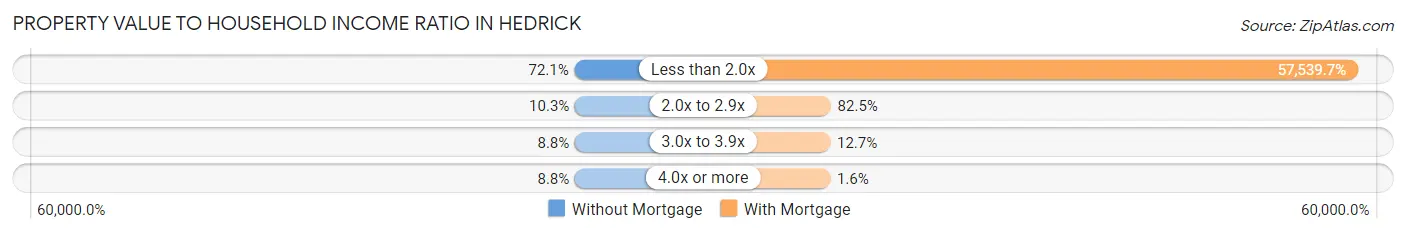
| Value-to-Income Ratio | Without Mortgage | With Mortgage |
| Less than 2.0x | 49 (72.1%) | 72,500 (57,539.7%) |
| 2.0x to 2.9x | 7 (10.3%) | 104 (82.5%) |
| 3.0x to 3.9x | 6 (8.8%) | 16 (12.7%) |
| 4.0x or more | 6 (8.8%) | 2 (1.6%) |
| Total | 68 (100.0%) | 126 (100.0%) |
Real Estate Taxes by Mortgage Status in Hedrick
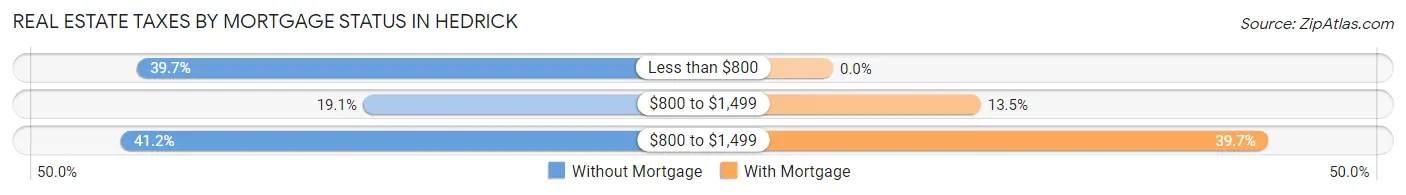
| Property Taxes | Without Mortgage | With Mortgage |
| Less than $800 | 27 (39.7%) | 0 (0.0%) |
| $800 to $1,499 | 13 (19.1%) | 17 (13.5%) |
| $800 to $1,499 | 28 (41.2%) | 50 (39.7%) |
| Total | 68 (100.0%) | 126 (100.0%) |
Health & Disability in Hedrick
Health Insurance Coverage by Age in Hedrick
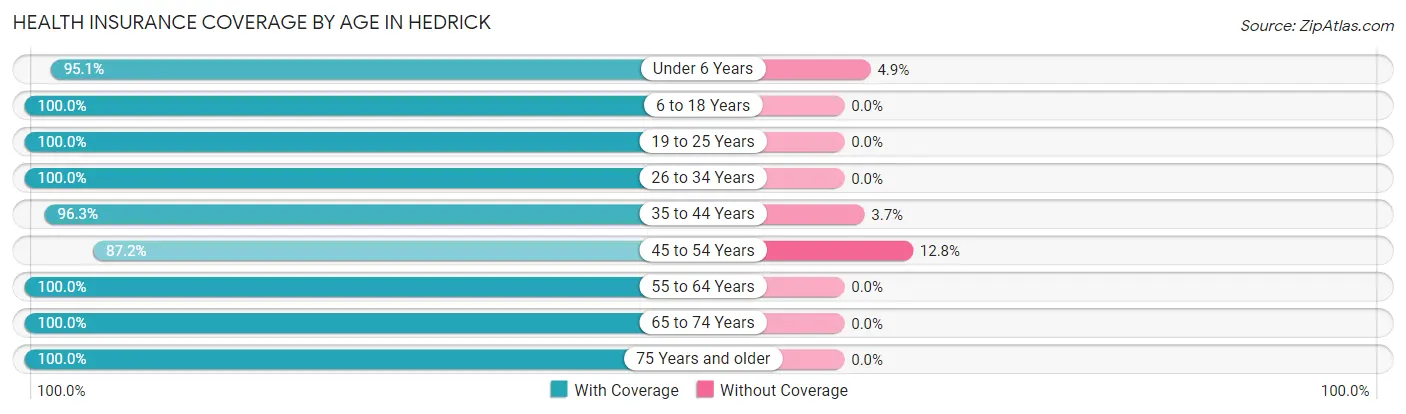
| Age Bracket | With Coverage | Without Coverage |
| Under 6 Years | 39 (95.1%) | 2 (4.9%) |
| 6 to 18 Years | 189 (100.0%) | 0 (0.0%) |
| 19 to 25 Years | 88 (100.0%) | 0 (0.0%) |
| 26 to 34 Years | 58 (100.0%) | 0 (0.0%) |
| 35 to 44 Years | 103 (96.3%) | 4 (3.7%) |
| 45 to 54 Years | 75 (87.2%) | 11 (12.8%) |
| 55 to 64 Years | 76 (100.0%) | 0 (0.0%) |
| 65 to 74 Years | 120 (100.0%) | 0 (0.0%) |
| 75 Years and older | 48 (100.0%) | 0 (0.0%) |
| Total | 796 (97.9%) | 17 (2.1%) |
Health Insurance Coverage by Citizenship Status in Hedrick
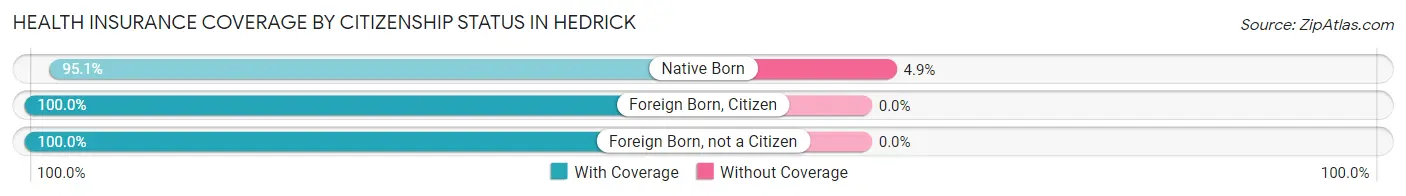
| Citizenship Status | With Coverage | Without Coverage |
| Native Born | 39 (95.1%) | 2 (4.9%) |
| Foreign Born, Citizen | 189 (100.0%) | 0 (0.0%) |
| Foreign Born, not a Citizen | 88 (100.0%) | 0 (0.0%) |
Health Insurance Coverage by Household Income in Hedrick
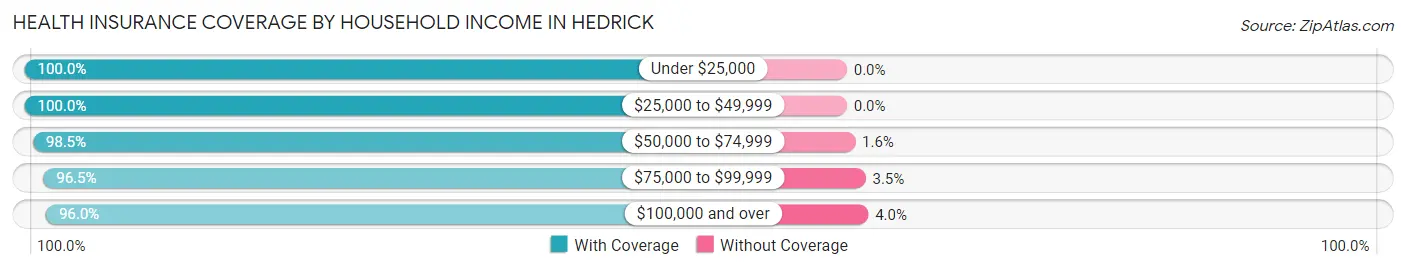
| Household Income | With Coverage | Without Coverage |
| Under $25,000 | 110 (100.0%) | 0 (0.0%) |
| $25,000 to $49,999 | 186 (100.0%) | 0 (0.0%) |
| $50,000 to $74,999 | 127 (98.5%) | 2 (1.5%) |
| $75,000 to $99,999 | 110 (96.5%) | 4 (3.5%) |
| $100,000 and over | 263 (96.0%) | 11 (4.0%) |
Public vs Private Health Insurance Coverage by Age in Hedrick
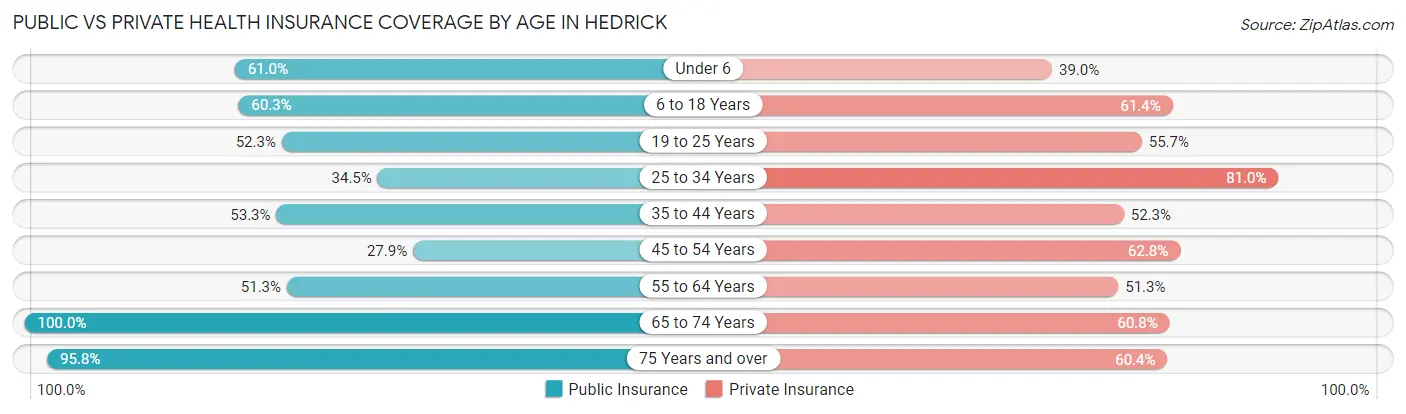
| Age Bracket | Public Insurance | Private Insurance |
| Under 6 | 25 (61.0%) | 16 (39.0%) |
| 6 to 18 Years | 114 (60.3%) | 116 (61.4%) |
| 19 to 25 Years | 46 (52.3%) | 49 (55.7%) |
| 25 to 34 Years | 20 (34.5%) | 47 (81.0%) |
| 35 to 44 Years | 57 (53.3%) | 56 (52.3%) |
| 45 to 54 Years | 24 (27.9%) | 54 (62.8%) |
| 55 to 64 Years | 39 (51.3%) | 39 (51.3%) |
| 65 to 74 Years | 120 (100.0%) | 73 (60.8%) |
| 75 Years and over | 46 (95.8%) | 29 (60.4%) |
| Total | 491 (60.4%) | 479 (58.9%) |
Disability Status by Sex by Age in Hedrick
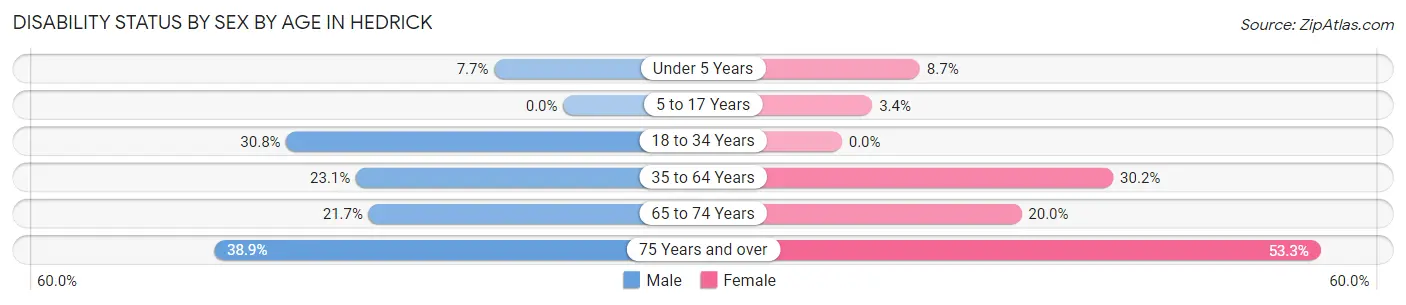
| Age Bracket | Male | Female |
| Under 5 Years | 1 (7.7%) | 2 (8.7%) |
| 5 to 17 Years | 0 (0.0%) | 2 (3.4%) |
| 18 to 34 Years | 33 (30.8%) | 0 (0.0%) |
| 35 to 64 Years | 30 (23.1%) | 42 (30.2%) |
| 65 to 74 Years | 13 (21.7%) | 12 (20.0%) |
| 75 Years and over | 7 (38.9%) | 16 (53.3%) |
Disability Class by Sex by Age in Hedrick
Disability Class: Hearing Difficulty
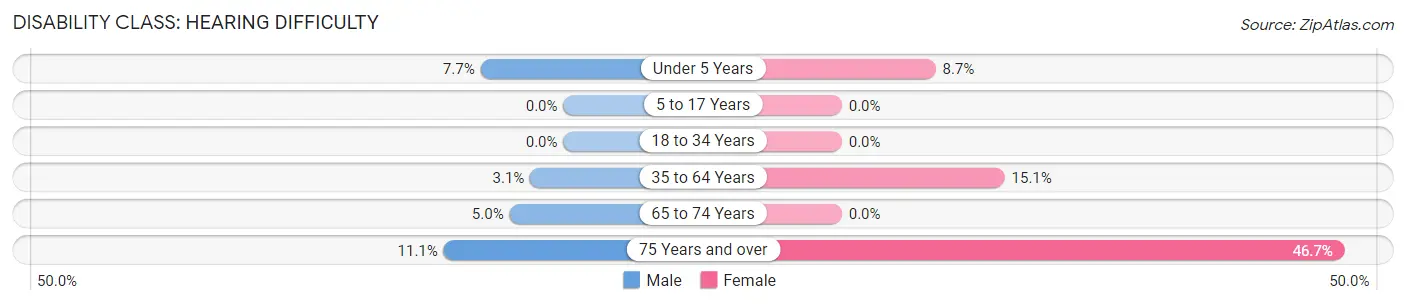
| Age Bracket | Male | Female |
| Under 5 Years | 1 (7.7%) | 2 (8.7%) |
| 5 to 17 Years | 0 (0.0%) | 0 (0.0%) |
| 18 to 34 Years | 0 (0.0%) | 0 (0.0%) |
| 35 to 64 Years | 4 (3.1%) | 21 (15.1%) |
| 65 to 74 Years | 3 (5.0%) | 0 (0.0%) |
| 75 Years and over | 2 (11.1%) | 14 (46.7%) |
Disability Class: Vision Difficulty
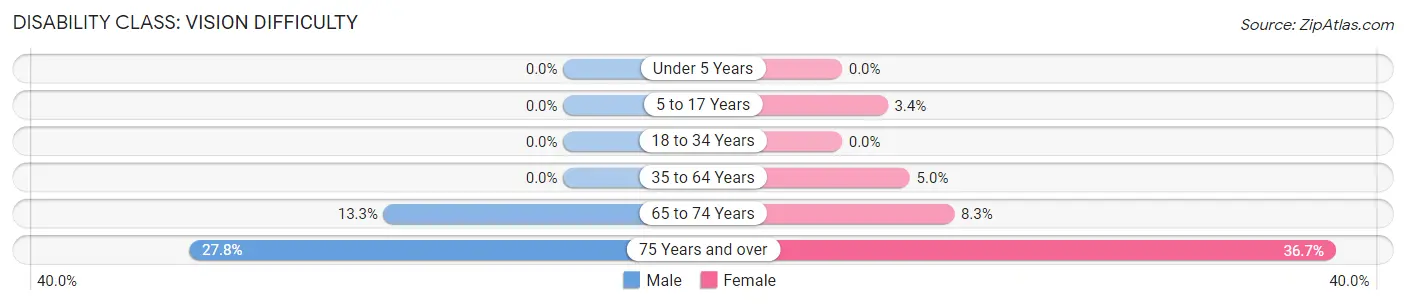
| Age Bracket | Male | Female |
| Under 5 Years | 0 (0.0%) | 0 (0.0%) |
| 5 to 17 Years | 0 (0.0%) | 2 (3.4%) |
| 18 to 34 Years | 0 (0.0%) | 0 (0.0%) |
| 35 to 64 Years | 0 (0.0%) | 7 (5.0%) |
| 65 to 74 Years | 8 (13.3%) | 5 (8.3%) |
| 75 Years and over | 5 (27.8%) | 11 (36.7%) |
Disability Class: Cognitive Difficulty
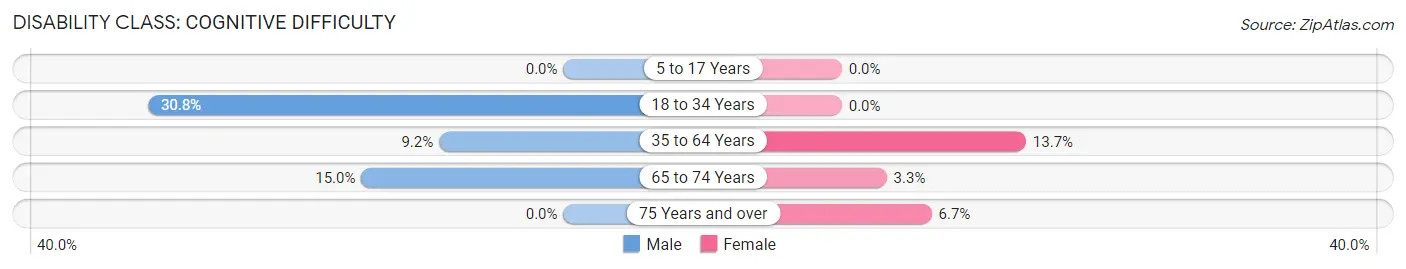
| Age Bracket | Male | Female |
| 5 to 17 Years | 0 (0.0%) | 0 (0.0%) |
| 18 to 34 Years | 33 (30.8%) | 0 (0.0%) |
| 35 to 64 Years | 12 (9.2%) | 19 (13.7%) |
| 65 to 74 Years | 9 (15.0%) | 2 (3.3%) |
| 75 Years and over | 0 (0.0%) | 2 (6.7%) |
Disability Class: Ambulatory Difficulty
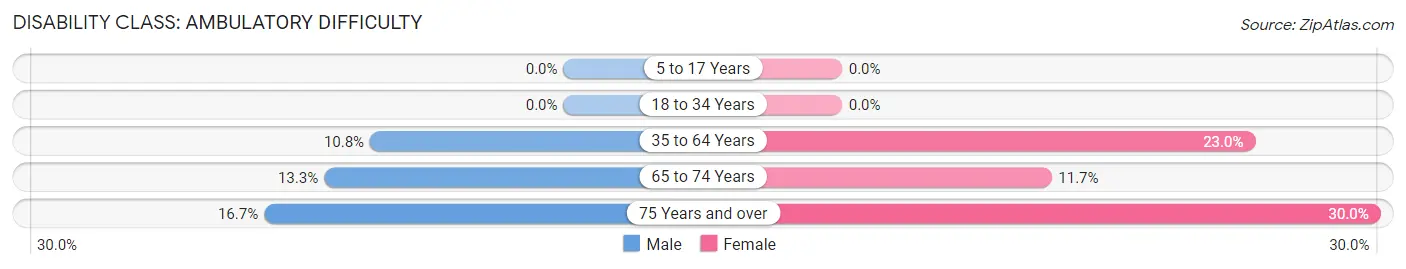
| Age Bracket | Male | Female |
| 5 to 17 Years | 0 (0.0%) | 0 (0.0%) |
| 18 to 34 Years | 0 (0.0%) | 0 (0.0%) |
| 35 to 64 Years | 14 (10.8%) | 32 (23.0%) |
| 65 to 74 Years | 8 (13.3%) | 7 (11.7%) |
| 75 Years and over | 3 (16.7%) | 9 (30.0%) |
Disability Class: Self-Care Difficulty
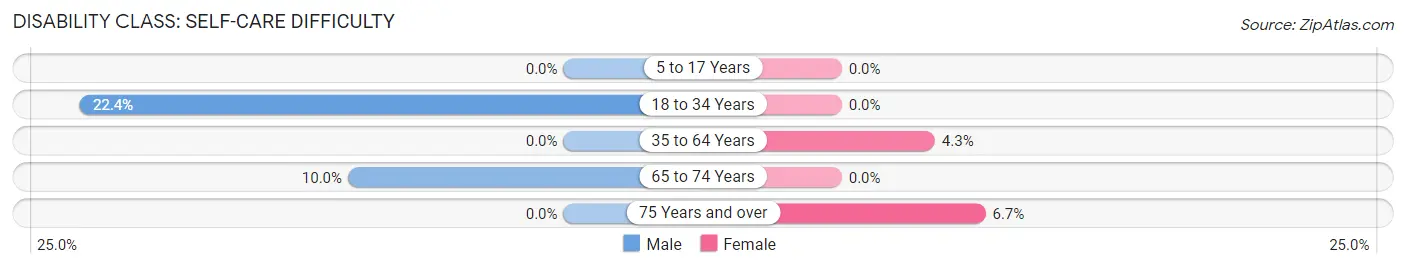
| Age Bracket | Male | Female |
| 5 to 17 Years | 0 (0.0%) | 0 (0.0%) |
| 18 to 34 Years | 24 (22.4%) | 0 (0.0%) |
| 35 to 64 Years | 0 (0.0%) | 6 (4.3%) |
| 65 to 74 Years | 6 (10.0%) | 0 (0.0%) |
| 75 Years and over | 0 (0.0%) | 2 (6.7%) |
Technology Access in Hedrick
Computing Device Access in Hedrick
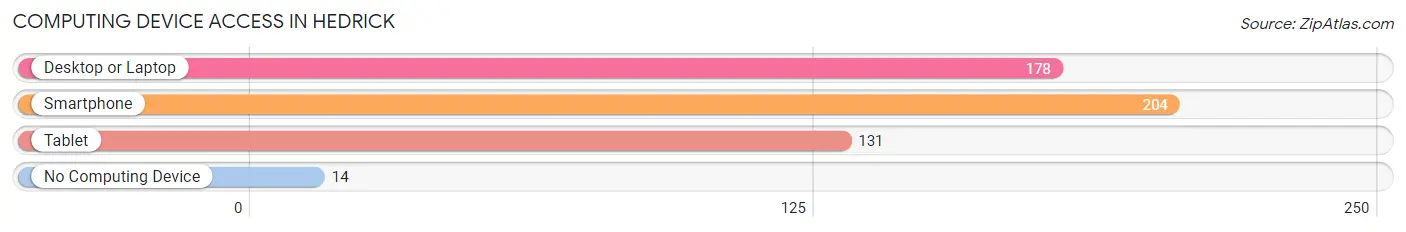
| Device Type | # Households | % Households |
| Desktop or Laptop | 178 | 68.5% |
| Smartphone | 204 | 78.5% |
| Tablet | 131 | 50.4% |
| No Computing Device | 14 | 5.4% |
| Total | 260 | 100.0% |
Internet Access in Hedrick
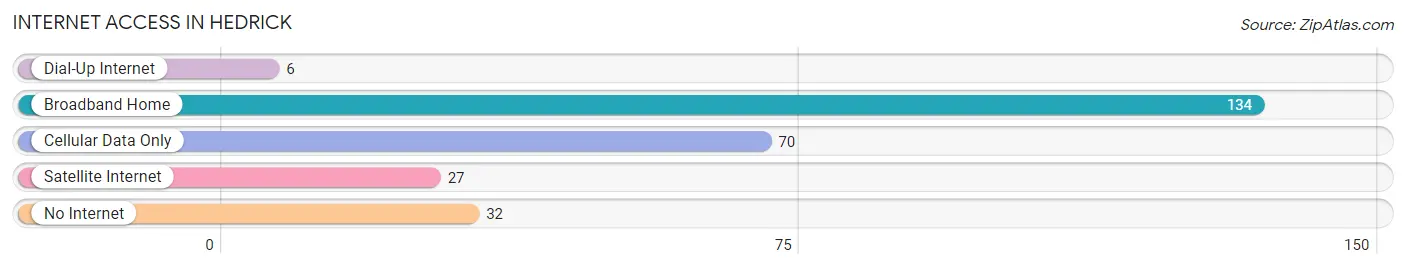
| Internet Type | # Households | % Households |
| Dial-Up Internet | 6 | 2.3% |
| Broadband Home | 134 | 51.5% |
| Cellular Data Only | 70 | 26.9% |
| Satellite Internet | 27 | 10.4% |
| No Internet | 32 | 12.3% |
| Total | 260 | 100.0% |
Hedrick Summary
Hedrick is a small town located in Keokuk County, Iowa. It is situated in the southeastern corner of the state, about 25 miles south of Iowa City. The population of Hedrick was estimated to be 545 in 2020.
Hedrick was founded in 1854 by a group of settlers from Ohio. The town was named after a local farmer, John Hedrick, who donated the land for the town. The first post office was established in 1856.
Hedrick is located in a rural area of Iowa, and the economy is largely based on agriculture. The town is home to several farms, as well as a few small businesses. The main crops grown in the area are corn, soybeans, and hay.
The town is served by the Hedrick-Keokuk Community School District, which includes two elementary schools, a middle school, and a high school. The district also operates a public library.
Hedrick is home to several churches, including the First United Methodist Church, the First Presbyterian Church, and the Church of the Nazarene. The town also has a volunteer fire department and a volunteer ambulance service.
Hedrick is located in a rural area of Iowa, and the population is largely white. The median household income in Hedrick is $45,000, and the median home value is $90,000. The town has a low crime rate, and the unemployment rate is below the national average.
Hedrick is a small town with a rich history and a strong sense of community. The town is home to several farms, churches, and businesses, and the residents take pride in their town and its history. Hedrick is a great place to live and raise a family, and it is a great place to visit.
Common Questions
What is Per Capita Income in Hedrick?
Per Capita income in Hedrick is $24,073.
What is the Median Family Income in Hedrick?
Median Family Income in Hedrick is $79,688.
What is the Median Household income in Hedrick?
Median Household Income in Hedrick is $59,375.
What is Income or Wage Gap in Hedrick?
Income or Wage Gap in Hedrick is 41.7%.
Women in Hedrick earn 58.3 cents for every dollar earned by a man.
What is Inequality or Gini Index in Hedrick?
Inequality or Gini Index in Hedrick is 0.39.
What is the Total Population of Hedrick?
Total Population of Hedrick is 813.
What is the Total Male Population of Hedrick?
Total Male Population of Hedrick is 426.
What is the Total Female Population of Hedrick?
Total Female Population of Hedrick is 387.
What is the Ratio of Males per 100 Females in Hedrick?
There are 110.08 Males per 100 Females in Hedrick.
What is the Ratio of Females per 100 Males in Hedrick?
There are 90.85 Females per 100 Males in Hedrick.
What is the Median Population Age in Hedrick?
Median Population Age in Hedrick is 38.5 Years.
What is the Average Family Size in Hedrick
Average Family Size in Hedrick is 3.9 People.
What is the Average Household Size in Hedrick
Average Household Size in Hedrick is 3.1 People.
How Large is the Labor Force in Hedrick?
There are 333 People in the Labor Forcein in Hedrick.
What is the Percentage of People in the Labor Force in Hedrick?
50.5% of People are in the Labor Force in Hedrick.
What is the Unemployment Rate in Hedrick?
Unemployment Rate in Hedrick is 9.3%.