Galva, IA Map & Demographics
Galva Map
Galva Overview
$26,421
PER CAPITA INCOME
$77,188
AVG FAMILY INCOME
$66,250
AVG HOUSEHOLD INCOME
40.8%
WAGE / INCOME GAP [ % ]
59.2¢/ $1
WAGE / INCOME GAP [ $ ]
0.38
INEQUALITY / GINI INDEX
444
TOTAL POPULATION
225
MALE POPULATION
219
FEMALE POPULATION
102.74
MALES / 100 FEMALES
97.33
FEMALES / 100 MALES
29.5
MEDIAN AGE
3.9
AVG FAMILY SIZE
2.9
AVG HOUSEHOLD SIZE
211
LABOR FORCE [ PEOPLE ]
73.0%
PERCENT IN LABOR FORCE
Galva Zip Codes
Galva Area Codes
Income in Galva
Income Overview in Galva
Per Capita Income in Galva is $26,421, while median incomes of families and households are $77,188 and $66,250 respectively.
| Characteristic | Number | Measure |
| Per Capita Income | 444 | $26,421 |
| Median Family Income | 96 | $77,188 |
| Mean Family Income | 96 | $92,028 |
| Median Household Income | 154 | $66,250 |
| Mean Household Income | 154 | $75,694 |
| Income Deficit | 96 | $0 |
| Wage / Income Gap (%) | 444 | 40.82% |
| Wage / Income Gap ($) | 444 | 59.18¢ per $1 |
| Gini / Inequality Index | 444 | 0.38 |
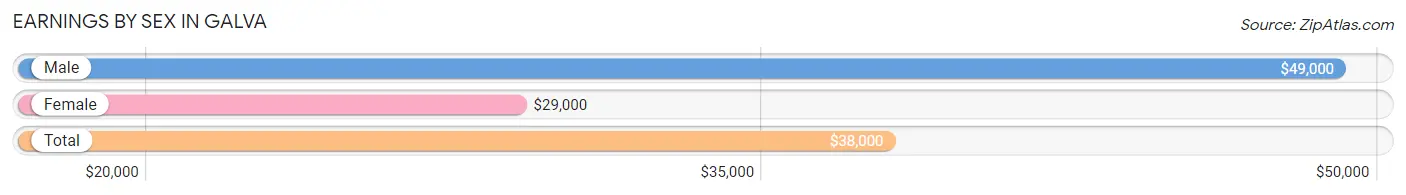
Earnings by Sex in Galva
Average Earnings in Galva are $38,000, $49,000 for men and $29,000 for women, a difference of 40.8%.
| Sex | Number | Average Earnings |
| Male | 134 (58.3%) | $49,000 |
| Female | 96 (41.7%) | $29,000 |
| Total | 230 (100.0%) | $38,000 |
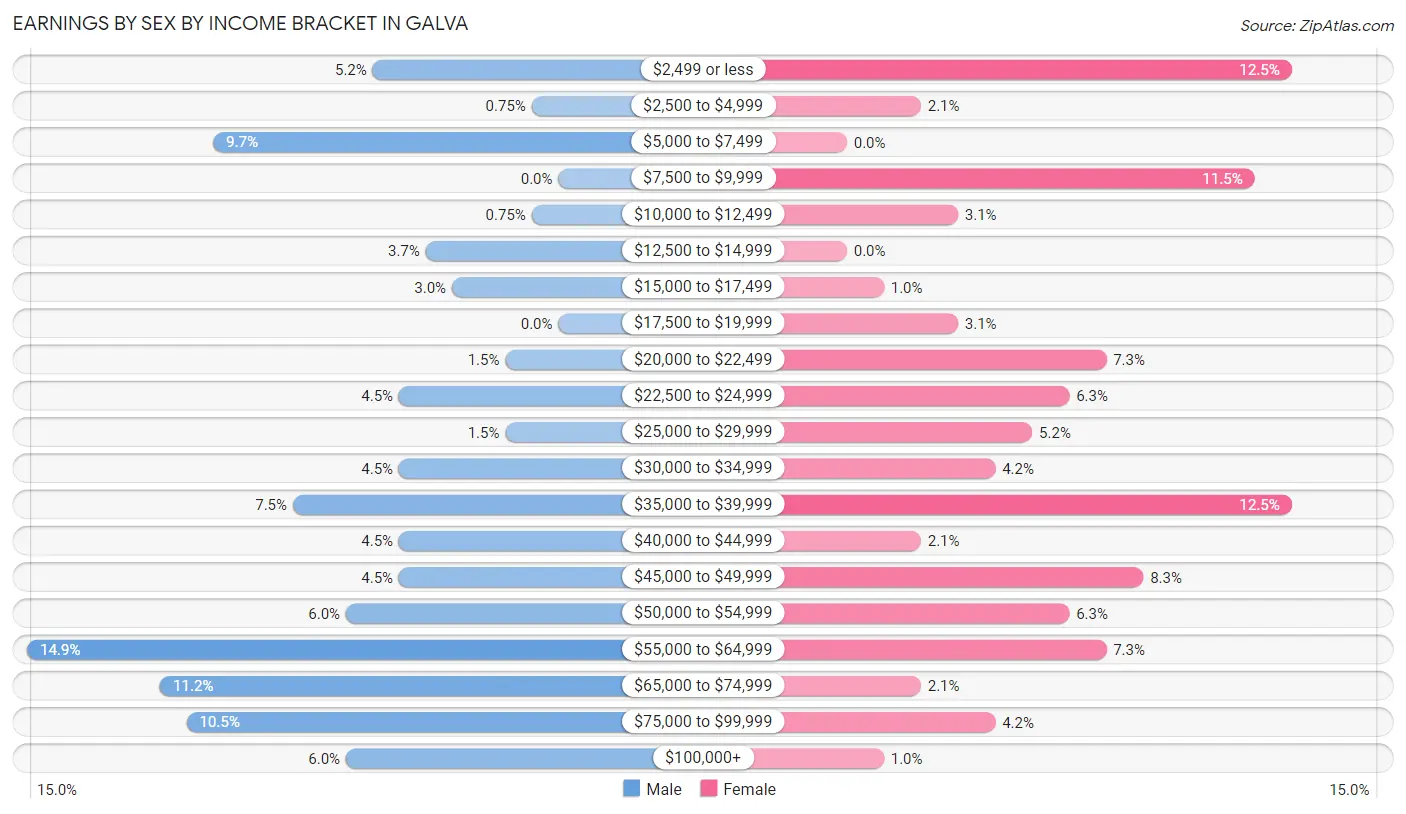
Earnings by Sex by Income Bracket in Galva
The most common earnings brackets in Galva are $55,000 to $64,999 for men (20 | 14.9%) and $2,499 or less for women (12 | 12.5%).
| Income | Male | Female |
| $2,499 or less | 7 (5.2%) | 12 (12.5%) |
| $2,500 to $4,999 | 1 (0.7%) | 2 (2.1%) |
| $5,000 to $7,499 | 13 (9.7%) | 0 (0.0%) |
| $7,500 to $9,999 | 0 (0.0%) | 11 (11.5%) |
| $10,000 to $12,499 | 1 (0.7%) | 3 (3.1%) |
| $12,500 to $14,999 | 5 (3.7%) | 0 (0.0%) |
| $15,000 to $17,499 | 4 (3.0%) | 1 (1.0%) |
| $17,500 to $19,999 | 0 (0.0%) | 3 (3.1%) |
| $20,000 to $22,499 | 2 (1.5%) | 7 (7.3%) |
| $22,500 to $24,999 | 6 (4.5%) | 6 (6.2%) |
| $25,000 to $29,999 | 2 (1.5%) | 5 (5.2%) |
| $30,000 to $34,999 | 6 (4.5%) | 4 (4.2%) |
| $35,000 to $39,999 | 10 (7.5%) | 12 (12.5%) |
| $40,000 to $44,999 | 6 (4.5%) | 2 (2.1%) |
| $45,000 to $49,999 | 6 (4.5%) | 8 (8.3%) |
| $50,000 to $54,999 | 8 (6.0%) | 6 (6.2%) |
| $55,000 to $64,999 | 20 (14.9%) | 7 (7.3%) |
| $65,000 to $74,999 | 15 (11.2%) | 2 (2.1%) |
| $75,000 to $99,999 | 14 (10.4%) | 4 (4.2%) |
| $100,000+ | 8 (6.0%) | 1 (1.0%) |
| Total | 134 (100.0%) | 96 (100.0%) |
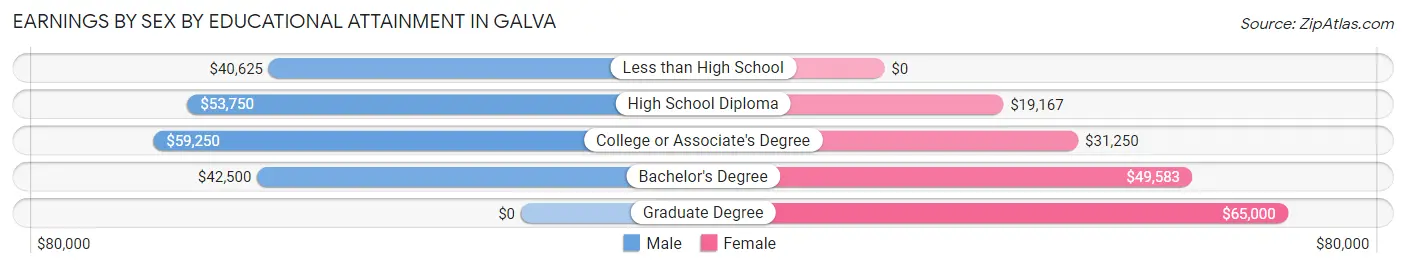
Earnings by Sex by Educational Attainment in Galva
Average earnings in Galva are $52,083 for men and $34,375 for women, a difference of 34.0%. Men with an educational attainment of college or associate's degree enjoy the highest average annual earnings of $59,250, while those with less than high school education earn the least with $40,625. Women with an educational attainment of graduate degree earn the most with the average annual earnings of $65,000, while those with high school diploma education have the smallest earnings of $19,167.
| Educational Attainment | Male Income | Female Income |
| Less than High School | $40,625 | $0 |
| High School Diploma | $53,750 | $19,167 |
| College or Associate's Degree | $59,250 | $31,250 |
| Bachelor's Degree | $42,500 | $49,583 |
| Graduate Degree | - | - |
| Total | $52,083 | $34,375 |
Family Income in Galva
Family Income Brackets in Galva
According to the Galva family income data, there are 28 families falling into the $100,000 to $149,999 income range, which is the most common income bracket and makes up 29.2% of all families.
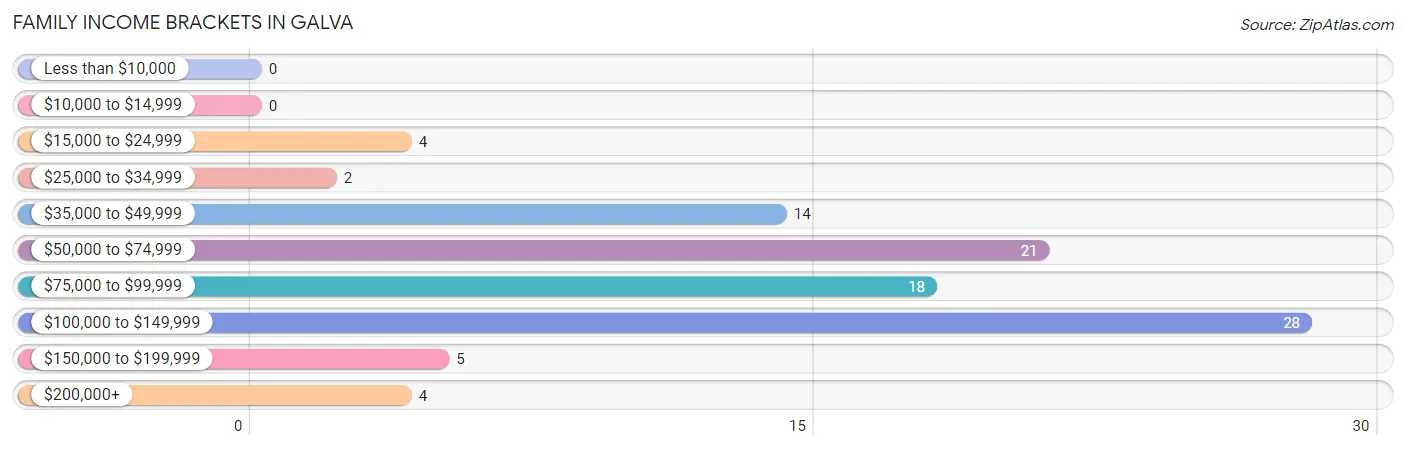
| Income Bracket | # Families | % Families |
| Less than $10,000 | 0 | 0.0% |
| $10,000 to $14,999 | 0 | 0.0% |
| $15,000 to $24,999 | 4 | 4.2% |
| $25,000 to $34,999 | 2 | 2.1% |
| $35,000 to $49,999 | 14 | 14.6% |
| $50,000 to $74,999 | 21 | 21.9% |
| $75,000 to $99,999 | 18 | 18.8% |
| $100,000 to $149,999 | 28 | 29.2% |
| $150,000 to $199,999 | 5 | 5.2% |
| $200,000+ | 4 | 4.2% |
Family Income by Famaliy Size in Galva
5-person families (10 | 10.4%) account for the highest median family income in Galva with $113,125 per family, while 2-person families (46 | 47.9%) have the highest median income of $38,282 per family member.
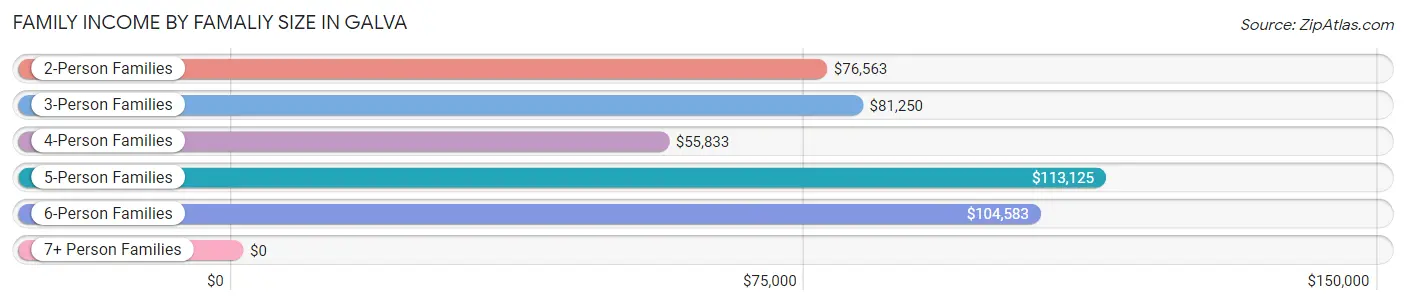
| Income Bracket | # Families | Median Income |
| 2-Person Families | 46 (47.9%) | $76,563 |
| 3-Person Families | 19 (19.8%) | $81,250 |
| 4-Person Families | 12 (12.5%) | $55,833 |
| 5-Person Families | 10 (10.4%) | $113,125 |
| 6-Person Families | 7 (7.3%) | $104,583 |
| 7+ Person Families | 2 (2.1%) | $0 |
| Total | 96 (100.0%) | $77,188 |
Family Income by Number of Earners in Galva
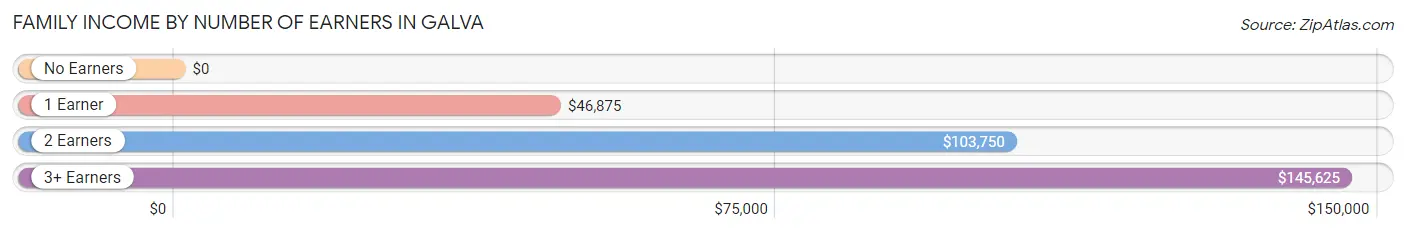
| Number of Earners | # Families | Median Income |
| No Earners | 5 (5.2%) | $0 |
| 1 Earner | 27 (28.1%) | $46,875 |
| 2 Earners | 57 (59.4%) | $103,750 |
| 3+ Earners | 7 (7.3%) | $145,625 |
| Total | 96 (100.0%) | $77,188 |
Household Income in Galva
Household Income Brackets in Galva
With 33 households falling in the category, the $100,000 to $149,999 income range is the most frequent in Galva, accounting for 21.4% of all households. In contrast, only 2 households (1.3%) fall into the $10,000 to $14,999 income bracket, making it the least populous group.
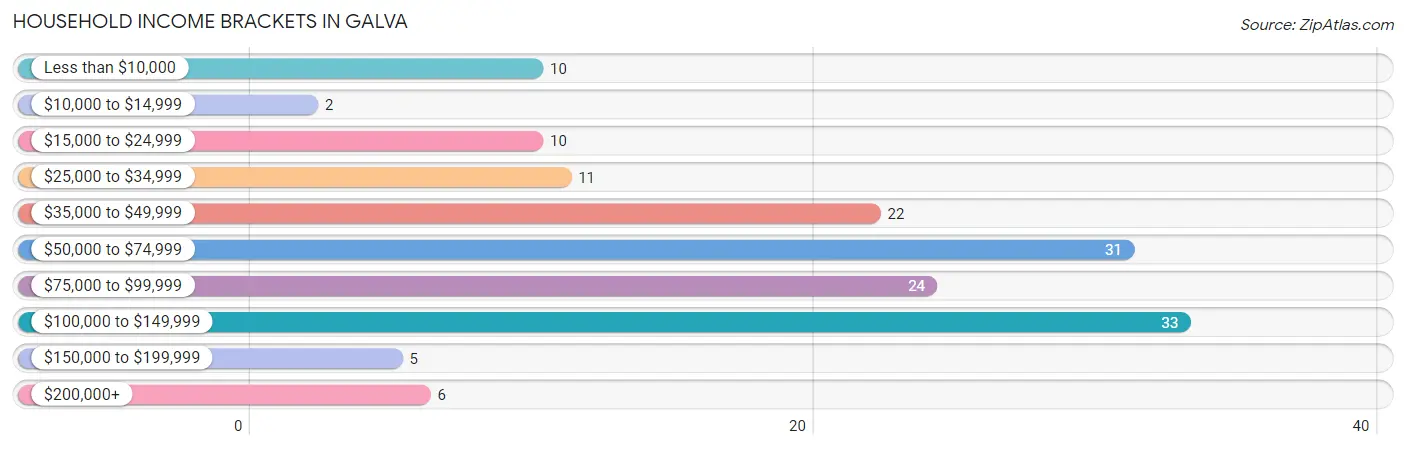
| Income Bracket | # Households | % Households |
| Less than $10,000 | 10 | 6.5% |
| $10,000 to $14,999 | 2 | 1.3% |
| $15,000 to $24,999 | 10 | 6.5% |
| $25,000 to $34,999 | 11 | 7.1% |
| $35,000 to $49,999 | 22 | 14.3% |
| $50,000 to $74,999 | 31 | 20.1% |
| $75,000 to $99,999 | 24 | 15.6% |
| $100,000 to $149,999 | 33 | 21.4% |
| $150,000 to $199,999 | 5 | 3.2% |
| $200,000+ | 6 | 3.9% |
Household Income by Householder Age in Galva
The median household income in Galva is $66,250, with the highest median household income of $78,750 found in the 45 to 64 years age bracket for the primary householder. A total of 50 households (32.5%) fall into this category. Meanwhile, the 15 to 24 years age bracket for the primary householder has the lowest median household income of $35,625, with 13 households (8.4%) in this group.
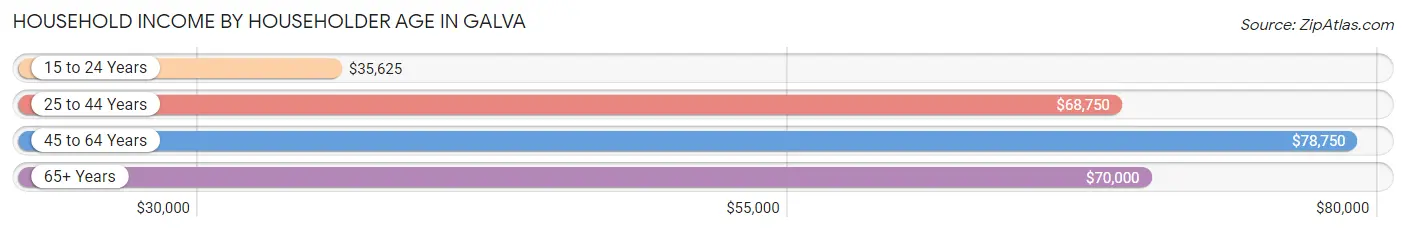
| Income Bracket | # Households | Median Income |
| 15 to 24 Years | 13 (8.4%) | $35,625 |
| 25 to 44 Years | 57 (37.0%) | $68,750 |
| 45 to 64 Years | 50 (32.5%) | $78,750 |
| 65+ Years | 34 (22.1%) | $70,000 |
| Total | 154 (100.0%) | $66,250 |
Poverty in Galva
Income Below Poverty by Sex and Age in Galva
With 18.2% poverty level for males and 25.6% for females among the residents of Galva, 6 to 11 year old males and 18 to 24 year old females are the most vulnerable to poverty, with 22 males (56.4%) and 19 females (100.0%) in their respective age groups living below the poverty level.
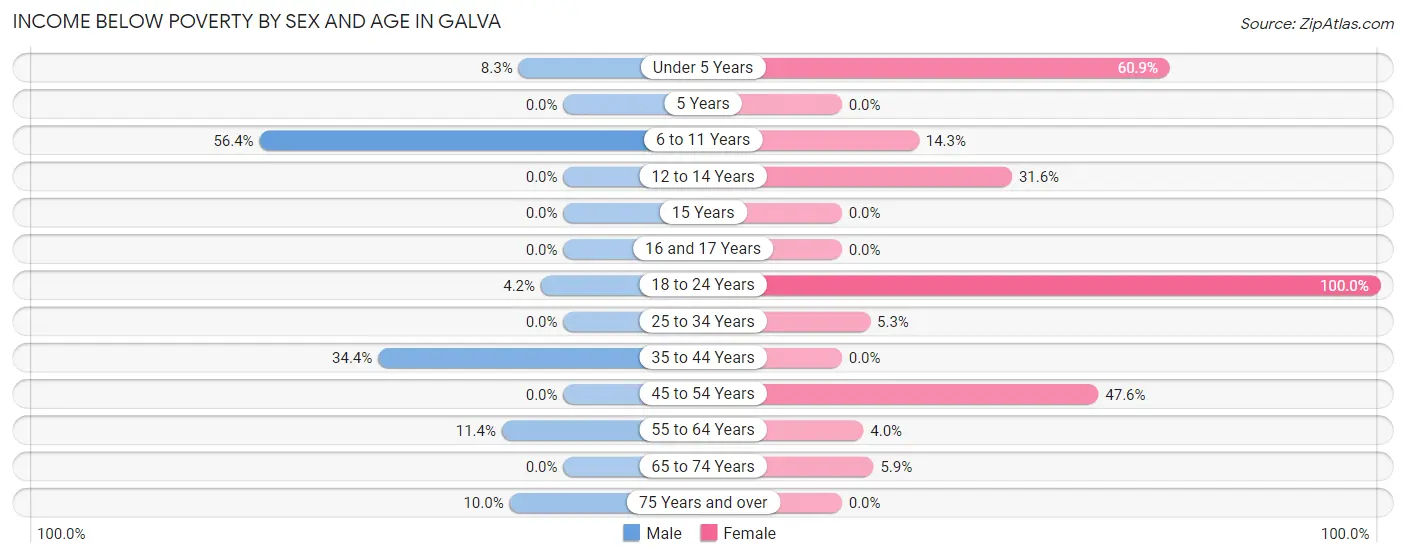
| Age Bracket | Male | Female |
| Under 5 Years | 2 (8.3%) | 14 (60.9%) |
| 5 Years | 0 (0.0%) | 0 (0.0%) |
| 6 to 11 Years | 22 (56.4%) | 3 (14.3%) |
| 12 to 14 Years | 0 (0.0%) | 6 (31.6%) |
| 15 Years | 0 (0.0%) | 0 (0.0%) |
| 16 and 17 Years | 0 (0.0%) | 0 (0.0%) |
| 18 to 24 Years | 1 (4.2%) | 19 (100.0%) |
| 25 to 34 Years | 0 (0.0%) | 2 (5.3%) |
| 35 to 44 Years | 11 (34.4%) | 0 (0.0%) |
| 45 to 54 Years | 0 (0.0%) | 10 (47.6%) |
| 55 to 64 Years | 4 (11.4%) | 1 (4.0%) |
| 65 to 74 Years | 0 (0.0%) | 1 (5.9%) |
| 75 Years and over | 1 (10.0%) | 0 (0.0%) |
| Total | 41 (18.2%) | 56 (25.6%) |
Income Above Poverty by Sex and Age in Galva
According to the poverty statistics in Galva, males aged 5 years and females aged 5 years are the age groups that are most secure financially, with 100.0% of males and 100.0% of females in these age groups living above the poverty line.
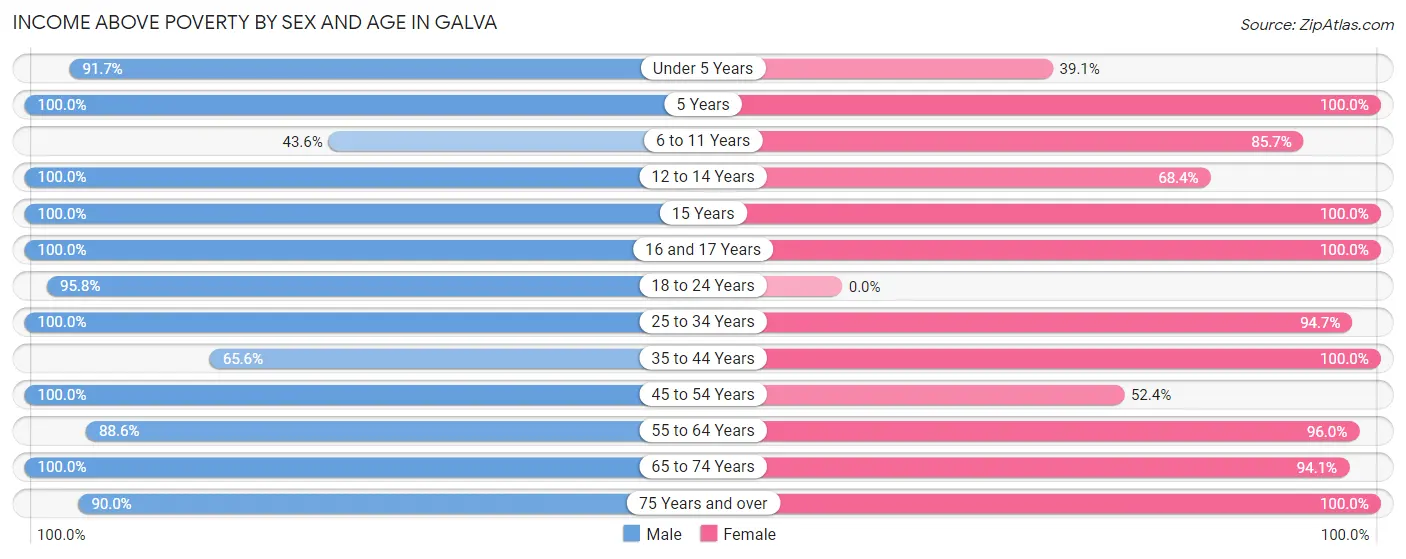
| Age Bracket | Male | Female |
| Under 5 Years | 22 (91.7%) | 9 (39.1%) |
| 5 Years | 3 (100.0%) | 12 (100.0%) |
| 6 to 11 Years | 17 (43.6%) | 18 (85.7%) |
| 12 to 14 Years | 10 (100.0%) | 13 (68.4%) |
| 15 Years | 3 (100.0%) | 1 (100.0%) |
| 16 and 17 Years | 2 (100.0%) | 2 (100.0%) |
| 18 to 24 Years | 23 (95.8%) | 0 (0.0%) |
| 25 to 34 Years | 25 (100.0%) | 36 (94.7%) |
| 35 to 44 Years | 21 (65.6%) | 8 (100.0%) |
| 45 to 54 Years | 6 (100.0%) | 11 (52.4%) |
| 55 to 64 Years | 31 (88.6%) | 24 (96.0%) |
| 65 to 74 Years | 12 (100.0%) | 16 (94.1%) |
| 75 Years and over | 9 (90.0%) | 13 (100.0%) |
| Total | 184 (81.8%) | 163 (74.4%) |
Income Below Poverty Among Married-Couple Families in Galva
The poverty statistics for married-couple families in Galva show that 1.3% or 1 of the total 80 families live below the poverty line. Families with 1 or 2 children have the highest poverty rate of 7.1%, comprising of 1 families. On the other hand, families with no children have the lowest poverty rate of 0.0%, which includes 0 families.
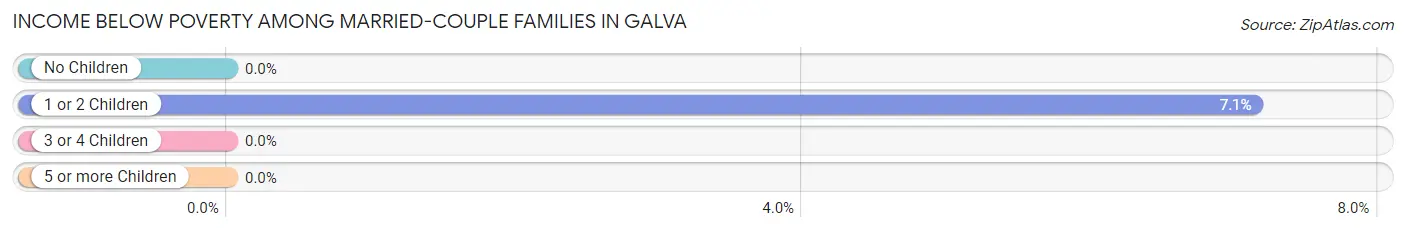
| Children | Above Poverty | Below Poverty |
| No Children | 50 (100.0%) | 0 (0.0%) |
| 1 or 2 Children | 13 (92.9%) | 1 (7.1%) |
| 3 or 4 Children | 14 (100.0%) | 0 (0.0%) |
| 5 or more Children | 2 (100.0%) | 0 (0.0%) |
| Total | 79 (98.8%) | 1 (1.3%) |
Income Below Poverty Among Single-Parent Households in Galva
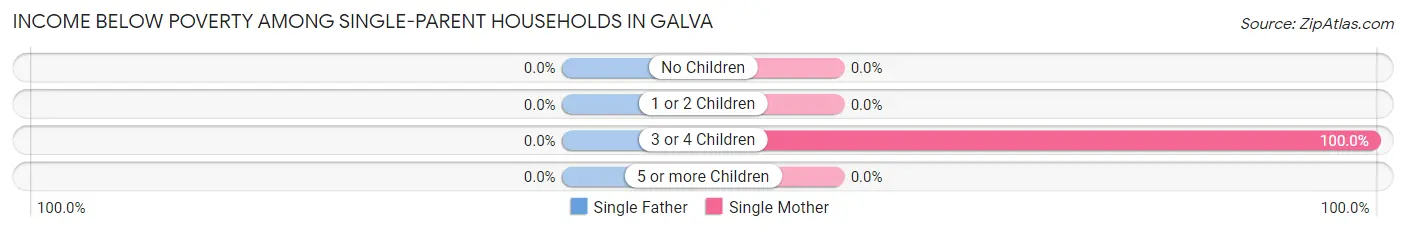
| Children | Single Father | Single Mother |
| No Children | 0 (0.0%) | 0 (0.0%) |
| 1 or 2 Children | 0 (0.0%) | 0 (0.0%) |
| 3 or 4 Children | 0 (0.0%) | 3 (100.0%) |
| 5 or more Children | 0 (0.0%) | 0 (0.0%) |
| Total | 0 (0.0%) | 3 (25.0%) |
Income Below Poverty Among Married-Couple vs Single-Parent Households in Galva
The poverty data for Galva shows that 1 of the married-couple family households (1.3%) and 3 of the single-parent households (18.8%) are living below the poverty level. Within the married-couple family households, those with 1 or 2 children have the highest poverty rate, with 1 households (7.1%) falling below the poverty line. Among the single-parent households, those with 3 or 4 children have the highest poverty rate, with 3 household (100.0%) living below poverty.
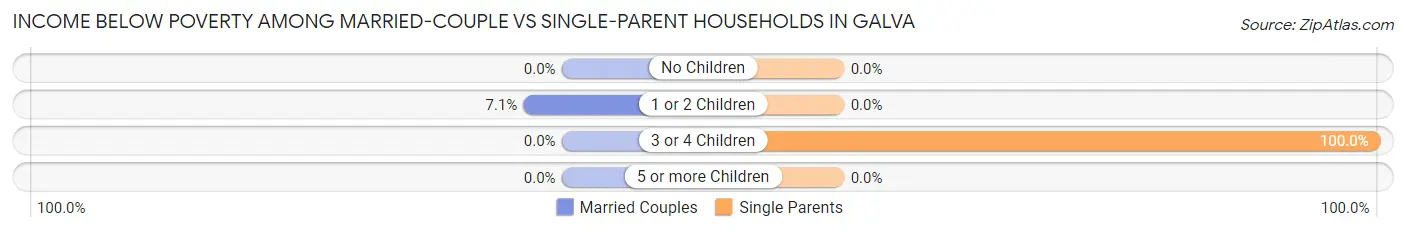
| Children | Married-Couple Families | Single-Parent Households |
| No Children | 0 (0.0%) | 0 (0.0%) |
| 1 or 2 Children | 1 (7.1%) | 0 (0.0%) |
| 3 or 4 Children | 0 (0.0%) | 3 (100.0%) |
| 5 or more Children | 0 (0.0%) | 0 (0.0%) |
| Total | 1 (1.3%) | 3 (18.8%) |
Race in Galva
The most populous races in Galva are White / Caucasian (415 | 93.5%), Hispanic or Latino (31 | 7.0%), and Two or more Races (16 | 3.6%).
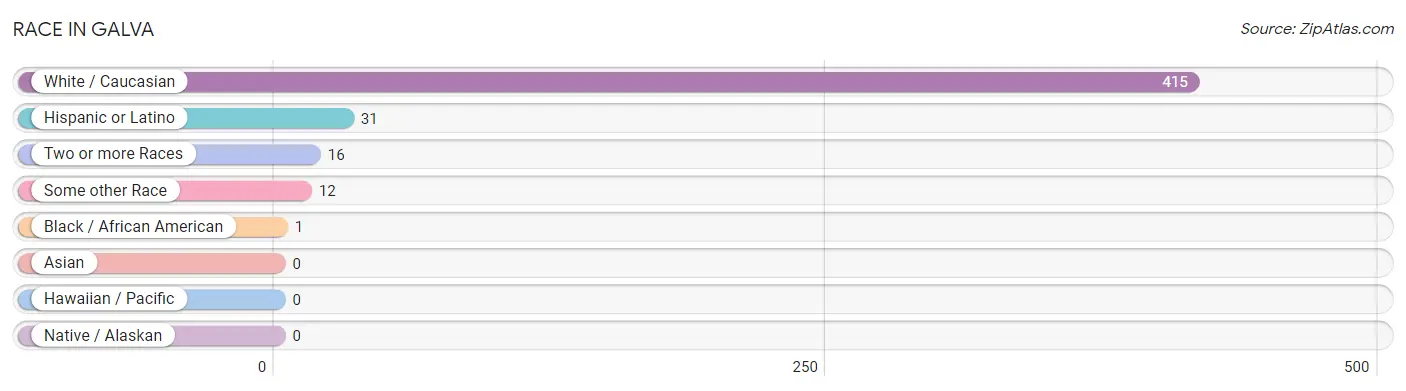
| Race | # Population | % Population |
| Asian | 0 | 0.0% |
| Black / African American | 1 | 0.2% |
| Hawaiian / Pacific | 0 | 0.0% |
| Hispanic or Latino | 31 | 7.0% |
| Native / Alaskan | 0 | 0.0% |
| White / Caucasian | 415 | 93.5% |
| Two or more Races | 16 | 3.6% |
| Some other Race | 12 | 2.7% |
| Total | 444 | 100.0% |
Ancestry in Galva
The most populous ancestries reported in Galva are German (225 | 50.7%), Irish (54 | 12.2%), English (30 | 6.8%), Mexican (29 | 6.5%), and Swedish (24 | 5.4%), together accounting for 81.5% of all Galva residents.
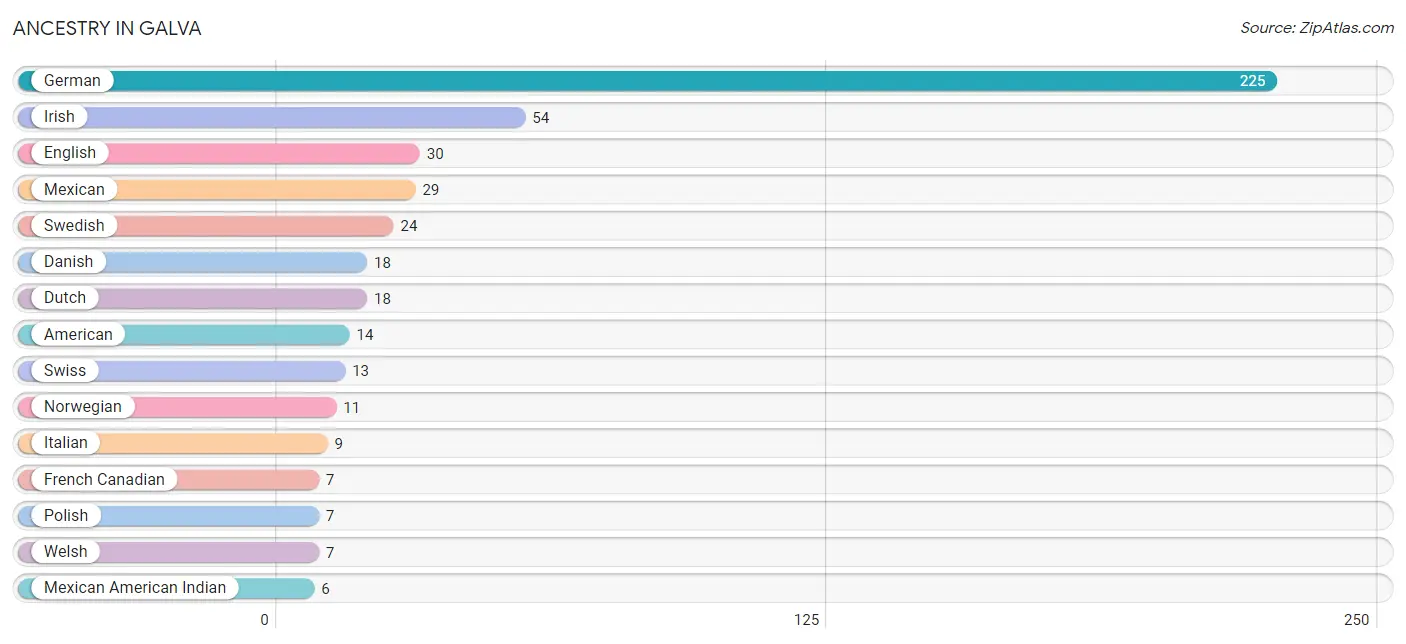
| Ancestry | # Population | % Population |
| American | 14 | 3.2% |
| Danish | 18 | 4.1% |
| Dutch | 18 | 4.1% |
| English | 30 | 6.8% |
| European | 2 | 0.4% |
| French | 4 | 0.9% |
| French Canadian | 7 | 1.6% |
| German | 225 | 50.7% |
| Irish | 54 | 12.2% |
| Italian | 9 | 2.0% |
| Luxembourger | 1 | 0.2% |
| Mexican | 29 | 6.5% |
| Mexican American Indian | 6 | 1.3% |
| Northern European | 2 | 0.4% |
| Norwegian | 11 | 2.5% |
| Polish | 7 | 1.6% |
| Samoan | 2 | 0.4% |
| Scandinavian | 1 | 0.2% |
| Scotch-Irish | 6 | 1.3% |
| Scottish | 1 | 0.2% |
| Swedish | 24 | 5.4% |
| Swiss | 13 | 2.9% |
| Welsh | 7 | 1.6% | View All 23 Rows |
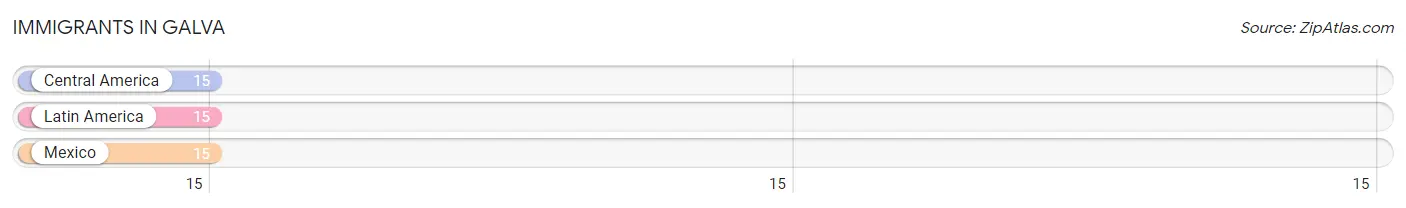
Immigrants in Galva
The most numerous immigrant groups reported in Galva came from Central America (15 | 3.4%), Latin America (15 | 3.4%), and Mexico (15 | 3.4%), together accounting for 10.1% of all Galva residents.
| Immigration Origin | # Population | % Population |
| Central America | 15 | 3.4% |
| Latin America | 15 | 3.4% |
| Mexico | 15 | 3.4% | View All 3 Rows |
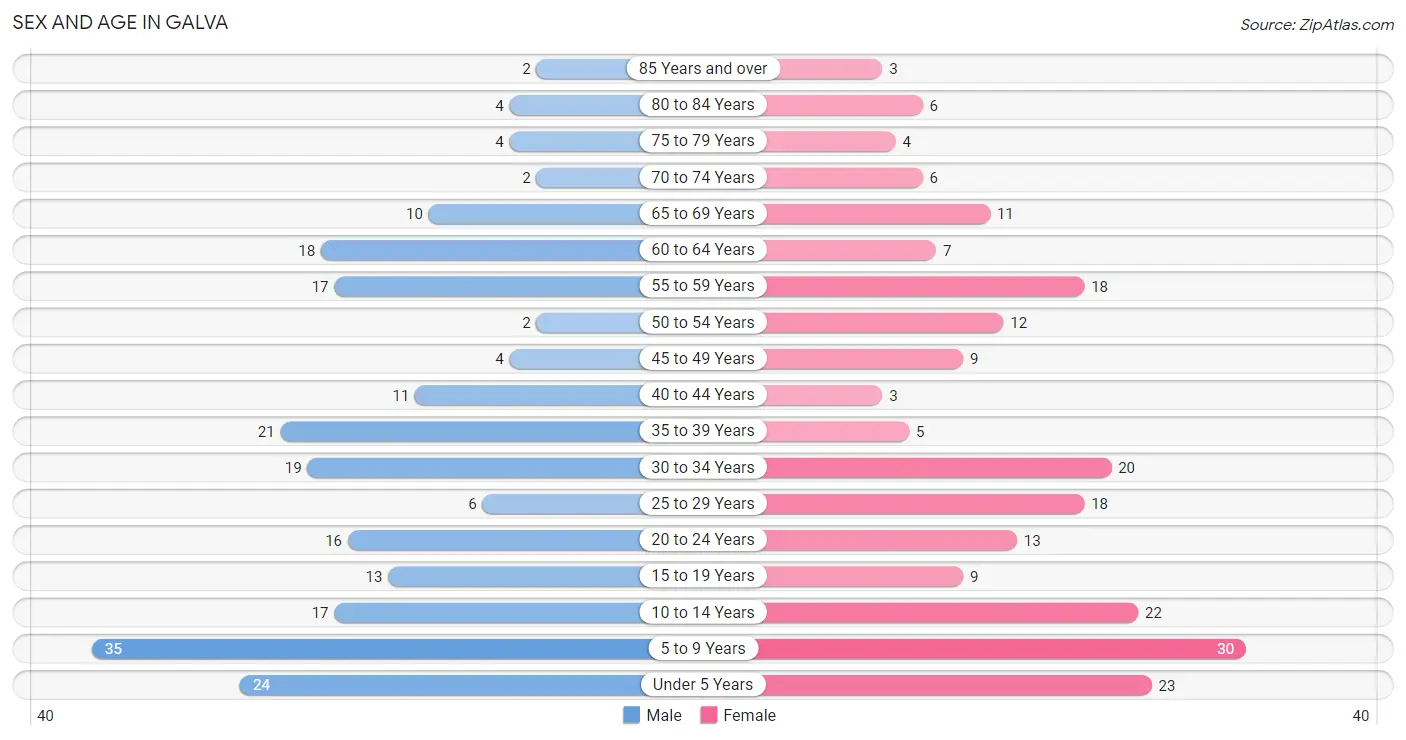
Sex and Age in Galva
Sex and Age in Galva
The most populous age groups in Galva are 5 to 9 Years (35 | 15.6%) for men and 5 to 9 Years (30 | 13.7%) for women.
| Age Bracket | Male | Female |
| Under 5 Years | 24 (10.7%) | 23 (10.5%) |
| 5 to 9 Years | 35 (15.6%) | 30 (13.7%) |
| 10 to 14 Years | 17 (7.6%) | 22 (10.1%) |
| 15 to 19 Years | 13 (5.8%) | 9 (4.1%) |
| 20 to 24 Years | 16 (7.1%) | 13 (5.9%) |
| 25 to 29 Years | 6 (2.7%) | 18 (8.2%) |
| 30 to 34 Years | 19 (8.4%) | 20 (9.1%) |
| 35 to 39 Years | 21 (9.3%) | 5 (2.3%) |
| 40 to 44 Years | 11 (4.9%) | 3 (1.4%) |
| 45 to 49 Years | 4 (1.8%) | 9 (4.1%) |
| 50 to 54 Years | 2 (0.9%) | 12 (5.5%) |
| 55 to 59 Years | 17 (7.6%) | 18 (8.2%) |
| 60 to 64 Years | 18 (8.0%) | 7 (3.2%) |
| 65 to 69 Years | 10 (4.4%) | 11 (5.0%) |
| 70 to 74 Years | 2 (0.9%) | 6 (2.7%) |
| 75 to 79 Years | 4 (1.8%) | 4 (1.8%) |
| 80 to 84 Years | 4 (1.8%) | 6 (2.7%) |
| 85 Years and over | 2 (0.9%) | 3 (1.4%) |
| Total | 225 (100.0%) | 219 (100.0%) |
Families and Households in Galva
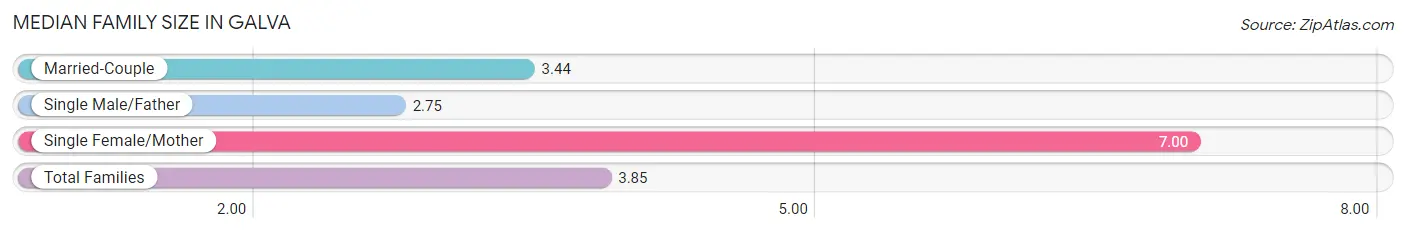
Median Family Size in Galva
The median family size in Galva is 3.85 persons per family, with single female/mother families (12 | 12.5%) accounting for the largest median family size of 7 persons per family. On the other hand, single male/father families (4 | 4.2%) represent the smallest median family size with 2.75 persons per family.
| Family Type | # Families | Family Size |
| Married-Couple | 80 (83.3%) | 3.44 |
| Single Male/Father | 4 (4.2%) | 2.75 |
| Single Female/Mother | 12 (12.5%) | 7.00 |
| Total Families | 96 (100.0%) | 3.85 |
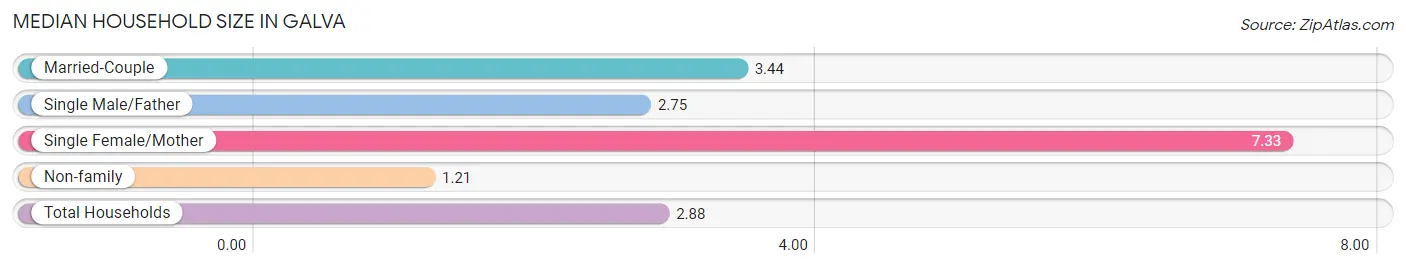
Median Household Size in Galva
The median household size in Galva is 2.88 persons per household, with single female/mother households (12 | 7.8%) accounting for the largest median household size of 7.33 persons per household. non-family households (58 | 37.7%) represent the smallest median household size with 1.21 persons per household.
| Household Type | # Households | Household Size |
| Married-Couple | 80 (51.9%) | 3.44 |
| Single Male/Father | 4 (2.6%) | 2.75 |
| Single Female/Mother | 12 (7.8%) | 7.33 |
| Non-family | 58 (37.7%) | 1.21 |
| Total Households | 154 (100.0%) | 2.88 |
Household Size by Marriage Status in Galva
Out of a total of 154 households in Galva, 96 (62.3%) are family households, while 58 (37.7%) are nonfamily households. The most numerous type of family households are 2-person households, comprising 46, and the most common type of nonfamily households are 1-person households, comprising 48.
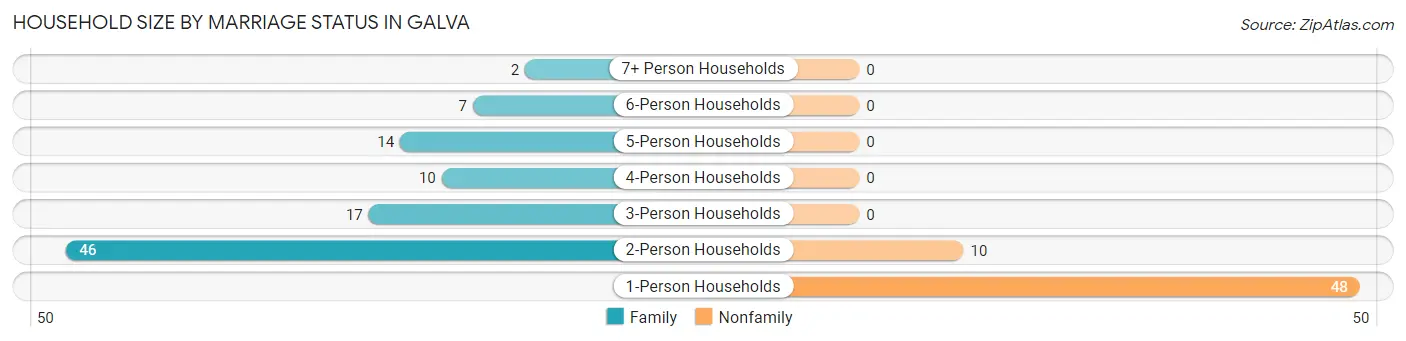
| Household Size | Family Households | Nonfamily Households |
| 1-Person Households | - | 48 (31.2%) |
| 2-Person Households | 46 (29.9%) | 10 (6.5%) |
| 3-Person Households | 17 (11.0%) | 0 (0.0%) |
| 4-Person Households | 10 (6.5%) | 0 (0.0%) |
| 5-Person Households | 14 (9.1%) | 0 (0.0%) |
| 6-Person Households | 7 (4.5%) | 0 (0.0%) |
| 7+ Person Households | 2 (1.3%) | 0 (0.0%) |
| Total | 96 (62.3%) | 58 (37.7%) |
Female Fertility in Galva
Fertility by Age in Galva
Average fertility rate in Galva is 104.0 births per 1,000 women. Women in the age bracket of 20 to 34 years have the highest fertility rate with 157.0 births per 1,000 women. Women in the age bracket of 20 to 34 years acount for 100.0% of all women with births.
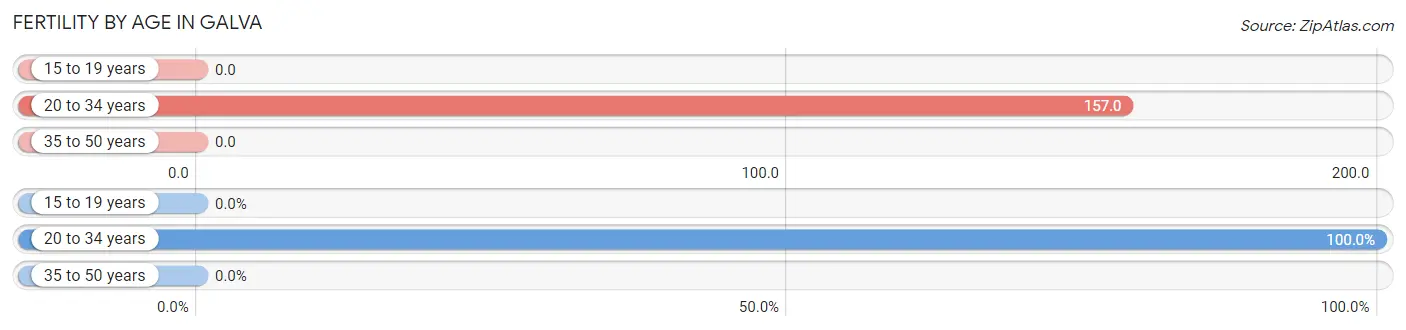
| Age Bracket | Women with Births | Births / 1,000 Women |
| 15 to 19 years | 0 (0.0%) | 0.0 |
| 20 to 34 years | 8 (100.0%) | 157.0 |
| 35 to 50 years | 0 (0.0%) | 0.0 |
| Total | 8 (100.0%) | 104.0 |
Fertility by Age by Marriage Status in Galva
75.0% of women with births (8) in Galva are married. The highest percentage of unmarried women with births falls into 20 to 34 years age bracket with 25.0% of them unmarried at the time of birth, while the lowest percentage of unmarried women with births belong to 20 to 34 years age bracket with 25.0% of them unmarried.
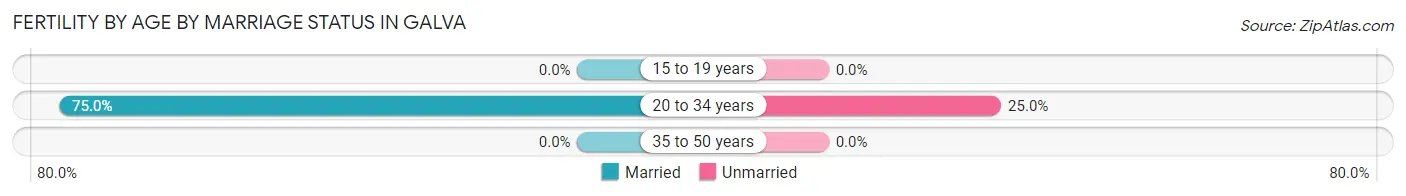
| Age Bracket | Married | Unmarried |
| 15 to 19 years | 0 (0.0%) | 0 (0.0%) |
| 20 to 34 years | 6 (75.0%) | 2 (25.0%) |
| 35 to 50 years | 0 (0.0%) | 0 (0.0%) |
| Total | 6 (75.0%) | 2 (25.0%) |
Fertility by Education in Galva
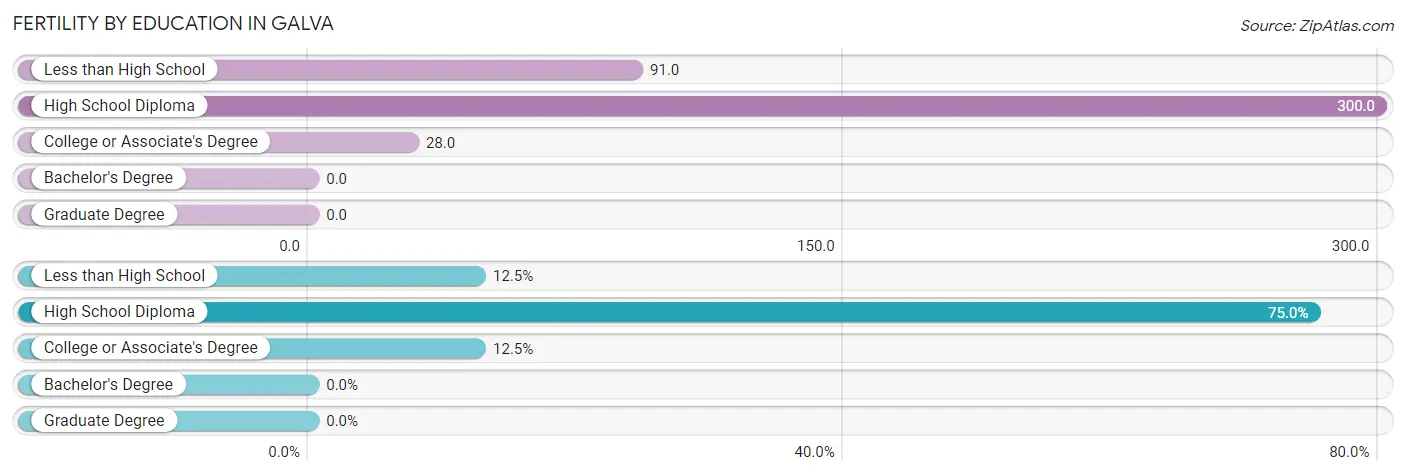
| Educational Attainment | Women with Births | Births / 1,000 Women |
| Less than High School | 1 (12.5%) | 91.0 |
| High School Diploma | 6 (75.0%) | 300.0 |
| College or Associate's Degree | 1 (12.5%) | 28.0 |
| Bachelor's Degree | 0 (0.0%) | 0.0 |
| Graduate Degree | 0 (0.0%) | 0.0 |
| Total | 8 (100.0%) | 104.0 |
Fertility by Education by Marriage Status in Galva
25.0% of women with births in Galva are unmarried. Women with the educational attainment of less than high school are most likely to be married with 100.0% of them married at childbirth, while women with the educational attainment of high school diploma are least likely to be married with 33.3% of them unmarried at childbirth.
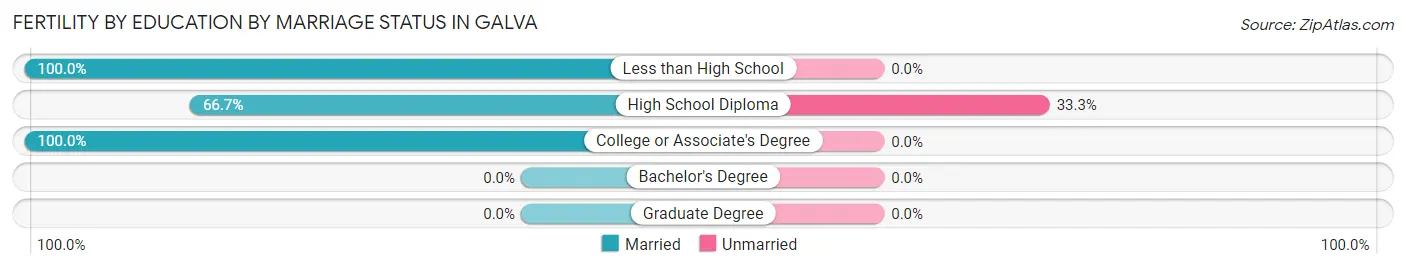
| Educational Attainment | Married | Unmarried |
| Less than High School | 1 (100.0%) | 0 (0.0%) |
| High School Diploma | 4 (66.7%) | 2 (33.3%) |
| College or Associate's Degree | 1 (100.0%) | 0 (0.0%) |
| Bachelor's Degree | 0 (0.0%) | 0 (0.0%) |
| Graduate Degree | 0 (0.0%) | 0 (0.0%) |
| Total | 6 (75.0%) | 2 (25.0%) |
Employment Characteristics in Galva
Employment by Class of Employer in Galva
Among the 207 employed individuals in Galva, private company employees (150 | 72.5%), self-employed (incorporated) (17 | 8.2%), and self-employed (not incorporated) (11 | 5.3%) make up the most common classes of employment.
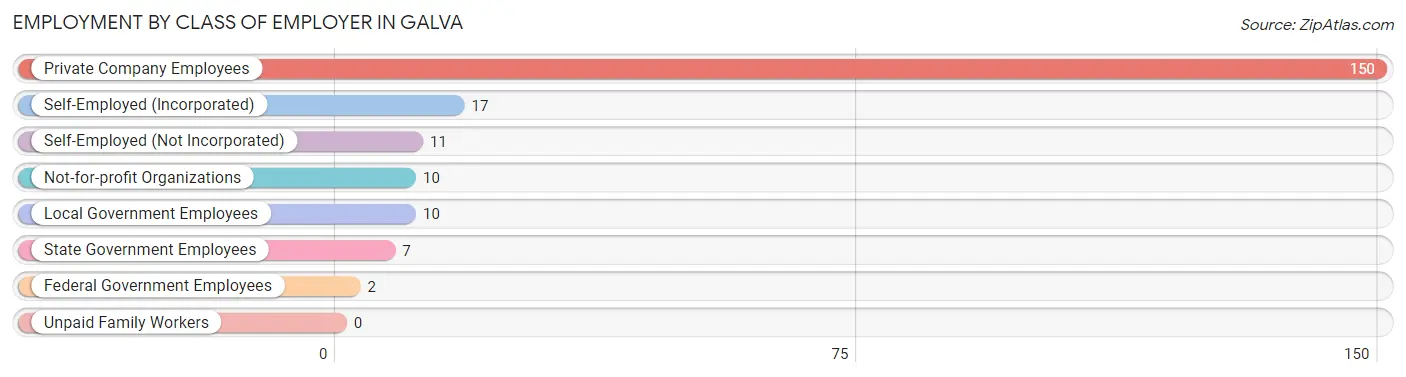
| Employer Class | # Employees | % Employees |
| Private Company Employees | 150 | 72.5% |
| Self-Employed (Incorporated) | 17 | 8.2% |
| Self-Employed (Not Incorporated) | 11 | 5.3% |
| Not-for-profit Organizations | 10 | 4.8% |
| Local Government Employees | 10 | 4.8% |
| State Government Employees | 7 | 3.4% |
| Federal Government Employees | 2 | 1.0% |
| Unpaid Family Workers | 0 | 0.0% |
| Total | 207 | 100.0% |
Employment Status by Age in Galva
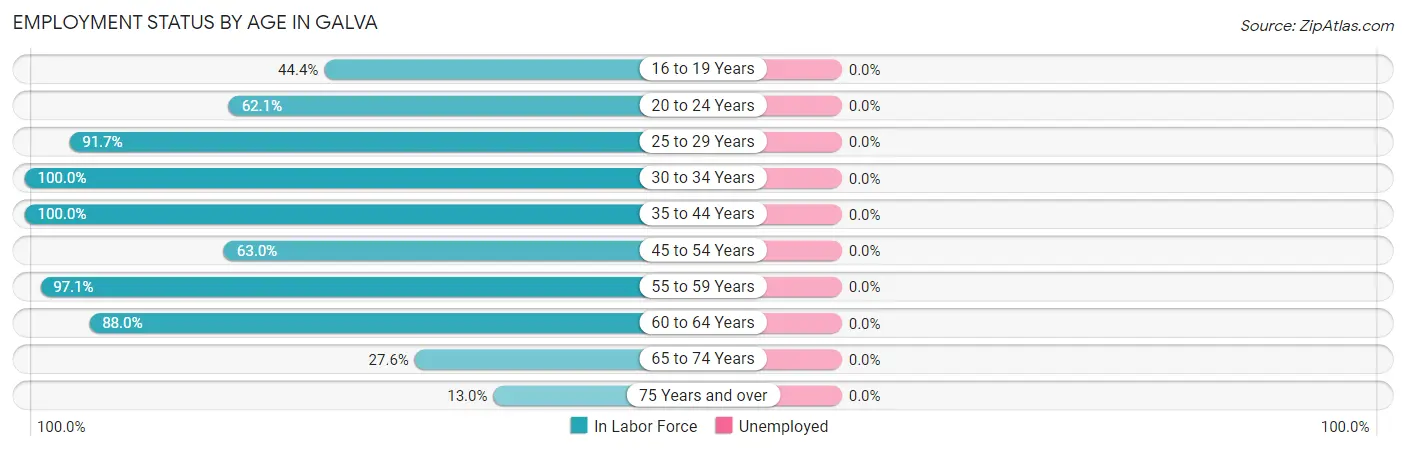
| Age Bracket | In Labor Force | Unemployed |
| 16 to 19 Years | 8 (44.4%) | 0 (0.0%) |
| 20 to 24 Years | 18 (62.1%) | 0 (0.0%) |
| 25 to 29 Years | 22 (91.7%) | 0 (0.0%) |
| 30 to 34 Years | 39 (100.0%) | 0 (0.0%) |
| 35 to 44 Years | 40 (100.0%) | 0 (0.0%) |
| 45 to 54 Years | 17 (63.0%) | 0 (0.0%) |
| 55 to 59 Years | 34 (97.1%) | 0 (0.0%) |
| 60 to 64 Years | 22 (88.0%) | 0 (0.0%) |
| 65 to 74 Years | 8 (27.6%) | 0 (0.0%) |
| 75 Years and over | 3 (13.0%) | 0 (0.0%) |
| Total | 211 (73.0%) | 0 (0.0%) |
Employment Status by Educational Attainment in Galva
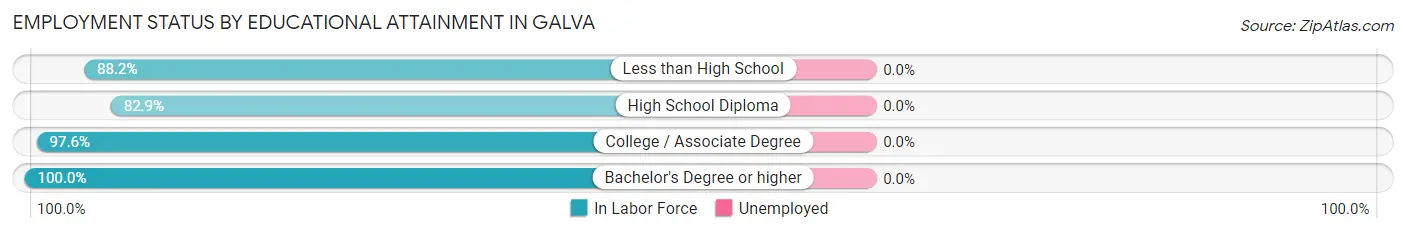
| Educational Attainment | In Labor Force | Unemployed |
| Less than High School | 15 (88.2%) | 0 (0.0%) |
| High School Diploma | 58 (82.9%) | 0 (0.0%) |
| College / Associate Degree | 80 (97.6%) | 0 (0.0%) |
| Bachelor's Degree or higher | 21 (100.0%) | 0 (0.0%) |
| Total | 174 (91.6%) | 0 (0.0%) |
Employment Occupations by Sex in Galva
Management, Business, Science and Arts Occupations
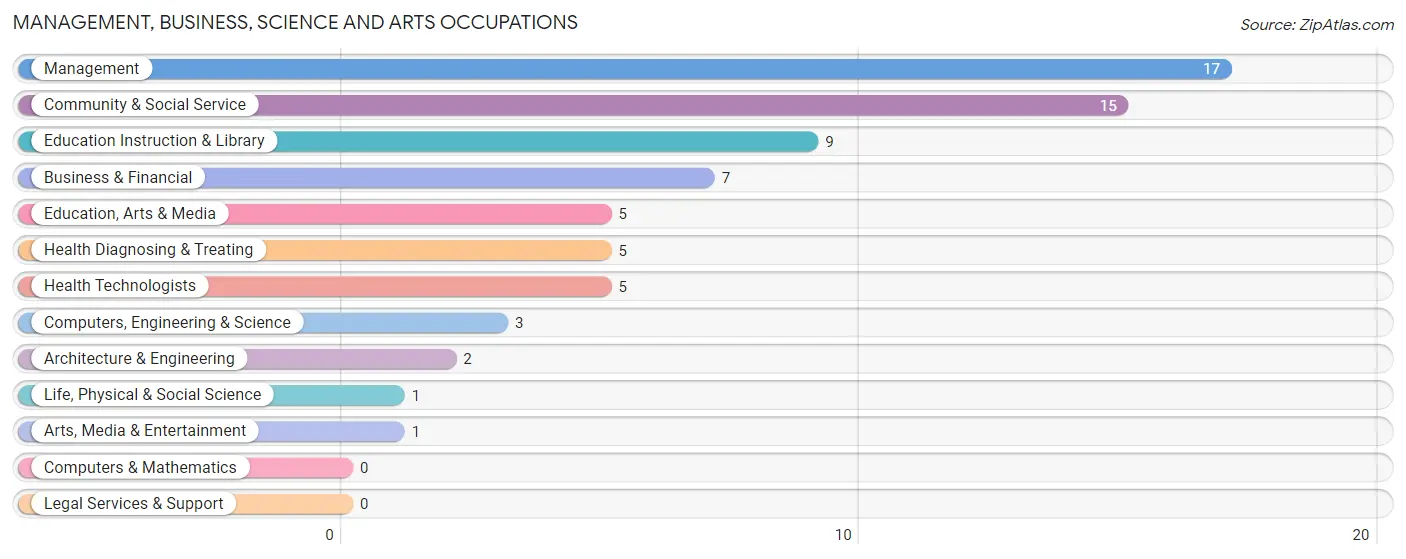
The most common Management, Business, Science and Arts occupations in Galva are Management (17 | 8.1%), Community & Social Service (15 | 7.1%), Education Instruction & Library (9 | 4.3%), Business & Financial (7 | 3.3%), and Education, Arts & Media (5 | 2.4%).
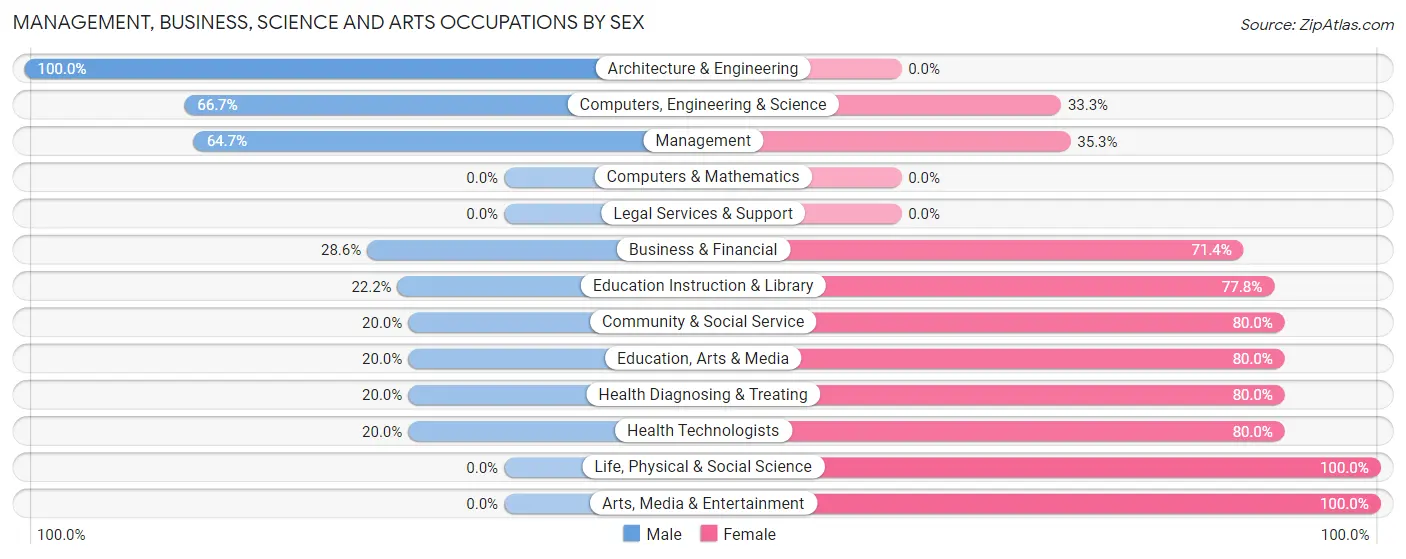
Management, Business, Science and Arts Occupations by Sex
Within the Management, Business, Science and Arts occupations in Galva, the most male-oriented occupations are Architecture & Engineering (100.0%), Computers, Engineering & Science (66.7%), and Management (64.7%), while the most female-oriented occupations are Life, Physical & Social Science (100.0%), Arts, Media & Entertainment (100.0%), and Community & Social Service (80.0%).
| Occupation | Male | Female |
| Management | 11 (64.7%) | 6 (35.3%) |
| Business & Financial | 2 (28.6%) | 5 (71.4%) |
| Computers, Engineering & Science | 2 (66.7%) | 1 (33.3%) |
| Computers & Mathematics | 0 (0.0%) | 0 (0.0%) |
| Architecture & Engineering | 2 (100.0%) | 0 (0.0%) |
| Life, Physical & Social Science | 0 (0.0%) | 1 (100.0%) |
| Community & Social Service | 3 (20.0%) | 12 (80.0%) |
| Education, Arts & Media | 1 (20.0%) | 4 (80.0%) |
| Legal Services & Support | 0 (0.0%) | 0 (0.0%) |
| Education Instruction & Library | 2 (22.2%) | 7 (77.8%) |
| Arts, Media & Entertainment | 0 (0.0%) | 1 (100.0%) |
| Health Diagnosing & Treating | 1 (20.0%) | 4 (80.0%) |
| Health Technologists | 1 (20.0%) | 4 (80.0%) |
| Total (Category) | 19 (40.4%) | 28 (59.6%) |
| Total (Overall) | 127 (60.2%) | 84 (39.8%) |
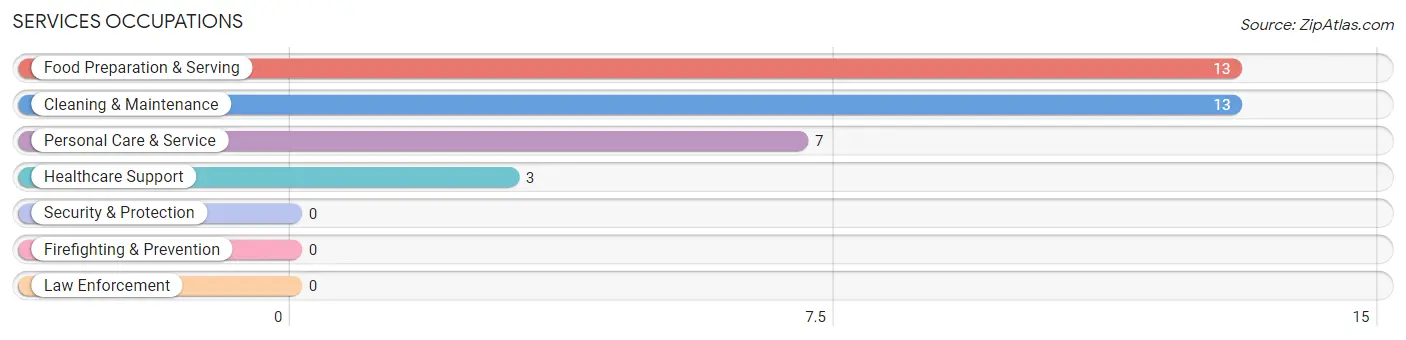
Services Occupations
The most common Services occupations in Galva are Food Preparation & Serving (13 | 6.2%), Cleaning & Maintenance (13 | 6.2%), Personal Care & Service (7 | 3.3%), and Healthcare Support (3 | 1.4%).
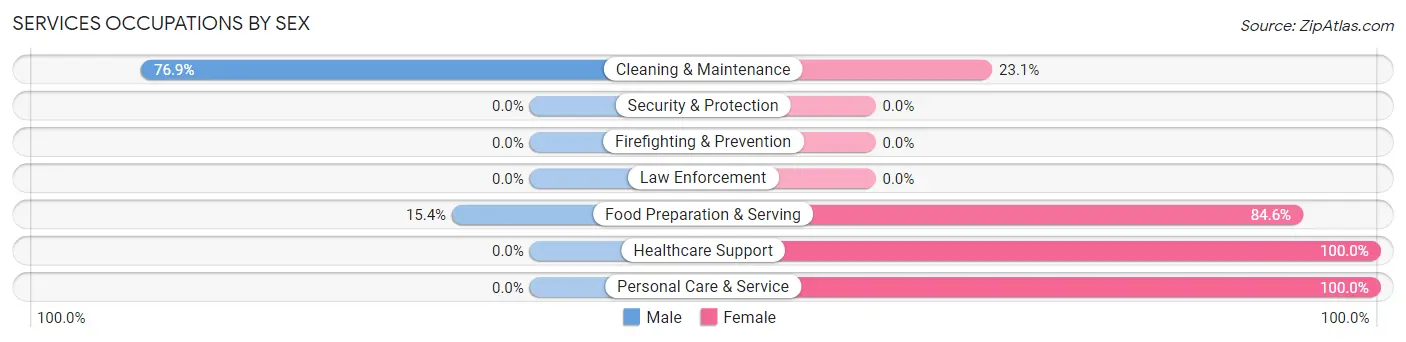
Services Occupations by Sex
Within the Services occupations in Galva, the most male-oriented occupations are Cleaning & Maintenance (76.9%), and Food Preparation & Serving (15.4%), while the most female-oriented occupations are Healthcare Support (100.0%), Personal Care & Service (100.0%), and Food Preparation & Serving (84.6%).
| Occupation | Male | Female |
| Healthcare Support | 0 (0.0%) | 3 (100.0%) |
| Security & Protection | 0 (0.0%) | 0 (0.0%) |
| Firefighting & Prevention | 0 (0.0%) | 0 (0.0%) |
| Law Enforcement | 0 (0.0%) | 0 (0.0%) |
| Food Preparation & Serving | 2 (15.4%) | 11 (84.6%) |
| Cleaning & Maintenance | 10 (76.9%) | 3 (23.1%) |
| Personal Care & Service | 0 (0.0%) | 7 (100.0%) |
| Total (Category) | 12 (33.3%) | 24 (66.7%) |
| Total (Overall) | 127 (60.2%) | 84 (39.8%) |
Sales and Office Occupations
The most common Sales and Office occupations in Galva are Office & Administration (25 | 11.8%), and Sales & Related (9 | 4.3%).
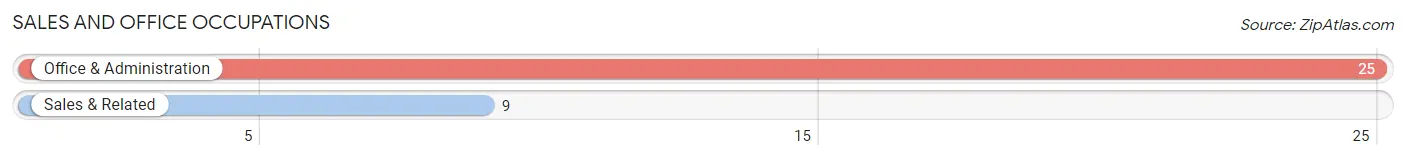
Sales and Office Occupations by Sex
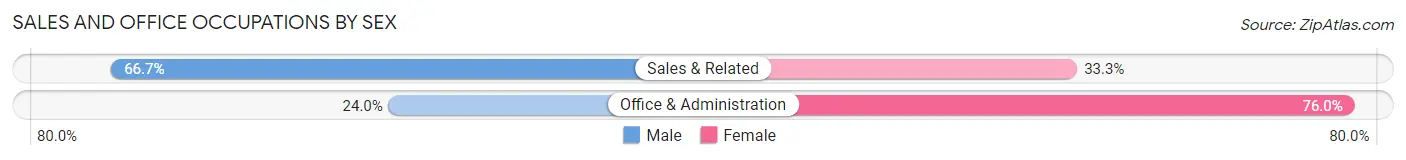
| Occupation | Male | Female |
| Sales & Related | 6 (66.7%) | 3 (33.3%) |
| Office & Administration | 6 (24.0%) | 19 (76.0%) |
| Total (Category) | 12 (35.3%) | 22 (64.7%) |
| Total (Overall) | 127 (60.2%) | 84 (39.8%) |
Natural Resources, Construction and Maintenance Occupations
The most common Natural Resources, Construction and Maintenance occupations in Galva are Installation, Maintenance & Repair (14 | 6.6%), Construction & Extraction (8 | 3.8%), and Farming, Fishing & Forestry (3 | 1.4%).
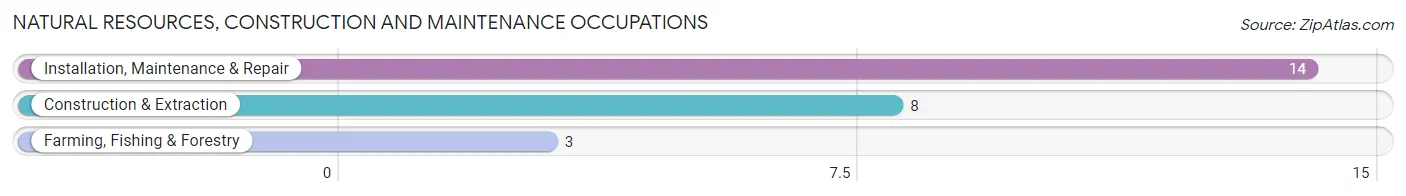
Natural Resources, Construction and Maintenance Occupations by Sex
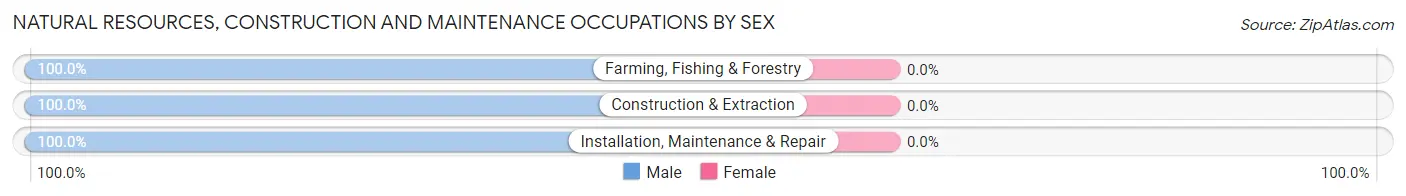
| Occupation | Male | Female |
| Farming, Fishing & Forestry | 3 (100.0%) | 0 (0.0%) |
| Construction & Extraction | 8 (100.0%) | 0 (0.0%) |
| Installation, Maintenance & Repair | 14 (100.0%) | 0 (0.0%) |
| Total (Category) | 25 (100.0%) | 0 (0.0%) |
| Total (Overall) | 127 (60.2%) | 84 (39.8%) |
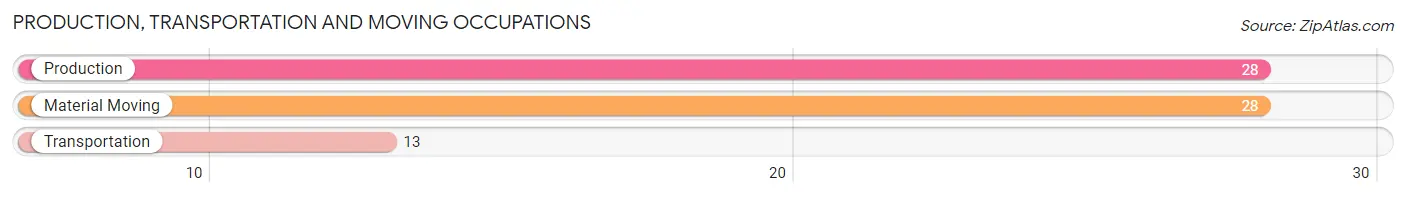
Production, Transportation and Moving Occupations
The most common Production, Transportation and Moving occupations in Galva are Production (28 | 13.3%), Material Moving (28 | 13.3%), and Transportation (13 | 6.2%).
Production, Transportation and Moving Occupations by Sex
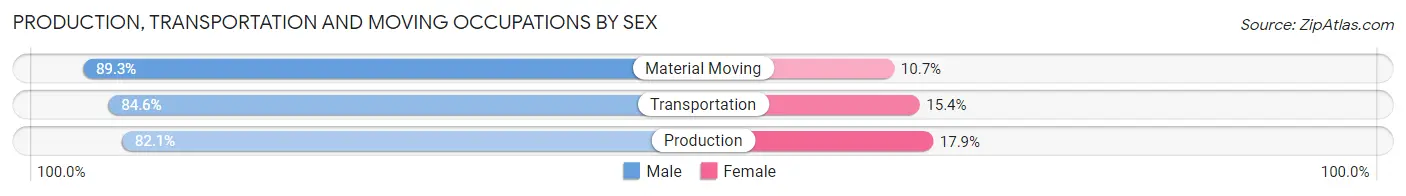
| Occupation | Male | Female |
| Production | 23 (82.1%) | 5 (17.9%) |
| Transportation | 11 (84.6%) | 2 (15.4%) |
| Material Moving | 25 (89.3%) | 3 (10.7%) |
| Total (Category) | 59 (85.5%) | 10 (14.5%) |
| Total (Overall) | 127 (60.2%) | 84 (39.8%) |
Employment Industries by Sex in Galva
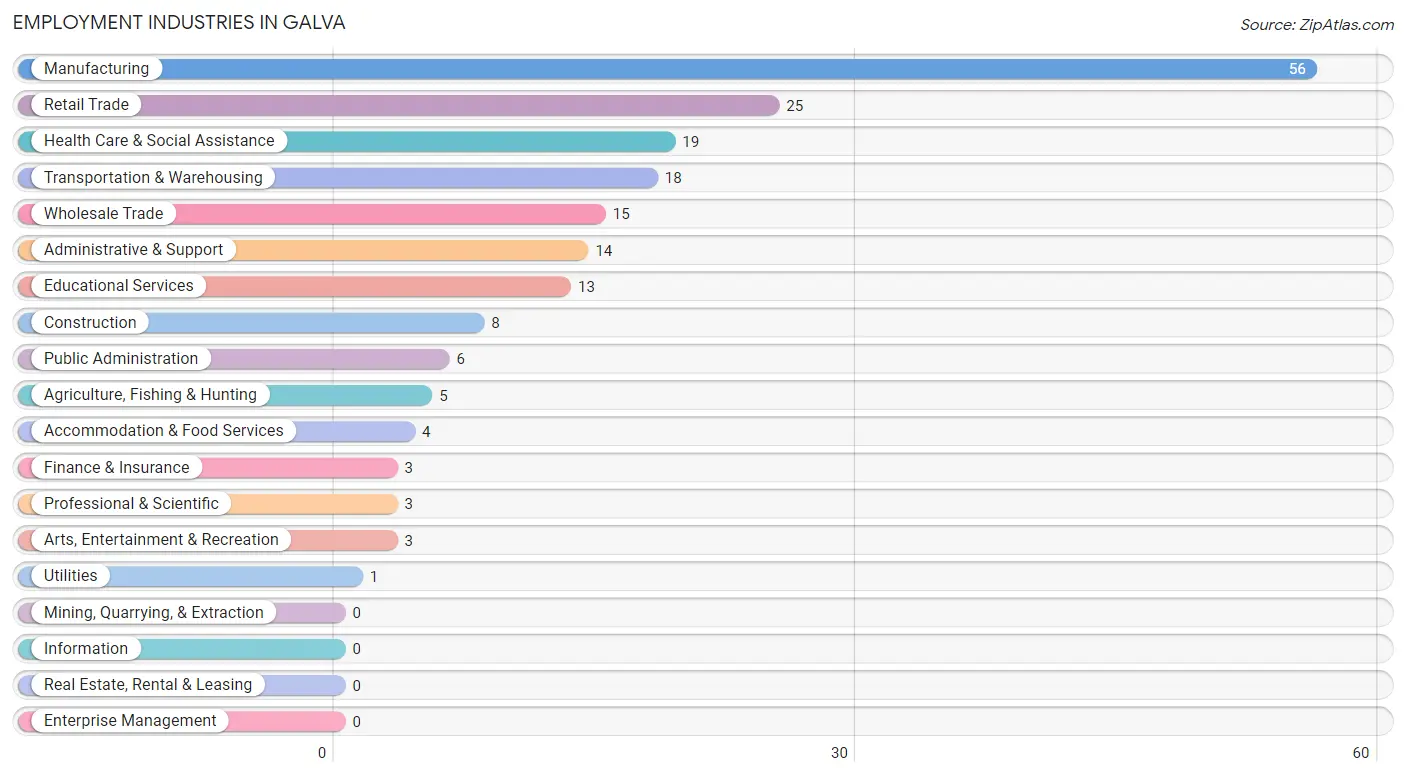
Employment Industries in Galva
The major employment industries in Galva include Manufacturing (56 | 26.5%), Retail Trade (25 | 11.8%), Health Care & Social Assistance (19 | 9.0%), Transportation & Warehousing (18 | 8.5%), and Wholesale Trade (15 | 7.1%).
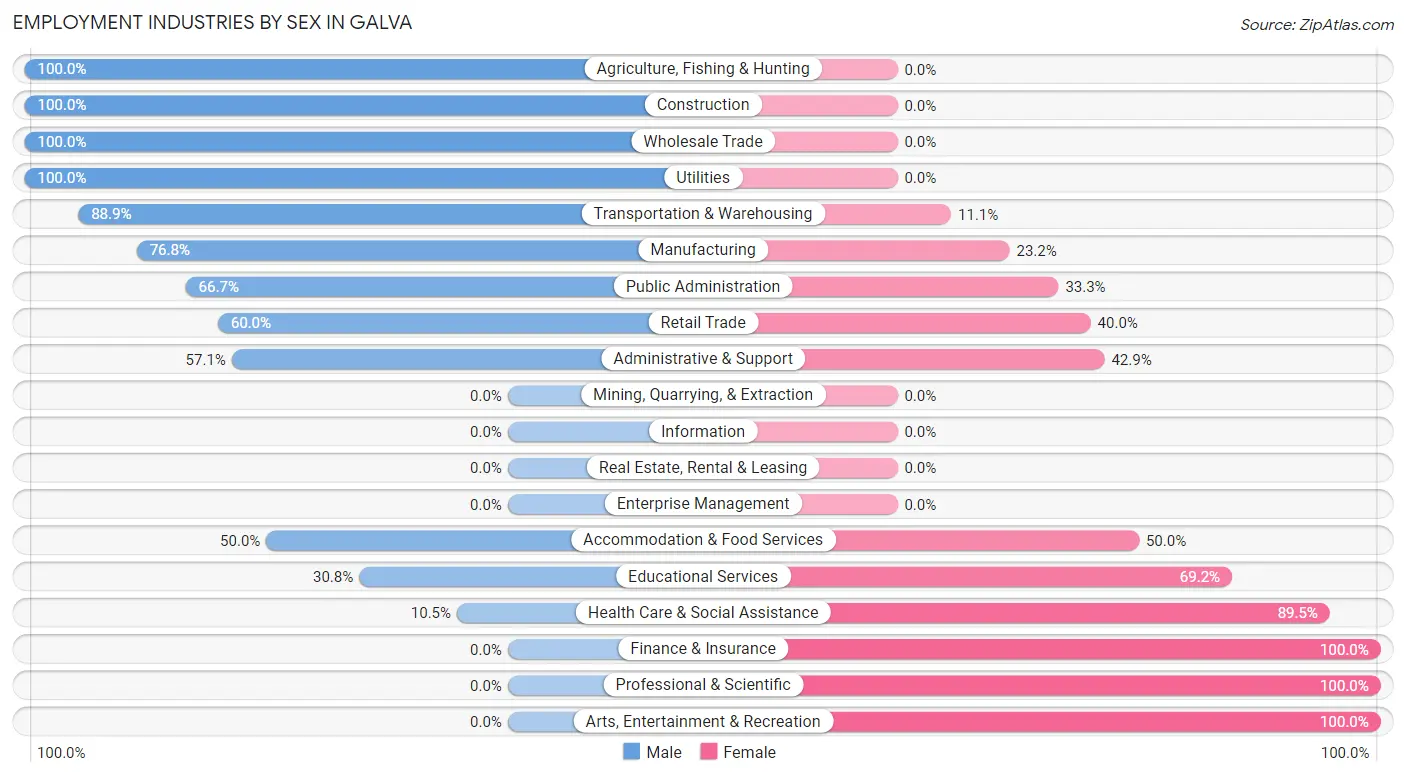
Employment Industries by Sex in Galva
The Galva industries that see more men than women are Agriculture, Fishing & Hunting (100.0%), Construction (100.0%), and Wholesale Trade (100.0%), whereas the industries that tend to have a higher number of women are Finance & Insurance (100.0%), Professional & Scientific (100.0%), and Arts, Entertainment & Recreation (100.0%).
| Industry | Male | Female |
| Agriculture, Fishing & Hunting | 5 (100.0%) | 0 (0.0%) |
| Mining, Quarrying, & Extraction | 0 (0.0%) | 0 (0.0%) |
| Construction | 8 (100.0%) | 0 (0.0%) |
| Manufacturing | 43 (76.8%) | 13 (23.2%) |
| Wholesale Trade | 15 (100.0%) | 0 (0.0%) |
| Retail Trade | 15 (60.0%) | 10 (40.0%) |
| Transportation & Warehousing | 16 (88.9%) | 2 (11.1%) |
| Utilities | 1 (100.0%) | 0 (0.0%) |
| Information | 0 (0.0%) | 0 (0.0%) |
| Finance & Insurance | 0 (0.0%) | 3 (100.0%) |
| Real Estate, Rental & Leasing | 0 (0.0%) | 0 (0.0%) |
| Professional & Scientific | 0 (0.0%) | 3 (100.0%) |
| Enterprise Management | 0 (0.0%) | 0 (0.0%) |
| Administrative & Support | 8 (57.1%) | 6 (42.9%) |
| Educational Services | 4 (30.8%) | 9 (69.2%) |
| Health Care & Social Assistance | 2 (10.5%) | 17 (89.5%) |
| Arts, Entertainment & Recreation | 0 (0.0%) | 3 (100.0%) |
| Accommodation & Food Services | 2 (50.0%) | 2 (50.0%) |
| Public Administration | 4 (66.7%) | 2 (33.3%) |
| Total | 127 (60.2%) | 84 (39.8%) |
Education in Galva
School Enrollment in Galva
The most common levels of schooling among the 103 students in Galva are elementary school (28 | 27.2%), middle school (27 | 26.2%), and nursery / preschool (19 | 18.4%).
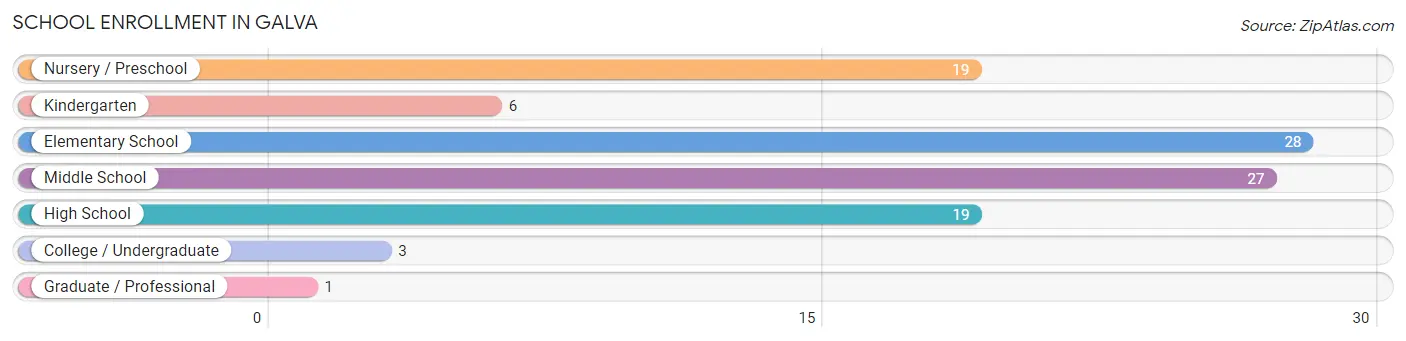
| School Level | # Students | % Students |
| Nursery / Preschool | 19 | 18.4% |
| Kindergarten | 6 | 5.8% |
| Elementary School | 28 | 27.2% |
| Middle School | 27 | 26.2% |
| High School | 19 | 18.4% |
| College / Undergraduate | 3 | 2.9% |
| Graduate / Professional | 1 | 1.0% |
| Total | 103 | 100.0% |
School Enrollment by Age by Funding Source in Galva
Out of a total of 103 students who are enrolled in schools in Galva, 1 (1.0%) attend a private institution, while the remaining 102 (99.0%) are enrolled in public schools. The age group of 35 years and over has the highest likelihood of being enrolled in private schools, with 1 (50.0% in the age bracket) enrolled. Conversely, the age group of 3 to 4 year olds has the lowest likelihood of being enrolled in a private school, with 10 (100.0% in the age bracket) attending a public institution.
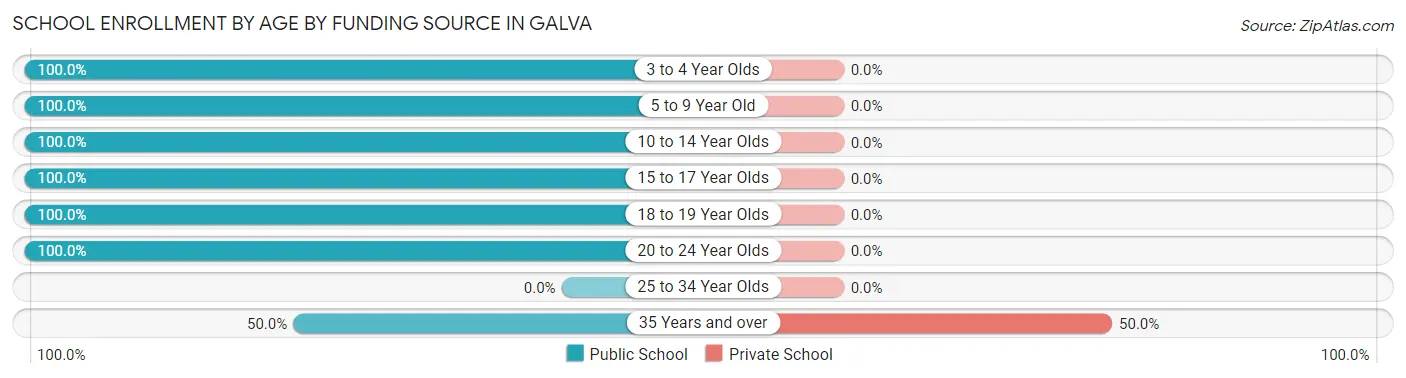
| Age Bracket | Public School | Private School |
| 3 to 4 Year Olds | 10 (100.0%) | 0 (0.0%) |
| 5 to 9 Year Old | 43 (100.0%) | 0 (0.0%) |
| 10 to 14 Year Olds | 32 (100.0%) | 0 (0.0%) |
| 15 to 17 Year Olds | 8 (100.0%) | 0 (0.0%) |
| 18 to 19 Year Olds | 6 (100.0%) | 0 (0.0%) |
| 20 to 24 Year Olds | 2 (100.0%) | 0 (0.0%) |
| 25 to 34 Year Olds | 0 (0.0%) | 0 (0.0%) |
| 35 Years and over | 1 (50.0%) | 1 (50.0%) |
| Total | 102 (99.0%) | 1 (1.0%) |
Educational Attainment by Field of Study in Galva
Education (13 | 43.3%), arts & humanities (6 | 20.0%), science & technology (4 | 13.3%), business (4 | 13.3%), and physical & health sciences (2 | 6.7%) are the most common fields of study among 30 individuals in Galva who have obtained a bachelor's degree or higher.
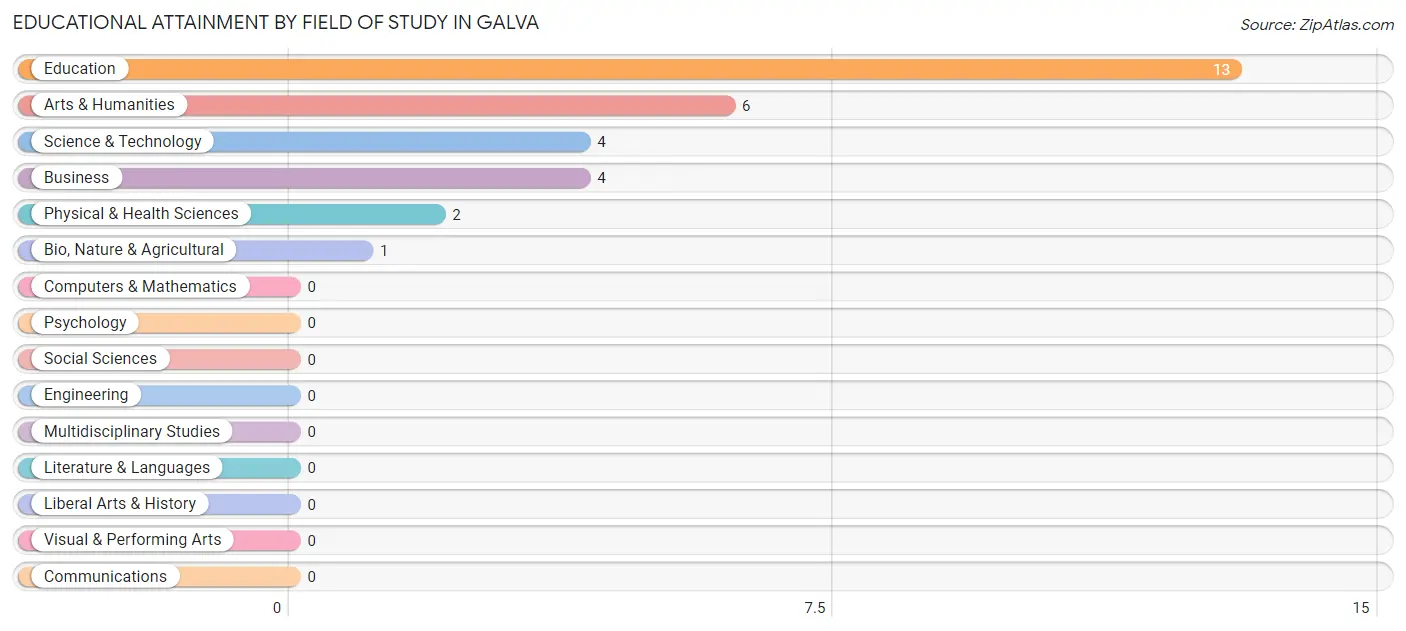
| Field of Study | # Graduates | % Graduates |
| Computers & Mathematics | 0 | 0.0% |
| Bio, Nature & Agricultural | 1 | 3.3% |
| Physical & Health Sciences | 2 | 6.7% |
| Psychology | 0 | 0.0% |
| Social Sciences | 0 | 0.0% |
| Engineering | 0 | 0.0% |
| Multidisciplinary Studies | 0 | 0.0% |
| Science & Technology | 4 | 13.3% |
| Business | 4 | 13.3% |
| Education | 13 | 43.3% |
| Literature & Languages | 0 | 0.0% |
| Liberal Arts & History | 0 | 0.0% |
| Visual & Performing Arts | 0 | 0.0% |
| Communications | 0 | 0.0% |
| Arts & Humanities | 6 | 20.0% |
| Total | 30 | 100.0% |
Transportation & Commute in Galva
Vehicle Availability by Sex in Galva
The most prevalent vehicle ownership categories in Galva are males with 2 vehicles (57, accounting for 46.3%) and females with 2 vehicles (37, making up 67.9%).
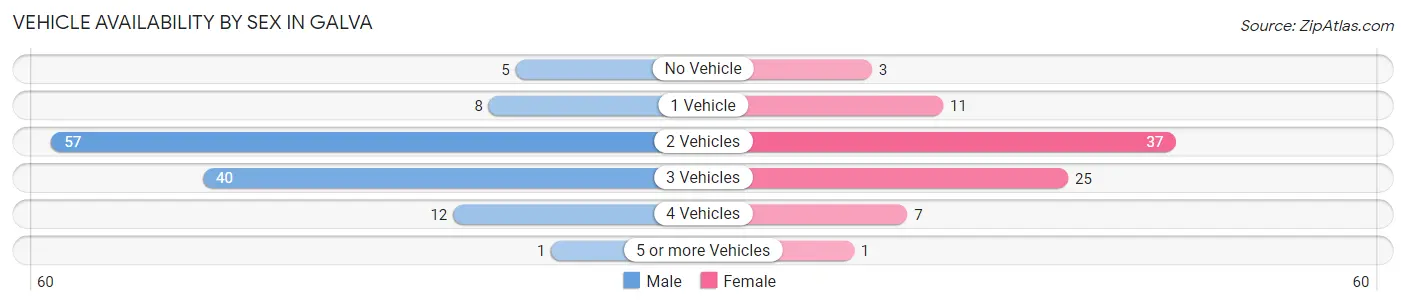
| Vehicles Available | Male | Female |
| No Vehicle | 5 (4.1%) | 3 (3.6%) |
| 1 Vehicle | 8 (6.5%) | 11 (13.1%) |
| 2 Vehicles | 57 (46.3%) | 37 (44.1%) |
| 3 Vehicles | 40 (32.5%) | 25 (29.8%) |
| 4 Vehicles | 12 (9.8%) | 7 (8.3%) |
| 5 or more Vehicles | 1 (0.8%) | 1 (1.2%) |
| Total | 123 (100.0%) | 84 (100.0%) |
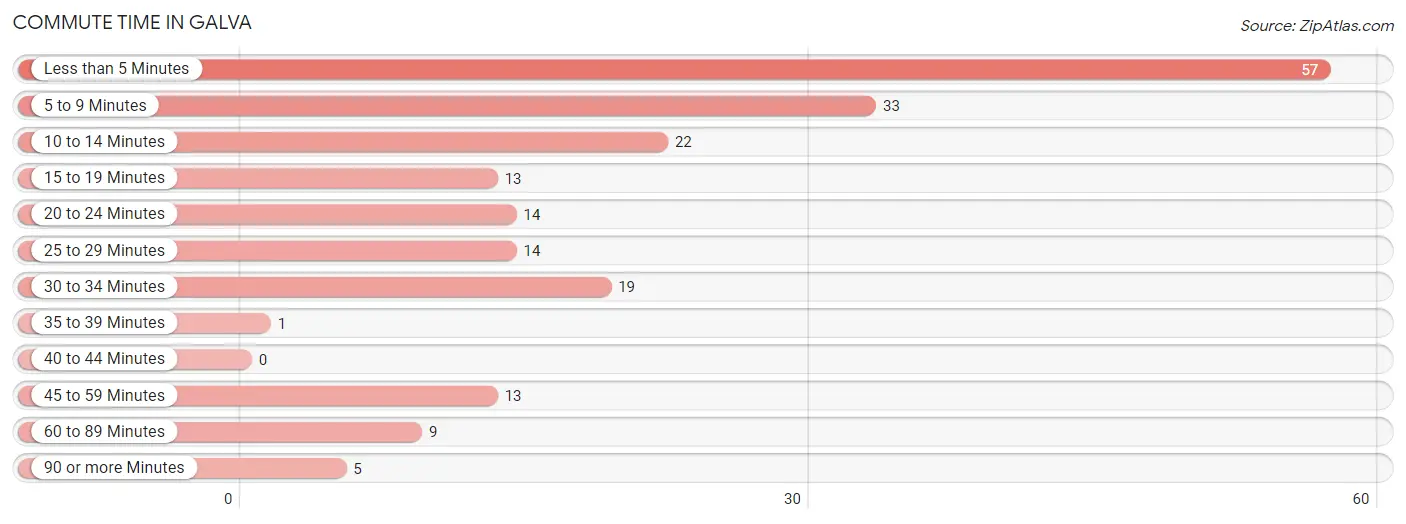
Commute Time in Galva
The most frequently occuring commute durations in Galva are less than 5 minutes (57 commuters, 28.5%), 5 to 9 minutes (33 commuters, 16.5%), and 10 to 14 minutes (22 commuters, 11.0%).
| Commute Time | # Commuters | % Commuters |
| Less than 5 Minutes | 57 | 28.5% |
| 5 to 9 Minutes | 33 | 16.5% |
| 10 to 14 Minutes | 22 | 11.0% |
| 15 to 19 Minutes | 13 | 6.5% |
| 20 to 24 Minutes | 14 | 7.0% |
| 25 to 29 Minutes | 14 | 7.0% |
| 30 to 34 Minutes | 19 | 9.5% |
| 35 to 39 Minutes | 1 | 0.5% |
| 40 to 44 Minutes | 0 | 0.0% |
| 45 to 59 Minutes | 13 | 6.5% |
| 60 to 89 Minutes | 9 | 4.5% |
| 90 or more Minutes | 5 | 2.5% |
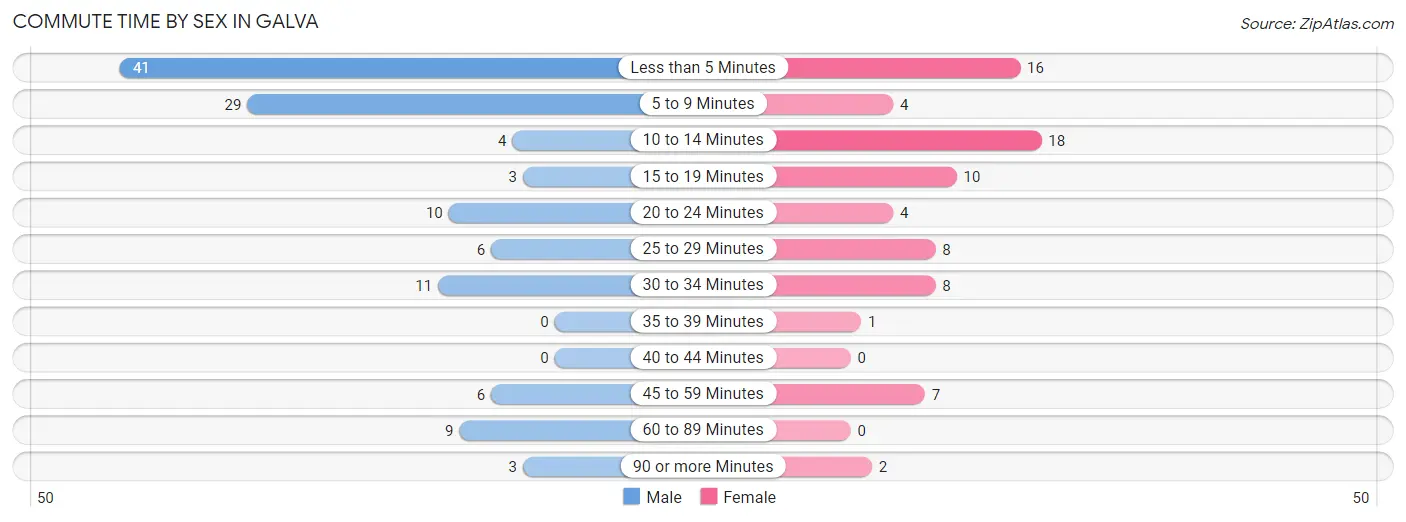
Commute Time by Sex in Galva
The most common commute times in Galva are less than 5 minutes (41 commuters, 33.6%) for males and 10 to 14 minutes (18 commuters, 23.1%) for females.
| Commute Time | Male | Female |
| Less than 5 Minutes | 41 (33.6%) | 16 (20.5%) |
| 5 to 9 Minutes | 29 (23.8%) | 4 (5.1%) |
| 10 to 14 Minutes | 4 (3.3%) | 18 (23.1%) |
| 15 to 19 Minutes | 3 (2.5%) | 10 (12.8%) |
| 20 to 24 Minutes | 10 (8.2%) | 4 (5.1%) |
| 25 to 29 Minutes | 6 (4.9%) | 8 (10.3%) |
| 30 to 34 Minutes | 11 (9.0%) | 8 (10.3%) |
| 35 to 39 Minutes | 0 (0.0%) | 1 (1.3%) |
| 40 to 44 Minutes | 0 (0.0%) | 0 (0.0%) |
| 45 to 59 Minutes | 6 (4.9%) | 7 (9.0%) |
| 60 to 89 Minutes | 9 (7.4%) | 0 (0.0%) |
| 90 or more Minutes | 3 (2.5%) | 2 (2.6%) |
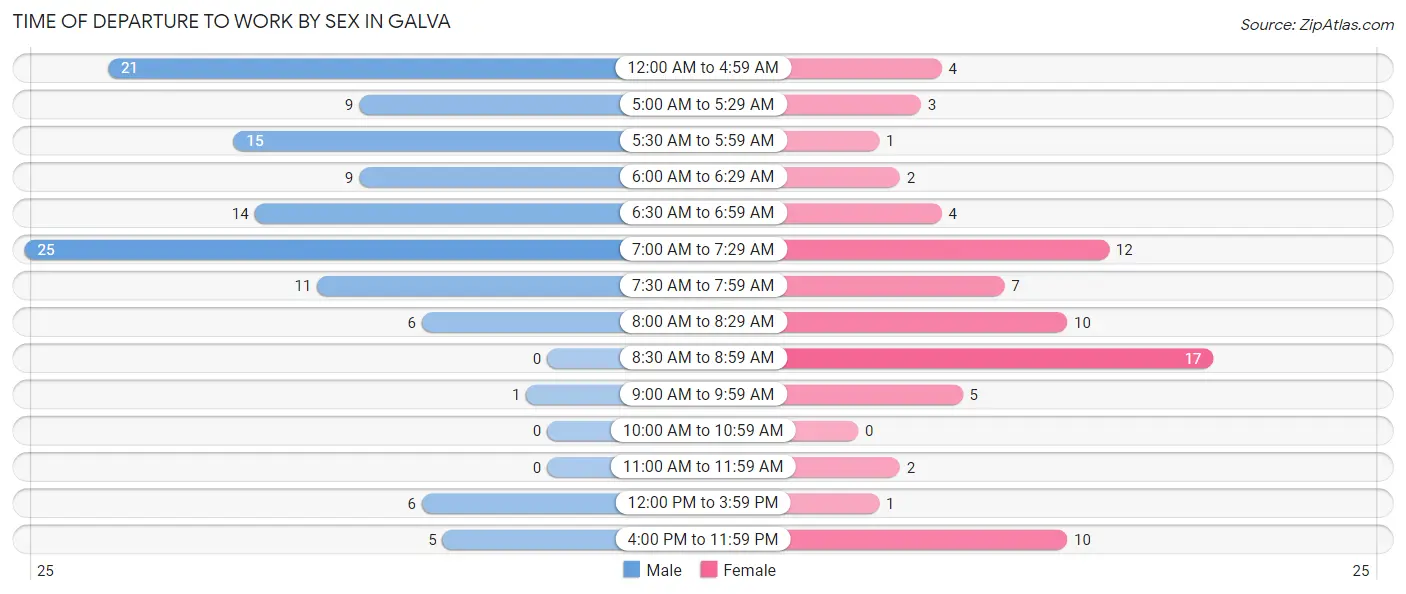
Time of Departure to Work by Sex in Galva
The most frequent times of departure to work in Galva are 7:00 AM to 7:29 AM (25, 20.5%) for males and 8:30 AM to 8:59 AM (17, 21.8%) for females.
| Time of Departure | Male | Female |
| 12:00 AM to 4:59 AM | 21 (17.2%) | 4 (5.1%) |
| 5:00 AM to 5:29 AM | 9 (7.4%) | 3 (3.8%) |
| 5:30 AM to 5:59 AM | 15 (12.3%) | 1 (1.3%) |
| 6:00 AM to 6:29 AM | 9 (7.4%) | 2 (2.6%) |
| 6:30 AM to 6:59 AM | 14 (11.5%) | 4 (5.1%) |
| 7:00 AM to 7:29 AM | 25 (20.5%) | 12 (15.4%) |
| 7:30 AM to 7:59 AM | 11 (9.0%) | 7 (9.0%) |
| 8:00 AM to 8:29 AM | 6 (4.9%) | 10 (12.8%) |
| 8:30 AM to 8:59 AM | 0 (0.0%) | 17 (21.8%) |
| 9:00 AM to 9:59 AM | 1 (0.8%) | 5 (6.4%) |
| 10:00 AM to 10:59 AM | 0 (0.0%) | 0 (0.0%) |
| 11:00 AM to 11:59 AM | 0 (0.0%) | 2 (2.6%) |
| 12:00 PM to 3:59 PM | 6 (4.9%) | 1 (1.3%) |
| 4:00 PM to 11:59 PM | 5 (4.1%) | 10 (12.8%) |
| Total | 122 (100.0%) | 78 (100.0%) |
Housing Occupancy in Galva
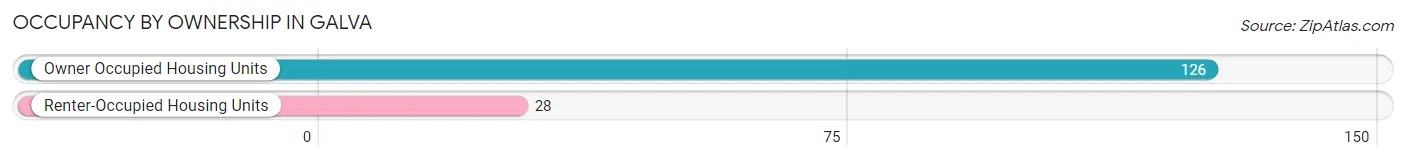
Occupancy by Ownership in Galva
Of the total 154 dwellings in Galva, owner-occupied units account for 126 (81.8%), while renter-occupied units make up 28 (18.2%).
| Occupancy | # Housing Units | % Housing Units |
| Owner Occupied Housing Units | 126 | 81.8% |
| Renter-Occupied Housing Units | 28 | 18.2% |
| Total Occupied Housing Units | 154 | 100.0% |
Occupancy by Household Size in Galva
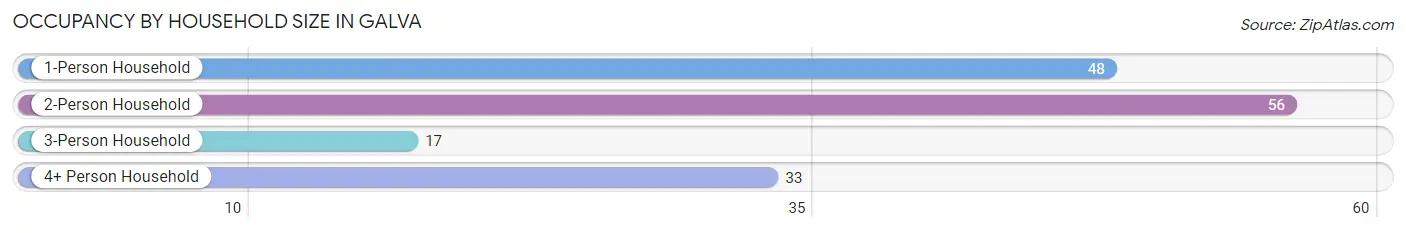
| Household Size | # Housing Units | % Housing Units |
| 1-Person Household | 48 | 31.2% |
| 2-Person Household | 56 | 36.4% |
| 3-Person Household | 17 | 11.0% |
| 4+ Person Household | 33 | 21.4% |
| Total Housing Units | 154 | 100.0% |
Occupancy by Ownership by Household Size in Galva
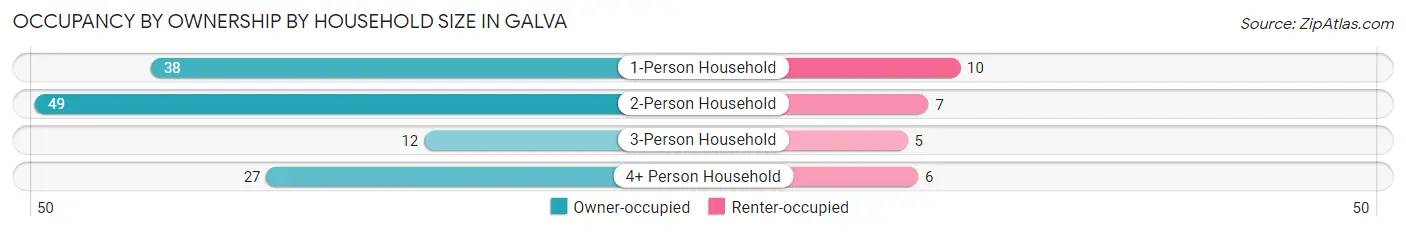
| Household Size | Owner-occupied | Renter-occupied |
| 1-Person Household | 38 (79.2%) | 10 (20.8%) |
| 2-Person Household | 49 (87.5%) | 7 (12.5%) |
| 3-Person Household | 12 (70.6%) | 5 (29.4%) |
| 4+ Person Household | 27 (81.8%) | 6 (18.2%) |
| Total Housing Units | 126 (81.8%) | 28 (18.2%) |
Occupancy by Educational Attainment in Galva
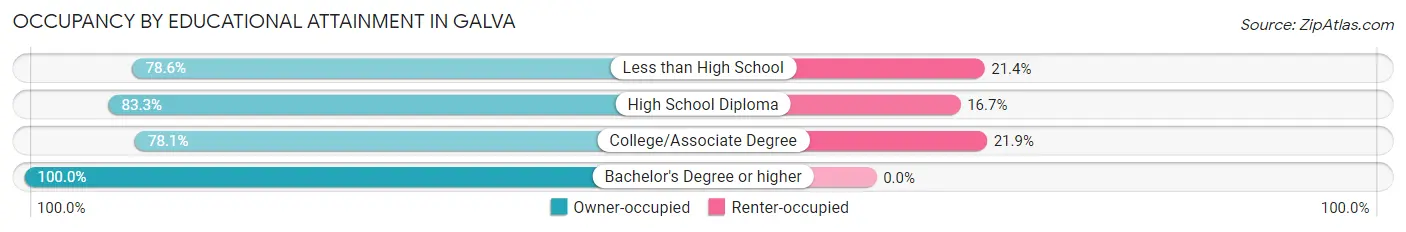
| Household Size | Owner-occupied | Renter-occupied |
| Less than High School | 11 (78.6%) | 3 (21.4%) |
| High School Diploma | 45 (83.3%) | 9 (16.7%) |
| College/Associate Degree | 57 (78.1%) | 16 (21.9%) |
| Bachelor's Degree or higher | 13 (100.0%) | 0 (0.0%) |
Occupancy by Age of Householder in Galva
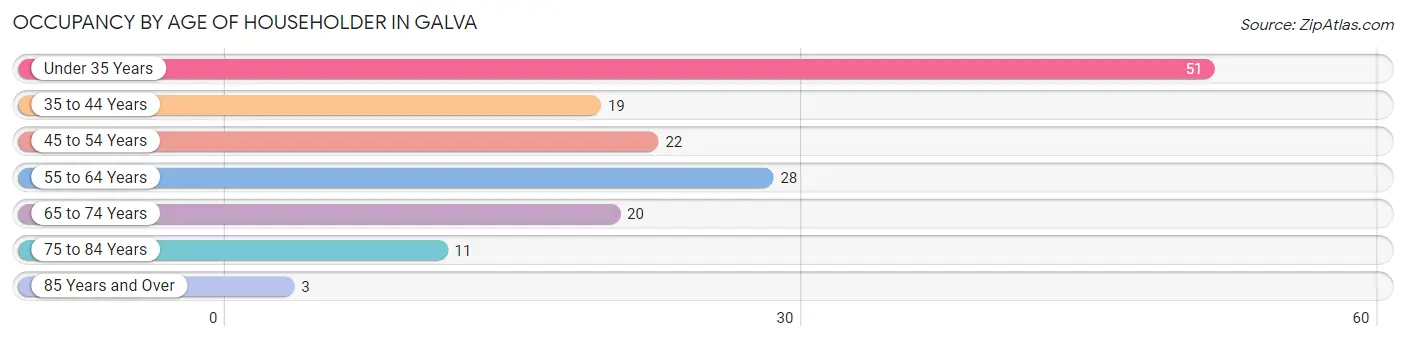
| Age Bracket | # Households | % Households |
| Under 35 Years | 51 | 33.1% |
| 35 to 44 Years | 19 | 12.3% |
| 45 to 54 Years | 22 | 14.3% |
| 55 to 64 Years | 28 | 18.2% |
| 65 to 74 Years | 20 | 13.0% |
| 75 to 84 Years | 11 | 7.1% |
| 85 Years and Over | 3 | 1.9% |
| Total | 154 | 100.0% |
Housing Finances in Galva
Median Income by Occupancy in Galva
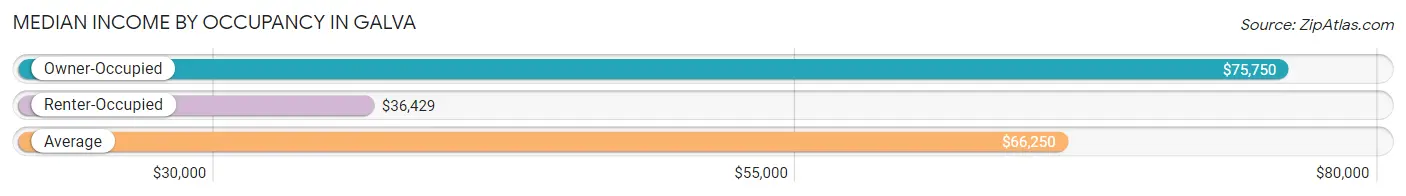
| Occupancy Type | # Households | Median Income |
| Owner-Occupied | 126 (81.8%) | $75,750 |
| Renter-Occupied | 28 (18.2%) | $36,429 |
| Average | 154 (100.0%) | $66,250 |
Occupancy by Householder Income Bracket in Galva
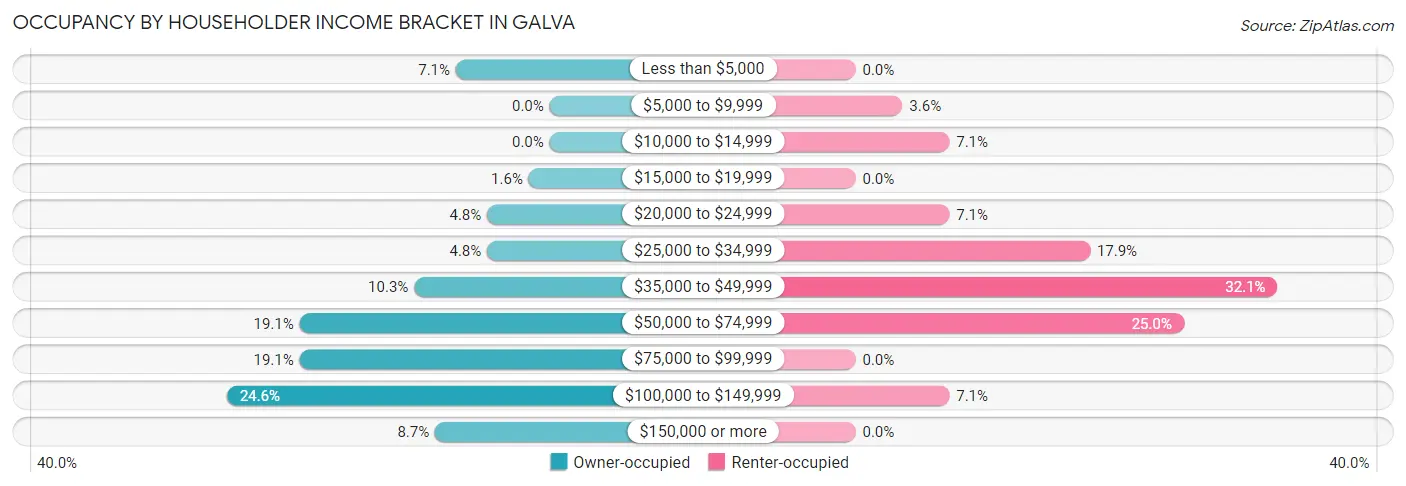
| Income Bracket | Owner-occupied | Renter-occupied |
| Less than $5,000 | 9 (7.1%) | 0 (0.0%) |
| $5,000 to $9,999 | 0 (0.0%) | 1 (3.6%) |
| $10,000 to $14,999 | 0 (0.0%) | 2 (7.1%) |
| $15,000 to $19,999 | 2 (1.6%) | 0 (0.0%) |
| $20,000 to $24,999 | 6 (4.8%) | 2 (7.1%) |
| $25,000 to $34,999 | 6 (4.8%) | 5 (17.9%) |
| $35,000 to $49,999 | 13 (10.3%) | 9 (32.1%) |
| $50,000 to $74,999 | 24 (19.1%) | 7 (25.0%) |
| $75,000 to $99,999 | 24 (19.1%) | 0 (0.0%) |
| $100,000 to $149,999 | 31 (24.6%) | 2 (7.1%) |
| $150,000 or more | 11 (8.7%) | 0 (0.0%) |
| Total | 126 (100.0%) | 28 (100.0%) |
Monthly Housing Cost Tiers in Galva
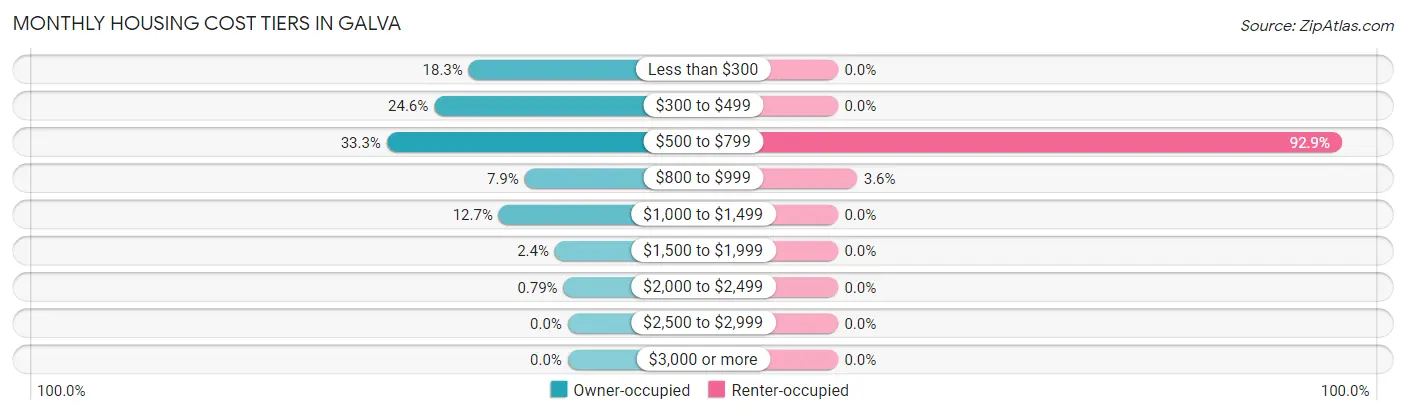
| Monthly Cost | Owner-occupied | Renter-occupied |
| Less than $300 | 23 (18.2%) | 0 (0.0%) |
| $300 to $499 | 31 (24.6%) | 0 (0.0%) |
| $500 to $799 | 42 (33.3%) | 26 (92.9%) |
| $800 to $999 | 10 (7.9%) | 1 (3.6%) |
| $1,000 to $1,499 | 16 (12.7%) | 0 (0.0%) |
| $1,500 to $1,999 | 3 (2.4%) | 0 (0.0%) |
| $2,000 to $2,499 | 1 (0.8%) | 0 (0.0%) |
| $2,500 to $2,999 | 0 (0.0%) | 0 (0.0%) |
| $3,000 or more | 0 (0.0%) | 0 (0.0%) |
| Total | 126 (100.0%) | 28 (100.0%) |
Physical Housing Characteristics in Galva
Housing Structures in Galva
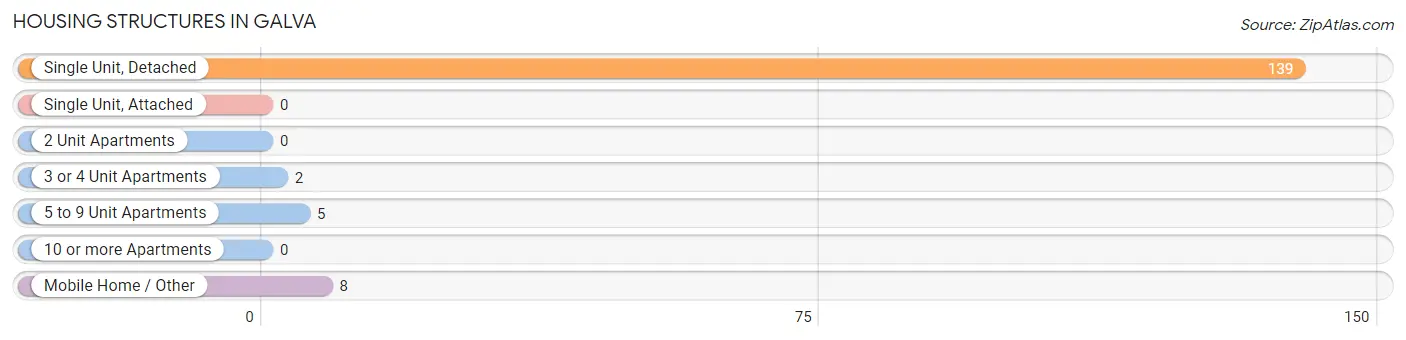
| Structure Type | # Housing Units | % Housing Units |
| Single Unit, Detached | 139 | 90.3% |
| Single Unit, Attached | 0 | 0.0% |
| 2 Unit Apartments | 0 | 0.0% |
| 3 or 4 Unit Apartments | 2 | 1.3% |
| 5 to 9 Unit Apartments | 5 | 3.3% |
| 10 or more Apartments | 0 | 0.0% |
| Mobile Home / Other | 8 | 5.2% |
| Total | 154 | 100.0% |
Housing Structures by Occupancy in Galva
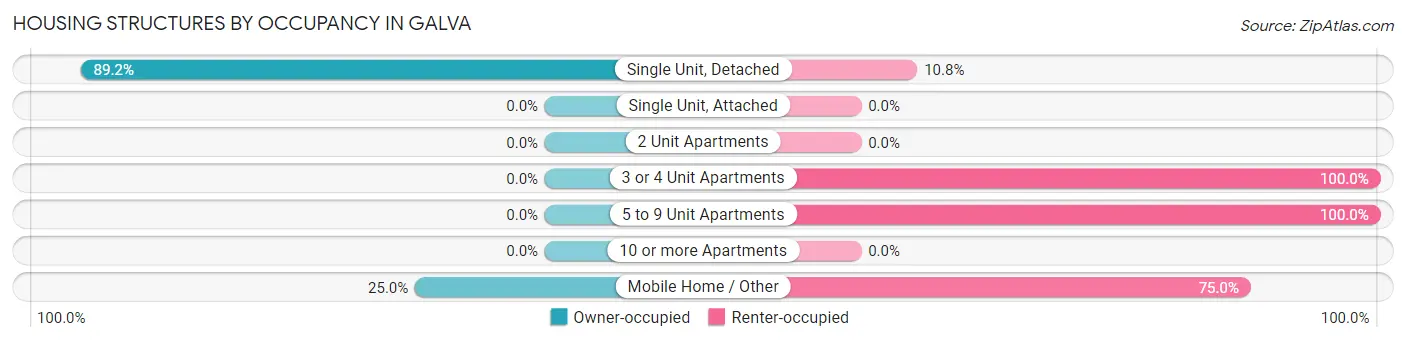
| Structure Type | Owner-occupied | Renter-occupied |
| Single Unit, Detached | 124 (89.2%) | 15 (10.8%) |
| Single Unit, Attached | 0 (0.0%) | 0 (0.0%) |
| 2 Unit Apartments | 0 (0.0%) | 0 (0.0%) |
| 3 or 4 Unit Apartments | 0 (0.0%) | 2 (100.0%) |
| 5 to 9 Unit Apartments | 0 (0.0%) | 5 (100.0%) |
| 10 or more Apartments | 0 (0.0%) | 0 (0.0%) |
| Mobile Home / Other | 2 (25.0%) | 6 (75.0%) |
| Total | 126 (81.8%) | 28 (18.2%) |
Housing Structures by Number of Rooms in Galva
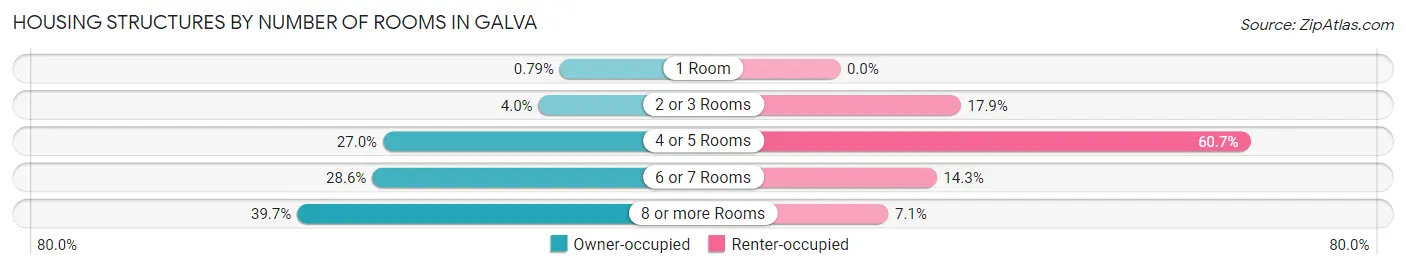
| Number of Rooms | Owner-occupied | Renter-occupied |
| 1 Room | 1 (0.8%) | 0 (0.0%) |
| 2 or 3 Rooms | 5 (4.0%) | 5 (17.9%) |
| 4 or 5 Rooms | 34 (27.0%) | 17 (60.7%) |
| 6 or 7 Rooms | 36 (28.6%) | 4 (14.3%) |
| 8 or more Rooms | 50 (39.7%) | 2 (7.1%) |
| Total | 126 (100.0%) | 28 (100.0%) |
Housing Structure by Heating Type in Galva
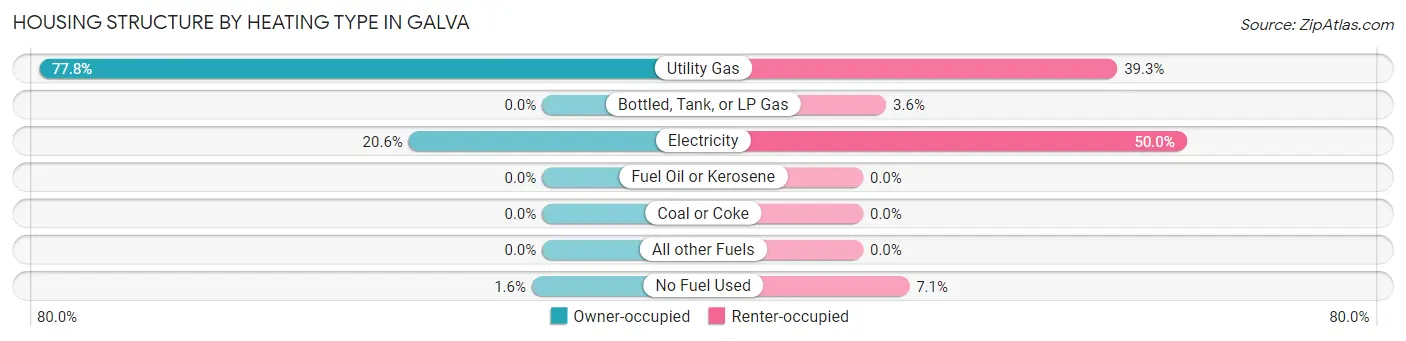
| Heating Type | Owner-occupied | Renter-occupied |
| Utility Gas | 98 (77.8%) | 11 (39.3%) |
| Bottled, Tank, or LP Gas | 0 (0.0%) | 1 (3.6%) |
| Electricity | 26 (20.6%) | 14 (50.0%) |
| Fuel Oil or Kerosene | 0 (0.0%) | 0 (0.0%) |
| Coal or Coke | 0 (0.0%) | 0 (0.0%) |
| All other Fuels | 0 (0.0%) | 0 (0.0%) |
| No Fuel Used | 2 (1.6%) | 2 (7.1%) |
| Total | 126 (100.0%) | 28 (100.0%) |
Household Vehicle Usage in Galva
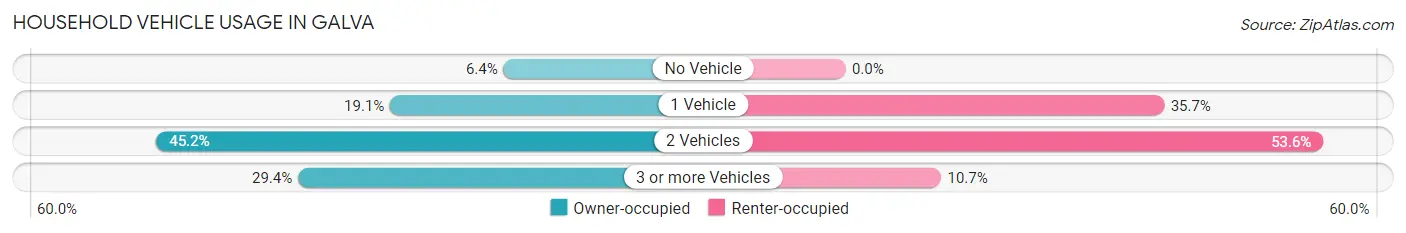
| Vehicles per Household | Owner-occupied | Renter-occupied |
| No Vehicle | 8 (6.4%) | 0 (0.0%) |
| 1 Vehicle | 24 (19.1%) | 10 (35.7%) |
| 2 Vehicles | 57 (45.2%) | 15 (53.6%) |
| 3 or more Vehicles | 37 (29.4%) | 3 (10.7%) |
| Total | 126 (100.0%) | 28 (100.0%) |
Real Estate & Mortgages in Galva
Real Estate and Mortgage Overview in Galva
| Characteristic | Without Mortgage | With Mortgage |
| Housing Units | 73 | 53 |
| Median Property Value | $47,900 | $88,500 |
| Median Household Income | $68,750 | $2 |
| Monthly Housing Costs | $345 | $0 |
| Real Estate Taxes | $564 | $6 |
Property Value by Mortgage Status in Galva
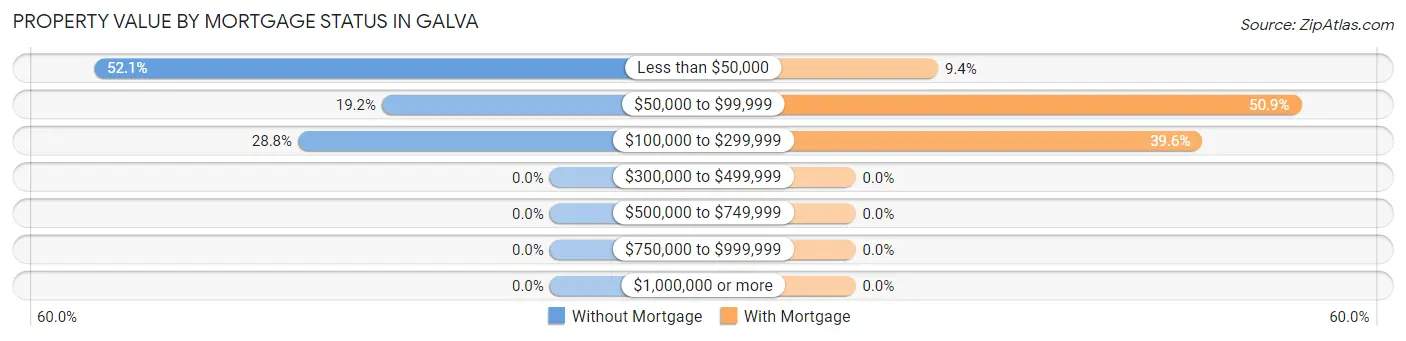
| Property Value | Without Mortgage | With Mortgage |
| Less than $50,000 | 38 (52.0%) | 5 (9.4%) |
| $50,000 to $99,999 | 14 (19.2%) | 27 (50.9%) |
| $100,000 to $299,999 | 21 (28.8%) | 21 (39.6%) |
| $300,000 to $499,999 | 0 (0.0%) | 0 (0.0%) |
| $500,000 to $749,999 | 0 (0.0%) | 0 (0.0%) |
| $750,000 to $999,999 | 0 (0.0%) | 0 (0.0%) |
| $1,000,000 or more | 0 (0.0%) | 0 (0.0%) |
| Total | 73 (100.0%) | 53 (100.0%) |
Household Income by Mortgage Status in Galva
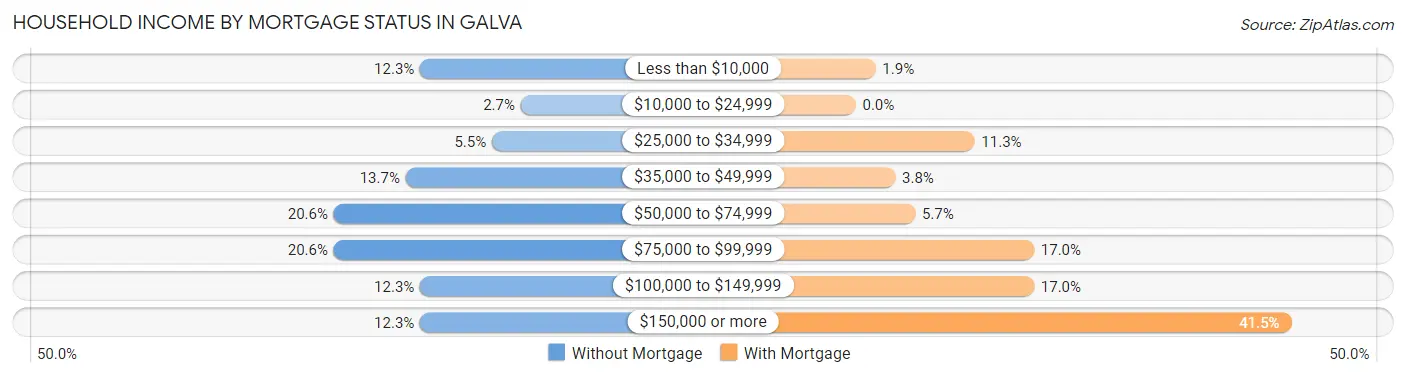
| Household Income | Without Mortgage | With Mortgage |
| Less than $10,000 | 9 (12.3%) | 1 (1.9%) |
| $10,000 to $24,999 | 2 (2.7%) | 0 (0.0%) |
| $25,000 to $34,999 | 4 (5.5%) | 6 (11.3%) |
| $35,000 to $49,999 | 10 (13.7%) | 2 (3.8%) |
| $50,000 to $74,999 | 15 (20.5%) | 3 (5.7%) |
| $75,000 to $99,999 | 15 (20.5%) | 9 (17.0%) |
| $100,000 to $149,999 | 9 (12.3%) | 9 (17.0%) |
| $150,000 or more | 9 (12.3%) | 22 (41.5%) |
| Total | 73 (100.0%) | 53 (100.0%) |
Property Value to Household Income Ratio in Galva
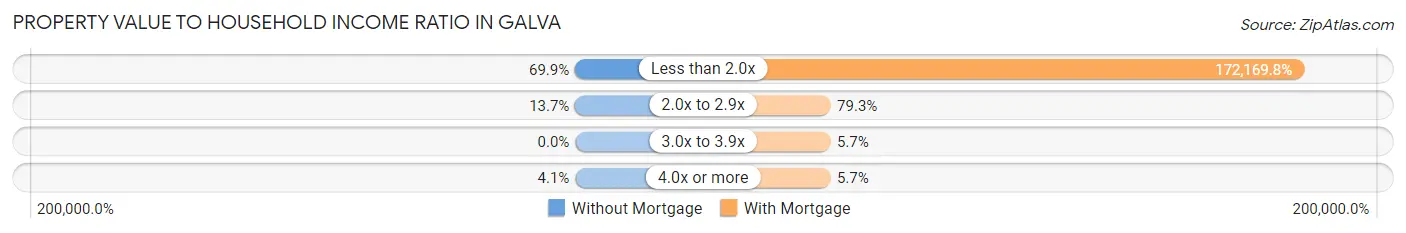
| Value-to-Income Ratio | Without Mortgage | With Mortgage |
| Less than 2.0x | 51 (69.9%) | 91,250 (172,169.8%) |
| 2.0x to 2.9x | 10 (13.7%) | 42 (79.2%) |
| 3.0x to 3.9x | 0 (0.0%) | 3 (5.7%) |
| 4.0x or more | 3 (4.1%) | 3 (5.7%) |
| Total | 73 (100.0%) | 53 (100.0%) |
Real Estate Taxes by Mortgage Status in Galva
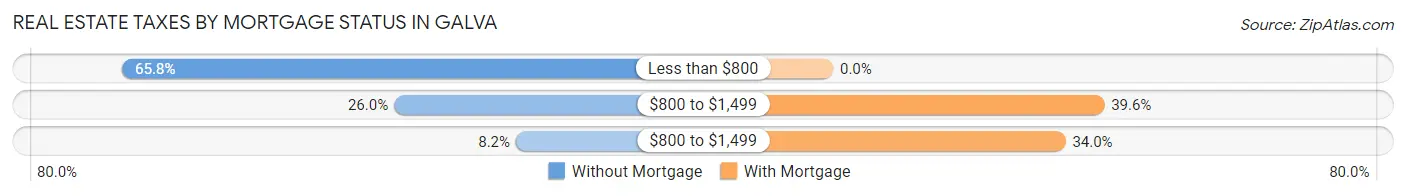
| Property Taxes | Without Mortgage | With Mortgage |
| Less than $800 | 48 (65.7%) | 0 (0.0%) |
| $800 to $1,499 | 19 (26.0%) | 21 (39.6%) |
| $800 to $1,499 | 6 (8.2%) | 18 (34.0%) |
| Total | 73 (100.0%) | 53 (100.0%) |
Health & Disability in Galva
Health Insurance Coverage by Age in Galva
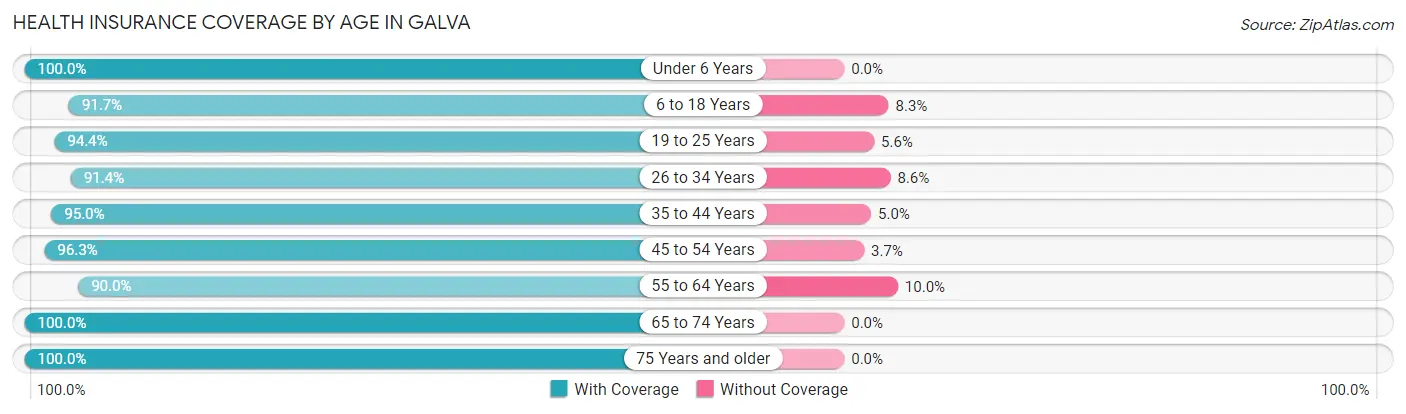
| Age Bracket | With Coverage | Without Coverage |
| Under 6 Years | 62 (100.0%) | 0 (0.0%) |
| 6 to 18 Years | 100 (91.7%) | 9 (8.3%) |
| 19 to 25 Years | 34 (94.4%) | 2 (5.6%) |
| 26 to 34 Years | 53 (91.4%) | 5 (8.6%) |
| 35 to 44 Years | 38 (95.0%) | 2 (5.0%) |
| 45 to 54 Years | 26 (96.3%) | 1 (3.7%) |
| 55 to 64 Years | 54 (90.0%) | 6 (10.0%) |
| 65 to 74 Years | 29 (100.0%) | 0 (0.0%) |
| 75 Years and older | 23 (100.0%) | 0 (0.0%) |
| Total | 419 (94.4%) | 25 (5.6%) |
Health Insurance Coverage by Citizenship Status in Galva
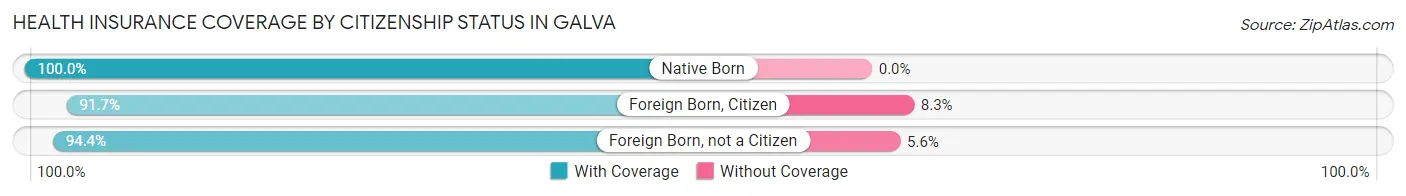
| Citizenship Status | With Coverage | Without Coverage |
| Native Born | 62 (100.0%) | 0 (0.0%) |
| Foreign Born, Citizen | 100 (91.7%) | 9 (8.3%) |
| Foreign Born, not a Citizen | 34 (94.4%) | 2 (5.6%) |
Health Insurance Coverage by Household Income in Galva
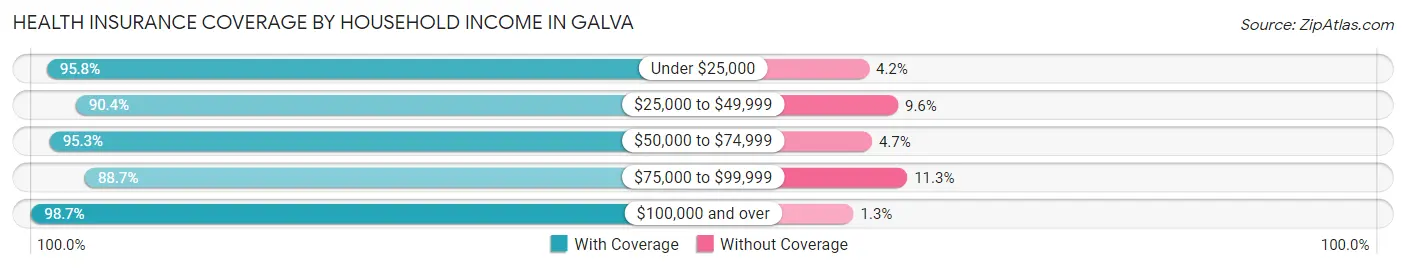
| Household Income | With Coverage | Without Coverage |
| Under $25,000 | 23 (95.8%) | 1 (4.2%) |
| $25,000 to $49,999 | 113 (90.4%) | 12 (9.6%) |
| $50,000 to $74,999 | 81 (95.3%) | 4 (4.7%) |
| $75,000 to $99,999 | 47 (88.7%) | 6 (11.3%) |
| $100,000 and over | 155 (98.7%) | 2 (1.3%) |
Public vs Private Health Insurance Coverage by Age in Galva
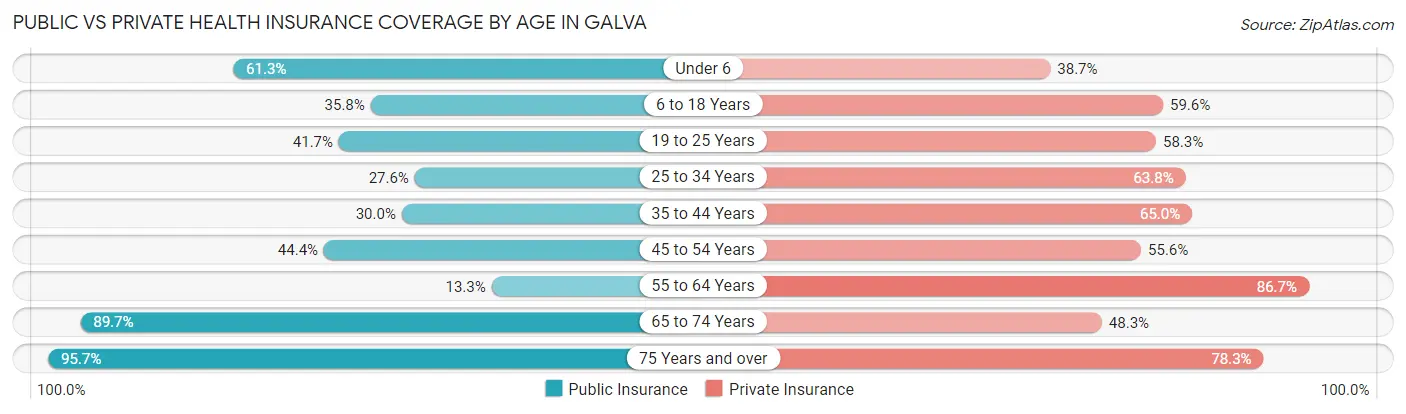
| Age Bracket | Public Insurance | Private Insurance |
| Under 6 | 38 (61.3%) | 24 (38.7%) |
| 6 to 18 Years | 39 (35.8%) | 65 (59.6%) |
| 19 to 25 Years | 15 (41.7%) | 21 (58.3%) |
| 25 to 34 Years | 16 (27.6%) | 37 (63.8%) |
| 35 to 44 Years | 12 (30.0%) | 26 (65.0%) |
| 45 to 54 Years | 12 (44.4%) | 15 (55.6%) |
| 55 to 64 Years | 8 (13.3%) | 52 (86.7%) |
| 65 to 74 Years | 26 (89.7%) | 14 (48.3%) |
| 75 Years and over | 22 (95.7%) | 18 (78.3%) |
| Total | 188 (42.3%) | 272 (61.3%) |
Disability Status by Sex by Age in Galva
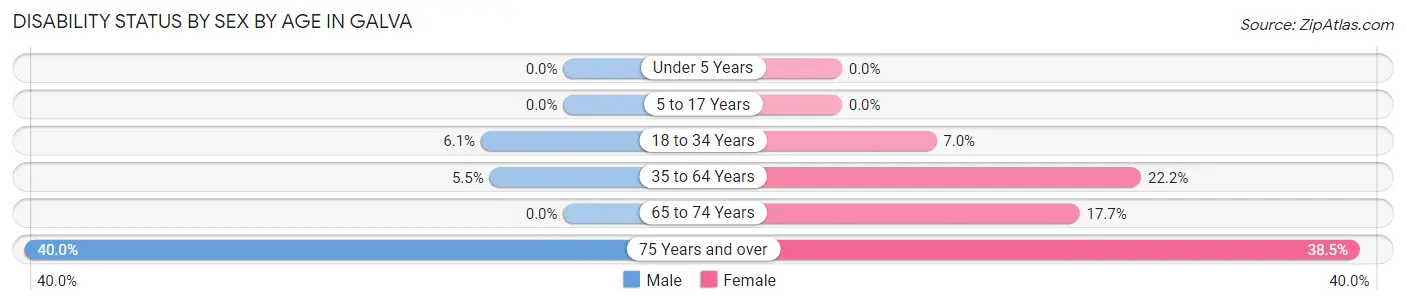
| Age Bracket | Male | Female |
| Under 5 Years | 0 (0.0%) | 0 (0.0%) |
| 5 to 17 Years | 0 (0.0%) | 0 (0.0%) |
| 18 to 34 Years | 3 (6.1%) | 4 (7.0%) |
| 35 to 64 Years | 4 (5.5%) | 12 (22.2%) |
| 65 to 74 Years | 0 (0.0%) | 3 (17.6%) |
| 75 Years and over | 4 (40.0%) | 5 (38.5%) |
Disability Class by Sex by Age in Galva
Disability Class: Hearing Difficulty
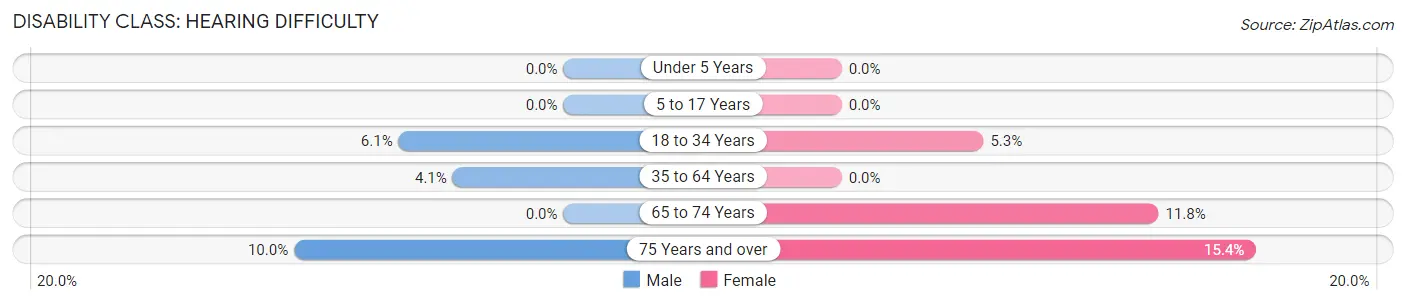
| Age Bracket | Male | Female |
| Under 5 Years | 0 (0.0%) | 0 (0.0%) |
| 5 to 17 Years | 0 (0.0%) | 0 (0.0%) |
| 18 to 34 Years | 3 (6.1%) | 3 (5.3%) |
| 35 to 64 Years | 3 (4.1%) | 0 (0.0%) |
| 65 to 74 Years | 0 (0.0%) | 2 (11.8%) |
| 75 Years and over | 1 (10.0%) | 2 (15.4%) |
Disability Class: Vision Difficulty
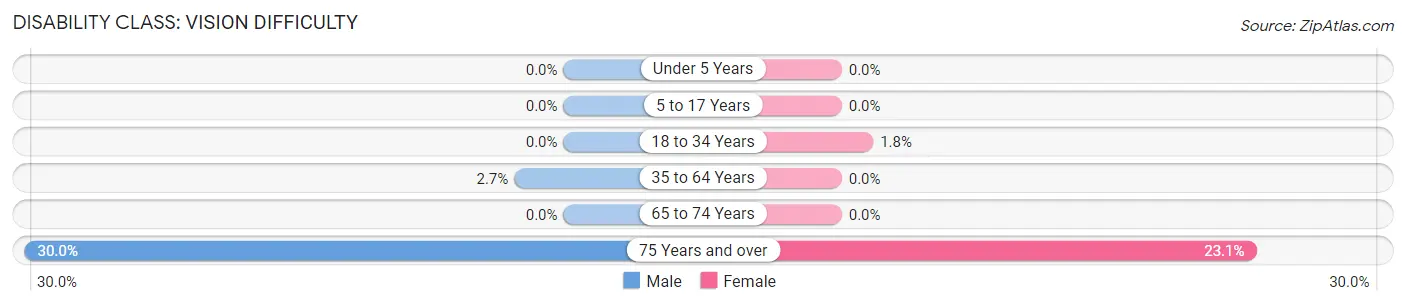
| Age Bracket | Male | Female |
| Under 5 Years | 0 (0.0%) | 0 (0.0%) |
| 5 to 17 Years | 0 (0.0%) | 0 (0.0%) |
| 18 to 34 Years | 0 (0.0%) | 1 (1.8%) |
| 35 to 64 Years | 2 (2.7%) | 0 (0.0%) |
| 65 to 74 Years | 0 (0.0%) | 0 (0.0%) |
| 75 Years and over | 3 (30.0%) | 3 (23.1%) |
Disability Class: Cognitive Difficulty
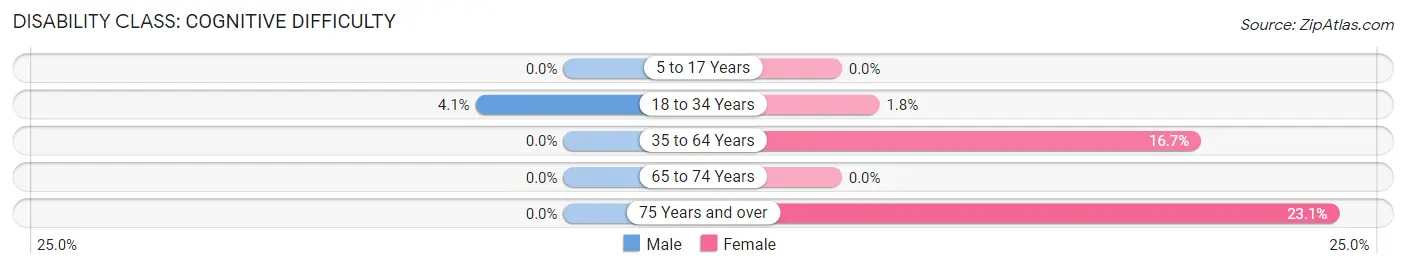
| Age Bracket | Male | Female |
| 5 to 17 Years | 0 (0.0%) | 0 (0.0%) |
| 18 to 34 Years | 2 (4.1%) | 1 (1.8%) |
| 35 to 64 Years | 0 (0.0%) | 9 (16.7%) |
| 65 to 74 Years | 0 (0.0%) | 0 (0.0%) |
| 75 Years and over | 0 (0.0%) | 3 (23.1%) |
Disability Class: Ambulatory Difficulty
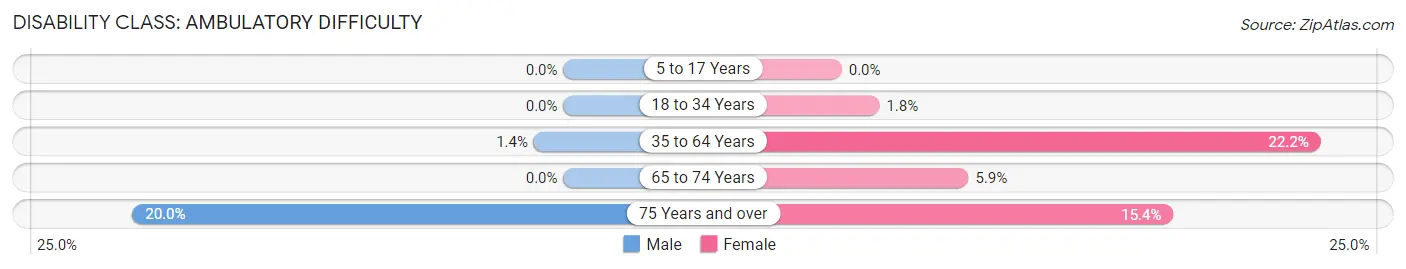
| Age Bracket | Male | Female |
| 5 to 17 Years | 0 (0.0%) | 0 (0.0%) |
| 18 to 34 Years | 0 (0.0%) | 1 (1.8%) |
| 35 to 64 Years | 1 (1.4%) | 12 (22.2%) |
| 65 to 74 Years | 0 (0.0%) | 1 (5.9%) |
| 75 Years and over | 2 (20.0%) | 2 (15.4%) |
Disability Class: Self-Care Difficulty
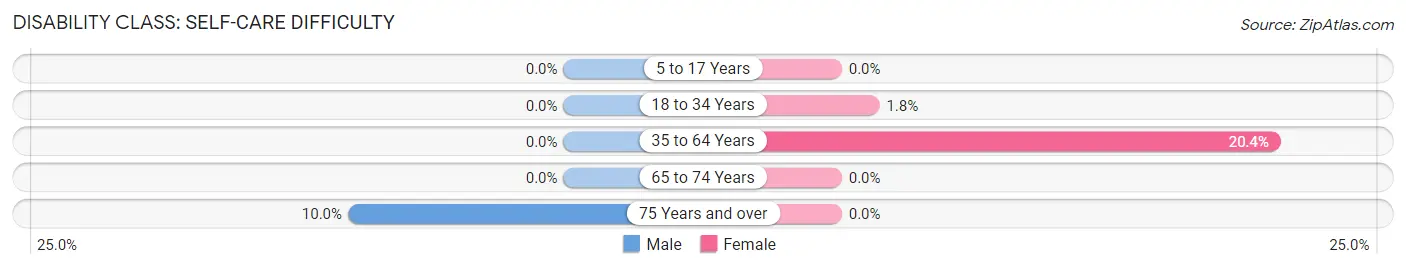
| Age Bracket | Male | Female |
| 5 to 17 Years | 0 (0.0%) | 0 (0.0%) |
| 18 to 34 Years | 0 (0.0%) | 1 (1.8%) |
| 35 to 64 Years | 0 (0.0%) | 11 (20.4%) |
| 65 to 74 Years | 0 (0.0%) | 0 (0.0%) |
| 75 Years and over | 1 (10.0%) | 0 (0.0%) |
Technology Access in Galva
Computing Device Access in Galva
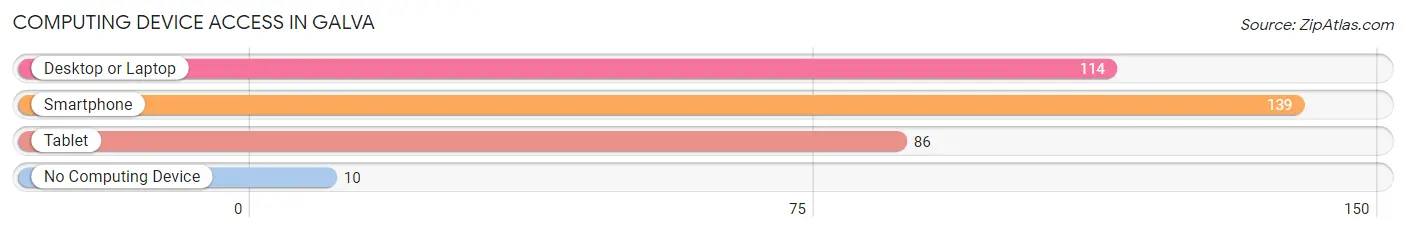
| Device Type | # Households | % Households |
| Desktop or Laptop | 114 | 74.0% |
| Smartphone | 139 | 90.3% |
| Tablet | 86 | 55.8% |
| No Computing Device | 10 | 6.5% |
| Total | 154 | 100.0% |
Internet Access in Galva
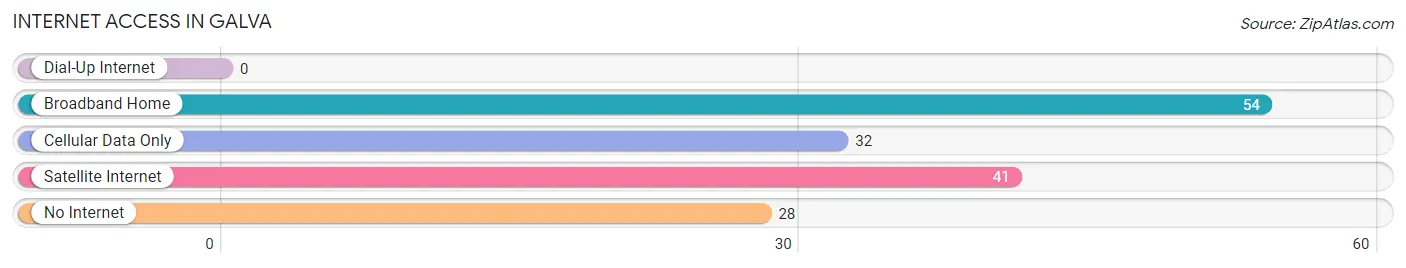
| Internet Type | # Households | % Households |
| Dial-Up Internet | 0 | 0.0% |
| Broadband Home | 54 | 35.1% |
| Cellular Data Only | 32 | 20.8% |
| Satellite Internet | 41 | 26.6% |
| No Internet | 28 | 18.2% |
| Total | 154 | 100.0% |
Galva Summary
Galva, Iowa is a small city located in the northwest corner of the state, in the county of Ida. It is situated on the banks of the Little Sioux River, and is home to a population of just over 1,000 people. The city is known for its rural charm and its strong sense of community.
History
The area that is now Galva was first settled in the late 1800s by a group of Swedish immigrants. The town was originally called Swede Point, and was founded in 1881. The name was changed to Galva in 1883, after the nearby Galva Creek. The town was incorporated in 1887, and the first mayor was elected in 1888.
The early years of Galva were marked by growth and prosperity. The town was home to a variety of businesses, including a flour mill, a creamery, a lumber yard, and a blacksmith shop. The railroad also played an important role in the town’s development, as it provided a means of transportation for goods and people.
In the early 1900s, Galva experienced a period of decline. The Great Depression hit the town hard, and many businesses closed their doors. The population also decreased, as people moved away in search of better opportunities.
Geography
Galva is located in the northwest corner of Iowa, in Ida County. It is situated on the banks of the Little Sioux River, and is surrounded by rolling hills and farmland. The city is located approximately 30 miles from Sioux City, and is about a two-hour drive from Des Moines.
The climate in Galva is typical of the Midwest, with hot summers and cold winters. The average temperature in the summer is around 75 degrees Fahrenheit, and the average temperature in the winter is around 25 degrees Fahrenheit.
Economy
The economy of Galva is largely based on agriculture. The town is home to several farms, and the surrounding area is known for its production of corn, soybeans, and other crops. The town is also home to a variety of small businesses, including restaurants, retail stores, and service providers.
The town is also home to a number of manufacturing companies, including a furniture factory and a plastics factory. These companies provide employment opportunities for many of the town’s residents.
Demographics
As of the 2010 census, the population of Galva was 1,039. The racial makeup of the town was 97.3% White, 0.7% African American, 0.3% Native American, 0.2% Asian, and 1.5% from other races. The median household income was $41,250, and the median age was 41.
Galva is a small town with a strong sense of community. The town is home to a variety of churches, and there are several community organizations that provide support and services to the town’s residents. The town is also home to a number of parks and recreational facilities, including a public swimming pool and a golf course.
Common Questions
What is Per Capita Income in Galva?
Per Capita income in Galva is $26,421.
What is the Median Family Income in Galva?
Median Family Income in Galva is $77,188.
What is the Median Household income in Galva?
Median Household Income in Galva is $66,250.
What is Income or Wage Gap in Galva?
Income or Wage Gap in Galva is 40.8%.
Women in Galva earn 59.2 cents for every dollar earned by a man.
What is Inequality or Gini Index in Galva?
Inequality or Gini Index in Galva is 0.38.
What is the Total Population of Galva?
Total Population of Galva is 444.
What is the Total Male Population of Galva?
Total Male Population of Galva is 225.
What is the Total Female Population of Galva?
Total Female Population of Galva is 219.
What is the Ratio of Males per 100 Females in Galva?
There are 102.74 Males per 100 Females in Galva.
What is the Ratio of Females per 100 Males in Galva?
There are 97.33 Females per 100 Males in Galva.
What is the Median Population Age in Galva?
Median Population Age in Galva is 29.5 Years.
What is the Average Family Size in Galva
Average Family Size in Galva is 3.9 People.
What is the Average Household Size in Galva
Average Household Size in Galva is 2.9 People.
How Large is the Labor Force in Galva?
There are 211 People in the Labor Forcein in Galva.
What is the Percentage of People in the Labor Force in Galva?
73.0% of People are in the Labor Force in Galva.