Aurora, IA Map & Demographics
Aurora Map
Aurora Overview
$24,943
PER CAPITA INCOME
$73,750
AVG FAMILY INCOME
$46,250
AVG HOUSEHOLD INCOME
22.3%
WAGE / INCOME GAP [ % ]
77.7¢/ $1
WAGE / INCOME GAP [ $ ]
$13,478
FAMILY INCOME DEFICIT
0.39
INEQUALITY / GINI INDEX
197
TOTAL POPULATION
97
MALE POPULATION
100
FEMALE POPULATION
97.00
MALES / 100 FEMALES
103.09
FEMALES / 100 MALES
33.5
MEDIAN AGE
3.2
AVG FAMILY SIZE
2.6
AVG HOUSEHOLD SIZE
106
LABOR FORCE [ PEOPLE ]
75.2%
PERCENT IN LABOR FORCE
6.6%
UNEMPLOYMENT RATE
Aurora Zip Codes
Aurora Area Codes
Income in Aurora
Income Overview in Aurora
Per Capita Income in Aurora is $24,943, while median incomes of families and households are $73,750 and $46,250 respectively.
| Characteristic | Number | Measure |
| Per Capita Income | 197 | $24,943 |
| Median Family Income | 52 | $73,750 |
| Mean Family Income | 52 | $79,033 |
| Median Household Income | 75 | $46,250 |
| Mean Household Income | 75 | $66,679 |
| Income Deficit | 52 | $13,478 |
| Wage / Income Gap (%) | 197 | 22.28% |
| Wage / Income Gap ($) | 197 | 77.72¢ per $1 |
| Gini / Inequality Index | 197 | 0.39 |
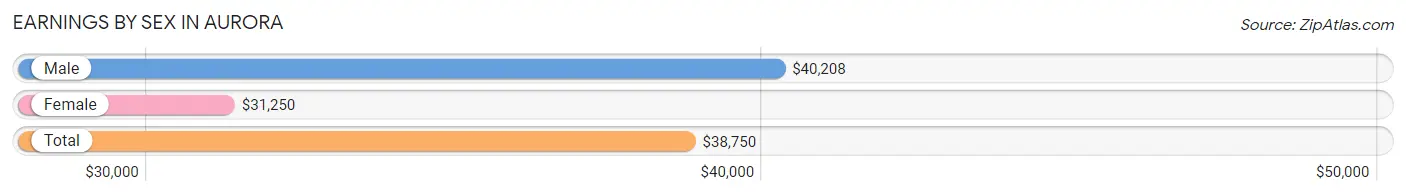
Earnings by Sex in Aurora
Average Earnings in Aurora are $38,750, $40,208 for men and $31,250 for women, a difference of 22.3%.
| Sex | Number | Average Earnings |
| Male | 61 (57.6%) | $40,208 |
| Female | 45 (42.4%) | $31,250 |
| Total | 106 (100.0%) | $38,750 |
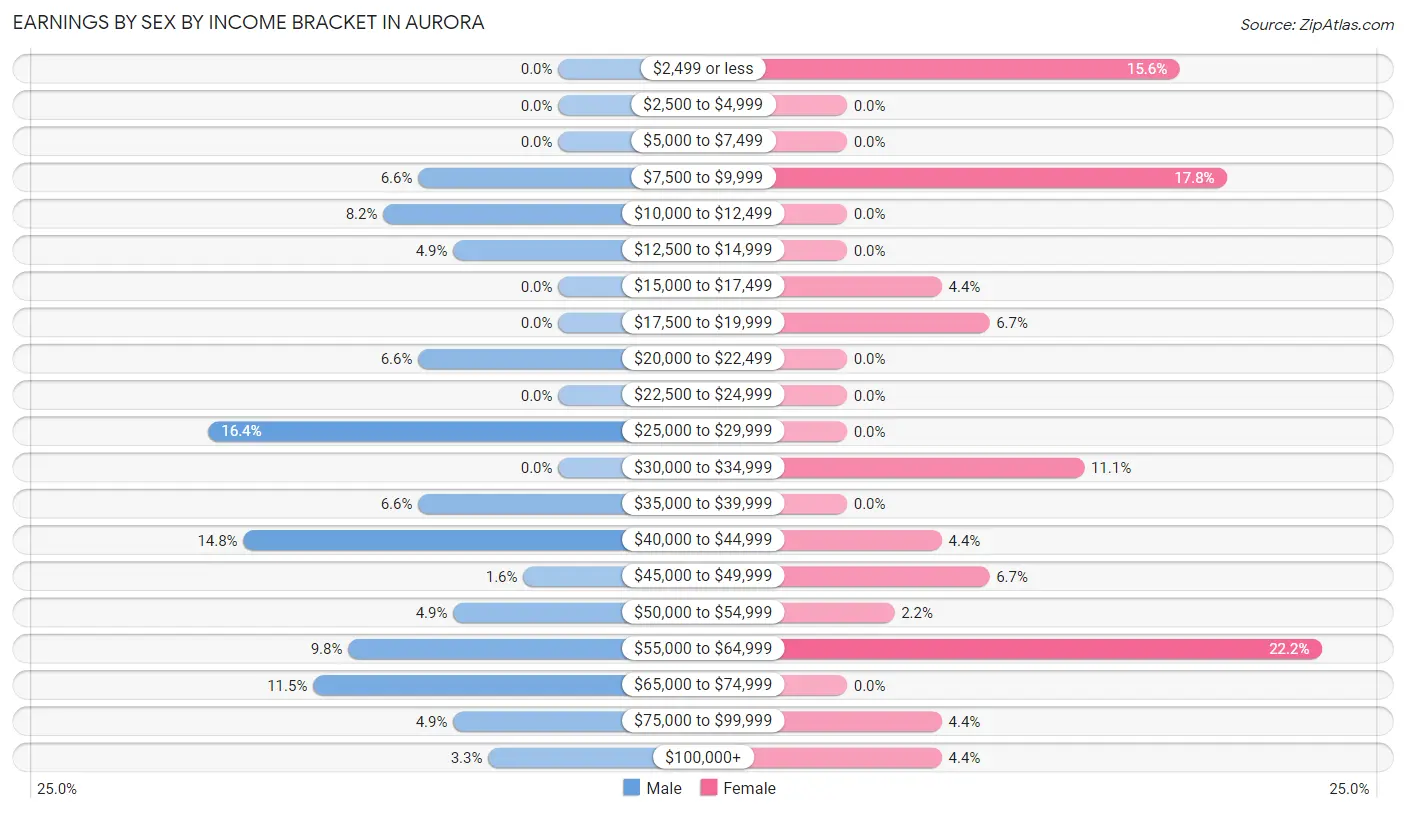
Earnings by Sex by Income Bracket in Aurora
The most common earnings brackets in Aurora are $25,000 to $29,999 for men (10 | 16.4%) and $55,000 to $64,999 for women (10 | 22.2%).
| Income | Male | Female |
| $2,499 or less | 0 (0.0%) | 7 (15.6%) |
| $2,500 to $4,999 | 0 (0.0%) | 0 (0.0%) |
| $5,000 to $7,499 | 0 (0.0%) | 0 (0.0%) |
| $7,500 to $9,999 | 4 (6.6%) | 8 (17.8%) |
| $10,000 to $12,499 | 5 (8.2%) | 0 (0.0%) |
| $12,500 to $14,999 | 3 (4.9%) | 0 (0.0%) |
| $15,000 to $17,499 | 0 (0.0%) | 2 (4.4%) |
| $17,500 to $19,999 | 0 (0.0%) | 3 (6.7%) |
| $20,000 to $22,499 | 4 (6.6%) | 0 (0.0%) |
| $22,500 to $24,999 | 0 (0.0%) | 0 (0.0%) |
| $25,000 to $29,999 | 10 (16.4%) | 0 (0.0%) |
| $30,000 to $34,999 | 0 (0.0%) | 5 (11.1%) |
| $35,000 to $39,999 | 4 (6.6%) | 0 (0.0%) |
| $40,000 to $44,999 | 9 (14.7%) | 2 (4.4%) |
| $45,000 to $49,999 | 1 (1.6%) | 3 (6.7%) |
| $50,000 to $54,999 | 3 (4.9%) | 1 (2.2%) |
| $55,000 to $64,999 | 6 (9.8%) | 10 (22.2%) |
| $65,000 to $74,999 | 7 (11.5%) | 0 (0.0%) |
| $75,000 to $99,999 | 3 (4.9%) | 2 (4.4%) |
| $100,000+ | 2 (3.3%) | 2 (4.4%) |
| Total | 61 (100.0%) | 45 (100.0%) |
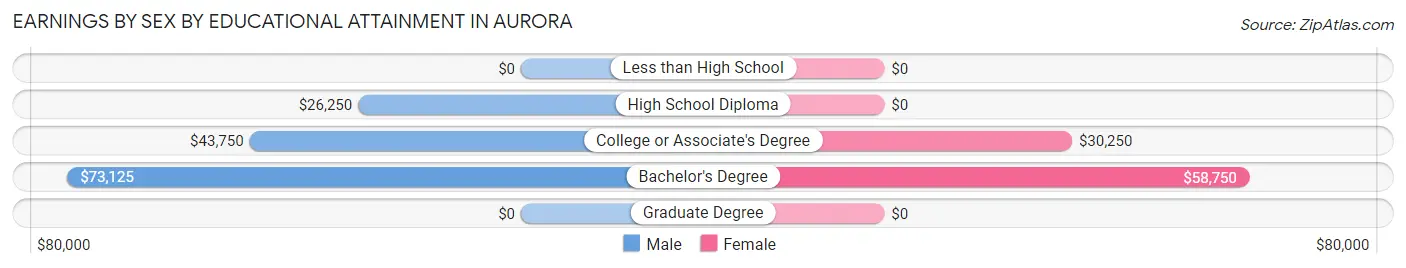
Earnings by Sex by Educational Attainment in Aurora
| Educational Attainment | Male Income | Female Income |
| Less than High School | - | - |
| High School Diploma | $26,250 | $0 |
| College or Associate's Degree | $43,750 | $30,250 |
| Bachelor's Degree | $73,125 | $58,750 |
| Graduate Degree | - | - |
| Total | $41,458 | $0 |
Family Income in Aurora
Family Income Brackets in Aurora
According to the Aurora family income data, there are 17 families falling into the $100,000 to $149,999 income range, which is the most common income bracket and makes up 32.7% of all families.
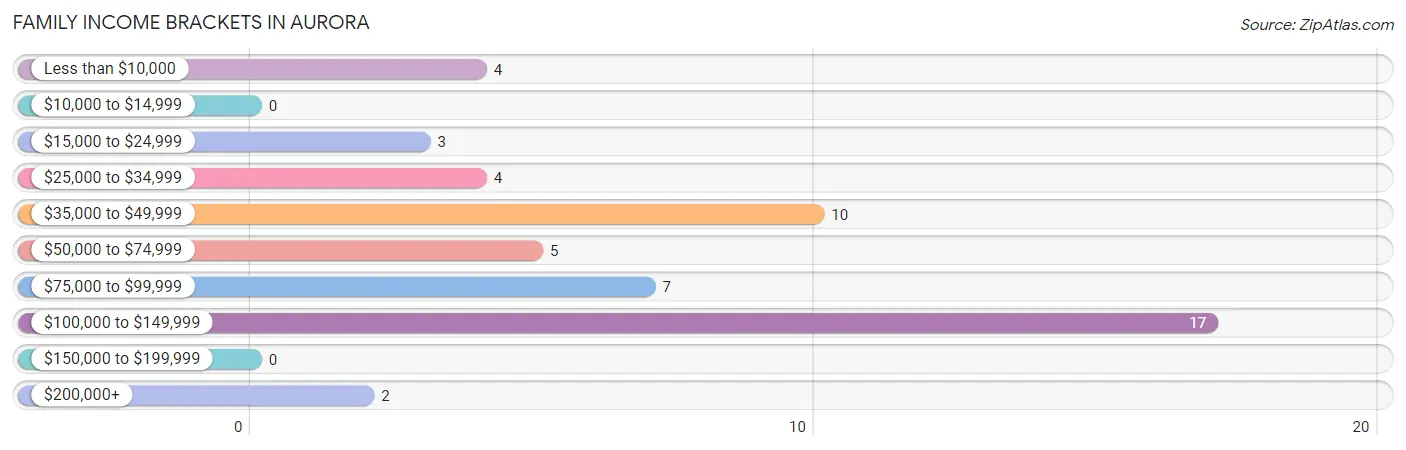
| Income Bracket | # Families | % Families |
| Less than $10,000 | 4 | 7.7% |
| $10,000 to $14,999 | 0 | 0.0% |
| $15,000 to $24,999 | 3 | 5.8% |
| $25,000 to $34,999 | 4 | 7.7% |
| $35,000 to $49,999 | 10 | 19.2% |
| $50,000 to $74,999 | 5 | 9.6% |
| $75,000 to $99,999 | 7 | 13.5% |
| $100,000 to $149,999 | 17 | 32.7% |
| $150,000 to $199,999 | 0 | 0.0% |
| $200,000+ | 2 | 3.8% |
Family Income by Famaliy Size in Aurora
2-person families (22 | 42.3%) account for the highest median family income in Aurora with $90,000 per family, while 2-person families (22 | 42.3%) have the highest median income of $45,000 per family member.
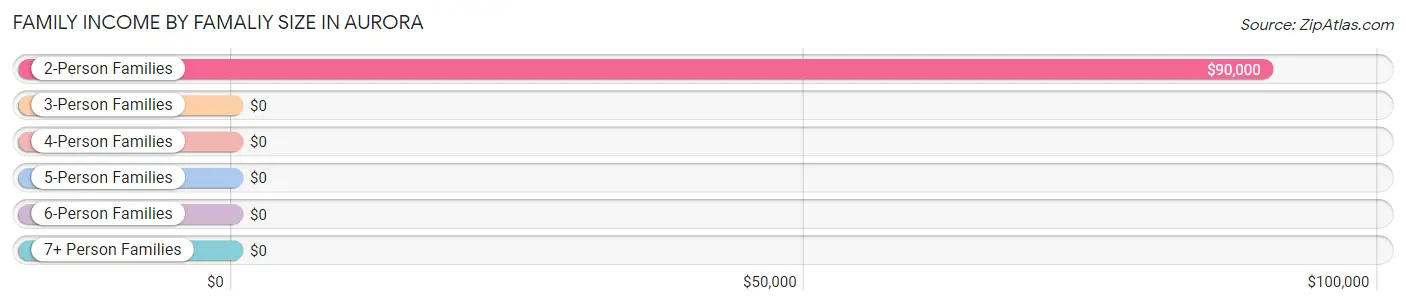
| Income Bracket | # Families | Median Income |
| 2-Person Families | 22 (42.3%) | $90,000 |
| 3-Person Families | 10 (19.2%) | $0 |
| 4-Person Families | 6 (11.5%) | $0 |
| 5-Person Families | 10 (19.2%) | $0 |
| 6-Person Families | 4 (7.7%) | $0 |
| 7+ Person Families | 0 (0.0%) | $0 |
| Total | 52 (100.0%) | $73,750 |
Family Income by Number of Earners in Aurora
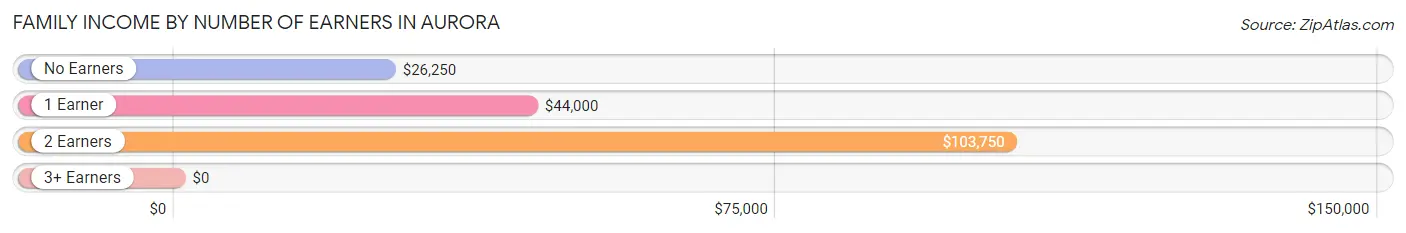
| Number of Earners | # Families | Median Income |
| No Earners | 8 (15.4%) | $26,250 |
| 1 Earner | 16 (30.8%) | $44,000 |
| 2 Earners | 24 (46.2%) | $103,750 |
| 3+ Earners | 4 (7.7%) | $0 |
| Total | 52 (100.0%) | $73,750 |
Household Income in Aurora
Household Income Brackets in Aurora
With 17 households falling in the category, the $100,000 to $149,999 income range is the most frequent in Aurora, accounting for 22.7% of all households.
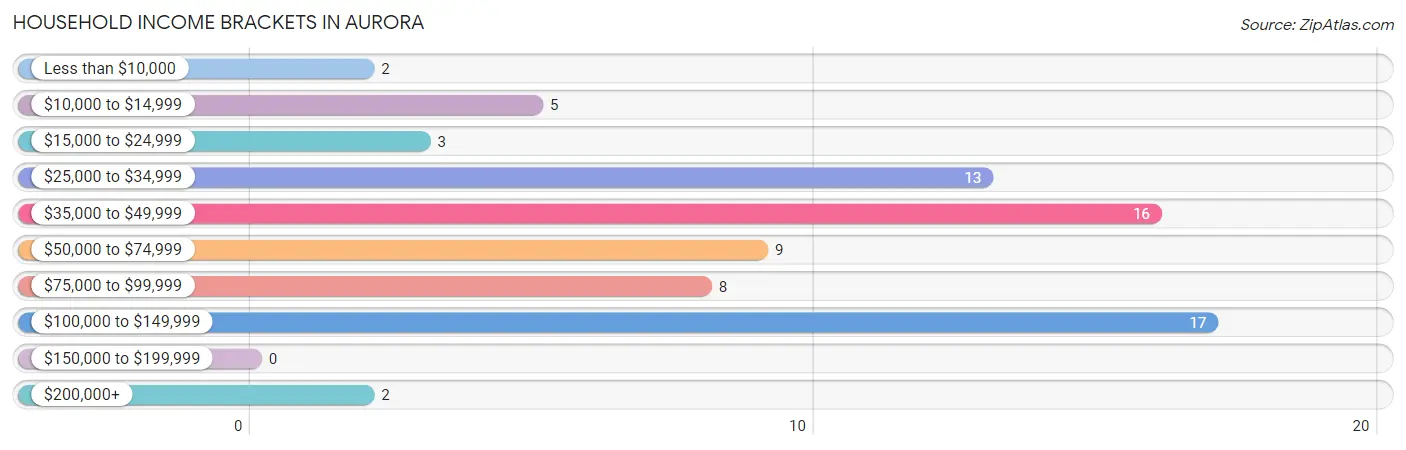
| Income Bracket | # Households | % Households |
| Less than $10,000 | 2 | 2.7% |
| $10,000 to $14,999 | 5 | 6.7% |
| $15,000 to $24,999 | 3 | 4.0% |
| $25,000 to $34,999 | 13 | 17.3% |
| $35,000 to $49,999 | 16 | 21.3% |
| $50,000 to $74,999 | 9 | 12.0% |
| $75,000 to $99,999 | 8 | 10.7% |
| $100,000 to $149,999 | 17 | 22.7% |
| $150,000 to $199,999 | 0 | 0.0% |
| $200,000+ | 2 | 2.7% |
Household Income by Householder Age in Aurora
The median household income in Aurora is $46,250, with the highest median household income of $86,875 found in the 45 to 64 years age bracket for the primary householder. A total of 27 households (36.0%) fall into this category. Meanwhile, the 15 to 24 years age bracket for the primary householder has the lowest median household income of $0, with 2 households (2.7%) in this group.
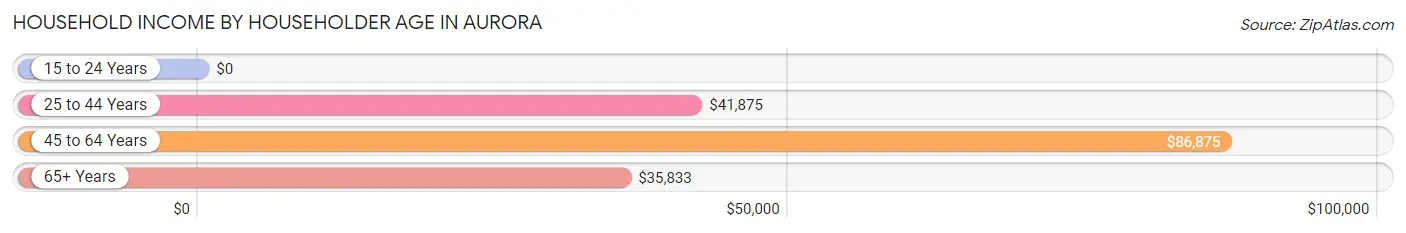
| Income Bracket | # Households | Median Income |
| 15 to 24 Years | 2 (2.7%) | $0 |
| 25 to 44 Years | 36 (48.0%) | $41,875 |
| 45 to 64 Years | 27 (36.0%) | $86,875 |
| 65+ Years | 10 (13.3%) | $35,833 |
| Total | 75 (100.0%) | $46,250 |
Poverty in Aurora
Income Below Poverty by Sex and Age in Aurora
With 24.7% poverty level for males and 19.0% for females among the residents of Aurora, 6 to 11 year old males and 18 to 24 year old females are the most vulnerable to poverty, with 6 males (85.7%) and 2 females (100.0%) in their respective age groups living below the poverty level.
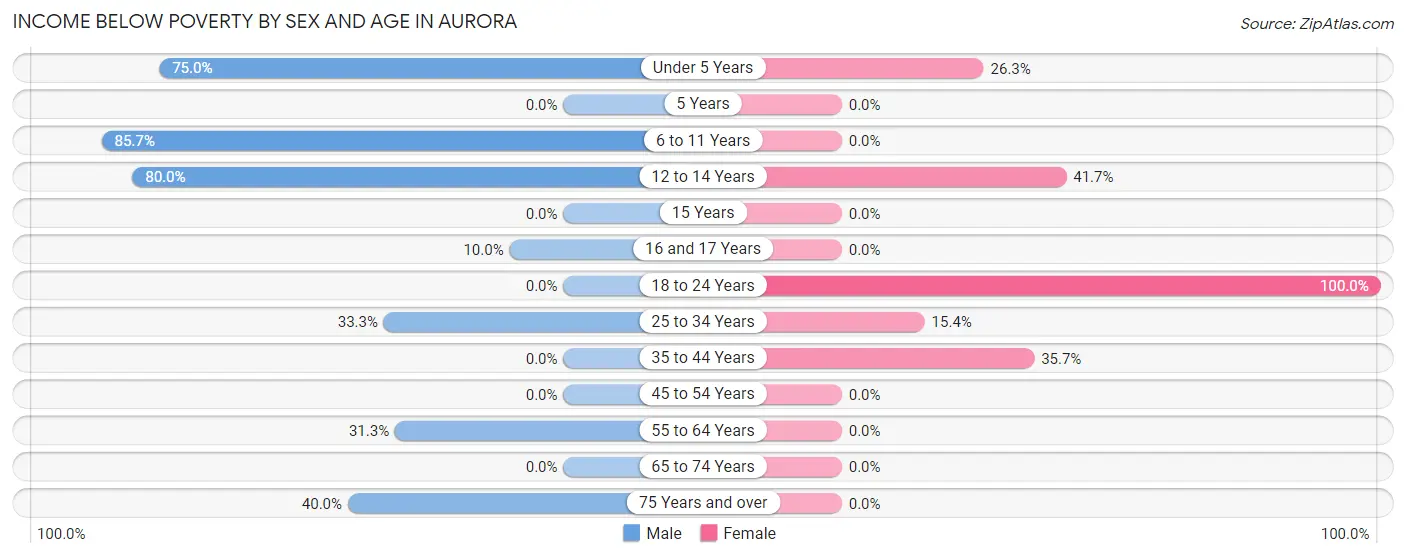
| Age Bracket | Male | Female |
| Under 5 Years | 3 (75.0%) | 5 (26.3%) |
| 5 Years | 0 (0.0%) | 0 (0.0%) |
| 6 to 11 Years | 6 (85.7%) | 0 (0.0%) |
| 12 to 14 Years | 4 (80.0%) | 5 (41.7%) |
| 15 Years | 0 (0.0%) | 0 (0.0%) |
| 16 and 17 Years | 1 (10.0%) | 0 (0.0%) |
| 18 to 24 Years | 0 (0.0%) | 2 (100.0%) |
| 25 to 34 Years | 3 (33.3%) | 2 (15.4%) |
| 35 to 44 Years | 0 (0.0%) | 5 (35.7%) |
| 45 to 54 Years | 0 (0.0%) | 0 (0.0%) |
| 55 to 64 Years | 5 (31.2%) | 0 (0.0%) |
| 65 to 74 Years | 0 (0.0%) | 0 (0.0%) |
| 75 Years and over | 2 (40.0%) | 0 (0.0%) |
| Total | 24 (24.7%) | 19 (19.0%) |
Income Above Poverty by Sex and Age in Aurora
According to the poverty statistics in Aurora, males aged 5 years and females aged 6 to 11 years are the age groups that are most secure financially, with 100.0% of males and 100.0% of females in these age groups living above the poverty line.
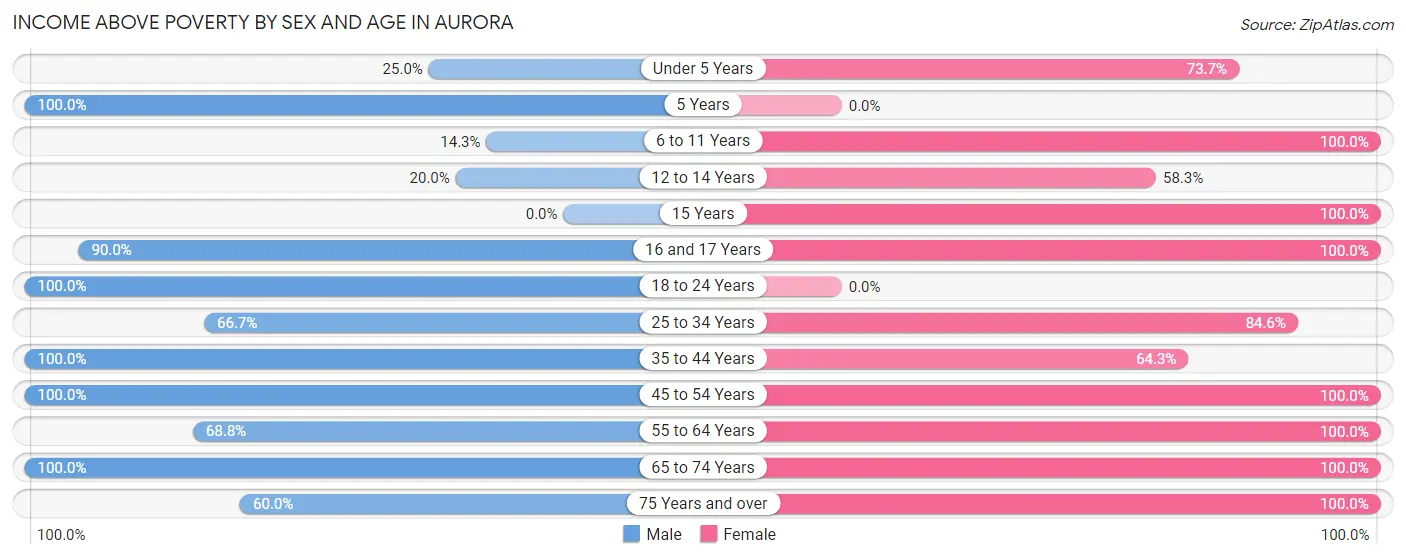
| Age Bracket | Male | Female |
| Under 5 Years | 1 (25.0%) | 14 (73.7%) |
| 5 Years | 1 (100.0%) | 0 (0.0%) |
| 6 to 11 Years | 1 (14.3%) | 5 (100.0%) |
| 12 to 14 Years | 1 (20.0%) | 7 (58.3%) |
| 15 Years | 0 (0.0%) | 3 (100.0%) |
| 16 and 17 Years | 9 (90.0%) | 2 (100.0%) |
| 18 to 24 Years | 8 (100.0%) | 0 (0.0%) |
| 25 to 34 Years | 6 (66.7%) | 11 (84.6%) |
| 35 to 44 Years | 16 (100.0%) | 9 (64.3%) |
| 45 to 54 Years | 13 (100.0%) | 9 (100.0%) |
| 55 to 64 Years | 11 (68.8%) | 14 (100.0%) |
| 65 to 74 Years | 3 (100.0%) | 5 (100.0%) |
| 75 Years and over | 3 (60.0%) | 2 (100.0%) |
| Total | 73 (75.3%) | 81 (81.0%) |
Income Below Poverty Among Married-Couple Families in Aurora
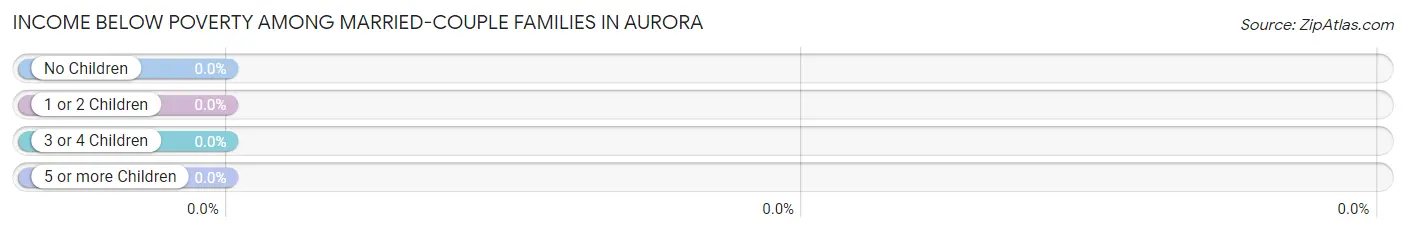
| Children | Above Poverty | Below Poverty |
| No Children | 24 (100.0%) | 0 (0.0%) |
| 1 or 2 Children | 7 (100.0%) | 0 (0.0%) |
| 3 or 4 Children | 8 (100.0%) | 0 (0.0%) |
| 5 or more Children | 0 (0.0%) | 0 (0.0%) |
| Total | 39 (100.0%) | 0 (0.0%) |
Income Below Poverty Among Single-Parent Households in Aurora
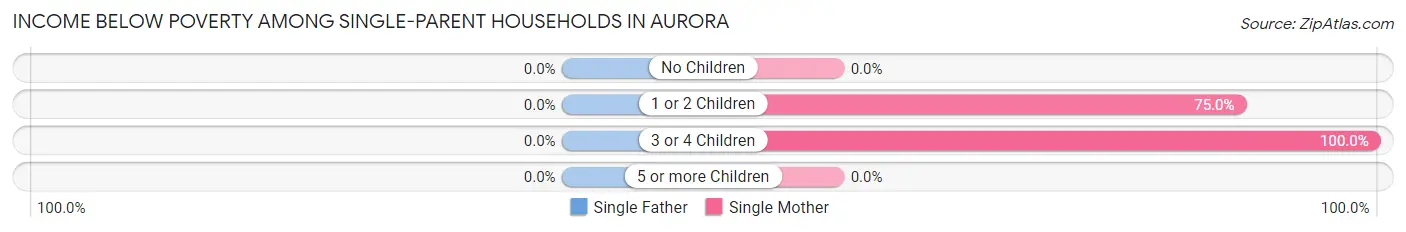
| Children | Single Father | Single Mother |
| No Children | 0 (0.0%) | 0 (0.0%) |
| 1 or 2 Children | 0 (0.0%) | 3 (75.0%) |
| 3 or 4 Children | 0 (0.0%) | 6 (100.0%) |
| 5 or more Children | 0 (0.0%) | 0 (0.0%) |
| Total | 0 (0.0%) | 9 (69.2%) |
Income Below Poverty Among Married-Couple vs Single-Parent Households in Aurora
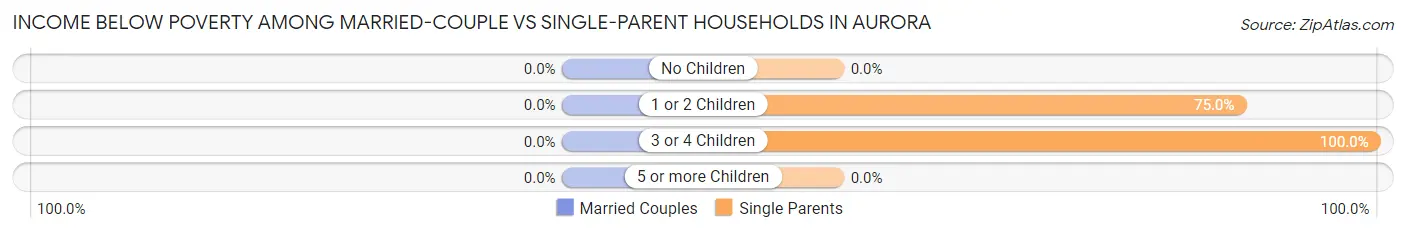
| Children | Married-Couple Families | Single-Parent Households |
| No Children | 0 (0.0%) | 0 (0.0%) |
| 1 or 2 Children | 0 (0.0%) | 3 (75.0%) |
| 3 or 4 Children | 0 (0.0%) | 6 (100.0%) |
| 5 or more Children | 0 (0.0%) | 0 (0.0%) |
| Total | 0 (0.0%) | 9 (69.2%) |
Race in Aurora
The most populous races in Aurora are White / Caucasian (186 | 94.4%), Hispanic or Latino (8 | 4.1%), and Some other Race (8 | 4.1%).
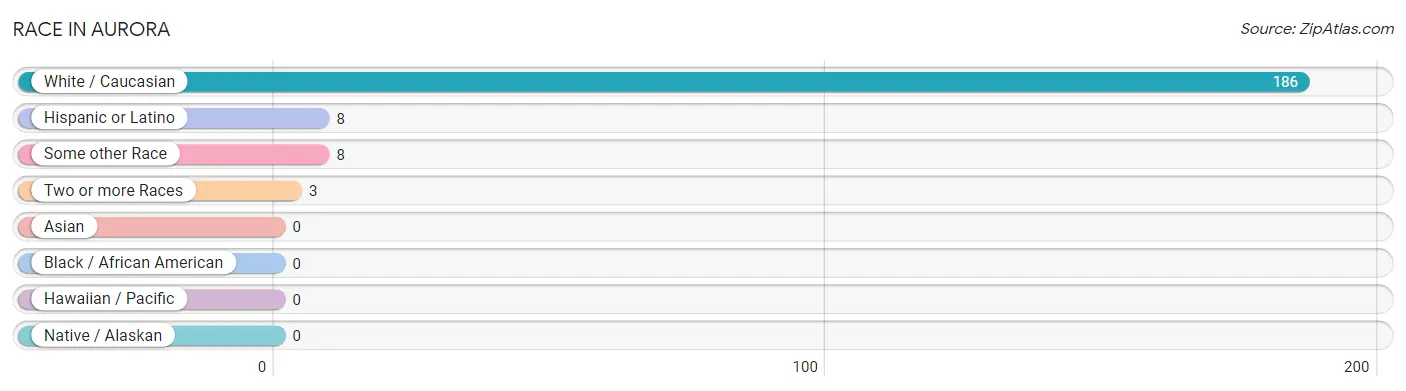
| Race | # Population | % Population |
| Asian | 0 | 0.0% |
| Black / African American | 0 | 0.0% |
| Hawaiian / Pacific | 0 | 0.0% |
| Hispanic or Latino | 8 | 4.1% |
| Native / Alaskan | 0 | 0.0% |
| White / Caucasian | 186 | 94.4% |
| Two or more Races | 3 | 1.5% |
| Some other Race | 8 | 4.1% |
| Total | 197 | 100.0% |
Ancestry in Aurora
The most populous ancestries reported in Aurora are German (49 | 24.9%), American (12 | 6.1%), Irish (11 | 5.6%), Mexican (8 | 4.1%), and Norwegian (7 | 3.5%), together accounting for 44.2% of all Aurora residents.
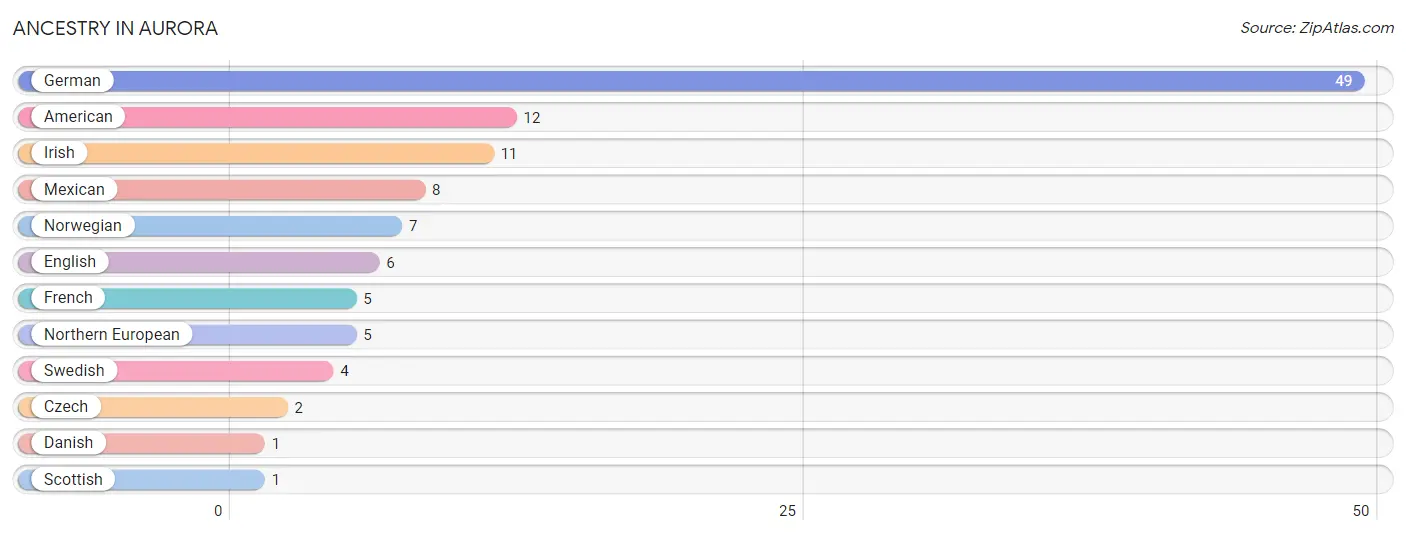
| Ancestry | # Population | % Population |
| American | 12 | 6.1% |
| Czech | 2 | 1.0% |
| Danish | 1 | 0.5% |
| English | 6 | 3.0% |
| French | 5 | 2.5% |
| German | 49 | 24.9% |
| Irish | 11 | 5.6% |
| Mexican | 8 | 4.1% |
| Northern European | 5 | 2.5% |
| Norwegian | 7 | 3.5% |
| Scottish | 1 | 0.5% |
| Swedish | 4 | 2.0% | View All 12 Rows |
Immigrants in Aurora
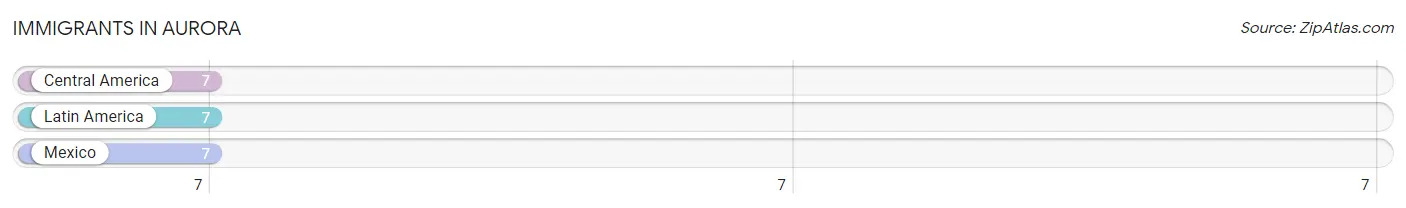
The most numerous immigrant groups reported in Aurora came from Central America (7 | 3.5%), Latin America (7 | 3.5%), and Mexico (7 | 3.5%), together accounting for 10.6% of all Aurora residents.
| Immigration Origin | # Population | % Population |
| Central America | 7 | 3.5% |
| Latin America | 7 | 3.5% |
| Mexico | 7 | 3.5% | View All 3 Rows |
Sex and Age in Aurora
Sex and Age in Aurora
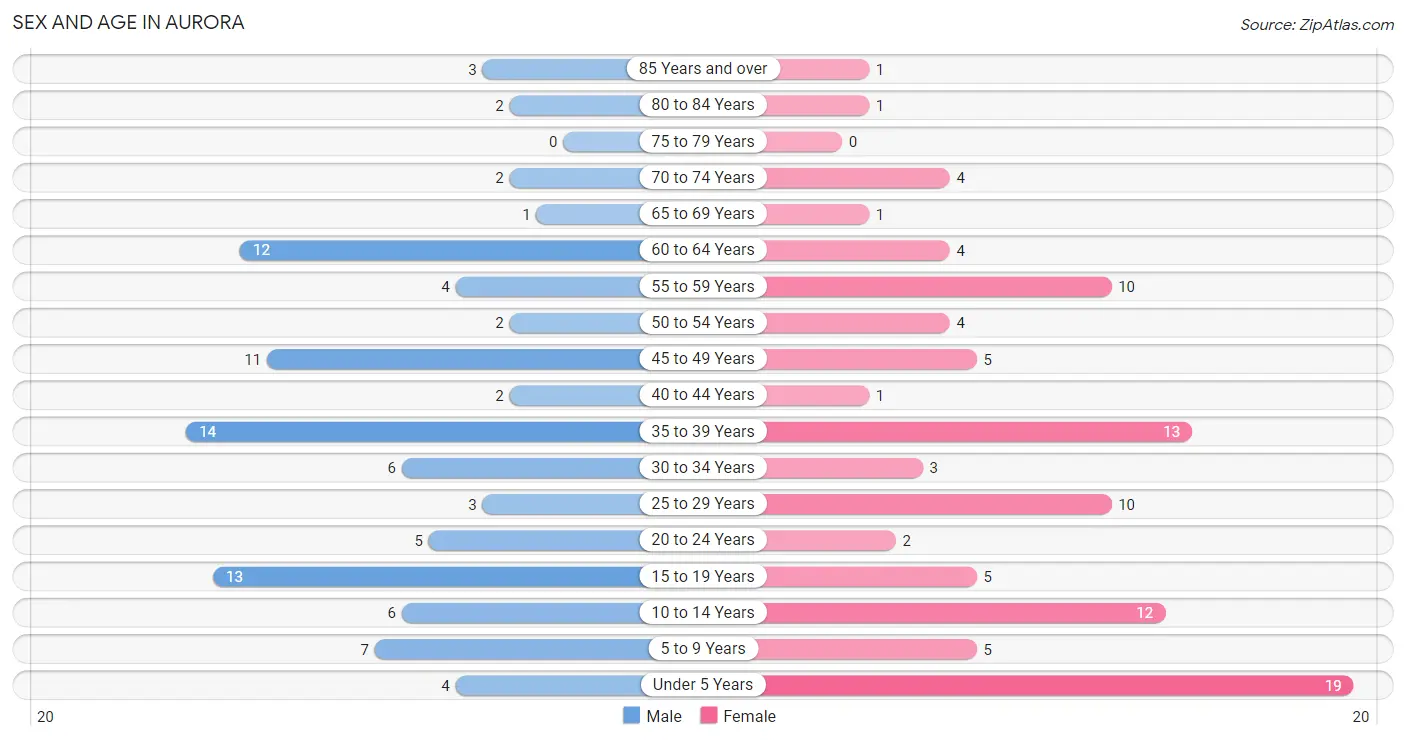
The most populous age groups in Aurora are 35 to 39 Years (14 | 14.4%) for men and Under 5 Years (19 | 19.0%) for women.
| Age Bracket | Male | Female |
| Under 5 Years | 4 (4.1%) | 19 (19.0%) |
| 5 to 9 Years | 7 (7.2%) | 5 (5.0%) |
| 10 to 14 Years | 6 (6.2%) | 12 (12.0%) |
| 15 to 19 Years | 13 (13.4%) | 5 (5.0%) |
| 20 to 24 Years | 5 (5.1%) | 2 (2.0%) |
| 25 to 29 Years | 3 (3.1%) | 10 (10.0%) |
| 30 to 34 Years | 6 (6.2%) | 3 (3.0%) |
| 35 to 39 Years | 14 (14.4%) | 13 (13.0%) |
| 40 to 44 Years | 2 (2.1%) | 1 (1.0%) |
| 45 to 49 Years | 11 (11.3%) | 5 (5.0%) |
| 50 to 54 Years | 2 (2.1%) | 4 (4.0%) |
| 55 to 59 Years | 4 (4.1%) | 10 (10.0%) |
| 60 to 64 Years | 12 (12.4%) | 4 (4.0%) |
| 65 to 69 Years | 1 (1.0%) | 1 (1.0%) |
| 70 to 74 Years | 2 (2.1%) | 4 (4.0%) |
| 75 to 79 Years | 0 (0.0%) | 0 (0.0%) |
| 80 to 84 Years | 2 (2.1%) | 1 (1.0%) |
| 85 Years and over | 3 (3.1%) | 1 (1.0%) |
| Total | 97 (100.0%) | 100 (100.0%) |
Families and Households in Aurora
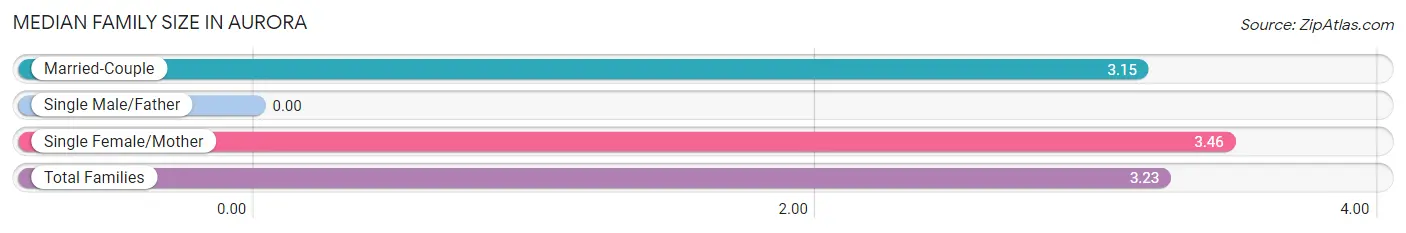
Median Family Size in Aurora
| Family Type | # Families | Family Size |
| Married-Couple | 39 (75.0%) | 3.15 |
| Single Male/Father | 0 (0.0%) | - |
| Single Female/Mother | 13 (25.0%) | 3.46 |
| Total Families | 52 (100.0%) | 3.23 |
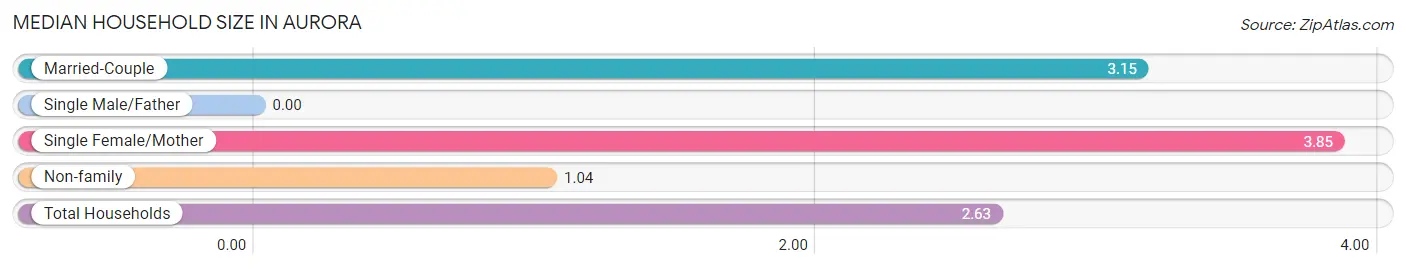
Median Household Size in Aurora
| Household Type | # Households | Household Size |
| Married-Couple | 39 (52.0%) | 3.15 |
| Single Male/Father | 0 (0.0%) | - |
| Single Female/Mother | 13 (17.3%) | 3.85 |
| Non-family | 23 (30.7%) | 1.04 |
| Total Households | 75 (100.0%) | 2.63 |
Household Size by Marriage Status in Aurora
Out of a total of 75 households in Aurora, 52 (69.3%) are family households, while 23 (30.7%) are nonfamily households. The most numerous type of family households are 2-person households, comprising 20, and the most common type of nonfamily households are 1-person households, comprising 22.
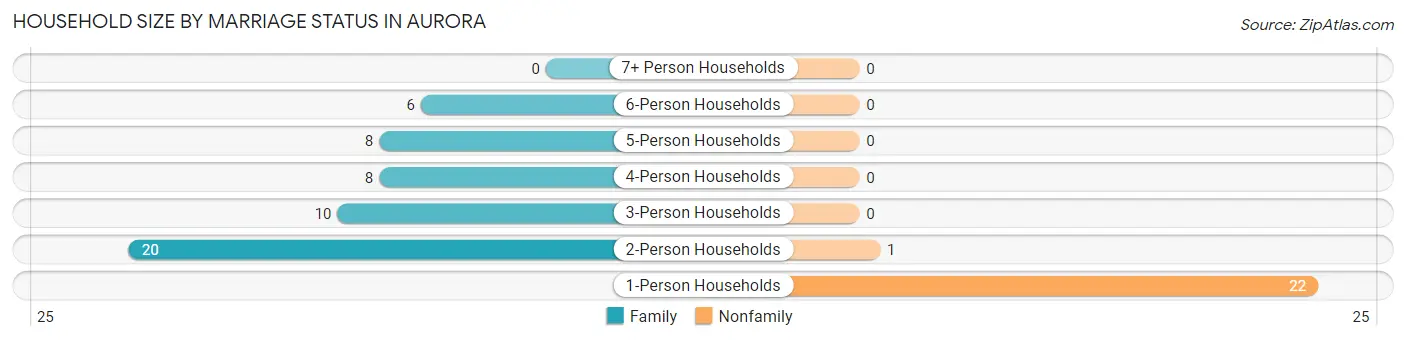
| Household Size | Family Households | Nonfamily Households |
| 1-Person Households | - | 22 (29.3%) |
| 2-Person Households | 20 (26.7%) | 1 (1.3%) |
| 3-Person Households | 10 (13.3%) | 0 (0.0%) |
| 4-Person Households | 8 (10.7%) | 0 (0.0%) |
| 5-Person Households | 8 (10.7%) | 0 (0.0%) |
| 6-Person Households | 6 (8.0%) | 0 (0.0%) |
| 7+ Person Households | 0 (0.0%) | 0 (0.0%) |
| Total | 52 (69.3%) | 23 (30.7%) |
Female Fertility in Aurora
Fertility by Age in Aurora
Average fertility rate in Aurora is 146.0 births per 1,000 women. Women in the age bracket of 20 to 34 years have the highest fertility rate with 400.0 births per 1,000 women. Women in the age bracket of 20 to 34 years acount for 100.0% of all women with births.
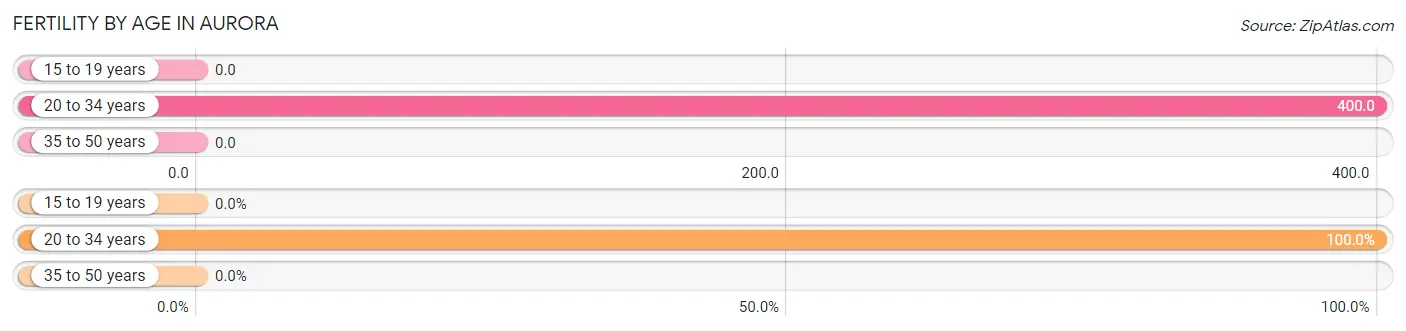
| Age Bracket | Women with Births | Births / 1,000 Women |
| 15 to 19 years | 0 (0.0%) | 0.0 |
| 20 to 34 years | 6 (100.0%) | 400.0 |
| 35 to 50 years | 0 (0.0%) | 0.0 |
| Total | 6 (100.0%) | 146.0 |
Fertility by Age by Marriage Status in Aurora
33.3% of women with births (6) in Aurora are married. The highest percentage of unmarried women with births falls into 20 to 34 years age bracket with 66.7% of them unmarried at the time of birth, while the lowest percentage of unmarried women with births belong to 20 to 34 years age bracket with 66.7% of them unmarried.
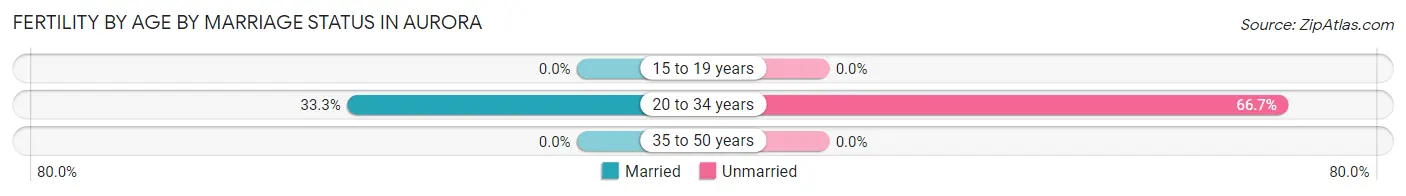
| Age Bracket | Married | Unmarried |
| 15 to 19 years | 0 (0.0%) | 0 (0.0%) |
| 20 to 34 years | 2 (33.3%) | 4 (66.7%) |
| 35 to 50 years | 0 (0.0%) | 0 (0.0%) |
| Total | 2 (33.3%) | 4 (66.7%) |
Fertility by Education in Aurora
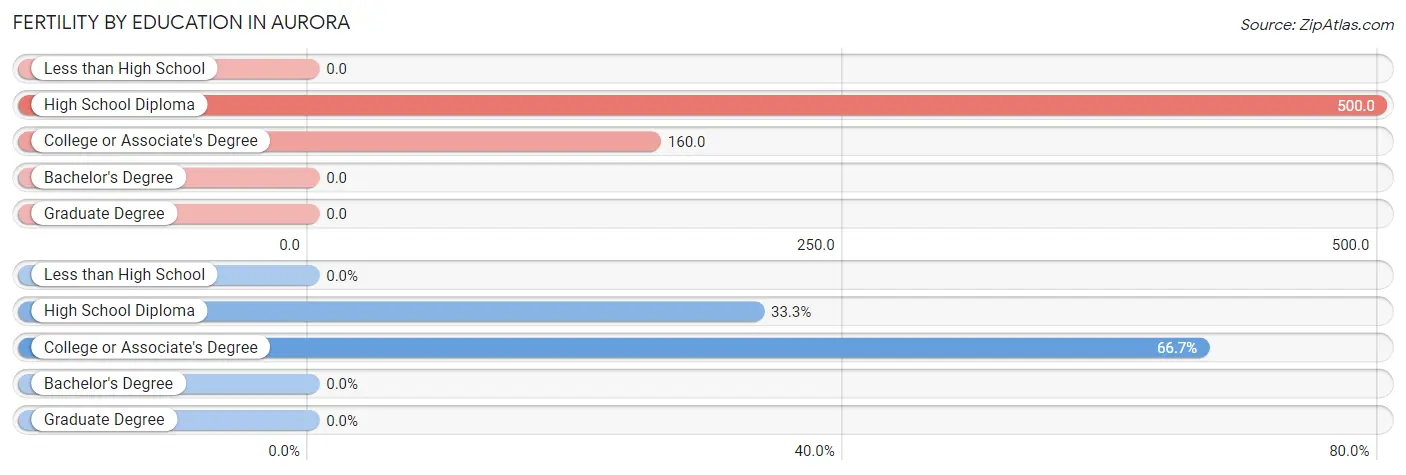
| Educational Attainment | Women with Births | Births / 1,000 Women |
| Less than High School | 0 (0.0%) | 0.0 |
| High School Diploma | 2 (33.3%) | 500.0 |
| College or Associate's Degree | 4 (66.7%) | 160.0 |
| Bachelor's Degree | 0 (0.0%) | 0.0 |
| Graduate Degree | 0 (0.0%) | 0.0 |
| Total | 6 (100.0%) | 146.0 |
Fertility by Education by Marriage Status in Aurora
66.7% of women with births in Aurora are unmarried. Women with the educational attainment of college or associate's degree are most likely to be married with 50.0% of them married at childbirth, while women with the educational attainment of high school diploma are least likely to be married with 100.0% of them unmarried at childbirth.
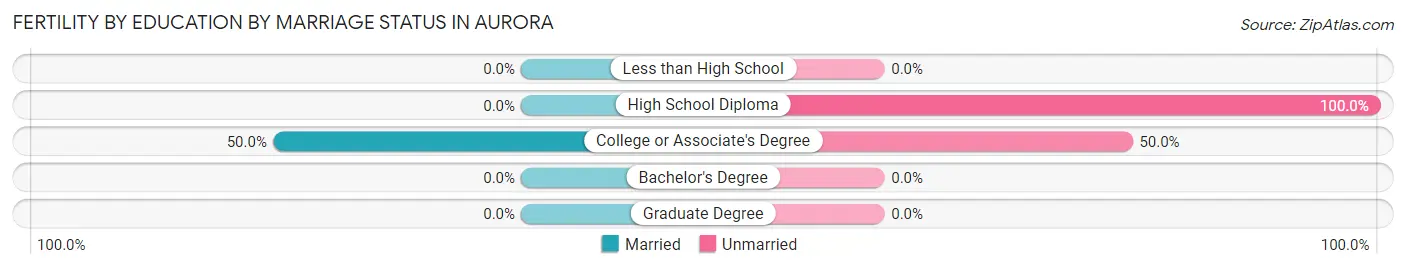
| Educational Attainment | Married | Unmarried |
| Less than High School | 0 (0.0%) | 0 (0.0%) |
| High School Diploma | 0 (0.0%) | 2 (100.0%) |
| College or Associate's Degree | 2 (50.0%) | 2 (50.0%) |
| Bachelor's Degree | 0 (0.0%) | 0 (0.0%) |
| Graduate Degree | 0 (0.0%) | 0 (0.0%) |
| Total | 2 (33.3%) | 4 (66.7%) |
Employment Characteristics in Aurora
Employment by Class of Employer in Aurora
Among the 99 employed individuals in Aurora, private company employees (72 | 72.7%), self-employed (not incorporated) (11 | 11.1%), and self-employed (incorporated) (6 | 6.1%) make up the most common classes of employment.
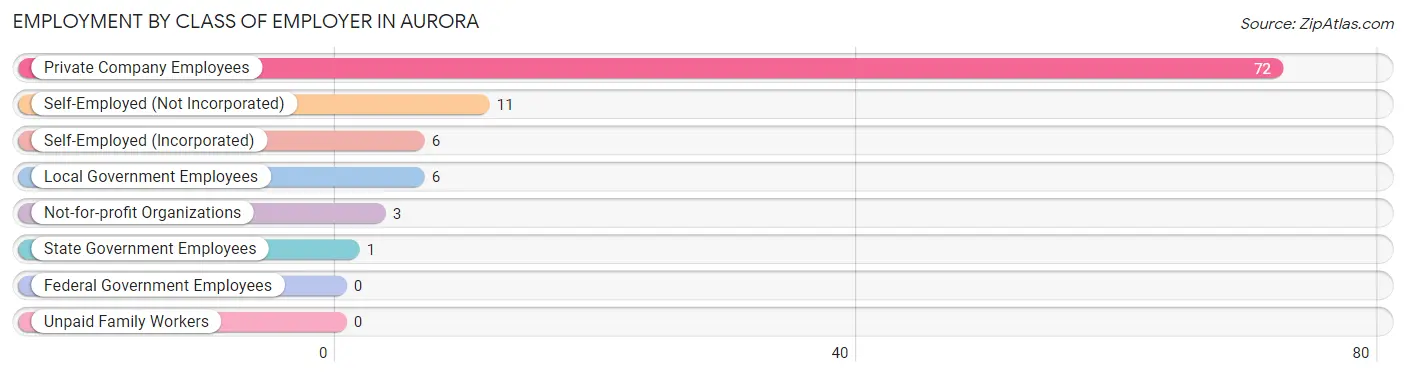
| Employer Class | # Employees | % Employees |
| Private Company Employees | 72 | 72.7% |
| Self-Employed (Incorporated) | 6 | 6.1% |
| Self-Employed (Not Incorporated) | 11 | 11.1% |
| Not-for-profit Organizations | 3 | 3.0% |
| Local Government Employees | 6 | 6.1% |
| State Government Employees | 1 | 1.0% |
| Federal Government Employees | 0 | 0.0% |
| Unpaid Family Workers | 0 | 0.0% |
| Total | 99 | 100.0% |
Employment Status by Age in Aurora
According to the labor force statistics for Aurora, out of the total population over 16 years of age (141), 75.2% or 106 individuals are in the labor force, with 6.6% or 7 of them unemployed. The age group with the highest labor force participation rate is 25 to 29 years, with 100.0% or 13 individuals in the labor force. Within the labor force, the 16 to 19 years age range has the highest percentage of unemployed individuals, with 25.0% or 1 of them being unemployed.
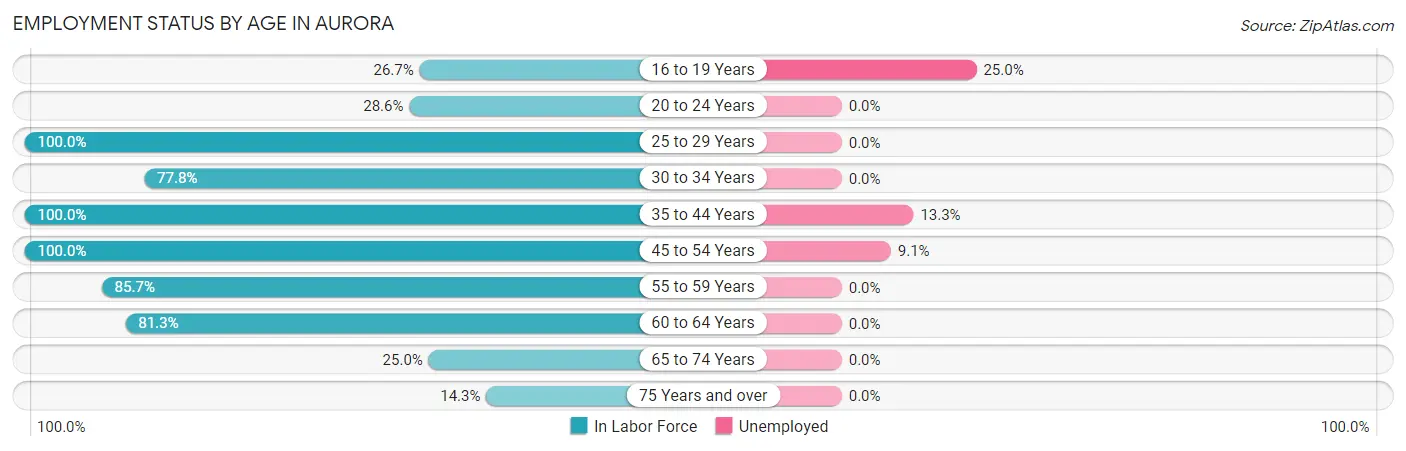
| Age Bracket | In Labor Force | Unemployed |
| 16 to 19 Years | 4 (26.7%) | 1 (25.0%) |
| 20 to 24 Years | 2 (28.6%) | 0 (0.0%) |
| 25 to 29 Years | 13 (100.0%) | 0 (0.0%) |
| 30 to 34 Years | 7 (77.8%) | 0 (0.0%) |
| 35 to 44 Years | 30 (100.0%) | 4 (13.3%) |
| 45 to 54 Years | 22 (100.0%) | 2 (9.1%) |
| 55 to 59 Years | 12 (85.7%) | 0 (0.0%) |
| 60 to 64 Years | 13 (81.3%) | 0 (0.0%) |
| 65 to 74 Years | 2 (25.0%) | 0 (0.0%) |
| 75 Years and over | 1 (14.3%) | 0 (0.0%) |
| Total | 106 (75.2%) | 7 (6.6%) |
Employment Status by Educational Attainment in Aurora
According to labor force statistics for Aurora, 93.3% of individuals (97) out of the total population between 25 and 64 years of age (104) are in the labor force, with 6.2% or 6 of them being unemployed. The group with the highest labor force participation rate are those with the educational attainment of less than high school, with 100.0% or 1 individuals in the labor force. Within the labor force, individuals with college / associate degree education have the highest percentage of unemployment, with 8.2% or 4 of them being unemployed.
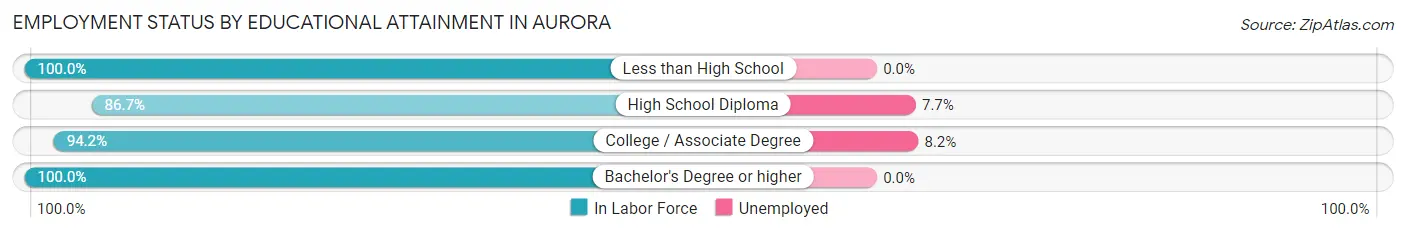
| Educational Attainment | In Labor Force | Unemployed |
| Less than High School | 1 (100.0%) | 0 (0.0%) |
| High School Diploma | 26 (86.7%) | 2 (7.7%) |
| College / Associate Degree | 49 (94.2%) | 4 (8.2%) |
| Bachelor's Degree or higher | 21 (100.0%) | 0 (0.0%) |
| Total | 97 (93.3%) | 6 (6.2%) |
Employment Occupations by Sex in Aurora
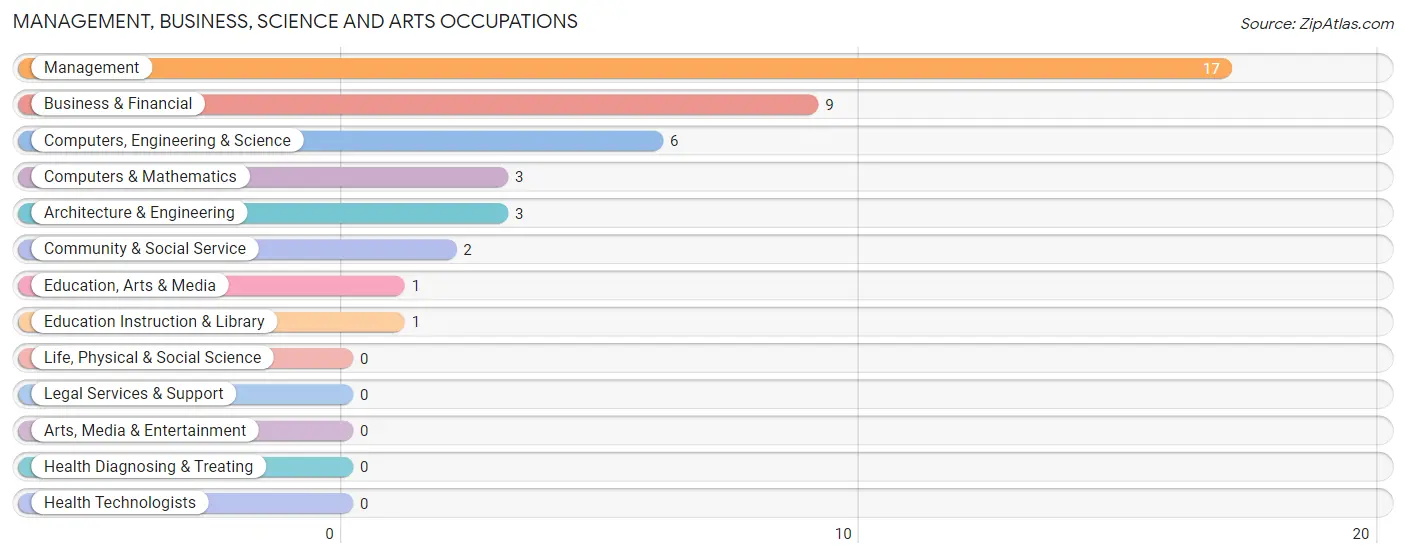
Management, Business, Science and Arts Occupations
The most common Management, Business, Science and Arts occupations in Aurora are Management (17 | 17.2%), Business & Financial (9 | 9.1%), Computers, Engineering & Science (6 | 6.1%), Computers & Mathematics (3 | 3.0%), and Architecture & Engineering (3 | 3.0%).
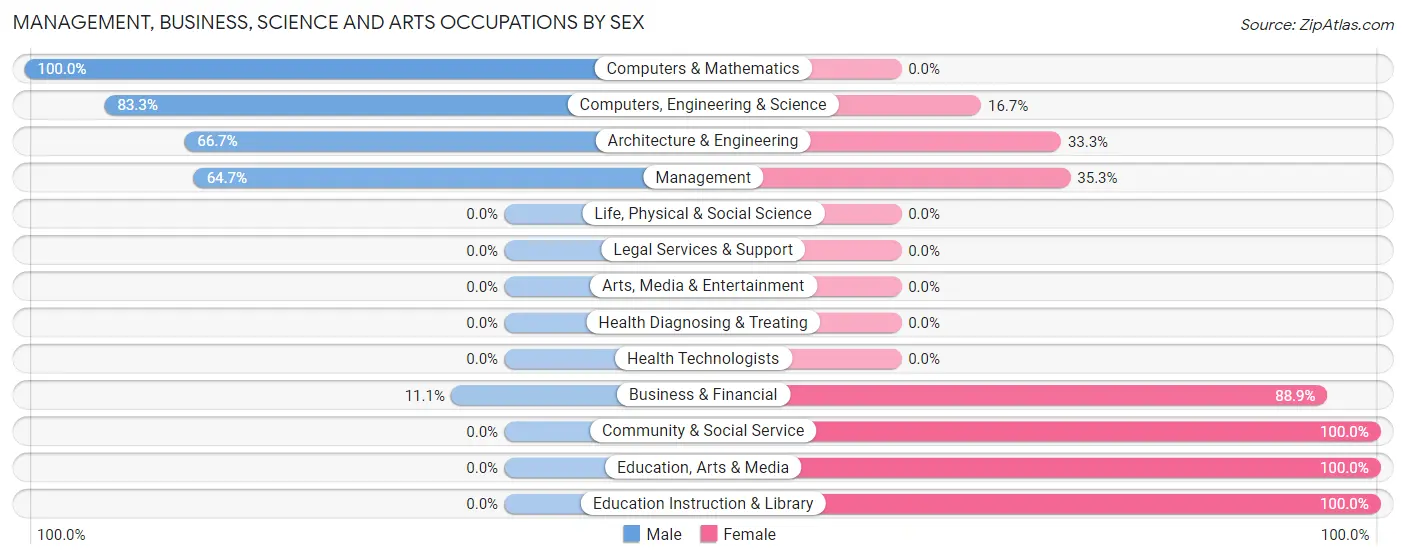
Management, Business, Science and Arts Occupations by Sex
Within the Management, Business, Science and Arts occupations in Aurora, the most male-oriented occupations are Computers & Mathematics (100.0%), Computers, Engineering & Science (83.3%), and Architecture & Engineering (66.7%), while the most female-oriented occupations are Community & Social Service (100.0%), Education, Arts & Media (100.0%), and Education Instruction & Library (100.0%).
| Occupation | Male | Female |
| Management | 11 (64.7%) | 6 (35.3%) |
| Business & Financial | 1 (11.1%) | 8 (88.9%) |
| Computers, Engineering & Science | 5 (83.3%) | 1 (16.7%) |
| Computers & Mathematics | 3 (100.0%) | 0 (0.0%) |
| Architecture & Engineering | 2 (66.7%) | 1 (33.3%) |
| Life, Physical & Social Science | 0 (0.0%) | 0 (0.0%) |
| Community & Social Service | 0 (0.0%) | 2 (100.0%) |
| Education, Arts & Media | 0 (0.0%) | 1 (100.0%) |
| Legal Services & Support | 0 (0.0%) | 0 (0.0%) |
| Education Instruction & Library | 0 (0.0%) | 1 (100.0%) |
| Arts, Media & Entertainment | 0 (0.0%) | 0 (0.0%) |
| Health Diagnosing & Treating | 0 (0.0%) | 0 (0.0%) |
| Health Technologists | 0 (0.0%) | 0 (0.0%) |
| Total (Category) | 17 (50.0%) | 17 (50.0%) |
| Total (Overall) | 58 (58.6%) | 41 (41.4%) |
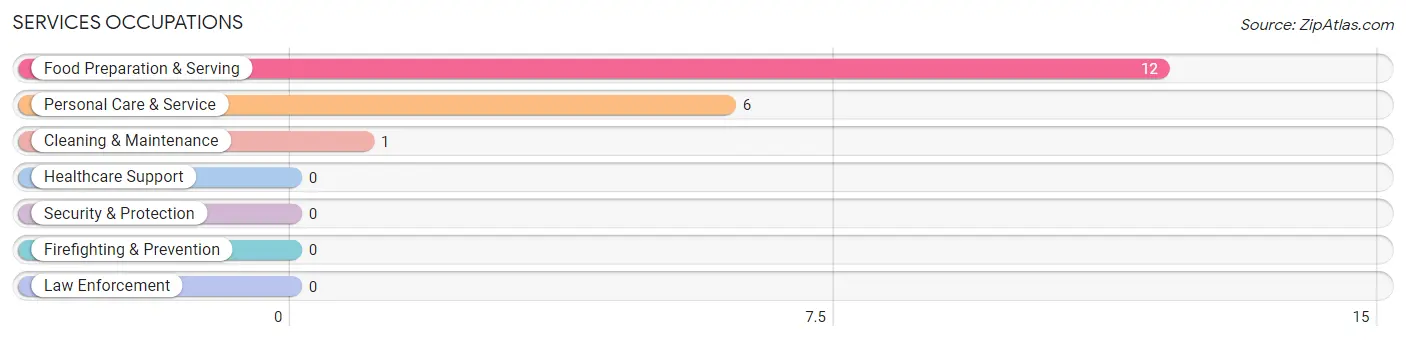
Services Occupations
The most common Services occupations in Aurora are Food Preparation & Serving (12 | 12.1%), Personal Care & Service (6 | 6.1%), and Cleaning & Maintenance (1 | 1.0%).
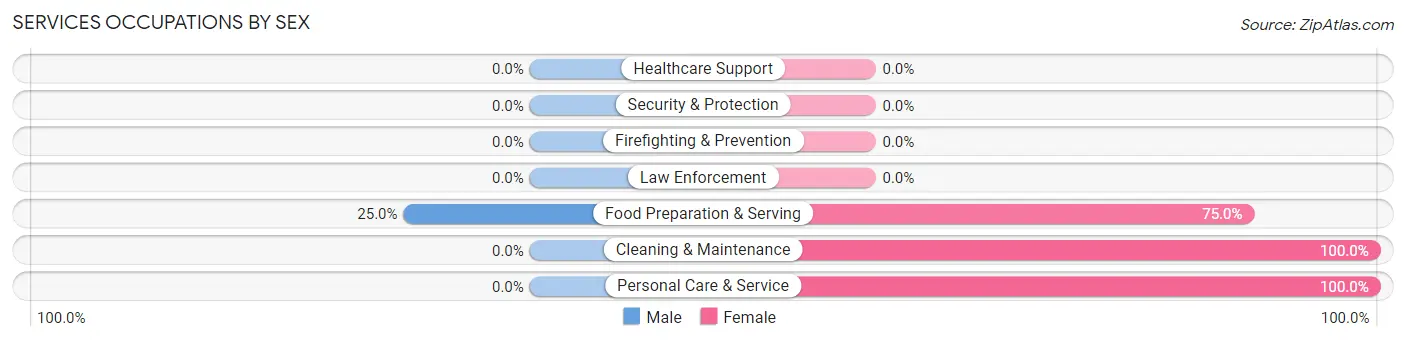
Services Occupations by Sex
| Occupation | Male | Female |
| Healthcare Support | 0 (0.0%) | 0 (0.0%) |
| Security & Protection | 0 (0.0%) | 0 (0.0%) |
| Firefighting & Prevention | 0 (0.0%) | 0 (0.0%) |
| Law Enforcement | 0 (0.0%) | 0 (0.0%) |
| Food Preparation & Serving | 3 (25.0%) | 9 (75.0%) |
| Cleaning & Maintenance | 0 (0.0%) | 1 (100.0%) |
| Personal Care & Service | 0 (0.0%) | 6 (100.0%) |
| Total (Category) | 3 (15.8%) | 16 (84.2%) |
| Total (Overall) | 58 (58.6%) | 41 (41.4%) |
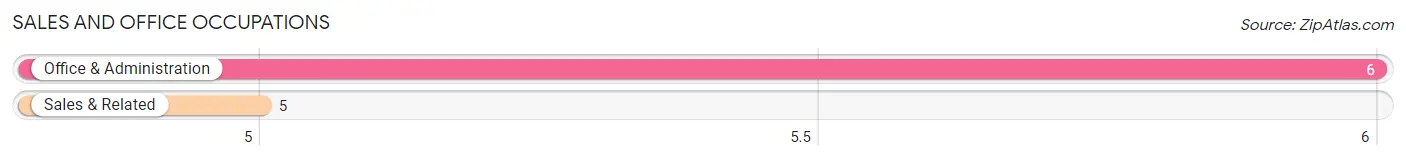
Sales and Office Occupations
The most common Sales and Office occupations in Aurora are Office & Administration (6 | 6.1%), and Sales & Related (5 | 5.1%).
Sales and Office Occupations by Sex
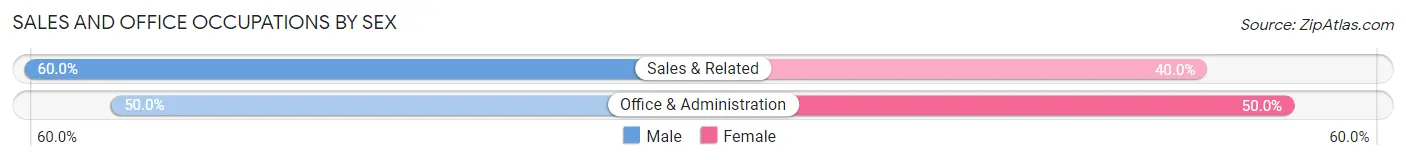
| Occupation | Male | Female |
| Sales & Related | 3 (60.0%) | 2 (40.0%) |
| Office & Administration | 3 (50.0%) | 3 (50.0%) |
| Total (Category) | 6 (54.5%) | 5 (45.5%) |
| Total (Overall) | 58 (58.6%) | 41 (41.4%) |
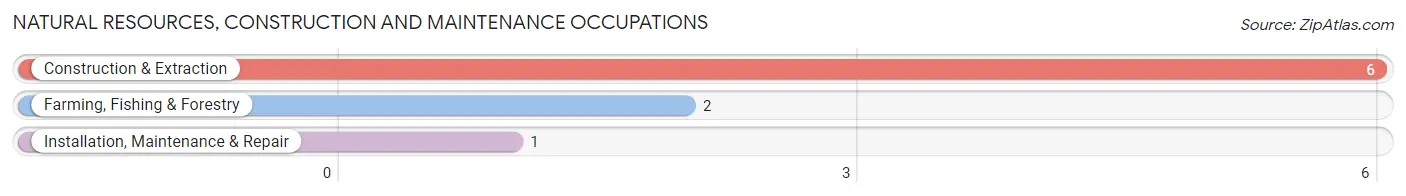
Natural Resources, Construction and Maintenance Occupations
The most common Natural Resources, Construction and Maintenance occupations in Aurora are Construction & Extraction (6 | 6.1%), Farming, Fishing & Forestry (2 | 2.0%), and Installation, Maintenance & Repair (1 | 1.0%).
Natural Resources, Construction and Maintenance Occupations by Sex
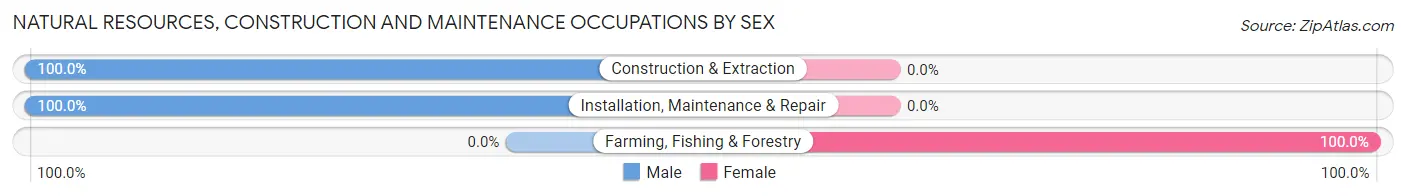
| Occupation | Male | Female |
| Farming, Fishing & Forestry | 0 (0.0%) | 2 (100.0%) |
| Construction & Extraction | 6 (100.0%) | 0 (0.0%) |
| Installation, Maintenance & Repair | 1 (100.0%) | 0 (0.0%) |
| Total (Category) | 7 (77.8%) | 2 (22.2%) |
| Total (Overall) | 58 (58.6%) | 41 (41.4%) |
Production, Transportation and Moving Occupations
The most common Production, Transportation and Moving occupations in Aurora are Production (15 | 15.1%), and Transportation (11 | 11.1%).
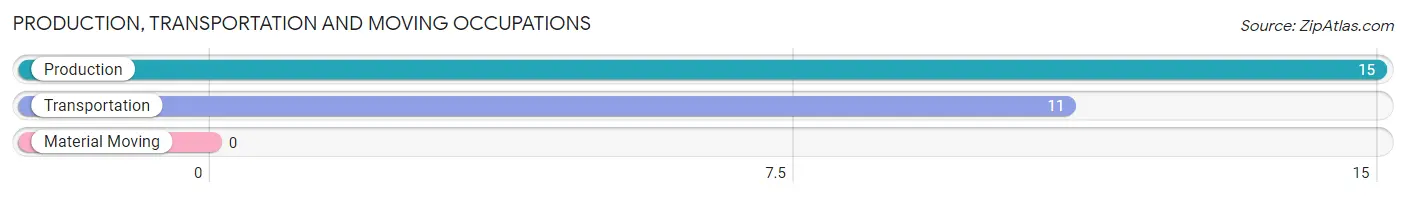
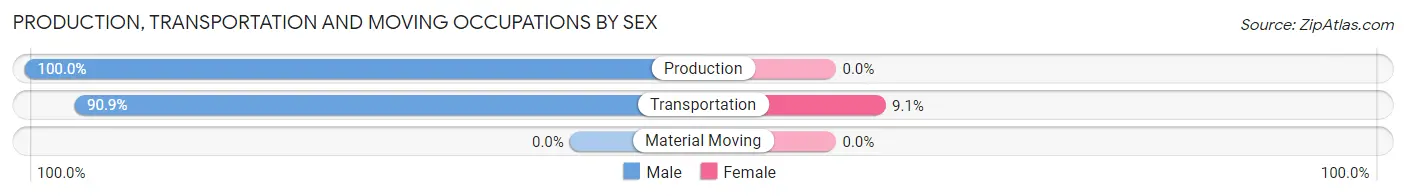
Production, Transportation and Moving Occupations by Sex
| Occupation | Male | Female |
| Production | 15 (100.0%) | 0 (0.0%) |
| Transportation | 10 (90.9%) | 1 (9.1%) |
| Material Moving | 0 (0.0%) | 0 (0.0%) |
| Total (Category) | 25 (96.2%) | 1 (3.8%) |
| Total (Overall) | 58 (58.6%) | 41 (41.4%) |
Employment Industries by Sex in Aurora
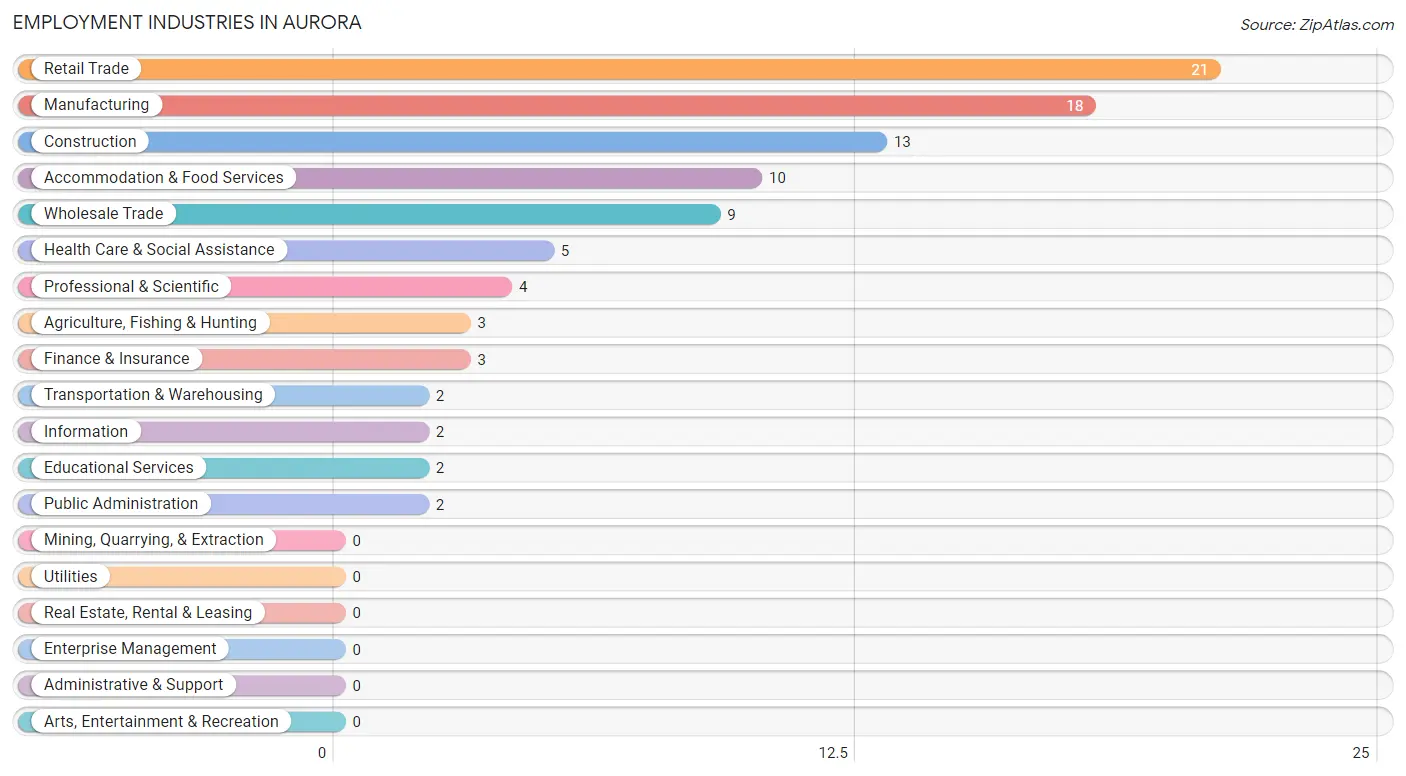
Employment Industries in Aurora
The major employment industries in Aurora include Retail Trade (21 | 21.2%), Manufacturing (18 | 18.2%), Construction (13 | 13.1%), Accommodation & Food Services (10 | 10.1%), and Wholesale Trade (9 | 9.1%).
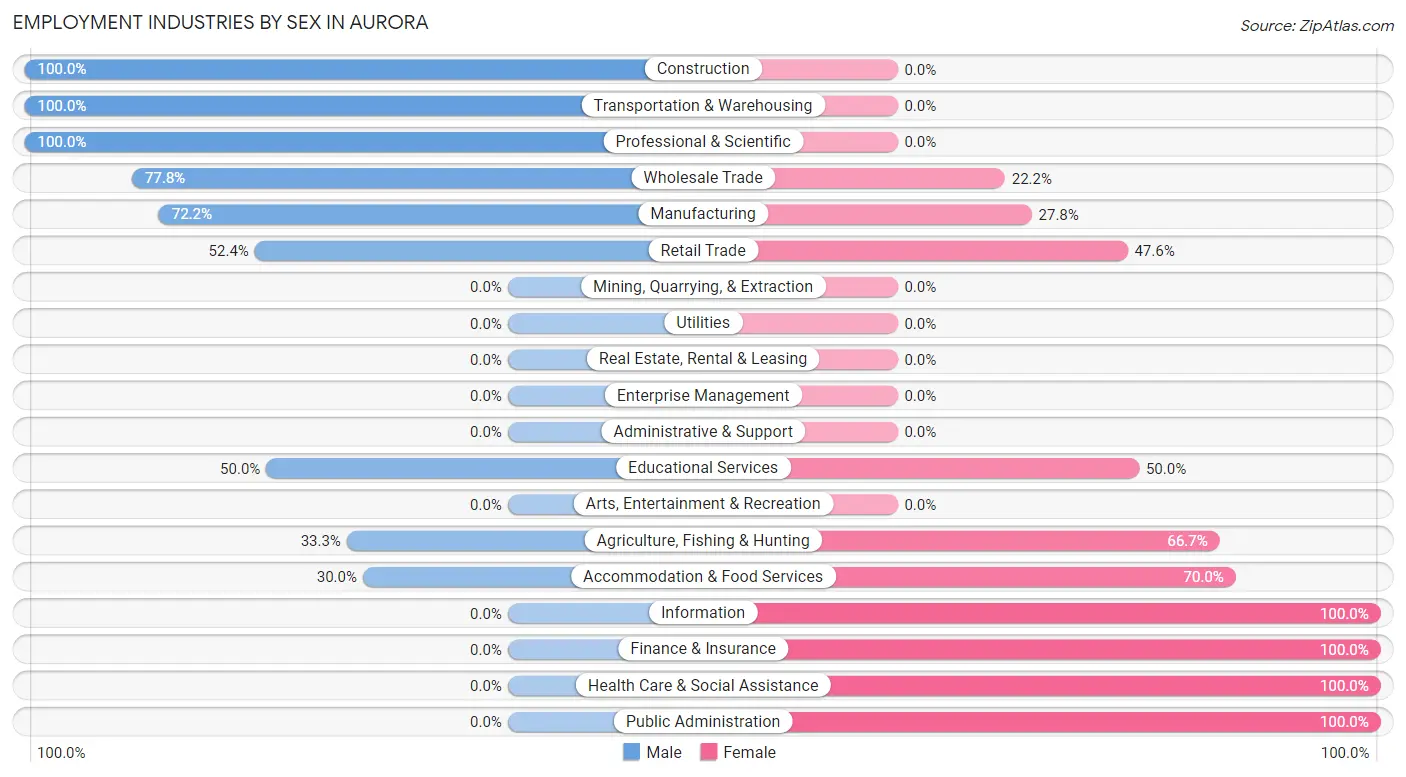
Employment Industries by Sex in Aurora
The Aurora industries that see more men than women are Construction (100.0%), Transportation & Warehousing (100.0%), and Professional & Scientific (100.0%), whereas the industries that tend to have a higher number of women are Information (100.0%), Finance & Insurance (100.0%), and Health Care & Social Assistance (100.0%).
| Industry | Male | Female |
| Agriculture, Fishing & Hunting | 1 (33.3%) | 2 (66.7%) |
| Mining, Quarrying, & Extraction | 0 (0.0%) | 0 (0.0%) |
| Construction | 13 (100.0%) | 0 (0.0%) |
| Manufacturing | 13 (72.2%) | 5 (27.8%) |
| Wholesale Trade | 7 (77.8%) | 2 (22.2%) |
| Retail Trade | 11 (52.4%) | 10 (47.6%) |
| Transportation & Warehousing | 2 (100.0%) | 0 (0.0%) |
| Utilities | 0 (0.0%) | 0 (0.0%) |
| Information | 0 (0.0%) | 2 (100.0%) |
| Finance & Insurance | 0 (0.0%) | 3 (100.0%) |
| Real Estate, Rental & Leasing | 0 (0.0%) | 0 (0.0%) |
| Professional & Scientific | 4 (100.0%) | 0 (0.0%) |
| Enterprise Management | 0 (0.0%) | 0 (0.0%) |
| Administrative & Support | 0 (0.0%) | 0 (0.0%) |
| Educational Services | 1 (50.0%) | 1 (50.0%) |
| Health Care & Social Assistance | 0 (0.0%) | 5 (100.0%) |
| Arts, Entertainment & Recreation | 0 (0.0%) | 0 (0.0%) |
| Accommodation & Food Services | 3 (30.0%) | 7 (70.0%) |
| Public Administration | 0 (0.0%) | 2 (100.0%) |
| Total | 58 (58.6%) | 41 (41.4%) |
Education in Aurora
School Enrollment in Aurora
The most common levels of schooling among the 53 students in Aurora are middle school (17 | 32.1%), high school (15 | 28.3%), and elementary school (11 | 20.7%).
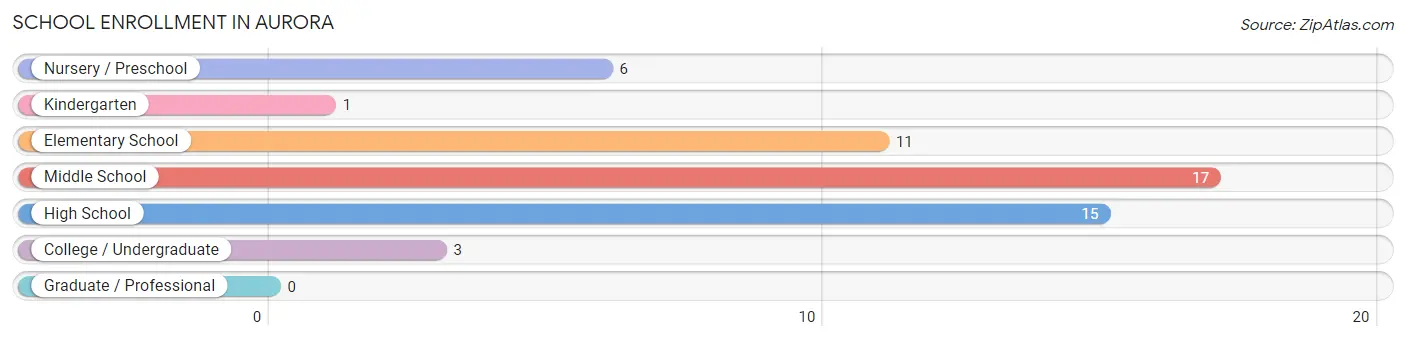
| School Level | # Students | % Students |
| Nursery / Preschool | 6 | 11.3% |
| Kindergarten | 1 | 1.9% |
| Elementary School | 11 | 20.7% |
| Middle School | 17 | 32.1% |
| High School | 15 | 28.3% |
| College / Undergraduate | 3 | 5.7% |
| Graduate / Professional | 0 | 0.0% |
| Total | 53 | 100.0% |
School Enrollment by Age by Funding Source in Aurora
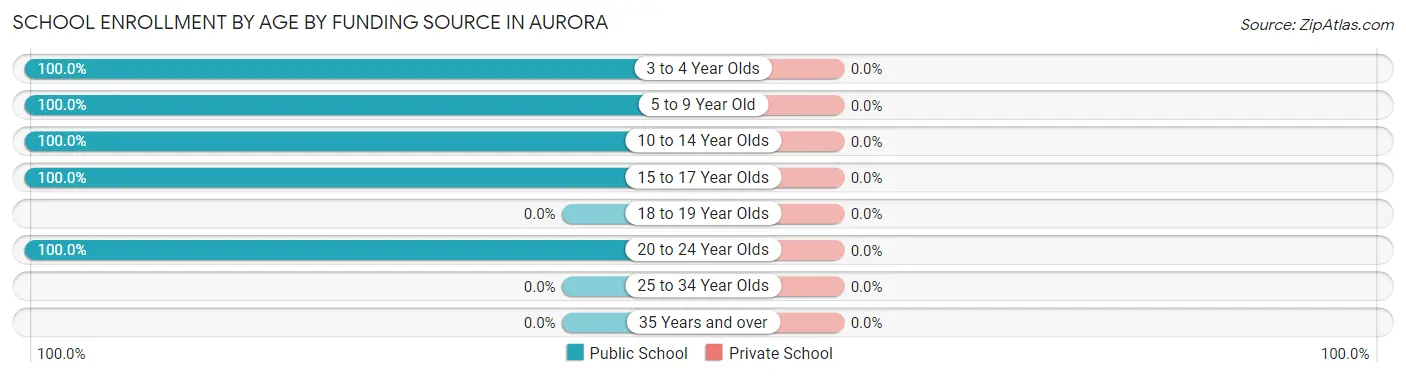
| Age Bracket | Public School | Private School |
| 3 to 4 Year Olds | 5 (100.0%) | 0 (0.0%) |
| 5 to 9 Year Old | 12 (100.0%) | 0 (0.0%) |
| 10 to 14 Year Olds | 18 (100.0%) | 0 (0.0%) |
| 15 to 17 Year Olds | 15 (100.0%) | 0 (0.0%) |
| 18 to 19 Year Olds | 0 (0.0%) | 0 (0.0%) |
| 20 to 24 Year Olds | 3 (100.0%) | 0 (0.0%) |
| 25 to 34 Year Olds | 0 (0.0%) | 0 (0.0%) |
| 35 Years and over | 0 (0.0%) | 0 (0.0%) |
| Total | 53 (100.0%) | 0 (0.0%) |
Educational Attainment by Field of Study in Aurora
Business (10 | 47.6%), science & technology (3 | 14.3%), education (3 | 14.3%), arts & humanities (3 | 14.3%), and bio, nature & agricultural (1 | 4.8%) are the most common fields of study among 21 individuals in Aurora who have obtained a bachelor's degree or higher.
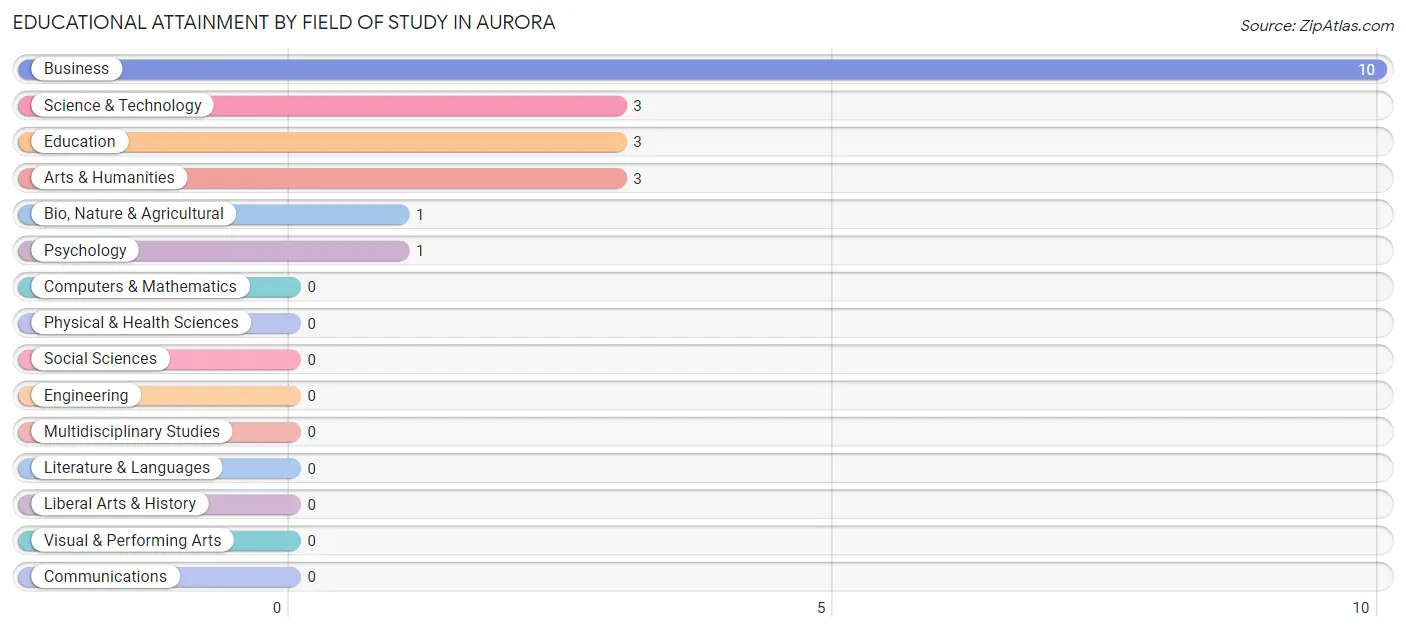
| Field of Study | # Graduates | % Graduates |
| Computers & Mathematics | 0 | 0.0% |
| Bio, Nature & Agricultural | 1 | 4.8% |
| Physical & Health Sciences | 0 | 0.0% |
| Psychology | 1 | 4.8% |
| Social Sciences | 0 | 0.0% |
| Engineering | 0 | 0.0% |
| Multidisciplinary Studies | 0 | 0.0% |
| Science & Technology | 3 | 14.3% |
| Business | 10 | 47.6% |
| Education | 3 | 14.3% |
| Literature & Languages | 0 | 0.0% |
| Liberal Arts & History | 0 | 0.0% |
| Visual & Performing Arts | 0 | 0.0% |
| Communications | 0 | 0.0% |
| Arts & Humanities | 3 | 14.3% |
| Total | 21 | 100.0% |
Transportation & Commute in Aurora
Vehicle Availability by Sex in Aurora
The most prevalent vehicle ownership categories in Aurora are males with 2 vehicles (35, accounting for 60.3%) and females with 2 vehicles (19, making up 85.4%).
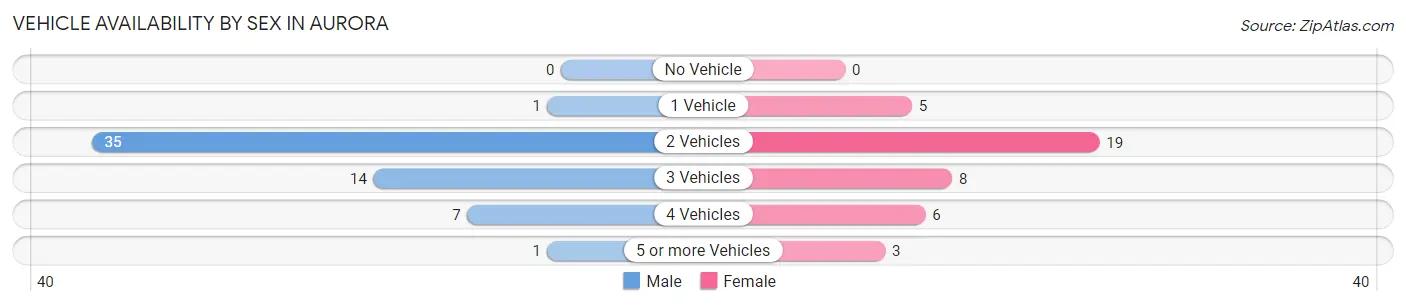
| Vehicles Available | Male | Female |
| No Vehicle | 0 (0.0%) | 0 (0.0%) |
| 1 Vehicle | 1 (1.7%) | 5 (12.2%) |
| 2 Vehicles | 35 (60.3%) | 19 (46.3%) |
| 3 Vehicles | 14 (24.1%) | 8 (19.5%) |
| 4 Vehicles | 7 (12.1%) | 6 (14.6%) |
| 5 or more Vehicles | 1 (1.7%) | 3 (7.3%) |
| Total | 58 (100.0%) | 41 (100.0%) |
Commute Time in Aurora
The most frequently occuring commute durations in Aurora are less than 5 minutes (21 commuters, 23.1%), 15 to 19 minutes (17 commuters, 18.7%), and 60 to 89 minutes (14 commuters, 15.4%).
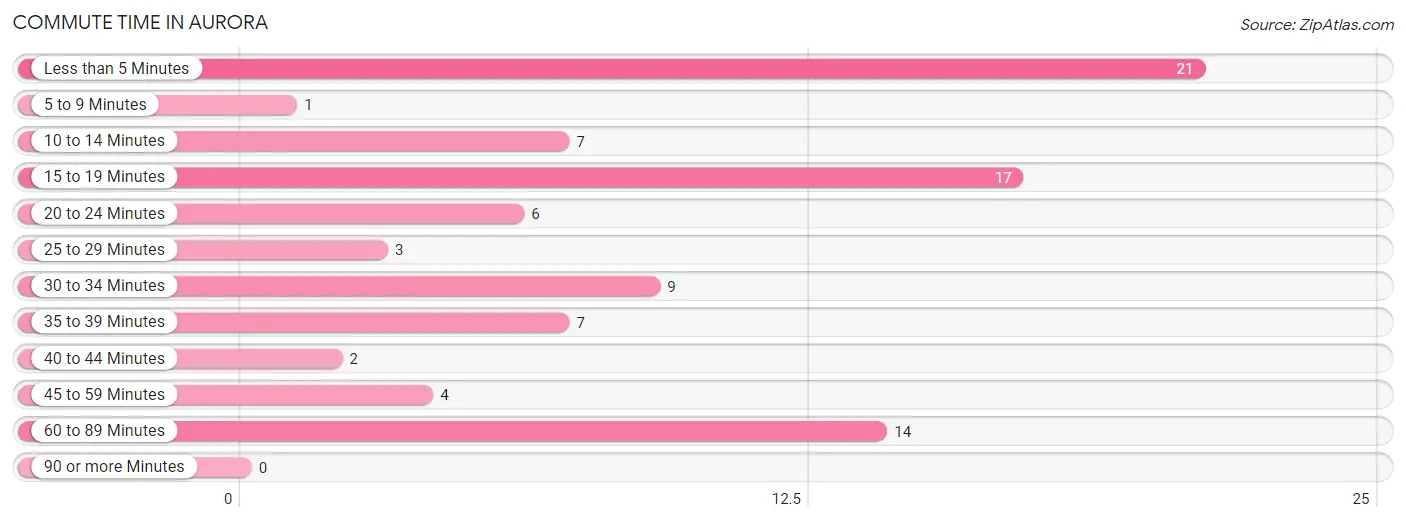
| Commute Time | # Commuters | % Commuters |
| Less than 5 Minutes | 21 | 23.1% |
| 5 to 9 Minutes | 1 | 1.1% |
| 10 to 14 Minutes | 7 | 7.7% |
| 15 to 19 Minutes | 17 | 18.7% |
| 20 to 24 Minutes | 6 | 6.6% |
| 25 to 29 Minutes | 3 | 3.3% |
| 30 to 34 Minutes | 9 | 9.9% |
| 35 to 39 Minutes | 7 | 7.7% |
| 40 to 44 Minutes | 2 | 2.2% |
| 45 to 59 Minutes | 4 | 4.4% |
| 60 to 89 Minutes | 14 | 15.4% |
| 90 or more Minutes | 0 | 0.0% |
Commute Time by Sex in Aurora
The most common commute times in Aurora are less than 5 minutes (16 commuters, 29.1%) for males and 60 to 89 minutes (14 commuters, 38.9%) for females.
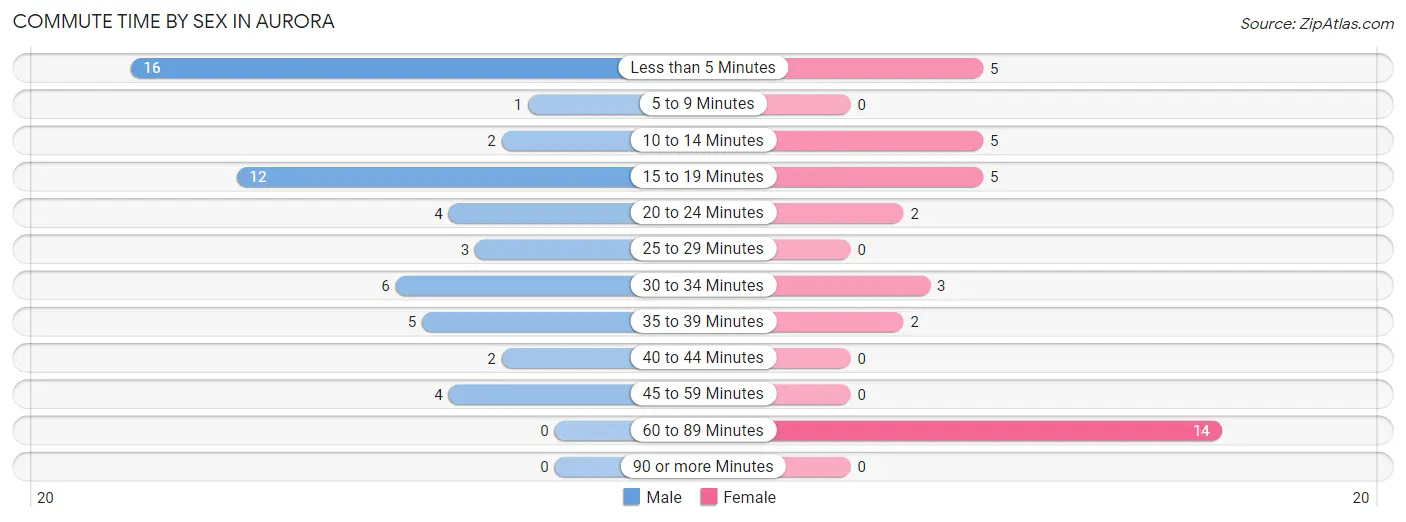
| Commute Time | Male | Female |
| Less than 5 Minutes | 16 (29.1%) | 5 (13.9%) |
| 5 to 9 Minutes | 1 (1.8%) | 0 (0.0%) |
| 10 to 14 Minutes | 2 (3.6%) | 5 (13.9%) |
| 15 to 19 Minutes | 12 (21.8%) | 5 (13.9%) |
| 20 to 24 Minutes | 4 (7.3%) | 2 (5.6%) |
| 25 to 29 Minutes | 3 (5.4%) | 0 (0.0%) |
| 30 to 34 Minutes | 6 (10.9%) | 3 (8.3%) |
| 35 to 39 Minutes | 5 (9.1%) | 2 (5.6%) |
| 40 to 44 Minutes | 2 (3.6%) | 0 (0.0%) |
| 45 to 59 Minutes | 4 (7.3%) | 0 (0.0%) |
| 60 to 89 Minutes | 0 (0.0%) | 14 (38.9%) |
| 90 or more Minutes | 0 (0.0%) | 0 (0.0%) |
Time of Departure to Work by Sex in Aurora
The most frequent times of departure to work in Aurora are 5:30 AM to 5:59 AM (13, 23.6%) for males and 7:00 AM to 7:29 AM (8, 22.2%) for females.
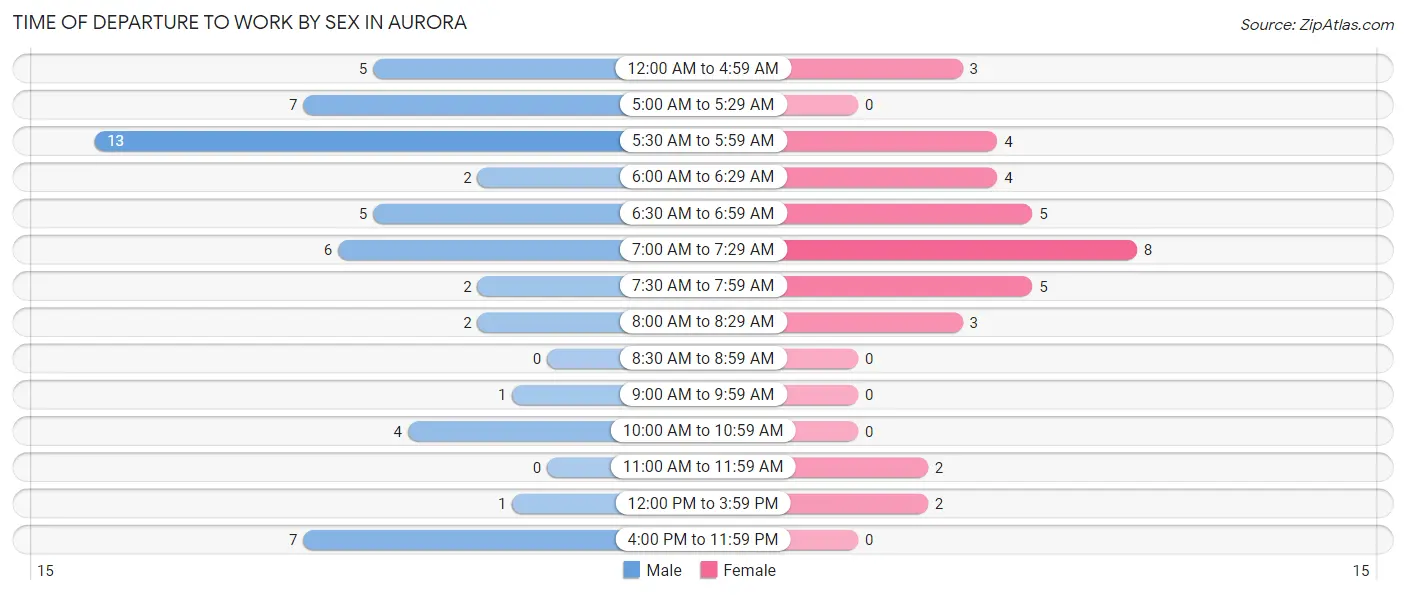
| Time of Departure | Male | Female |
| 12:00 AM to 4:59 AM | 5 (9.1%) | 3 (8.3%) |
| 5:00 AM to 5:29 AM | 7 (12.7%) | 0 (0.0%) |
| 5:30 AM to 5:59 AM | 13 (23.6%) | 4 (11.1%) |
| 6:00 AM to 6:29 AM | 2 (3.6%) | 4 (11.1%) |
| 6:30 AM to 6:59 AM | 5 (9.1%) | 5 (13.9%) |
| 7:00 AM to 7:29 AM | 6 (10.9%) | 8 (22.2%) |
| 7:30 AM to 7:59 AM | 2 (3.6%) | 5 (13.9%) |
| 8:00 AM to 8:29 AM | 2 (3.6%) | 3 (8.3%) |
| 8:30 AM to 8:59 AM | 0 (0.0%) | 0 (0.0%) |
| 9:00 AM to 9:59 AM | 1 (1.8%) | 0 (0.0%) |
| 10:00 AM to 10:59 AM | 4 (7.3%) | 0 (0.0%) |
| 11:00 AM to 11:59 AM | 0 (0.0%) | 2 (5.6%) |
| 12:00 PM to 3:59 PM | 1 (1.8%) | 2 (5.6%) |
| 4:00 PM to 11:59 PM | 7 (12.7%) | 0 (0.0%) |
| Total | 55 (100.0%) | 36 (100.0%) |
Housing Occupancy in Aurora
Occupancy by Ownership in Aurora
Of the total 75 dwellings in Aurora, owner-occupied units account for 71 (94.7%), while renter-occupied units make up 4 (5.3%).
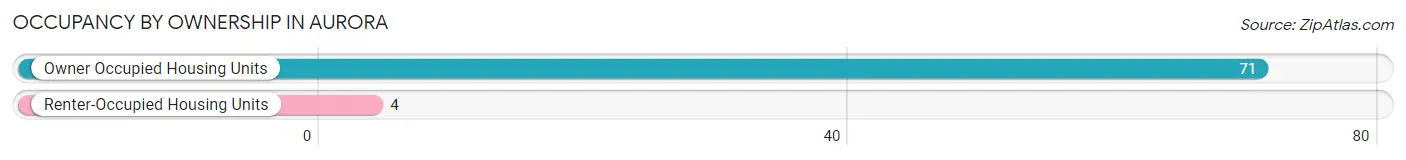
| Occupancy | # Housing Units | % Housing Units |
| Owner Occupied Housing Units | 71 | 94.7% |
| Renter-Occupied Housing Units | 4 | 5.3% |
| Total Occupied Housing Units | 75 | 100.0% |
Occupancy by Household Size in Aurora
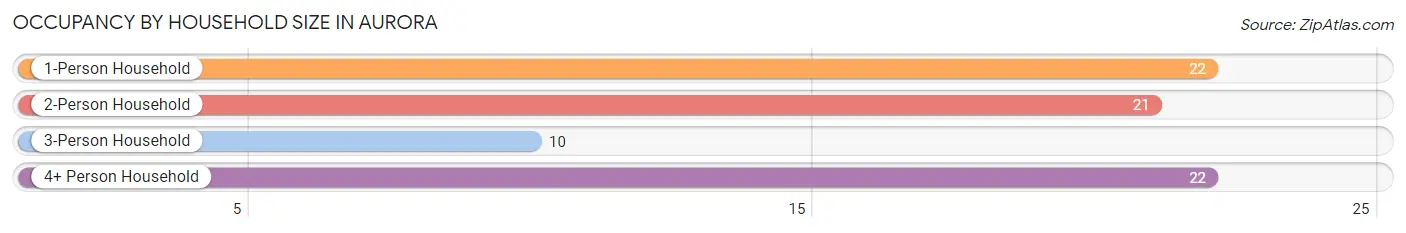
| Household Size | # Housing Units | % Housing Units |
| 1-Person Household | 22 | 29.3% |
| 2-Person Household | 21 | 28.0% |
| 3-Person Household | 10 | 13.3% |
| 4+ Person Household | 22 | 29.3% |
| Total Housing Units | 75 | 100.0% |
Occupancy by Ownership by Household Size in Aurora
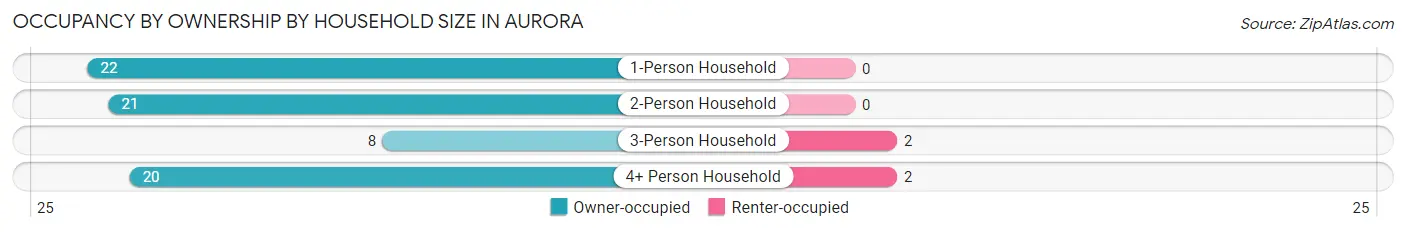
| Household Size | Owner-occupied | Renter-occupied |
| 1-Person Household | 22 (100.0%) | 0 (0.0%) |
| 2-Person Household | 21 (100.0%) | 0 (0.0%) |
| 3-Person Household | 8 (80.0%) | 2 (20.0%) |
| 4+ Person Household | 20 (90.9%) | 2 (9.1%) |
| Total Housing Units | 71 (94.7%) | 4 (5.3%) |
Occupancy by Educational Attainment in Aurora
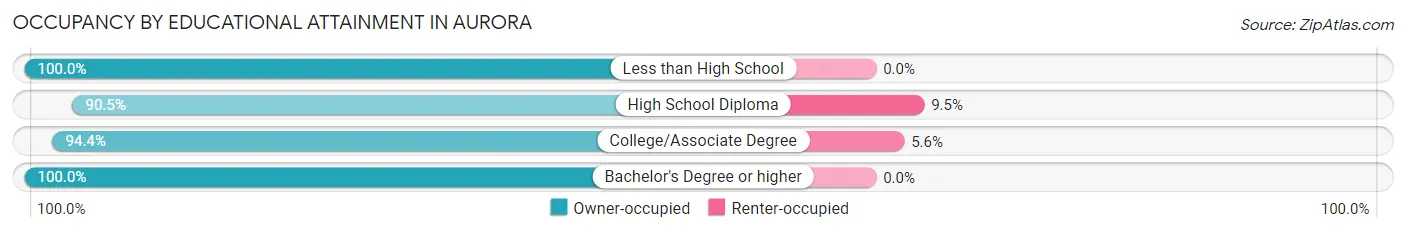
| Household Size | Owner-occupied | Renter-occupied |
| Less than High School | 5 (100.0%) | 0 (0.0%) |
| High School Diploma | 19 (90.5%) | 2 (9.5%) |
| College/Associate Degree | 34 (94.4%) | 2 (5.6%) |
| Bachelor's Degree or higher | 13 (100.0%) | 0 (0.0%) |
Occupancy by Age of Householder in Aurora
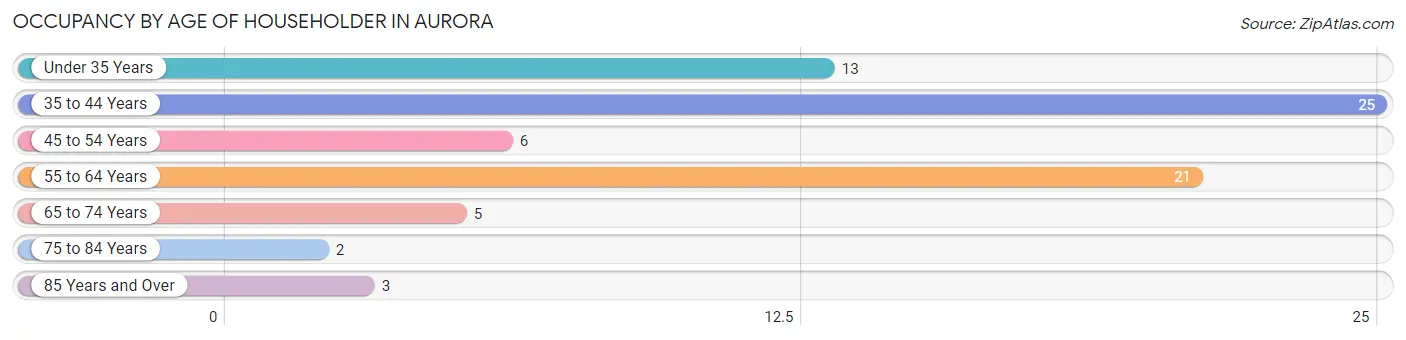
| Age Bracket | # Households | % Households |
| Under 35 Years | 13 | 17.3% |
| 35 to 44 Years | 25 | 33.3% |
| 45 to 54 Years | 6 | 8.0% |
| 55 to 64 Years | 21 | 28.0% |
| 65 to 74 Years | 5 | 6.7% |
| 75 to 84 Years | 2 | 2.7% |
| 85 Years and Over | 3 | 4.0% |
| Total | 75 | 100.0% |
Housing Finances in Aurora
Median Income by Occupancy in Aurora
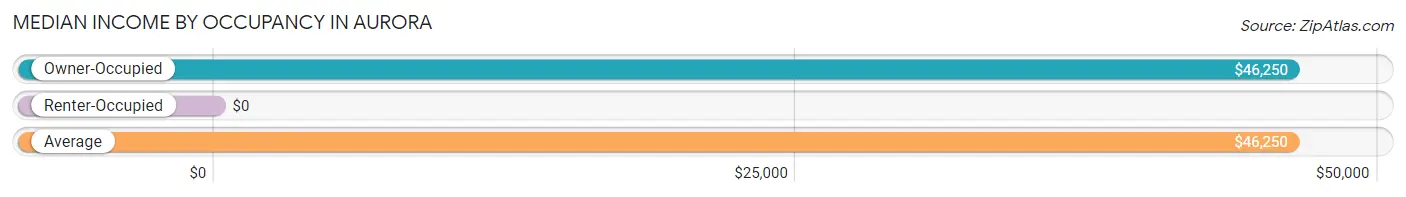
| Occupancy Type | # Households | Median Income |
| Owner-Occupied | 71 (94.7%) | $46,250 |
| Renter-Occupied | 4 (5.3%) | $0 |
| Average | 75 (100.0%) | $46,250 |
Occupancy by Householder Income Bracket in Aurora
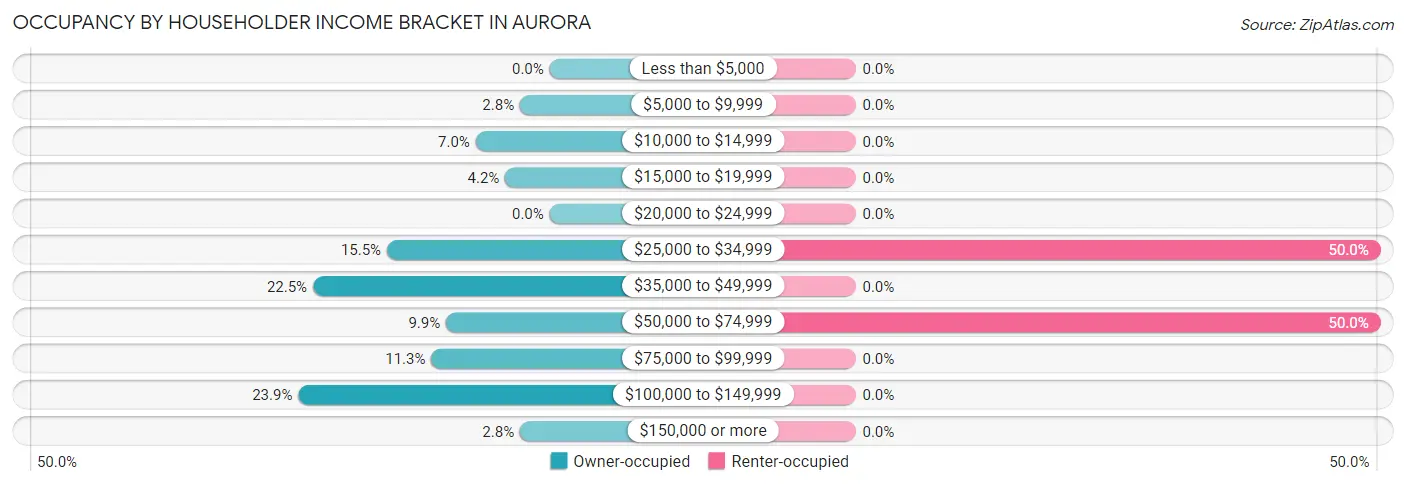
| Income Bracket | Owner-occupied | Renter-occupied |
| Less than $5,000 | 0 (0.0%) | 0 (0.0%) |
| $5,000 to $9,999 | 2 (2.8%) | 0 (0.0%) |
| $10,000 to $14,999 | 5 (7.0%) | 0 (0.0%) |
| $15,000 to $19,999 | 3 (4.2%) | 0 (0.0%) |
| $20,000 to $24,999 | 0 (0.0%) | 0 (0.0%) |
| $25,000 to $34,999 | 11 (15.5%) | 2 (50.0%) |
| $35,000 to $49,999 | 16 (22.5%) | 0 (0.0%) |
| $50,000 to $74,999 | 7 (9.9%) | 2 (50.0%) |
| $75,000 to $99,999 | 8 (11.3%) | 0 (0.0%) |
| $100,000 to $149,999 | 17 (23.9%) | 0 (0.0%) |
| $150,000 or more | 2 (2.8%) | 0 (0.0%) |
| Total | 71 (100.0%) | 4 (100.0%) |
Monthly Housing Cost Tiers in Aurora
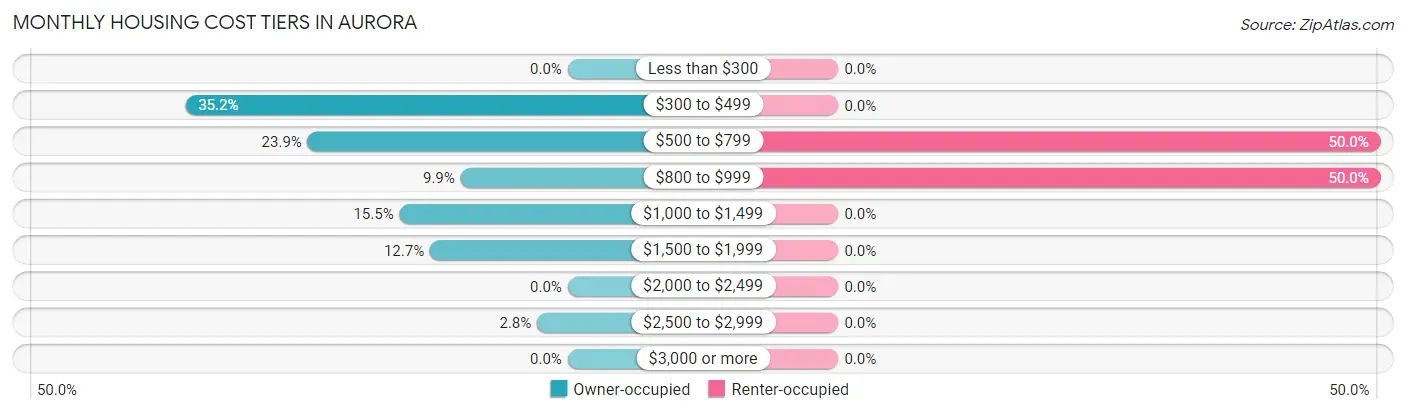
| Monthly Cost | Owner-occupied | Renter-occupied |
| Less than $300 | 0 (0.0%) | 0 (0.0%) |
| $300 to $499 | 25 (35.2%) | 0 (0.0%) |
| $500 to $799 | 17 (23.9%) | 2 (50.0%) |
| $800 to $999 | 7 (9.9%) | 2 (50.0%) |
| $1,000 to $1,499 | 11 (15.5%) | 0 (0.0%) |
| $1,500 to $1,999 | 9 (12.7%) | 0 (0.0%) |
| $2,000 to $2,499 | 0 (0.0%) | 0 (0.0%) |
| $2,500 to $2,999 | 2 (2.8%) | 0 (0.0%) |
| $3,000 or more | 0 (0.0%) | 0 (0.0%) |
| Total | 71 (100.0%) | 4 (100.0%) |
Physical Housing Characteristics in Aurora
Housing Structures in Aurora
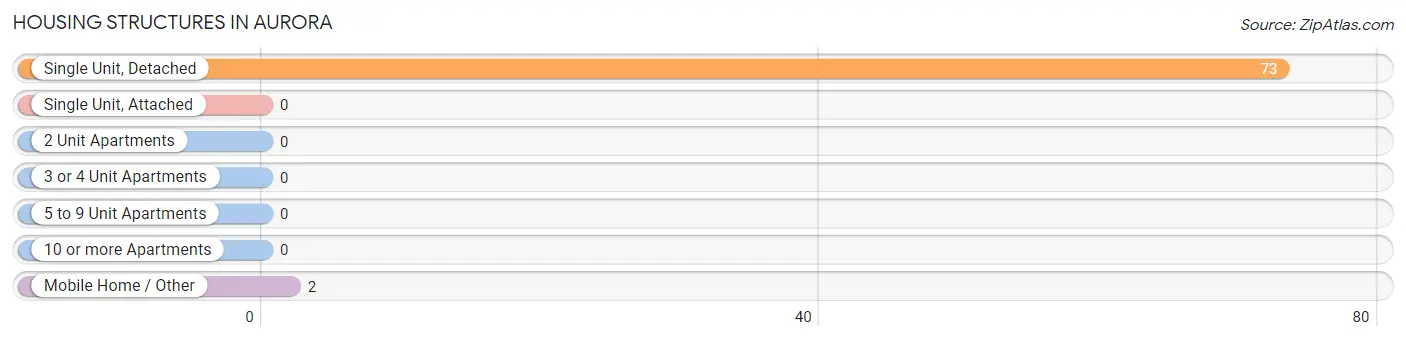
| Structure Type | # Housing Units | % Housing Units |
| Single Unit, Detached | 73 | 97.3% |
| Single Unit, Attached | 0 | 0.0% |
| 2 Unit Apartments | 0 | 0.0% |
| 3 or 4 Unit Apartments | 0 | 0.0% |
| 5 to 9 Unit Apartments | 0 | 0.0% |
| 10 or more Apartments | 0 | 0.0% |
| Mobile Home / Other | 2 | 2.7% |
| Total | 75 | 100.0% |
Housing Structures by Occupancy in Aurora
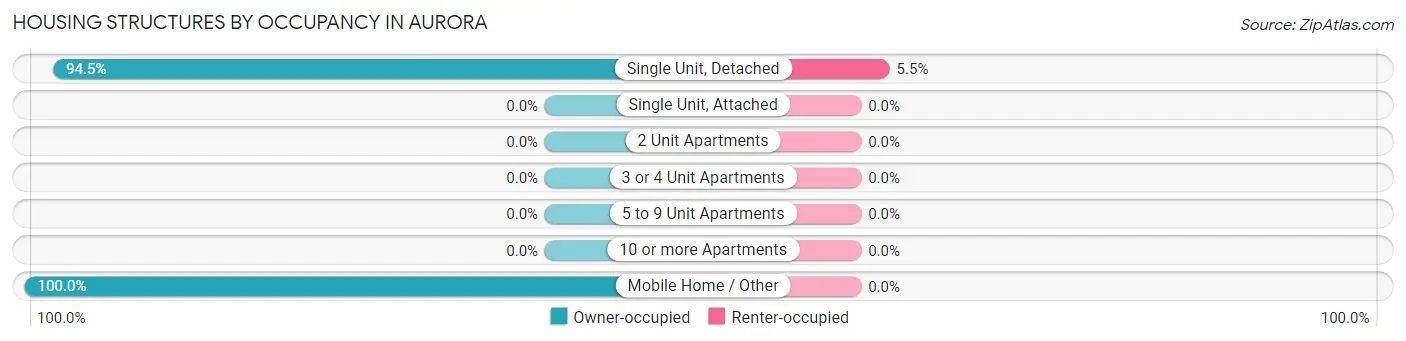
| Structure Type | Owner-occupied | Renter-occupied |
| Single Unit, Detached | 69 (94.5%) | 4 (5.5%) |
| Single Unit, Attached | 0 (0.0%) | 0 (0.0%) |
| 2 Unit Apartments | 0 (0.0%) | 0 (0.0%) |
| 3 or 4 Unit Apartments | 0 (0.0%) | 0 (0.0%) |
| 5 to 9 Unit Apartments | 0 (0.0%) | 0 (0.0%) |
| 10 or more Apartments | 0 (0.0%) | 0 (0.0%) |
| Mobile Home / Other | 2 (100.0%) | 0 (0.0%) |
| Total | 71 (94.7%) | 4 (5.3%) |
Housing Structures by Number of Rooms in Aurora
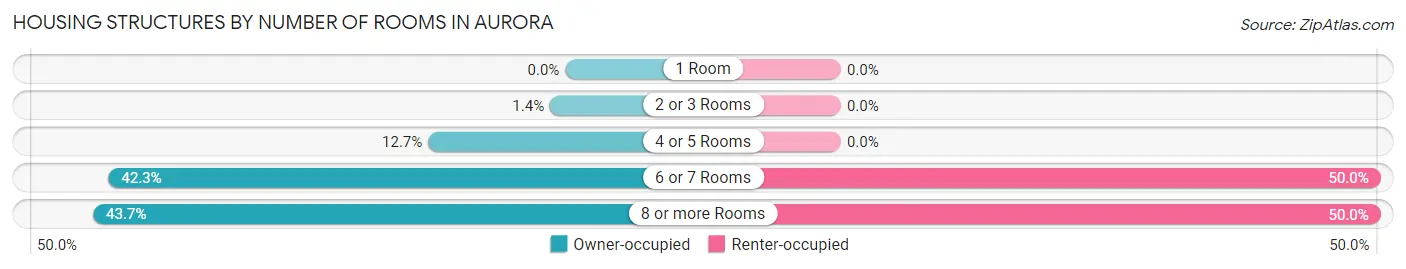
| Number of Rooms | Owner-occupied | Renter-occupied |
| 1 Room | 0 (0.0%) | 0 (0.0%) |
| 2 or 3 Rooms | 1 (1.4%) | 0 (0.0%) |
| 4 or 5 Rooms | 9 (12.7%) | 0 (0.0%) |
| 6 or 7 Rooms | 30 (42.2%) | 2 (50.0%) |
| 8 or more Rooms | 31 (43.7%) | 2 (50.0%) |
| Total | 71 (100.0%) | 4 (100.0%) |
Housing Structure by Heating Type in Aurora
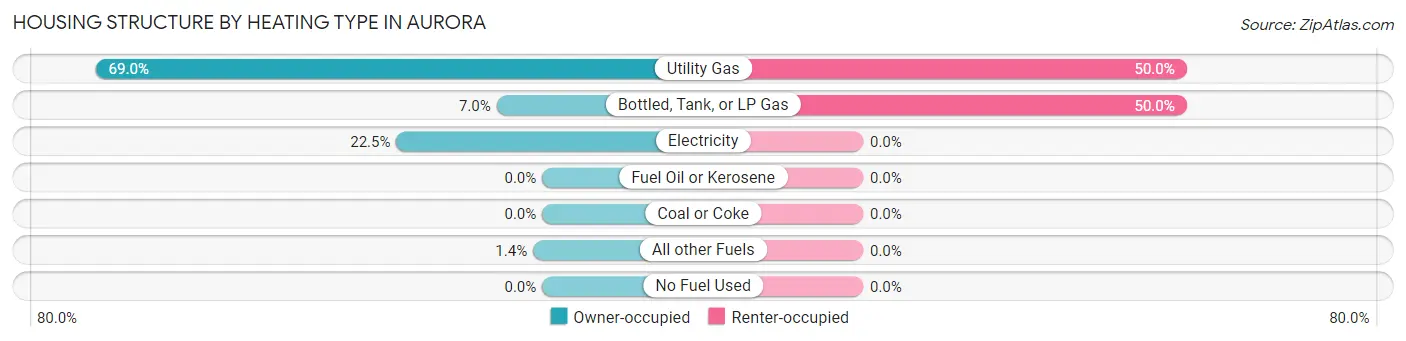
| Heating Type | Owner-occupied | Renter-occupied |
| Utility Gas | 49 (69.0%) | 2 (50.0%) |
| Bottled, Tank, or LP Gas | 5 (7.0%) | 2 (50.0%) |
| Electricity | 16 (22.5%) | 0 (0.0%) |
| Fuel Oil or Kerosene | 0 (0.0%) | 0 (0.0%) |
| Coal or Coke | 0 (0.0%) | 0 (0.0%) |
| All other Fuels | 1 (1.4%) | 0 (0.0%) |
| No Fuel Used | 0 (0.0%) | 0 (0.0%) |
| Total | 71 (100.0%) | 4 (100.0%) |
Household Vehicle Usage in Aurora
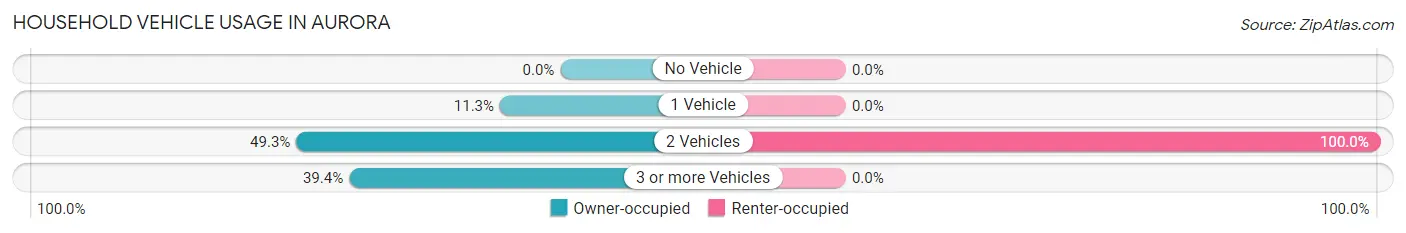
| Vehicles per Household | Owner-occupied | Renter-occupied |
| No Vehicle | 0 (0.0%) | 0 (0.0%) |
| 1 Vehicle | 8 (11.3%) | 0 (0.0%) |
| 2 Vehicles | 35 (49.3%) | 4 (100.0%) |
| 3 or more Vehicles | 28 (39.4%) | 0 (0.0%) |
| Total | 71 (100.0%) | 4 (100.0%) |
Real Estate & Mortgages in Aurora
Real Estate and Mortgage Overview in Aurora
| Characteristic | Without Mortgage | With Mortgage |
| Housing Units | 26 | 45 |
| Median Property Value | $95,000 | $117,500 |
| Median Household Income | $31,250 | $0 |
| Monthly Housing Costs | $447 | $0 |
| Real Estate Taxes | $1,000 | $4 |
Property Value by Mortgage Status in Aurora
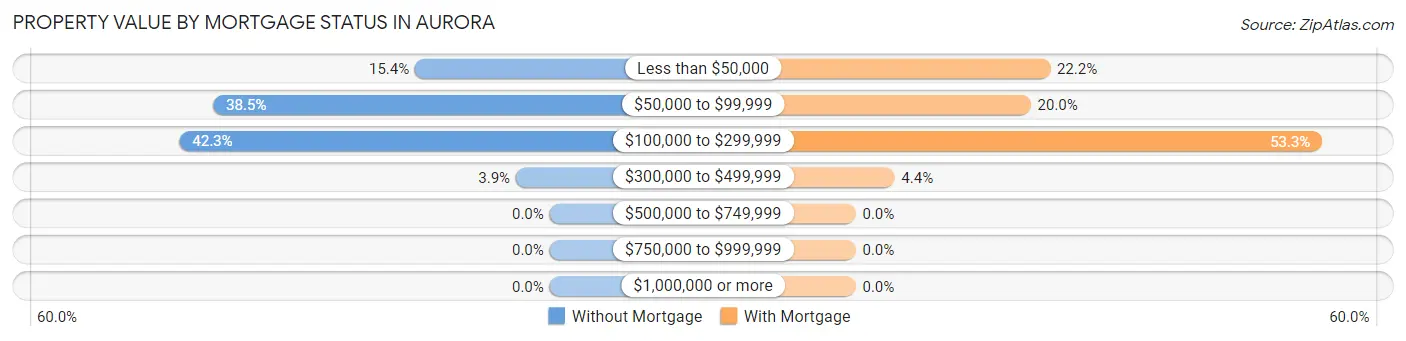
| Property Value | Without Mortgage | With Mortgage |
| Less than $50,000 | 4 (15.4%) | 10 (22.2%) |
| $50,000 to $99,999 | 10 (38.5%) | 9 (20.0%) |
| $100,000 to $299,999 | 11 (42.3%) | 24 (53.3%) |
| $300,000 to $499,999 | 1 (3.8%) | 2 (4.4%) |
| $500,000 to $749,999 | 0 (0.0%) | 0 (0.0%) |
| $750,000 to $999,999 | 0 (0.0%) | 0 (0.0%) |
| $1,000,000 or more | 0 (0.0%) | 0 (0.0%) |
| Total | 26 (100.0%) | 45 (100.0%) |
Household Income by Mortgage Status in Aurora
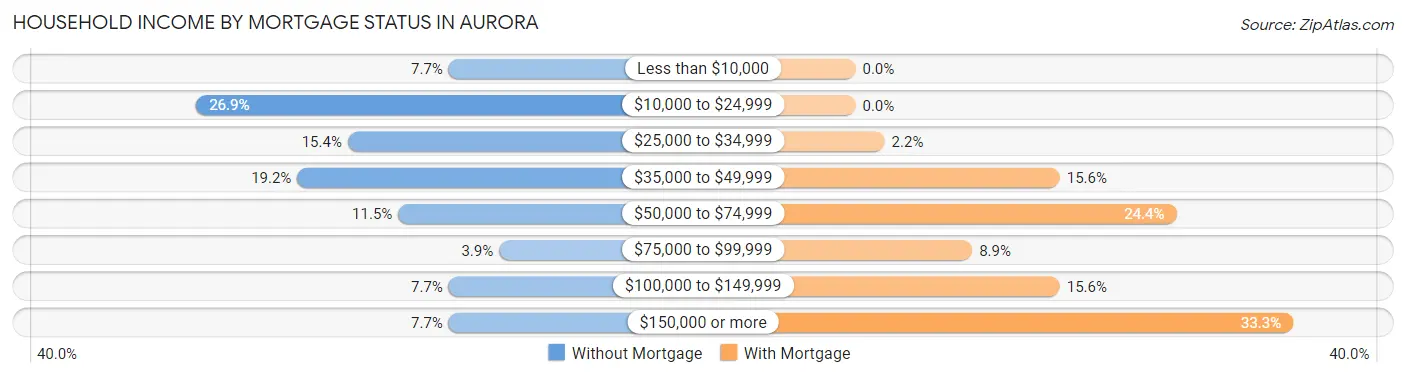
| Household Income | Without Mortgage | With Mortgage |
| Less than $10,000 | 2 (7.7%) | 0 (0.0%) |
| $10,000 to $24,999 | 7 (26.9%) | 0 (0.0%) |
| $25,000 to $34,999 | 4 (15.4%) | 1 (2.2%) |
| $35,000 to $49,999 | 5 (19.2%) | 7 (15.6%) |
| $50,000 to $74,999 | 3 (11.5%) | 11 (24.4%) |
| $75,000 to $99,999 | 1 (3.8%) | 4 (8.9%) |
| $100,000 to $149,999 | 2 (7.7%) | 7 (15.6%) |
| $150,000 or more | 2 (7.7%) | 15 (33.3%) |
| Total | 26 (100.0%) | 45 (100.0%) |
Property Value to Household Income Ratio in Aurora
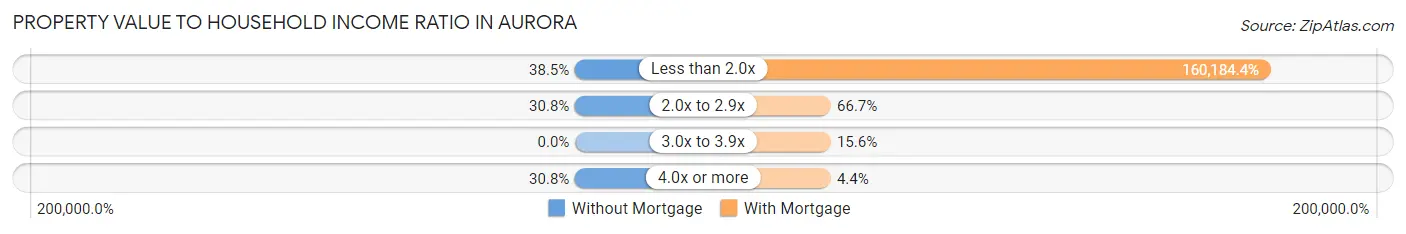
| Value-to-Income Ratio | Without Mortgage | With Mortgage |
| Less than 2.0x | 10 (38.5%) | 72,083 (160,184.4%) |
| 2.0x to 2.9x | 8 (30.8%) | 30 (66.7%) |
| 3.0x to 3.9x | 0 (0.0%) | 7 (15.6%) |
| 4.0x or more | 8 (30.8%) | 2 (4.4%) |
| Total | 26 (100.0%) | 45 (100.0%) |
Real Estate Taxes by Mortgage Status in Aurora
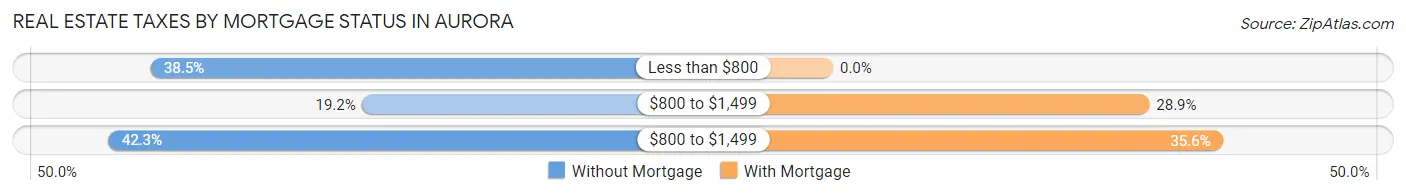
| Property Taxes | Without Mortgage | With Mortgage |
| Less than $800 | 10 (38.5%) | 0 (0.0%) |
| $800 to $1,499 | 5 (19.2%) | 13 (28.9%) |
| $800 to $1,499 | 11 (42.3%) | 16 (35.6%) |
| Total | 26 (100.0%) | 45 (100.0%) |
Health & Disability in Aurora
Health Insurance Coverage by Age in Aurora
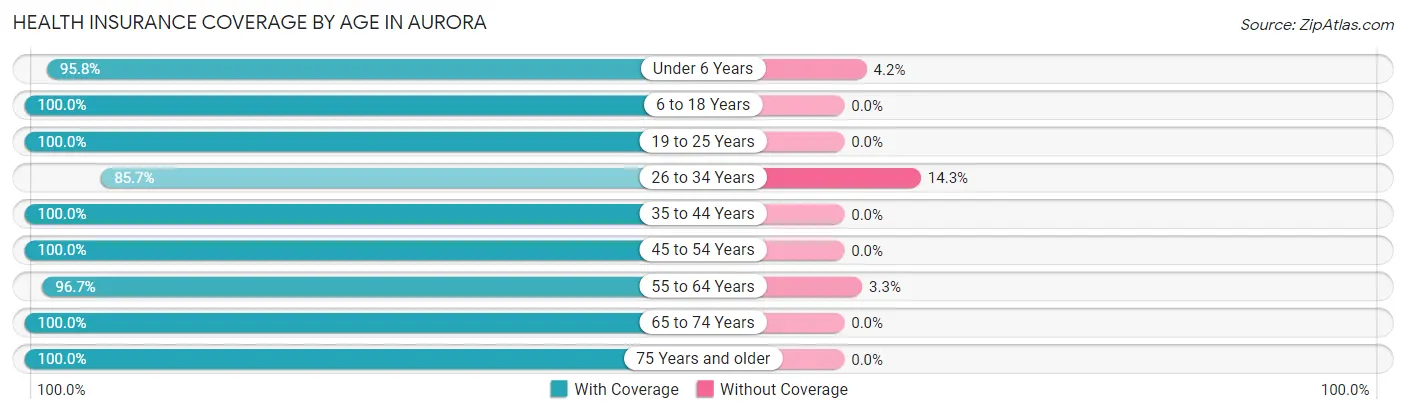
| Age Bracket | With Coverage | Without Coverage |
| Under 6 Years | 23 (95.8%) | 1 (4.2%) |
| 6 to 18 Years | 44 (100.0%) | 0 (0.0%) |
| 19 to 25 Years | 11 (100.0%) | 0 (0.0%) |
| 26 to 34 Years | 18 (85.7%) | 3 (14.3%) |
| 35 to 44 Years | 30 (100.0%) | 0 (0.0%) |
| 45 to 54 Years | 22 (100.0%) | 0 (0.0%) |
| 55 to 64 Years | 29 (96.7%) | 1 (3.3%) |
| 65 to 74 Years | 8 (100.0%) | 0 (0.0%) |
| 75 Years and older | 7 (100.0%) | 0 (0.0%) |
| Total | 192 (97.5%) | 5 (2.5%) |
Health Insurance Coverage by Citizenship Status in Aurora
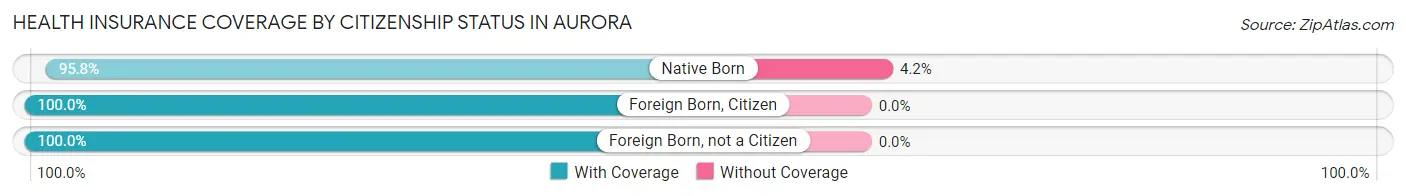
| Citizenship Status | With Coverage | Without Coverage |
| Native Born | 23 (95.8%) | 1 (4.2%) |
| Foreign Born, Citizen | 44 (100.0%) | 0 (0.0%) |
| Foreign Born, not a Citizen | 11 (100.0%) | 0 (0.0%) |
Health Insurance Coverage by Household Income in Aurora
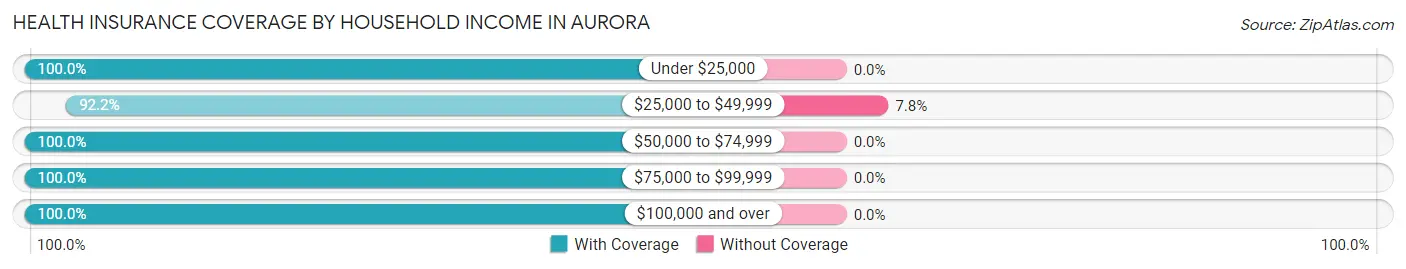
| Household Income | With Coverage | Without Coverage |
| Under $25,000 | 14 (100.0%) | 0 (0.0%) |
| $25,000 to $49,999 | 59 (92.2%) | 5 (7.8%) |
| $50,000 to $74,999 | 25 (100.0%) | 0 (0.0%) |
| $75,000 to $99,999 | 37 (100.0%) | 0 (0.0%) |
| $100,000 and over | 57 (100.0%) | 0 (0.0%) |
Public vs Private Health Insurance Coverage by Age in Aurora
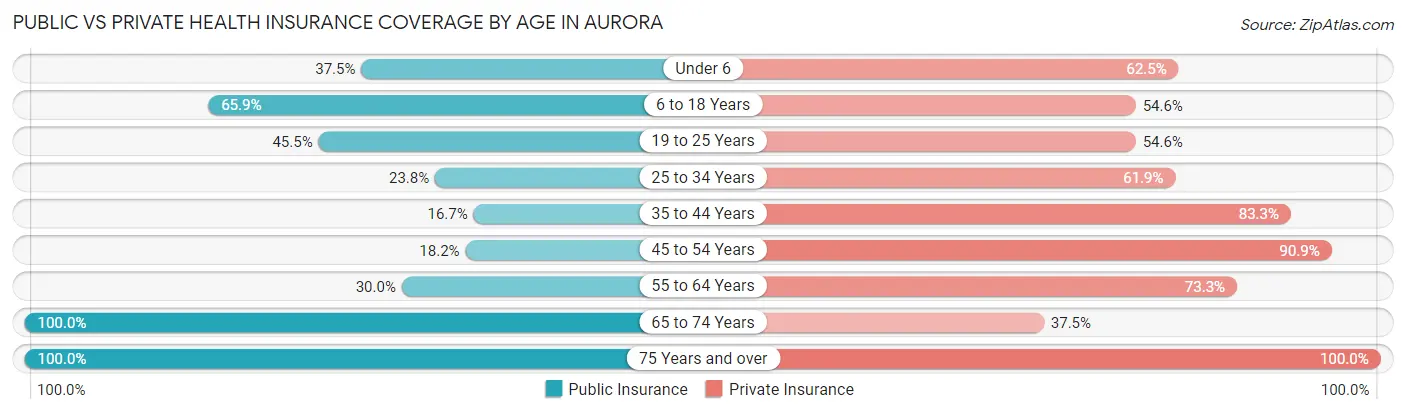
| Age Bracket | Public Insurance | Private Insurance |
| Under 6 | 9 (37.5%) | 15 (62.5%) |
| 6 to 18 Years | 29 (65.9%) | 24 (54.5%) |
| 19 to 25 Years | 5 (45.5%) | 6 (54.5%) |
| 25 to 34 Years | 5 (23.8%) | 13 (61.9%) |
| 35 to 44 Years | 5 (16.7%) | 25 (83.3%) |
| 45 to 54 Years | 4 (18.2%) | 20 (90.9%) |
| 55 to 64 Years | 9 (30.0%) | 22 (73.3%) |
| 65 to 74 Years | 8 (100.0%) | 3 (37.5%) |
| 75 Years and over | 7 (100.0%) | 7 (100.0%) |
| Total | 81 (41.1%) | 135 (68.5%) |
Disability Status by Sex by Age in Aurora
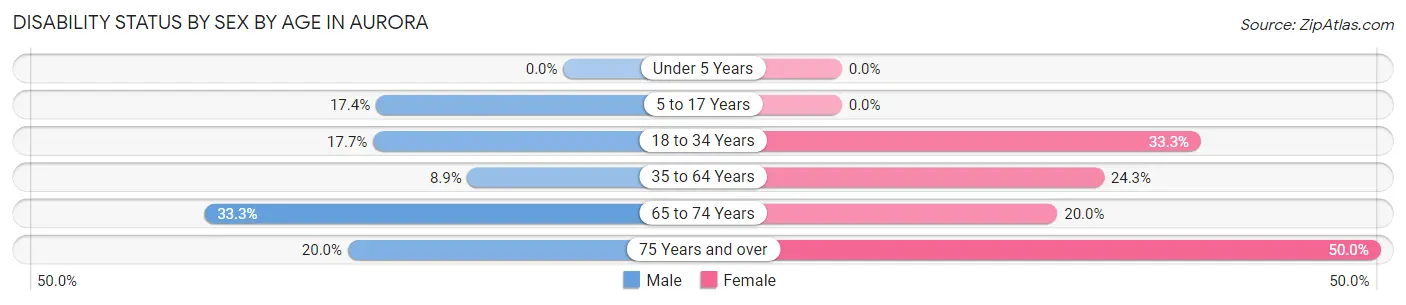
| Age Bracket | Male | Female |
| Under 5 Years | 0 (0.0%) | 0 (0.0%) |
| 5 to 17 Years | 4 (17.4%) | 0 (0.0%) |
| 18 to 34 Years | 3 (17.6%) | 5 (33.3%) |
| 35 to 64 Years | 4 (8.9%) | 9 (24.3%) |
| 65 to 74 Years | 1 (33.3%) | 1 (20.0%) |
| 75 Years and over | 1 (20.0%) | 1 (50.0%) |
Disability Class by Sex by Age in Aurora
Disability Class: Hearing Difficulty
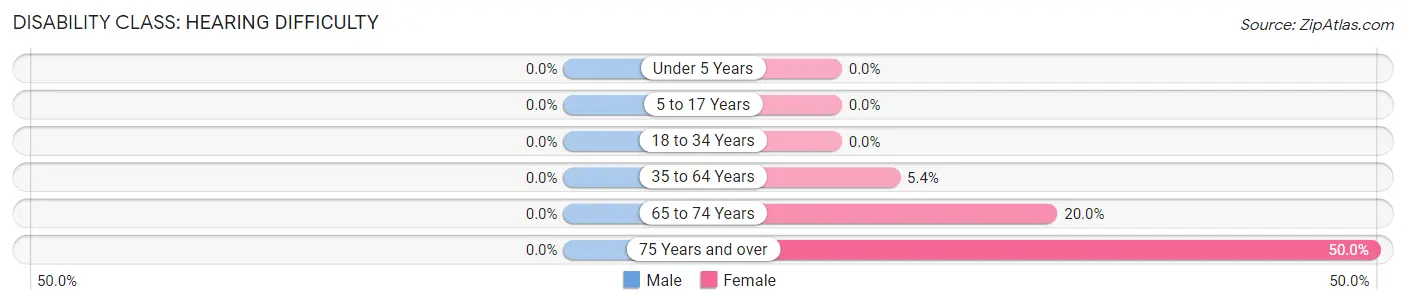
| Age Bracket | Male | Female |
| Under 5 Years | 0 (0.0%) | 0 (0.0%) |
| 5 to 17 Years | 0 (0.0%) | 0 (0.0%) |
| 18 to 34 Years | 0 (0.0%) | 0 (0.0%) |
| 35 to 64 Years | 0 (0.0%) | 2 (5.4%) |
| 65 to 74 Years | 0 (0.0%) | 1 (20.0%) |
| 75 Years and over | 0 (0.0%) | 1 (50.0%) |
Disability Class: Vision Difficulty
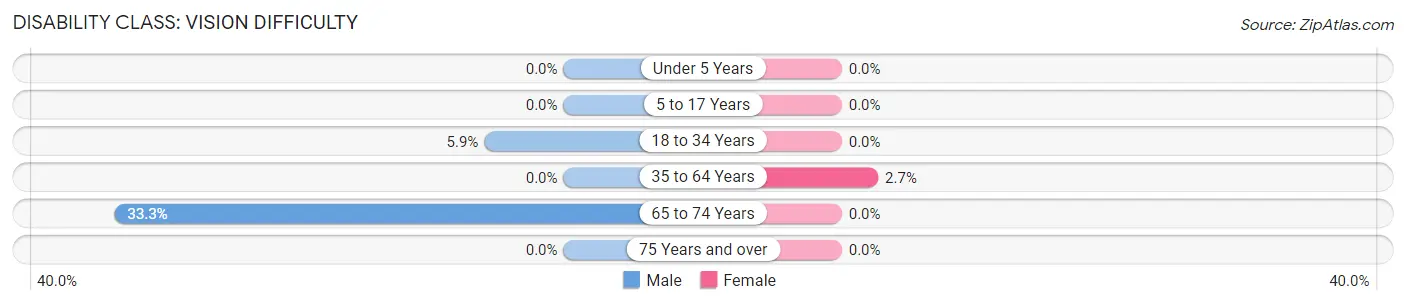
| Age Bracket | Male | Female |
| Under 5 Years | 0 (0.0%) | 0 (0.0%) |
| 5 to 17 Years | 0 (0.0%) | 0 (0.0%) |
| 18 to 34 Years | 1 (5.9%) | 0 (0.0%) |
| 35 to 64 Years | 0 (0.0%) | 1 (2.7%) |
| 65 to 74 Years | 1 (33.3%) | 0 (0.0%) |
| 75 Years and over | 0 (0.0%) | 0 (0.0%) |
Disability Class: Cognitive Difficulty
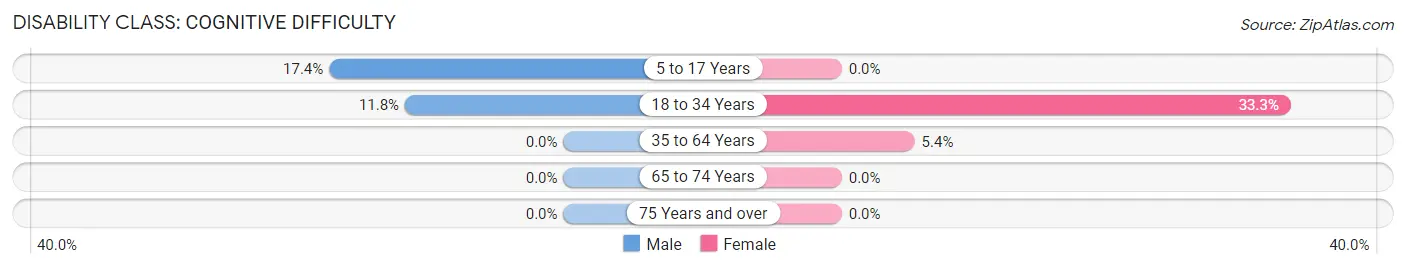
| Age Bracket | Male | Female |
| 5 to 17 Years | 4 (17.4%) | 0 (0.0%) |
| 18 to 34 Years | 2 (11.8%) | 5 (33.3%) |
| 35 to 64 Years | 0 (0.0%) | 2 (5.4%) |
| 65 to 74 Years | 0 (0.0%) | 0 (0.0%) |
| 75 Years and over | 0 (0.0%) | 0 (0.0%) |
Disability Class: Ambulatory Difficulty
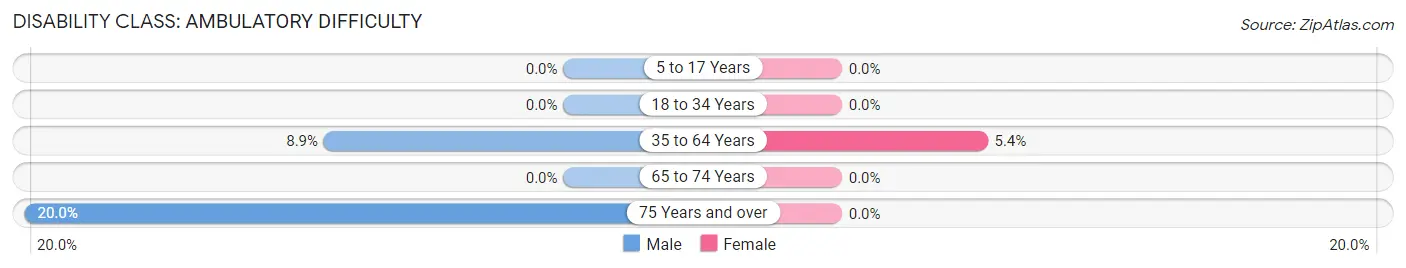
| Age Bracket | Male | Female |
| 5 to 17 Years | 0 (0.0%) | 0 (0.0%) |
| 18 to 34 Years | 0 (0.0%) | 0 (0.0%) |
| 35 to 64 Years | 4 (8.9%) | 2 (5.4%) |
| 65 to 74 Years | 0 (0.0%) | 0 (0.0%) |
| 75 Years and over | 1 (20.0%) | 0 (0.0%) |
Disability Class: Self-Care Difficulty
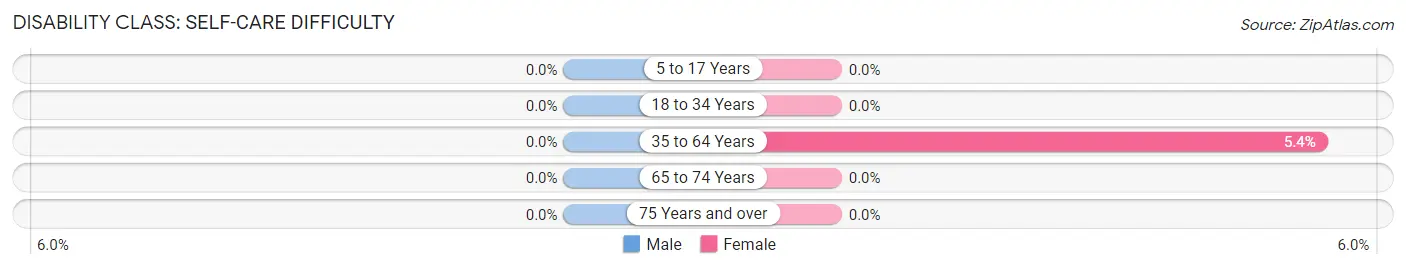
| Age Bracket | Male | Female |
| 5 to 17 Years | 0 (0.0%) | 0 (0.0%) |
| 18 to 34 Years | 0 (0.0%) | 0 (0.0%) |
| 35 to 64 Years | 0 (0.0%) | 2 (5.4%) |
| 65 to 74 Years | 0 (0.0%) | 0 (0.0%) |
| 75 Years and over | 0 (0.0%) | 0 (0.0%) |
Technology Access in Aurora
Computing Device Access in Aurora
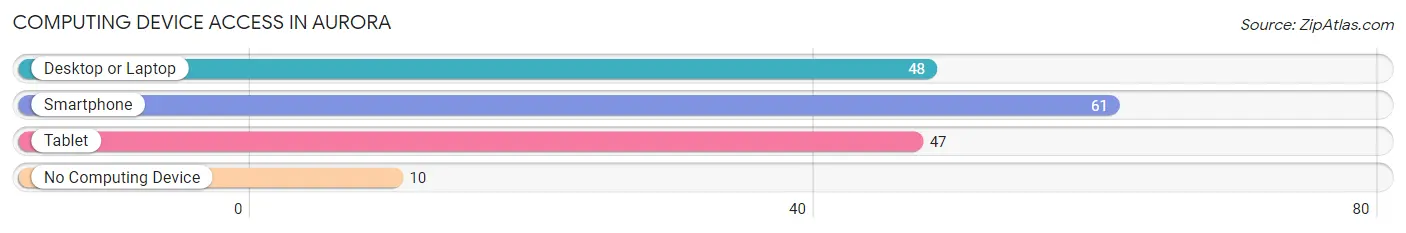
| Device Type | # Households | % Households |
| Desktop or Laptop | 48 | 64.0% |
| Smartphone | 61 | 81.3% |
| Tablet | 47 | 62.7% |
| No Computing Device | 10 | 13.3% |
| Total | 75 | 100.0% |
Internet Access in Aurora
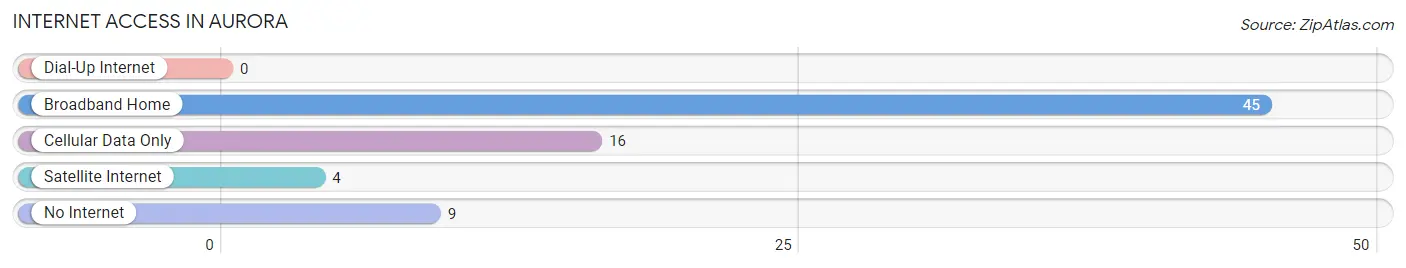
| Internet Type | # Households | % Households |
| Dial-Up Internet | 0 | 0.0% |
| Broadband Home | 45 | 60.0% |
| Cellular Data Only | 16 | 21.3% |
| Satellite Internet | 4 | 5.3% |
| No Internet | 9 | 12.0% |
| Total | 75 | 100.0% |
Aurora Summary
Aurora, Iowa is a small city located in the southeastern corner of the state, in the county of Buchanan. It is situated on the banks of the Wapsipinicon River, and is part of the Cedar Rapids Metropolitan Statistical Area. The city has a population of 1,845 people, according to the 2010 census.
History
Aurora was founded in 1856 by a group of settlers from Ohio. The city was named after the Roman goddess of the dawn, Aurora. The first settlers were attracted to the area by the abundance of timber and the fertile soil. The city was incorporated in 1872.
In the late 19th century, Aurora was a thriving agricultural community. The city was home to several grain mills, a creamery, and a cheese factory. The city also had a large lumber industry, with several sawmills located in the area.
In the early 20th century, Aurora experienced a period of growth and prosperity. The city was home to several businesses, including a bank, a hotel, a movie theater, and a variety of stores. The city also had a thriving agricultural industry, with several farms located in the area.
Geography
Aurora is located in the southeastern corner of Iowa, in the county of Buchanan. The city is situated on the banks of the Wapsipinicon River, and is part of the Cedar Rapids Metropolitan Statistical Area. The city has a total area of 1.3 square miles, all of which is land.
The city has a humid continental climate, with hot summers and cold winters. The average temperature in the summer is around 75 degrees Fahrenheit, and the average temperature in the winter is around 25 degrees Fahrenheit.
Economy
Aurora’s economy is largely based on agriculture. The city is home to several farms, and the surrounding area is known for its production of corn, soybeans, and other crops. The city also has a thriving lumber industry, with several sawmills located in the area.
The city is also home to several businesses, including a bank, a hotel, a movie theater, and a variety of stores. The city also has a thriving tourism industry, with several attractions located in the area.
Demographics
According to the 2010 census, Aurora has a population of 1,845 people. The city has a median household income of $41,944, and a median family income of $50,944. The city has a poverty rate of 11.3%, and the unemployment rate is 4.2%.
The city is predominantly white, with 92.3% of the population identifying as white. The city also has a small Hispanic population, with 4.2% of the population identifying as Hispanic or Latino. The city also has a small African American population, with 1.2% of the population identifying as African American.
Conclusion
Aurora, Iowa is a small city located in the southeastern corner of the state, in the county of Buchanan. The city has a population of 1,845 people, according to the 2010 census. The city has a humid continental climate, with hot summers and cold winters. The city’s economy is largely based on agriculture, and the city also has a thriving lumber industry. The city is predominantly white, with 92.3% of the population identifying as white. The city also has a small Hispanic population, with 4.2% of the population identifying as Hispanic or Latino. The city also has a small African American population, with 1.2% of the population identifying as African American.
Common Questions
What is Per Capita Income in Aurora?
Per Capita income in Aurora is $24,943.
What is the Median Family Income in Aurora?
Median Family Income in Aurora is $73,750.
What is the Median Household income in Aurora?
Median Household Income in Aurora is $46,250.
What is Income or Wage Gap in Aurora?
Income or Wage Gap in Aurora is 22.3%.
Women in Aurora earn 77.7 cents for every dollar earned by a man.
What is Family Income Deficit in Aurora?
Family Income Deficit in Aurora is $13,478.
Families that are below poverty line in Aurora earn $13,478 less on average than the poverty threshold level.
What is Inequality or Gini Index in Aurora?
Inequality or Gini Index in Aurora is 0.39.
What is the Total Population of Aurora?
Total Population of Aurora is 197.
What is the Total Male Population of Aurora?
Total Male Population of Aurora is 97.
What is the Total Female Population of Aurora?
Total Female Population of Aurora is 100.
What is the Ratio of Males per 100 Females in Aurora?
There are 97.00 Males per 100 Females in Aurora.
What is the Ratio of Females per 100 Males in Aurora?
There are 103.09 Females per 100 Males in Aurora.
What is the Median Population Age in Aurora?
Median Population Age in Aurora is 33.5 Years.
What is the Average Family Size in Aurora
Average Family Size in Aurora is 3.2 People.
What is the Average Household Size in Aurora
Average Household Size in Aurora is 2.6 People.
How Large is the Labor Force in Aurora?
There are 106 People in the Labor Forcein in Aurora.
What is the Percentage of People in the Labor Force in Aurora?
75.2% of People are in the Labor Force in Aurora.
What is the Unemployment Rate in Aurora?
Unemployment Rate in Aurora is 6.6%.