Grant, IA Map & Demographics
Grant Map
Grant Overview
$30,386
PER CAPITA INCOME
$32,500
AVG HOUSEHOLD INCOME
0.37
INEQUALITY / GINI INDEX
64
TOTAL POPULATION
35
MALE POPULATION
29
FEMALE POPULATION
120.69
MALES / 100 FEMALES
82.86
FEMALES / 100 MALES
50.8
MEDIAN AGE
2.1
AVG FAMILY SIZE
1.9
AVG HOUSEHOLD SIZE
23
LABOR FORCE [ PEOPLE ]
40.4%
PERCENT IN LABOR FORCE
Grant Zip Codes
Grant Area Codes
Income in Grant
Income Overview in Grant
| Characteristic | Number | Measure |
| Per Capita Income | 64 | $30,386 |
| Median Family Income | 22 | $0 |
| Mean Family Income | 22 | $65,900 |
| Median Household Income | 34 | $32,500 |
| Mean Household Income | 34 | $59,376 |
| Income Deficit | 22 | $0 |
| Wage / Income Gap (%) | 64 | 0.00% |
| Wage / Income Gap ($) | 64 | 100.00¢ per $1 |
| Gini / Inequality Index | 64 | 0.37 |
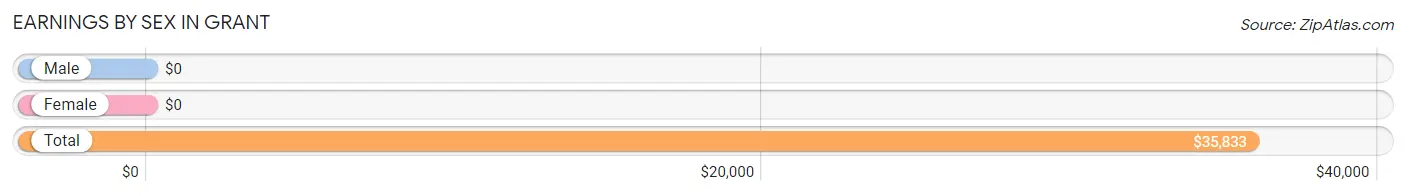
Earnings by Sex in Grant
| Sex | Number | Average Earnings |
| Male | 14 (58.3%) | $0 |
| Female | 10 (41.7%) | $0 |
| Total | 24 (100.0%) | $35,833 |
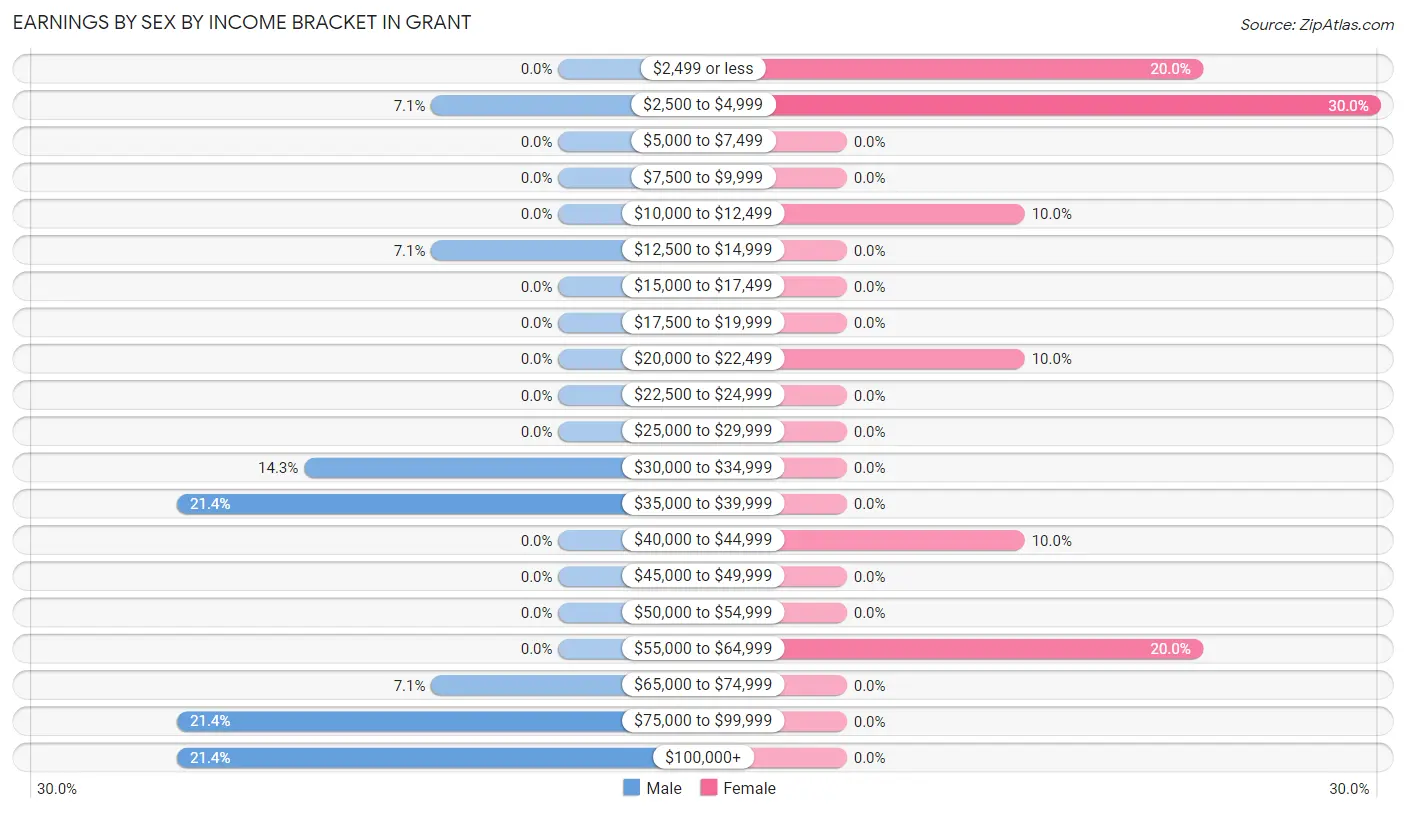
Earnings by Sex by Income Bracket in Grant
The most common earnings brackets in Grant are $35,000 to $39,999 for men (3 | 21.4%) and $2,500 to $4,999 for women (3 | 30.0%).
| Income | Male | Female |
| $2,499 or less | 0 (0.0%) | 2 (20.0%) |
| $2,500 to $4,999 | 1 (7.1%) | 3 (30.0%) |
| $5,000 to $7,499 | 0 (0.0%) | 0 (0.0%) |
| $7,500 to $9,999 | 0 (0.0%) | 0 (0.0%) |
| $10,000 to $12,499 | 0 (0.0%) | 1 (10.0%) |
| $12,500 to $14,999 | 1 (7.1%) | 0 (0.0%) |
| $15,000 to $17,499 | 0 (0.0%) | 0 (0.0%) |
| $17,500 to $19,999 | 0 (0.0%) | 0 (0.0%) |
| $20,000 to $22,499 | 0 (0.0%) | 1 (10.0%) |
| $22,500 to $24,999 | 0 (0.0%) | 0 (0.0%) |
| $25,000 to $29,999 | 0 (0.0%) | 0 (0.0%) |
| $30,000 to $34,999 | 2 (14.3%) | 0 (0.0%) |
| $35,000 to $39,999 | 3 (21.4%) | 0 (0.0%) |
| $40,000 to $44,999 | 0 (0.0%) | 1 (10.0%) |
| $45,000 to $49,999 | 0 (0.0%) | 0 (0.0%) |
| $50,000 to $54,999 | 0 (0.0%) | 0 (0.0%) |
| $55,000 to $64,999 | 0 (0.0%) | 2 (20.0%) |
| $65,000 to $74,999 | 1 (7.1%) | 0 (0.0%) |
| $75,000 to $99,999 | 3 (21.4%) | 0 (0.0%) |
| $100,000+ | 3 (21.4%) | 0 (0.0%) |
| Total | 14 (100.0%) | 10 (100.0%) |
Earnings by Sex by Educational Attainment in Grant
| Educational Attainment | Male Income | Female Income |
| Less than High School | - | - |
| High School Diploma | - | - |
| College or Associate's Degree | - | - |
| Bachelor's Degree | - | - |
| Graduate Degree | - | - |
| Total | - | - |
Family Income in Grant
Family Income Brackets in Grant
According to the Grant family income data, there are 9 families falling into the $25,000 to $34,999 income range, which is the most common income bracket and makes up 40.9% of all families.
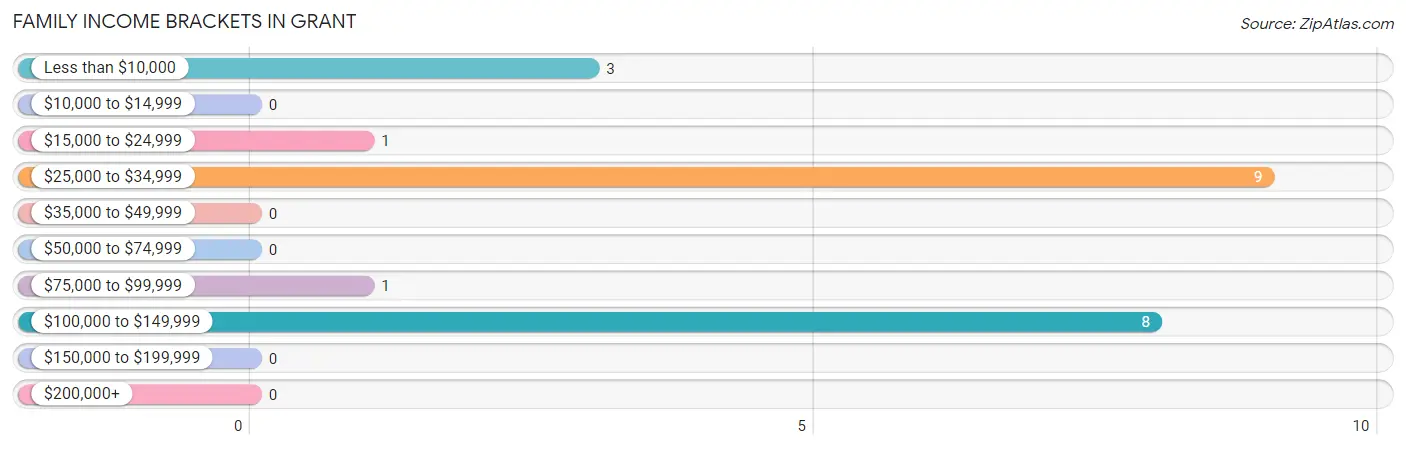
| Income Bracket | # Families | % Families |
| Less than $10,000 | 3 | 13.6% |
| $10,000 to $14,999 | 0 | 0.0% |
| $15,000 to $24,999 | 1 | 4.5% |
| $25,000 to $34,999 | 9 | 40.9% |
| $35,000 to $49,999 | 0 | 0.0% |
| $50,000 to $74,999 | 0 | 0.0% |
| $75,000 to $99,999 | 1 | 4.5% |
| $100,000 to $149,999 | 8 | 36.4% |
| $150,000 to $199,999 | 0 | 0.0% |
| $200,000+ | 0 | 0.0% |
Family Income by Famaliy Size in Grant
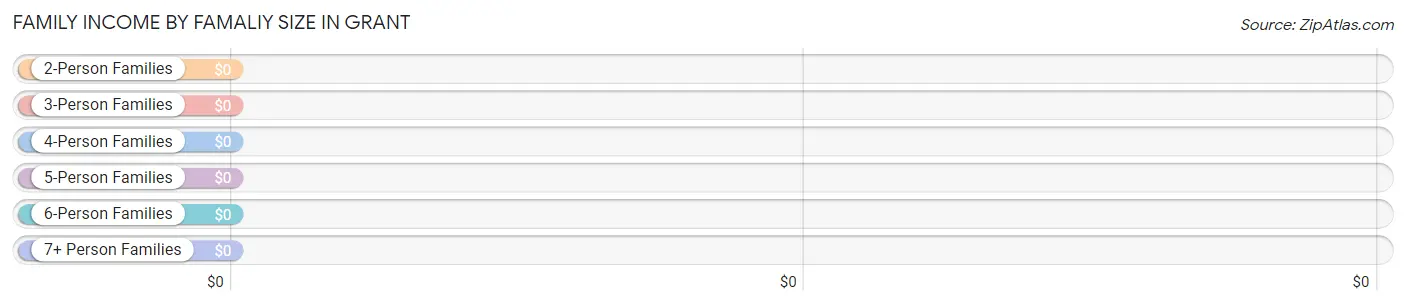
| Income Bracket | # Families | Median Income |
| 2-Person Families | 18 (81.8%) | $0 |
| 3-Person Families | 2 (9.1%) | $0 |
| 4-Person Families | 2 (9.1%) | $0 |
| 5-Person Families | 0 (0.0%) | $0 |
| 6-Person Families | 0 (0.0%) | $0 |
| 7+ Person Families | 0 (0.0%) | $0 |
| Total | 22 (100.0%) | $0 |
Family Income by Number of Earners in Grant
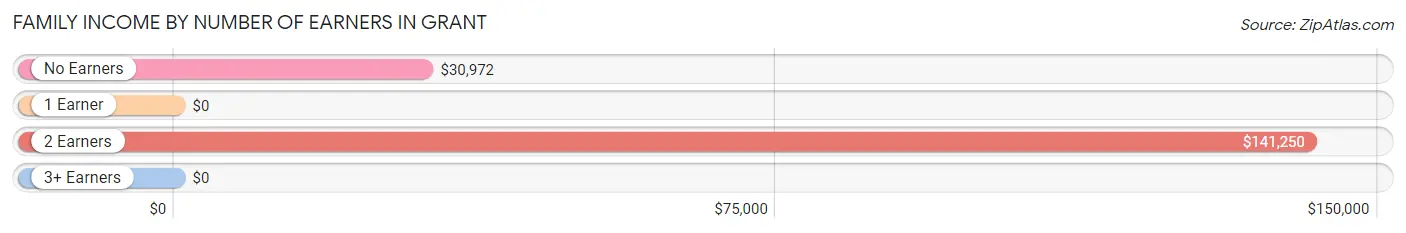
| Number of Earners | # Families | Median Income |
| No Earners | 13 (59.1%) | $30,972 |
| 1 Earner | 2 (9.1%) | $0 |
| 2 Earners | 6 (27.3%) | $141,250 |
| 3+ Earners | 1 (4.5%) | $0 |
| Total | 22 (100.0%) | $0 |
Household Income in Grant
Household Income Brackets in Grant
With 14 households falling in the category, the $25,000 to $34,999 income range is the most frequent in Grant, accounting for 41.2% of all households.
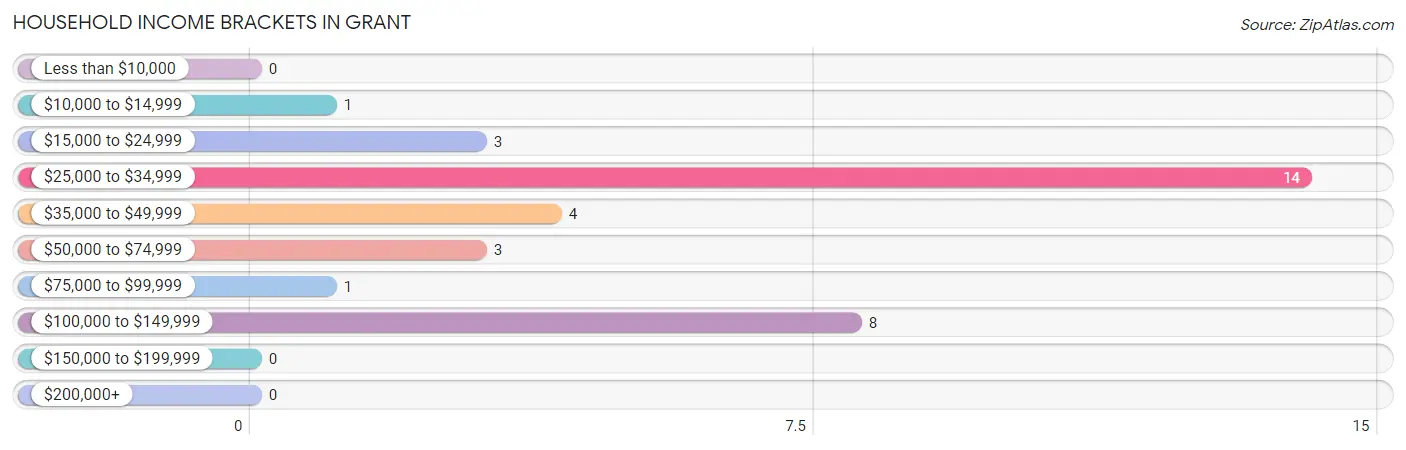
| Income Bracket | # Households | % Households |
| Less than $10,000 | 0 | 0.0% |
| $10,000 to $14,999 | 1 | 2.9% |
| $15,000 to $24,999 | 3 | 8.8% |
| $25,000 to $34,999 | 14 | 41.2% |
| $35,000 to $49,999 | 4 | 11.8% |
| $50,000 to $74,999 | 3 | 8.8% |
| $75,000 to $99,999 | 1 | 2.9% |
| $100,000 to $149,999 | 8 | 23.5% |
| $150,000 to $199,999 | 0 | 0.0% |
| $200,000+ | 0 | 0.0% |
Household Income by Householder Age in Grant
The median household income in Grant is $32,500, with the highest median household income of $30,000 found in the 65+ years age bracket for the primary householder. A total of 10 households (29.4%) fall into this category.
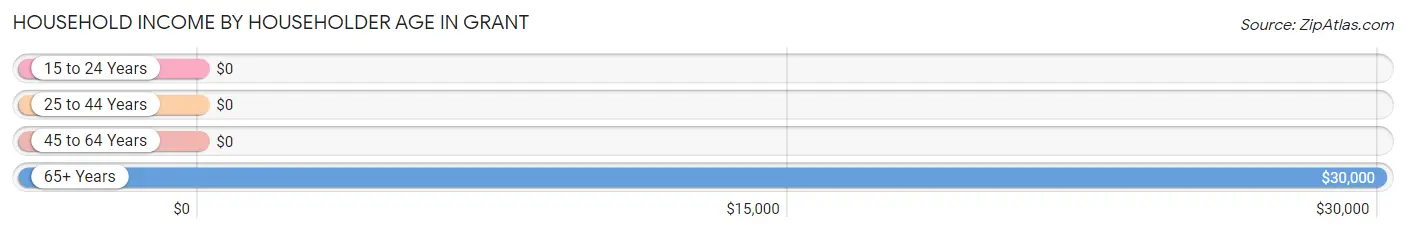
| Income Bracket | # Households | Median Income |
| 15 to 24 Years | 0 (0.0%) | $0 |
| 25 to 44 Years | 7 (20.6%) | $0 |
| 45 to 64 Years | 17 (50.0%) | $0 |
| 65+ Years | 10 (29.4%) | $30,000 |
| Total | 34 (100.0%) | $32,500 |
Poverty in Grant
Income Below Poverty by Sex and Age in Grant
With 25.7% poverty level for males and 20.7% for females among the residents of Grant, under 5 year old males and 25 to 34 year old females are the most vulnerable to poverty, with 3 males (100.0%) and 3 females (60.0%) in their respective age groups living below the poverty level.
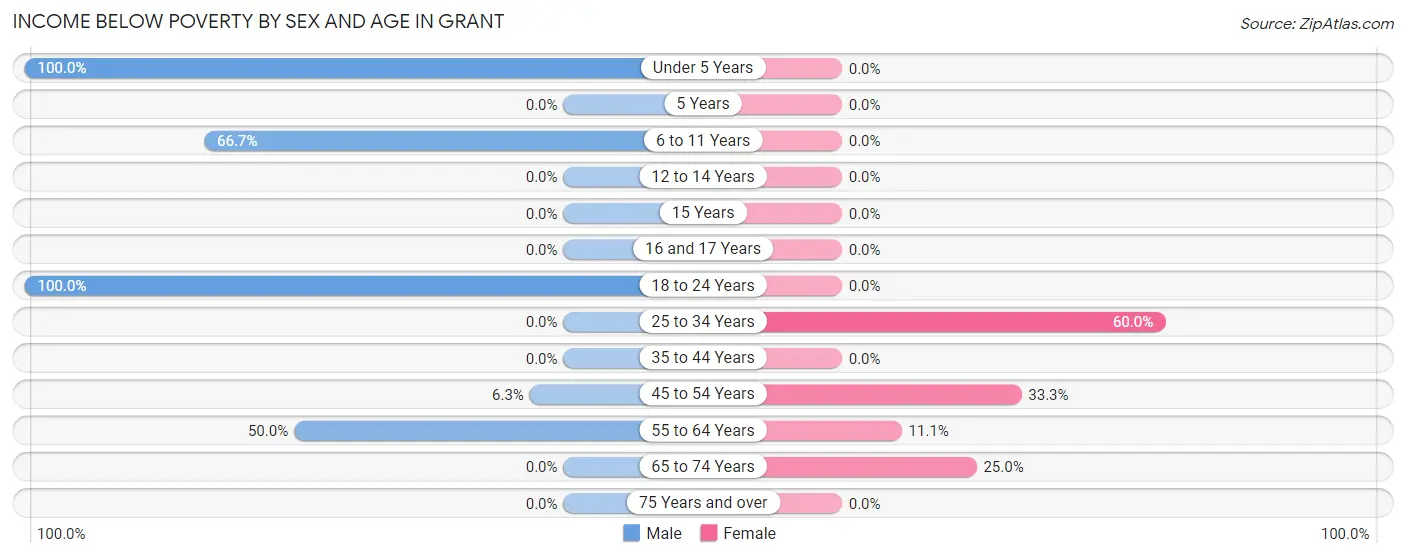
| Age Bracket | Male | Female |
| Under 5 Years | 3 (100.0%) | 0 (0.0%) |
| 5 Years | 0 (0.0%) | 0 (0.0%) |
| 6 to 11 Years | 2 (66.7%) | 0 (0.0%) |
| 12 to 14 Years | 0 (0.0%) | 0 (0.0%) |
| 15 Years | 0 (0.0%) | 0 (0.0%) |
| 16 and 17 Years | 0 (0.0%) | 0 (0.0%) |
| 18 to 24 Years | 2 (100.0%) | 0 (0.0%) |
| 25 to 34 Years | 0 (0.0%) | 3 (60.0%) |
| 35 to 44 Years | 0 (0.0%) | 0 (0.0%) |
| 45 to 54 Years | 1 (6.2%) | 1 (33.3%) |
| 55 to 64 Years | 1 (50.0%) | 1 (11.1%) |
| 65 to 74 Years | 0 (0.0%) | 1 (25.0%) |
| 75 Years and over | 0 (0.0%) | 0 (0.0%) |
| Total | 9 (25.7%) | 6 (20.7%) |
Income Above Poverty by Sex and Age in Grant
According to the poverty statistics in Grant, males aged 25 to 34 years and females aged 5 years are the age groups that are most secure financially, with 100.0% of males and 100.0% of females in these age groups living above the poverty line.
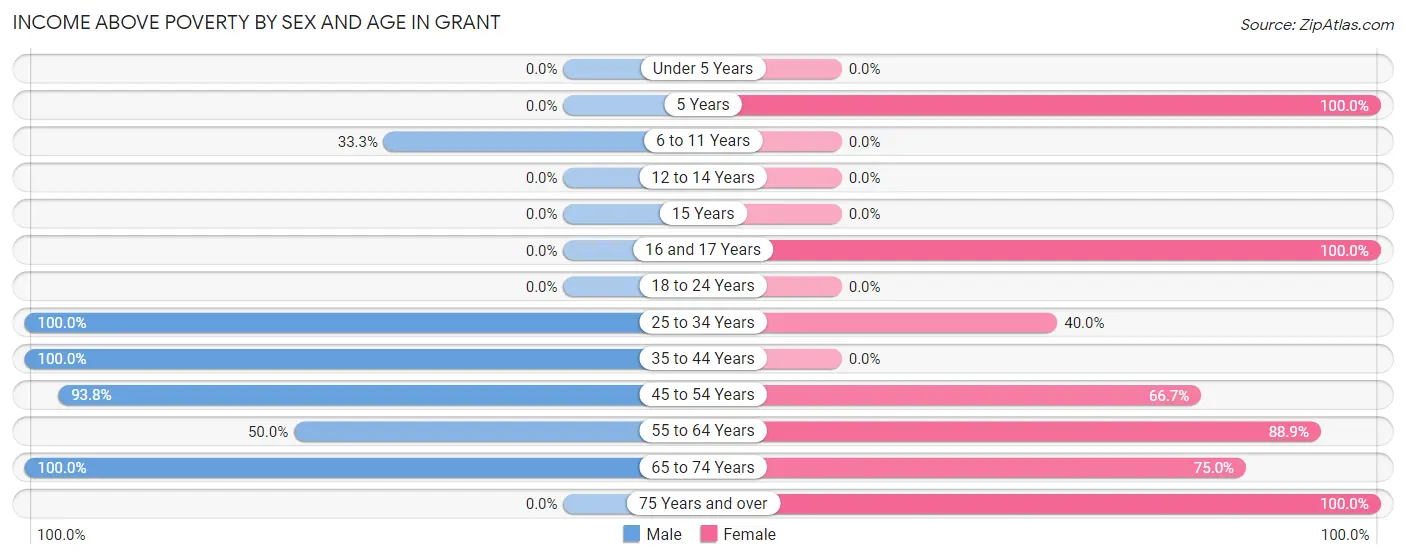
| Age Bracket | Male | Female |
| Under 5 Years | 0 (0.0%) | 0 (0.0%) |
| 5 Years | 0 (0.0%) | 1 (100.0%) |
| 6 to 11 Years | 1 (33.3%) | 0 (0.0%) |
| 12 to 14 Years | 0 (0.0%) | 0 (0.0%) |
| 15 Years | 0 (0.0%) | 0 (0.0%) |
| 16 and 17 Years | 0 (0.0%) | 1 (100.0%) |
| 18 to 24 Years | 0 (0.0%) | 0 (0.0%) |
| 25 to 34 Years | 4 (100.0%) | 2 (40.0%) |
| 35 to 44 Years | 2 (100.0%) | 0 (0.0%) |
| 45 to 54 Years | 15 (93.8%) | 2 (66.7%) |
| 55 to 64 Years | 1 (50.0%) | 8 (88.9%) |
| 65 to 74 Years | 3 (100.0%) | 3 (75.0%) |
| 75 Years and over | 0 (0.0%) | 6 (100.0%) |
| Total | 26 (74.3%) | 23 (79.3%) |
Income Below Poverty Among Married-Couple Families in Grant
The poverty statistics for married-couple families in Grant show that 5.3% or 1 of the total 19 families live below the poverty line. Families with 1 or 2 children have the highest poverty rate of 25.0%, comprising of 1 families. On the other hand, families with no children have the lowest poverty rate of 0.0%, which includes 0 families.
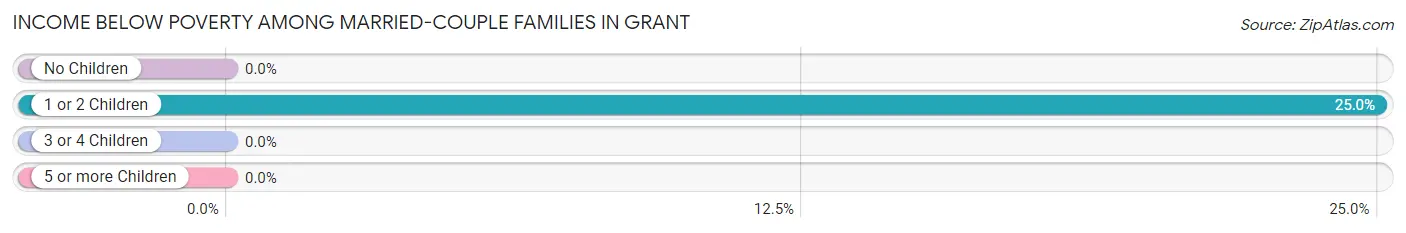
| Children | Above Poverty | Below Poverty |
| No Children | 15 (100.0%) | 0 (0.0%) |
| 1 or 2 Children | 3 (75.0%) | 1 (25.0%) |
| 3 or 4 Children | 0 (0.0%) | 0 (0.0%) |
| 5 or more Children | 0 (0.0%) | 0 (0.0%) |
| Total | 18 (94.7%) | 1 (5.3%) |
Income Below Poverty Among Single-Parent Households in Grant
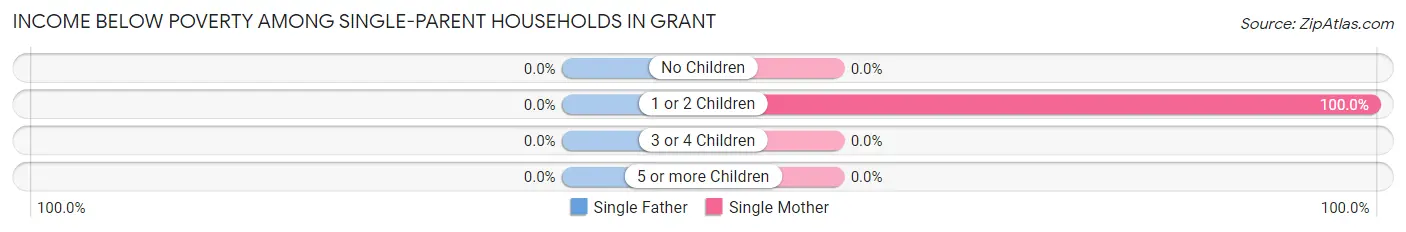
| Children | Single Father | Single Mother |
| No Children | 0 (0.0%) | 0 (0.0%) |
| 1 or 2 Children | 0 (0.0%) | 3 (100.0%) |
| 3 or 4 Children | 0 (0.0%) | 0 (0.0%) |
| 5 or more Children | 0 (0.0%) | 0 (0.0%) |
| Total | 0 (0.0%) | 3 (100.0%) |
Income Below Poverty Among Married-Couple vs Single-Parent Households in Grant
The poverty data for Grant shows that 1 of the married-couple family households (5.3%) and 3 of the single-parent households (100.0%) are living below the poverty level. Within the married-couple family households, those with 1 or 2 children have the highest poverty rate, with 1 households (25.0%) falling below the poverty line. Among the single-parent households, those with 1 or 2 children have the highest poverty rate, with 3 household (100.0%) living below poverty.
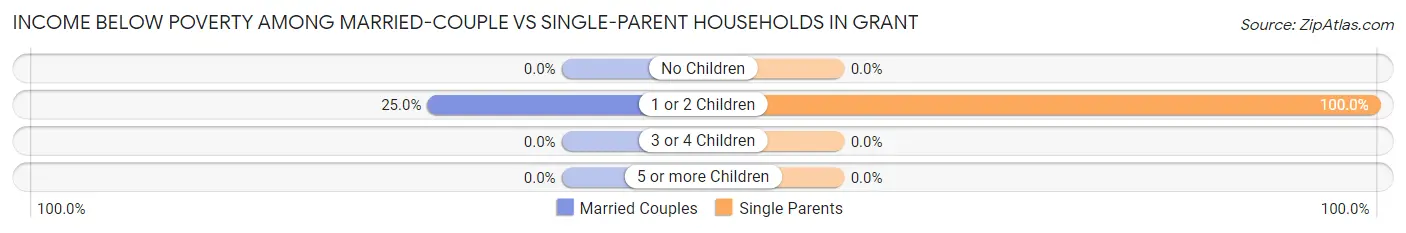
| Children | Married-Couple Families | Single-Parent Households |
| No Children | 0 (0.0%) | 0 (0.0%) |
| 1 or 2 Children | 1 (25.0%) | 3 (100.0%) |
| 3 or 4 Children | 0 (0.0%) | 0 (0.0%) |
| 5 or more Children | 0 (0.0%) | 0 (0.0%) |
| Total | 1 (5.3%) | 3 (100.0%) |
Race in Grant
The most populous races in Grant are White / Caucasian (61 | 95.3%), and Two or more Races (3 | 4.7%).
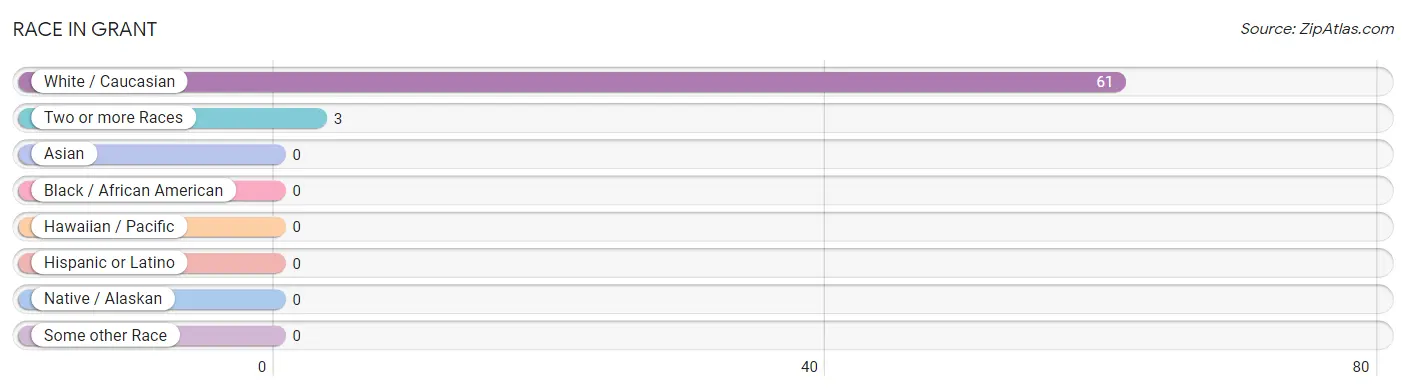
| Race | # Population | % Population |
| Asian | 0 | 0.0% |
| Black / African American | 0 | 0.0% |
| Hawaiian / Pacific | 0 | 0.0% |
| Hispanic or Latino | 0 | 0.0% |
| Native / Alaskan | 0 | 0.0% |
| White / Caucasian | 61 | 95.3% |
| Two or more Races | 3 | 4.7% |
| Some other Race | 0 | 0.0% |
| Total | 64 | 100.0% |
Ancestry in Grant
The most populous ancestries reported in Grant are German (15 | 23.4%), English (13 | 20.3%), Belgian (9 | 14.1%), Irish (9 | 14.1%), and American (8 | 12.5%), together accounting for 84.4% of all Grant residents.
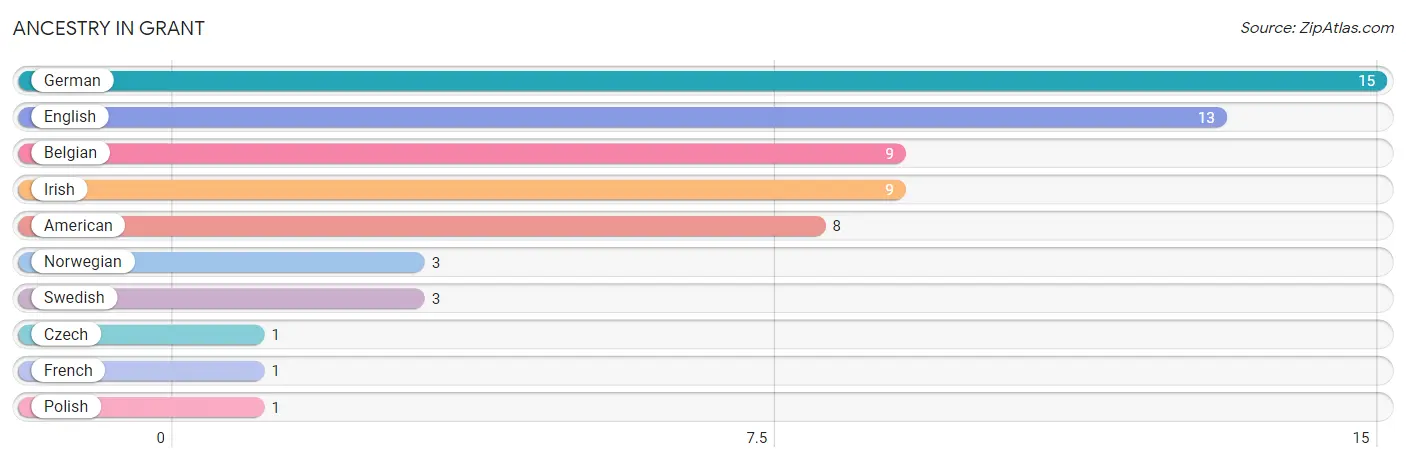
| Ancestry | # Population | % Population |
| American | 8 | 12.5% |
| Belgian | 9 | 14.1% |
| Czech | 1 | 1.6% |
| English | 13 | 20.3% |
| French | 1 | 1.6% |
| German | 15 | 23.4% |
| Irish | 9 | 14.1% |
| Norwegian | 3 | 4.7% |
| Polish | 1 | 1.6% |
| Swedish | 3 | 4.7% | View All 10 Rows |
Immigrants in Grant

| Immigration Origin | # Population | % Population | View All 0 Rows |
Sex and Age in Grant
Sex and Age in Grant
The most populous age groups in Grant are 50 to 54 Years (14 | 40.0%) for men and 55 to 59 Years (8 | 27.6%) for women.
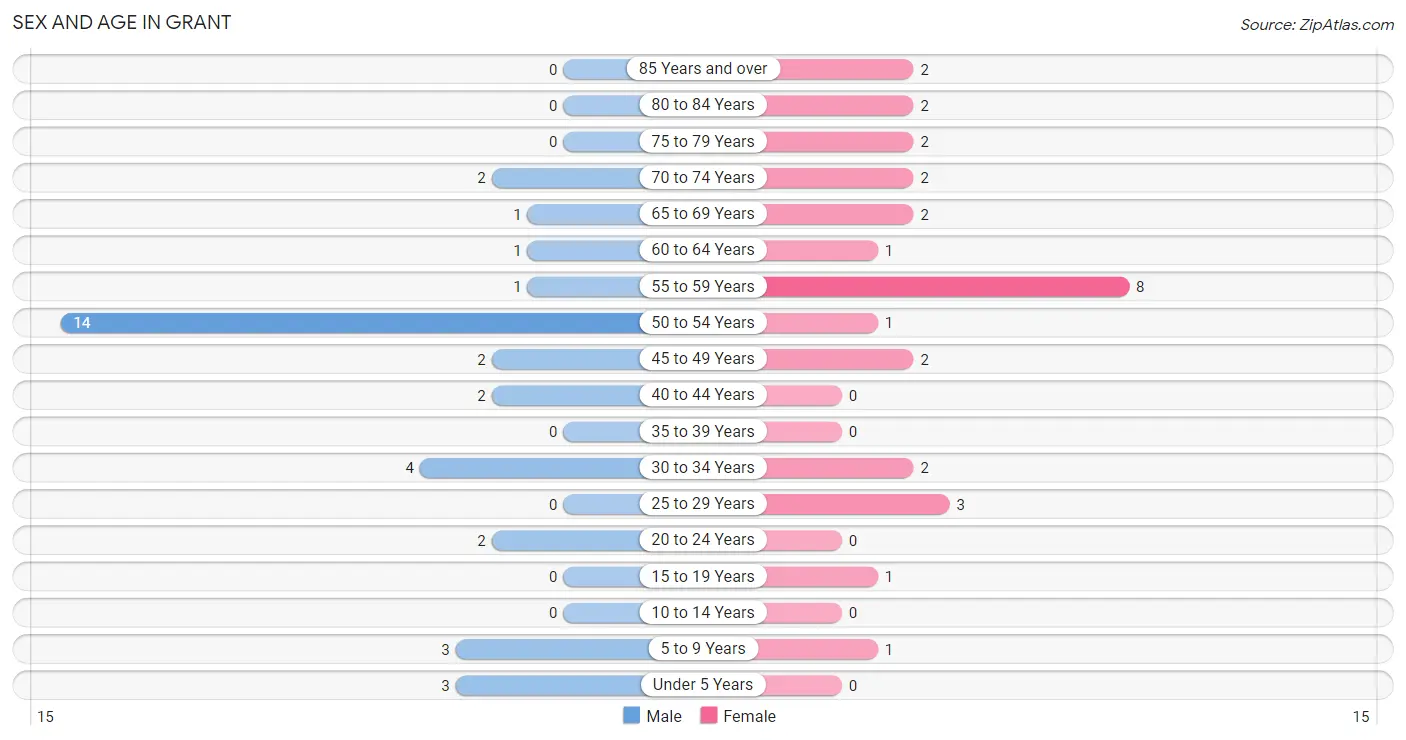
| Age Bracket | Male | Female |
| Under 5 Years | 3 (8.6%) | 0 (0.0%) |
| 5 to 9 Years | 3 (8.6%) | 1 (3.5%) |
| 10 to 14 Years | 0 (0.0%) | 0 (0.0%) |
| 15 to 19 Years | 0 (0.0%) | 1 (3.5%) |
| 20 to 24 Years | 2 (5.7%) | 0 (0.0%) |
| 25 to 29 Years | 0 (0.0%) | 3 (10.3%) |
| 30 to 34 Years | 4 (11.4%) | 2 (6.9%) |
| 35 to 39 Years | 0 (0.0%) | 0 (0.0%) |
| 40 to 44 Years | 2 (5.7%) | 0 (0.0%) |
| 45 to 49 Years | 2 (5.7%) | 2 (6.9%) |
| 50 to 54 Years | 14 (40.0%) | 1 (3.5%) |
| 55 to 59 Years | 1 (2.9%) | 8 (27.6%) |
| 60 to 64 Years | 1 (2.9%) | 1 (3.5%) |
| 65 to 69 Years | 1 (2.9%) | 2 (6.9%) |
| 70 to 74 Years | 2 (5.7%) | 2 (6.9%) |
| 75 to 79 Years | 0 (0.0%) | 2 (6.9%) |
| 80 to 84 Years | 0 (0.0%) | 2 (6.9%) |
| 85 Years and over | 0 (0.0%) | 2 (6.9%) |
| Total | 35 (100.0%) | 29 (100.0%) |
Families and Households in Grant
Median Family Size in Grant
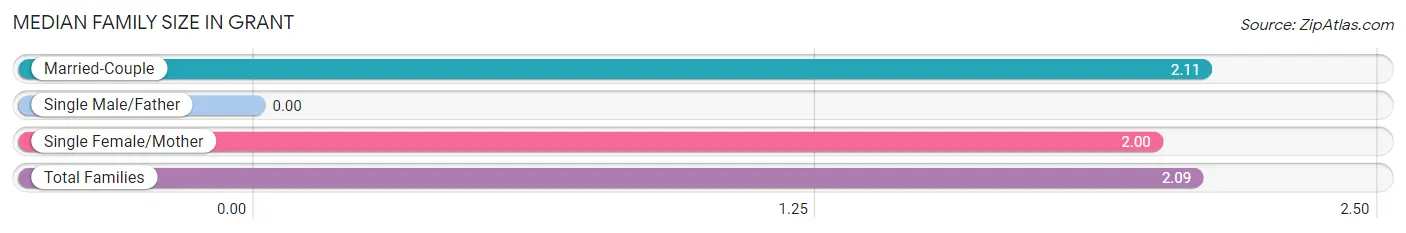
| Family Type | # Families | Family Size |
| Married-Couple | 19 (86.4%) | 2.11 |
| Single Male/Father | 0 (0.0%) | - |
| Single Female/Mother | 3 (13.6%) | 2.00 |
| Total Families | 22 (100.0%) | 2.09 |
Median Household Size in Grant
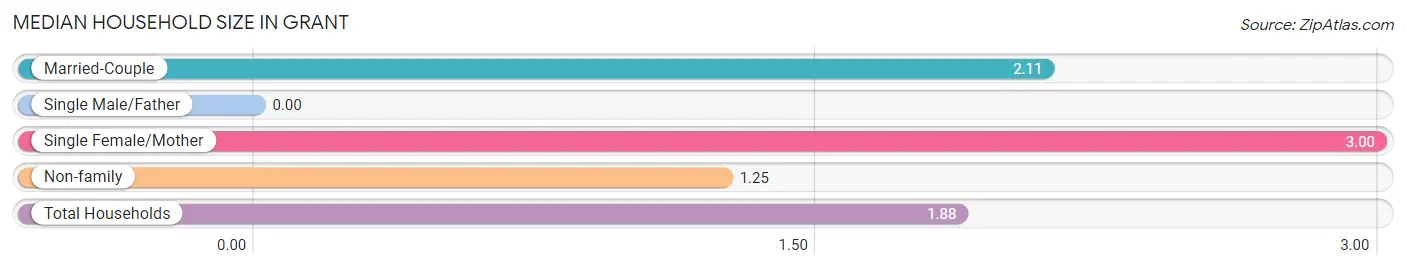
| Household Type | # Households | Household Size |
| Married-Couple | 19 (55.9%) | 2.11 |
| Single Male/Father | 0 (0.0%) | - |
| Single Female/Mother | 3 (8.8%) | 3.00 |
| Non-family | 12 (35.3%) | 1.25 |
| Total Households | 34 (100.0%) | 1.88 |
Household Size by Marriage Status in Grant
Out of a total of 34 households in Grant, 22 (64.7%) are family households, while 12 (35.3%) are nonfamily households. The most numerous type of family households are 2-person households, comprising 15, and the most common type of nonfamily households are 1-person households, comprising 9.
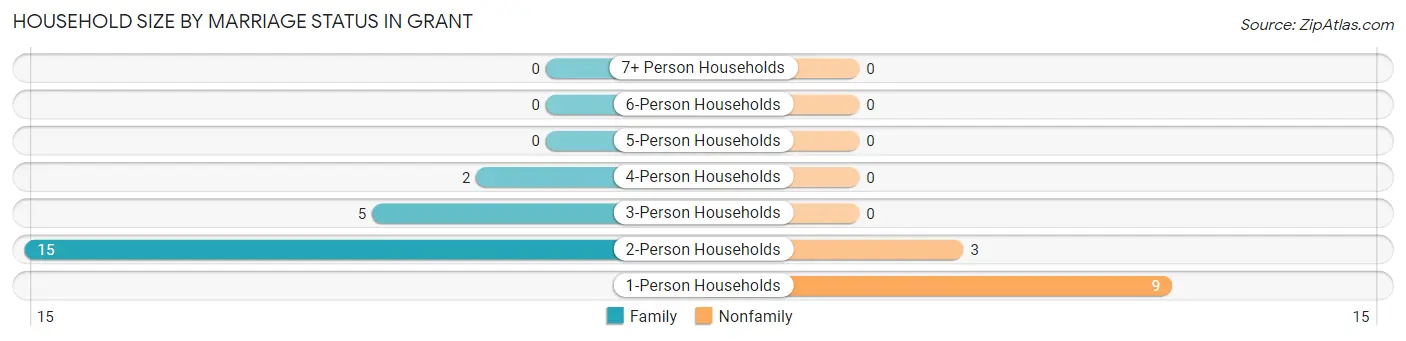
| Household Size | Family Households | Nonfamily Households |
| 1-Person Households | - | 9 (26.5%) |
| 2-Person Households | 15 (44.1%) | 3 (8.8%) |
| 3-Person Households | 5 (14.7%) | 0 (0.0%) |
| 4-Person Households | 2 (5.9%) | 0 (0.0%) |
| 5-Person Households | 0 (0.0%) | 0 (0.0%) |
| 6-Person Households | 0 (0.0%) | 0 (0.0%) |
| 7+ Person Households | 0 (0.0%) | 0 (0.0%) |
| Total | 22 (64.7%) | 12 (35.3%) |
Female Fertility in Grant
Fertility by Age in Grant
| Age Bracket | Women with Births | Births / 1,000 Women |
| 15 to 19 years | 0 (0.0%) | 0.0 |
| 20 to 34 years | 0 (0.0%) | 0.0 |
| 35 to 50 years | 0 (0.0%) | 0.0 |
| Total | 0 (0.0%) | 0.0 |
Fertility by Age by Marriage Status in Grant
| Age Bracket | Married | Unmarried |
| 15 to 19 years | 0 (0.0%) | 0 (0.0%) |
| 20 to 34 years | 0 (0.0%) | 0 (0.0%) |
| 35 to 50 years | 0 (0.0%) | 0 (0.0%) |
| Total | 0 (0.0%) | 0 (0.0%) |
Fertility by Education in Grant
| Educational Attainment | Women with Births | Births / 1,000 Women |
| Less than High School | 0 (0.0%) | 0.0 |
| High School Diploma | 0 (0.0%) | 0.0 |
| College or Associate's Degree | 0 (0.0%) | 0.0 |
| Bachelor's Degree | 0 (0.0%) | 0.0 |
| Graduate Degree | 0 (0.0%) | 0.0 |
| Total | 0 (0.0%) | 0.0 |
Fertility by Education by Marriage Status in Grant
| Educational Attainment | Married | Unmarried |
| Less than High School | 0 (0.0%) | 0 (0.0%) |
| High School Diploma | 0 (0.0%) | 0 (0.0%) |
| College or Associate's Degree | 0 (0.0%) | 0 (0.0%) |
| Bachelor's Degree | 0 (0.0%) | 0 (0.0%) |
| Graduate Degree | 0 (0.0%) | 0 (0.0%) |
| Total | 0 (0.0%) | 0 (0.0%) |
Employment Characteristics in Grant
Employment by Class of Employer in Grant
Among the 23 employed individuals in Grant, private company employees (16 | 69.6%), self-employed (not incorporated) (3 | 13.0%), and local government employees (3 | 13.0%) make up the most common classes of employment.
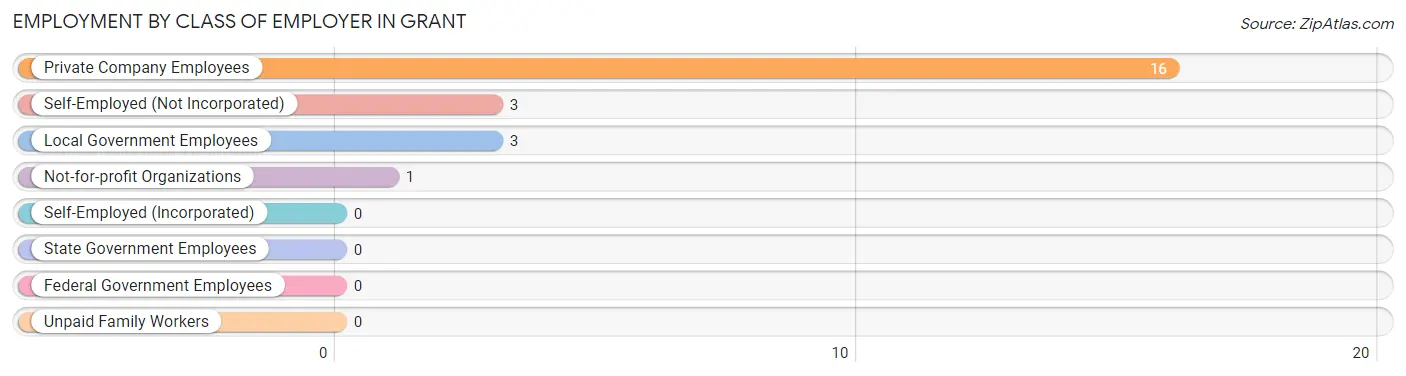
| Employer Class | # Employees | % Employees |
| Private Company Employees | 16 | 69.6% |
| Self-Employed (Incorporated) | 0 | 0.0% |
| Self-Employed (Not Incorporated) | 3 | 13.0% |
| Not-for-profit Organizations | 1 | 4.3% |
| Local Government Employees | 3 | 13.0% |
| State Government Employees | 0 | 0.0% |
| Federal Government Employees | 0 | 0.0% |
| Unpaid Family Workers | 0 | 0.0% |
| Total | 23 | 100.0% |
Employment Status by Age in Grant
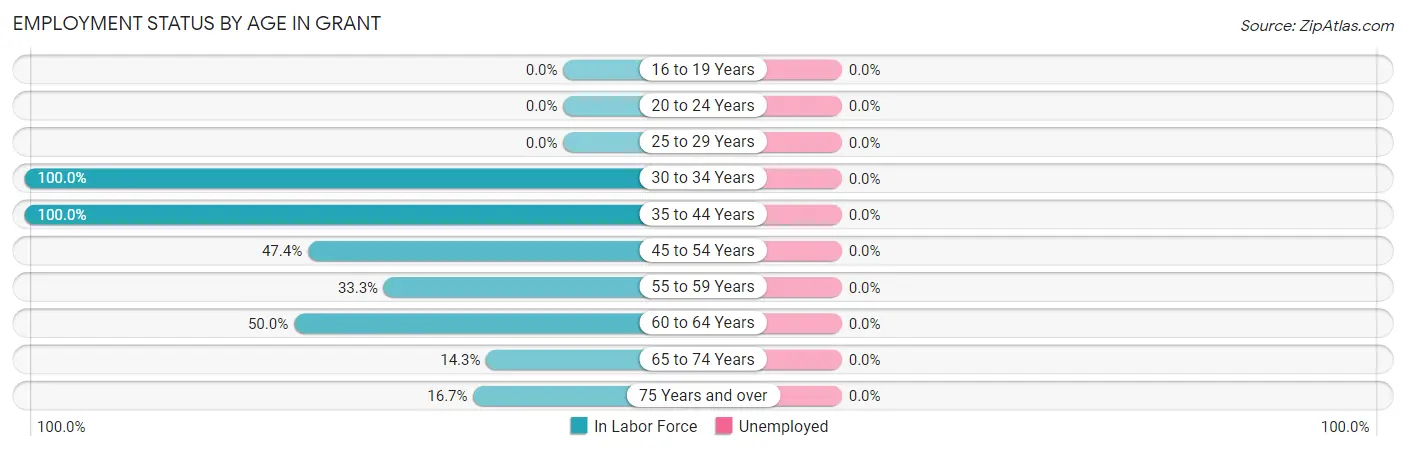
| Age Bracket | In Labor Force | Unemployed |
| 16 to 19 Years | 0 (0.0%) | 0 (0.0%) |
| 20 to 24 Years | 0 (0.0%) | 0 (0.0%) |
| 25 to 29 Years | 0 (0.0%) | 0 (0.0%) |
| 30 to 34 Years | 6 (100.0%) | 0 (0.0%) |
| 35 to 44 Years | 2 (100.0%) | 0 (0.0%) |
| 45 to 54 Years | 9 (47.4%) | 0 (0.0%) |
| 55 to 59 Years | 3 (33.3%) | 0 (0.0%) |
| 60 to 64 Years | 1 (50.0%) | 0 (0.0%) |
| 65 to 74 Years | 1 (14.3%) | 0 (0.0%) |
| 75 Years and over | 1 (16.7%) | 0 (0.0%) |
| Total | 23 (40.4%) | 0 (0.0%) |
Employment Status by Educational Attainment in Grant
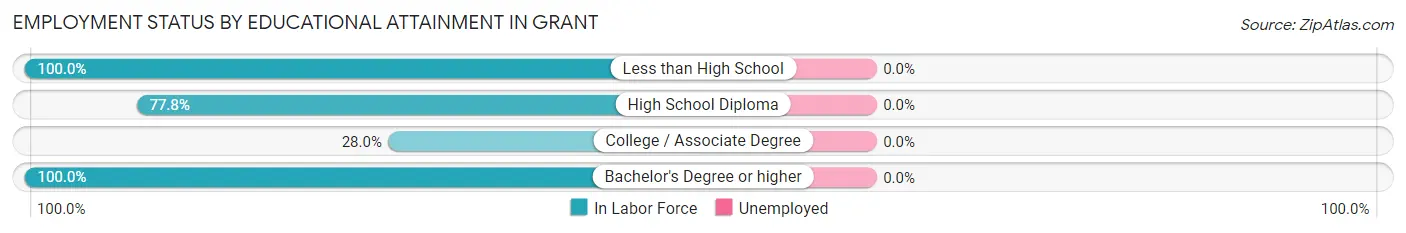
| Educational Attainment | In Labor Force | Unemployed |
| Less than High School | 4 (100.0%) | 0 (0.0%) |
| High School Diploma | 7 (77.8%) | 0 (0.0%) |
| College / Associate Degree | 7 (28.0%) | 0 (0.0%) |
| Bachelor's Degree or higher | 3 (100.0%) | 0 (0.0%) |
| Total | 21 (51.2%) | 0 (0.0%) |
Employment Occupations by Sex in Grant
Management, Business, Science and Arts Occupations
The most common Management, Business, Science and Arts occupations in Grant are Business & Financial (5 | 21.7%), Community & Social Service (2 | 8.7%), Education, Arts & Media (1 | 4.3%), and Arts, Media & Entertainment (1 | 4.3%).
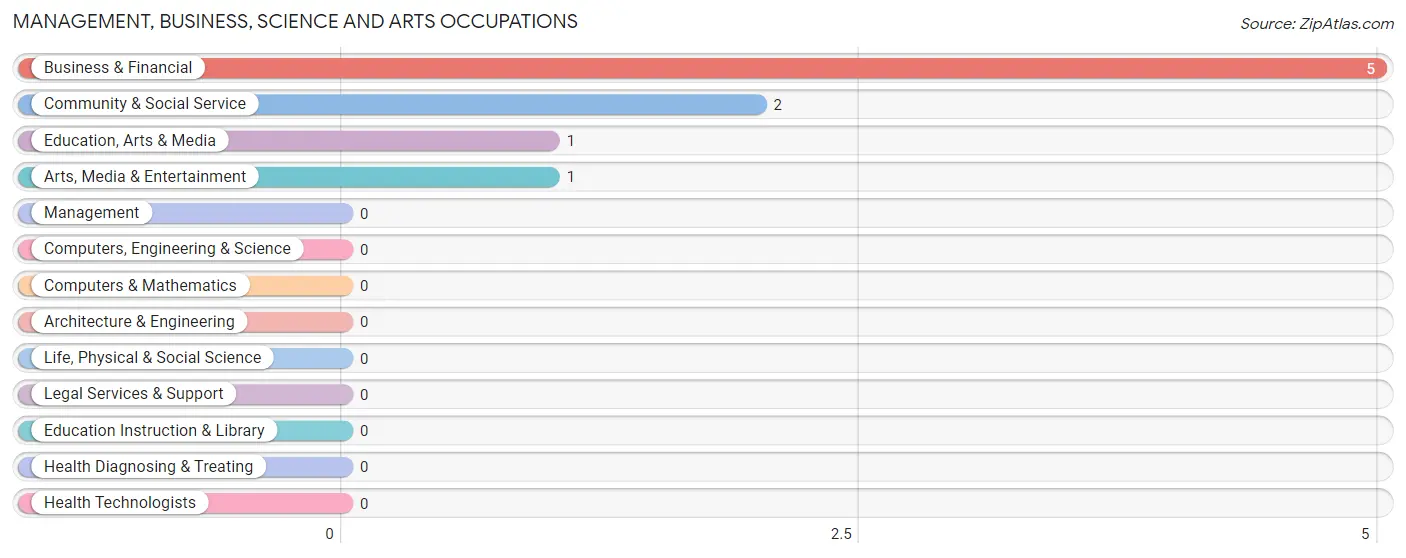
Management, Business, Science and Arts Occupations by Sex
Within the Management, Business, Science and Arts occupations in Grant, the most male-oriented occupations are Arts, Media & Entertainment (100.0%), Business & Financial (60.0%), and Community & Social Service (50.0%), while the most female-oriented occupations are Education, Arts & Media (100.0%), Community & Social Service (50.0%), and Business & Financial (40.0%).
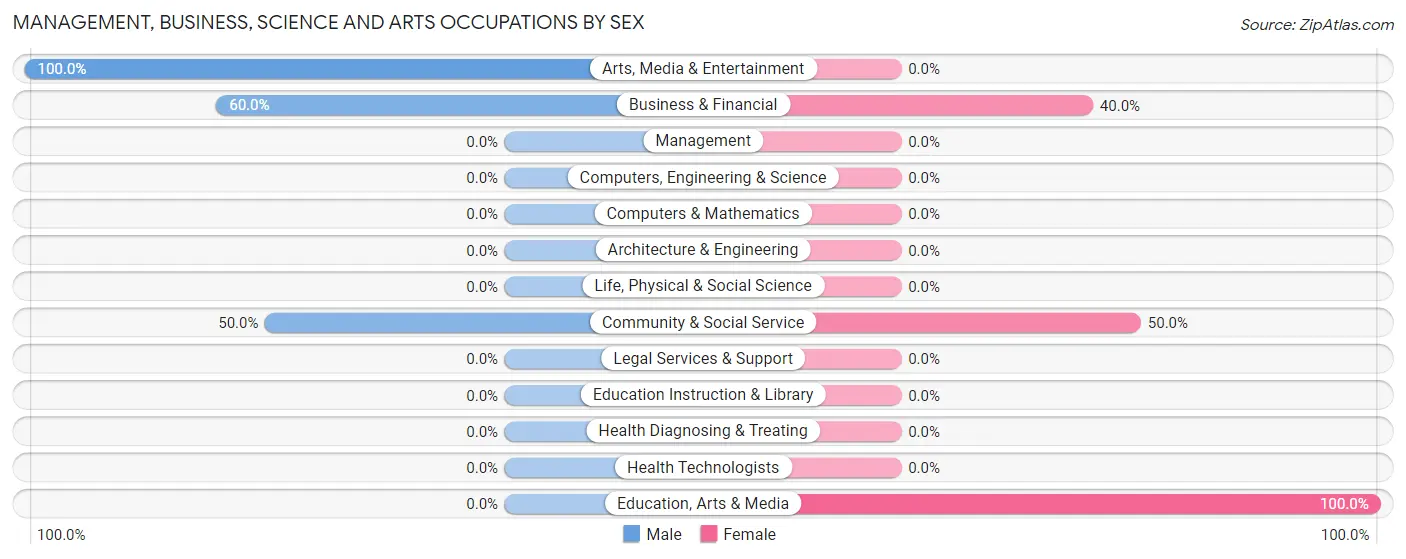
| Occupation | Male | Female |
| Management | 0 (0.0%) | 0 (0.0%) |
| Business & Financial | 3 (60.0%) | 2 (40.0%) |
| Computers, Engineering & Science | 0 (0.0%) | 0 (0.0%) |
| Computers & Mathematics | 0 (0.0%) | 0 (0.0%) |
| Architecture & Engineering | 0 (0.0%) | 0 (0.0%) |
| Life, Physical & Social Science | 0 (0.0%) | 0 (0.0%) |
| Community & Social Service | 1 (50.0%) | 1 (50.0%) |
| Education, Arts & Media | 0 (0.0%) | 1 (100.0%) |
| Legal Services & Support | 0 (0.0%) | 0 (0.0%) |
| Education Instruction & Library | 0 (0.0%) | 0 (0.0%) |
| Arts, Media & Entertainment | 1 (100.0%) | 0 (0.0%) |
| Health Diagnosing & Treating | 0 (0.0%) | 0 (0.0%) |
| Health Technologists | 0 (0.0%) | 0 (0.0%) |
| Total (Category) | 4 (57.1%) | 3 (42.9%) |
| Total (Overall) | 14 (60.9%) | 9 (39.1%) |
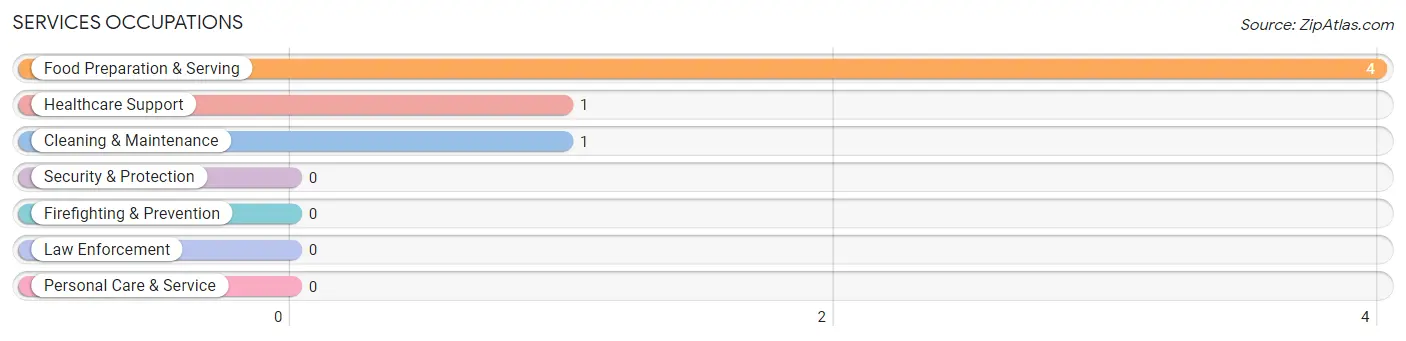
Services Occupations
The most common Services occupations in Grant are Food Preparation & Serving (4 | 17.4%), Healthcare Support (1 | 4.3%), and Cleaning & Maintenance (1 | 4.3%).
Services Occupations by Sex
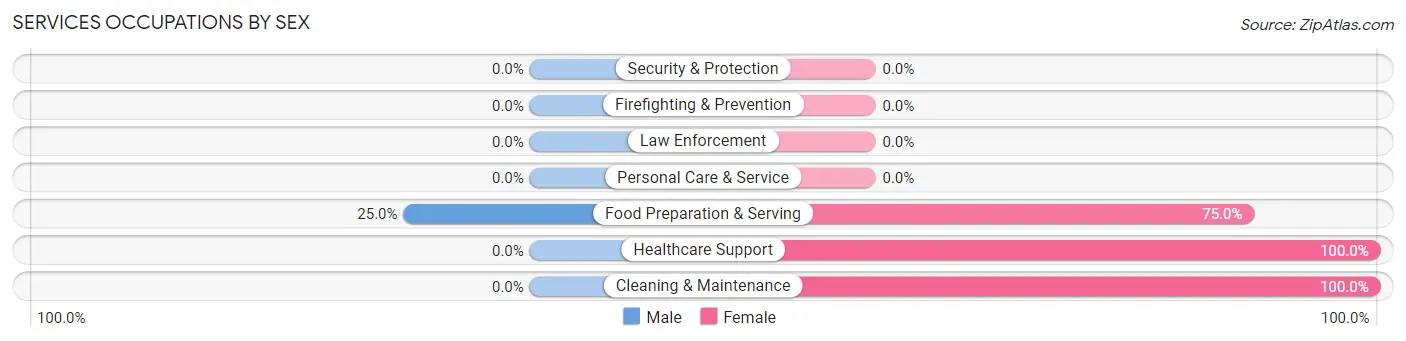
| Occupation | Male | Female |
| Healthcare Support | 0 (0.0%) | 1 (100.0%) |
| Security & Protection | 0 (0.0%) | 0 (0.0%) |
| Firefighting & Prevention | 0 (0.0%) | 0 (0.0%) |
| Law Enforcement | 0 (0.0%) | 0 (0.0%) |
| Food Preparation & Serving | 1 (25.0%) | 3 (75.0%) |
| Cleaning & Maintenance | 0 (0.0%) | 1 (100.0%) |
| Personal Care & Service | 0 (0.0%) | 0 (0.0%) |
| Total (Category) | 1 (16.7%) | 5 (83.3%) |
| Total (Overall) | 14 (60.9%) | 9 (39.1%) |
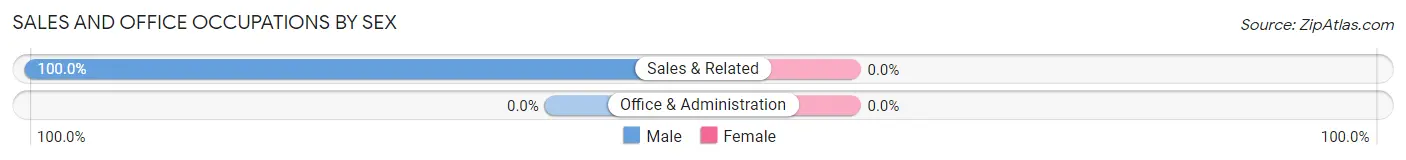
Sales and Office Occupations
The most common Sales and Office occupations in Grant are , and Sales & Related (5 | 21.7%).
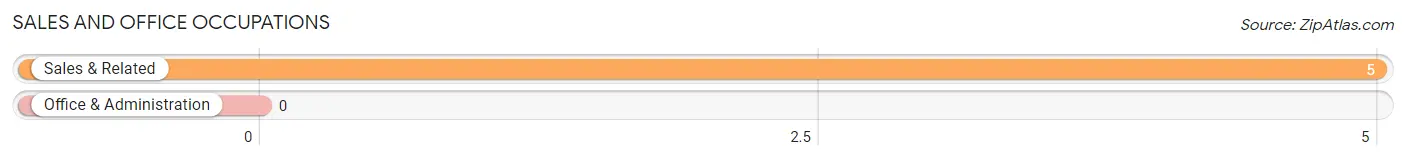
Sales and Office Occupations by Sex
| Occupation | Male | Female |
| Sales & Related | 5 (100.0%) | 0 (0.0%) |
| Office & Administration | 0 (0.0%) | 0 (0.0%) |
| Total (Category) | 5 (100.0%) | 0 (0.0%) |
| Total (Overall) | 14 (60.9%) | 9 (39.1%) |
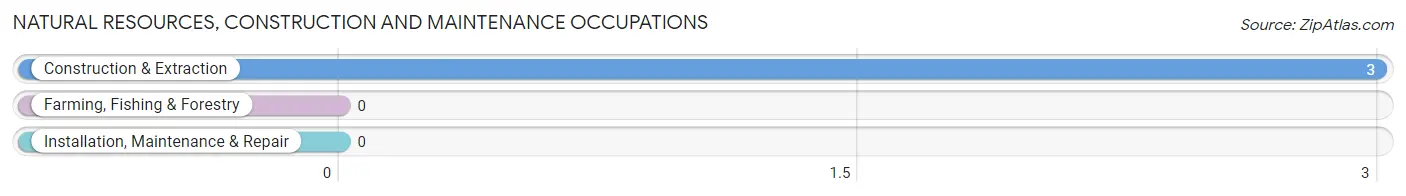
Natural Resources, Construction and Maintenance Occupations
The most common Natural Resources, Construction and Maintenance occupations in Grant are , and Construction & Extraction (3 | 13.0%).
Natural Resources, Construction and Maintenance Occupations by Sex
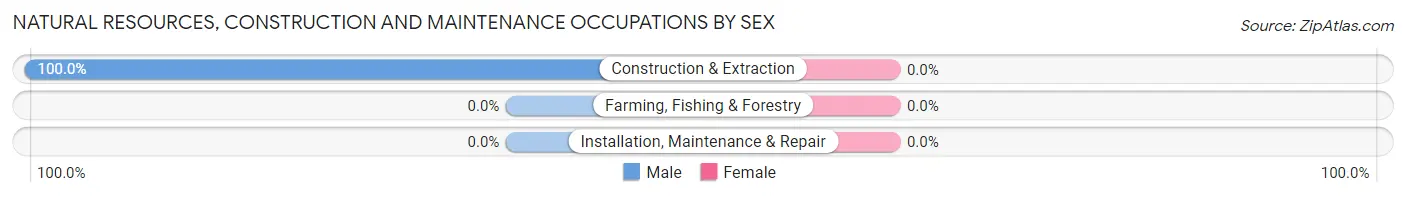
| Occupation | Male | Female |
| Farming, Fishing & Forestry | 0 (0.0%) | 0 (0.0%) |
| Construction & Extraction | 3 (100.0%) | 0 (0.0%) |
| Installation, Maintenance & Repair | 0 (0.0%) | 0 (0.0%) |
| Total (Category) | 3 (100.0%) | 0 (0.0%) |
| Total (Overall) | 14 (60.9%) | 9 (39.1%) |
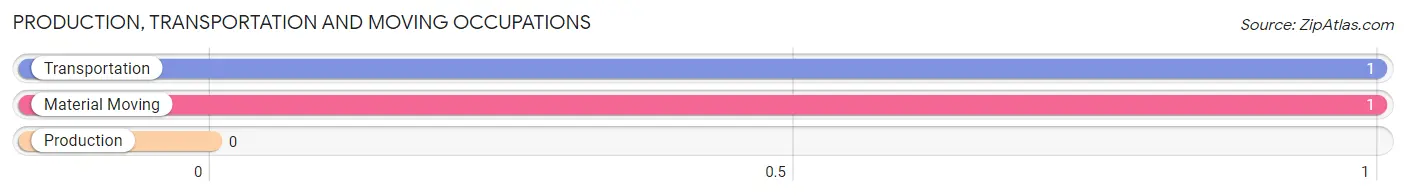
Production, Transportation and Moving Occupations
The most common Production, Transportation and Moving occupations in Grant are Transportation (1 | 4.3%), and Material Moving (1 | 4.3%).
Production, Transportation and Moving Occupations by Sex
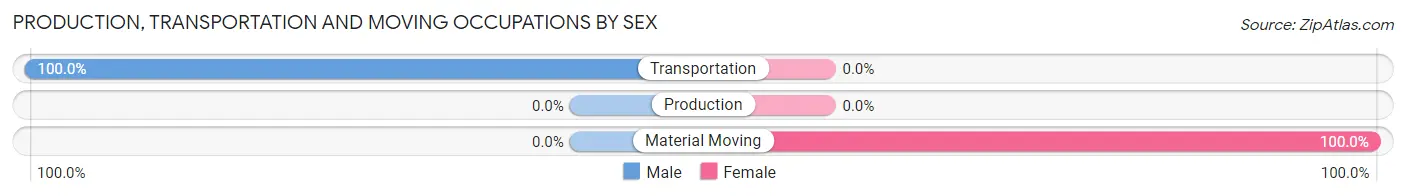
| Occupation | Male | Female |
| Production | 0 (0.0%) | 0 (0.0%) |
| Transportation | 1 (100.0%) | 0 (0.0%) |
| Material Moving | 0 (0.0%) | 1 (100.0%) |
| Total (Category) | 1 (50.0%) | 1 (50.0%) |
| Total (Overall) | 14 (60.9%) | 9 (39.1%) |
Employment Industries by Sex in Grant
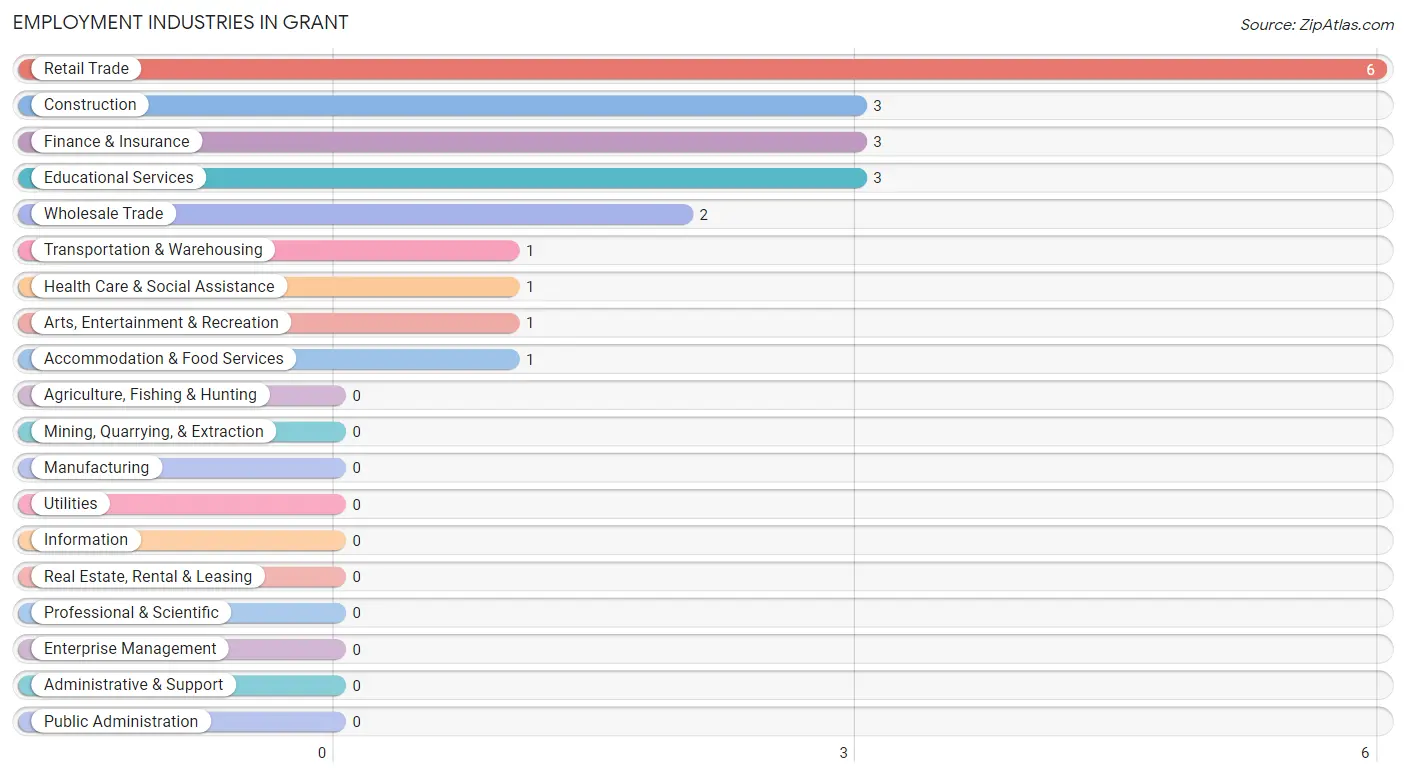
Employment Industries in Grant
The major employment industries in Grant include Retail Trade (6 | 26.1%), Construction (3 | 13.0%), Finance & Insurance (3 | 13.0%), Educational Services (3 | 13.0%), and Wholesale Trade (2 | 8.7%).
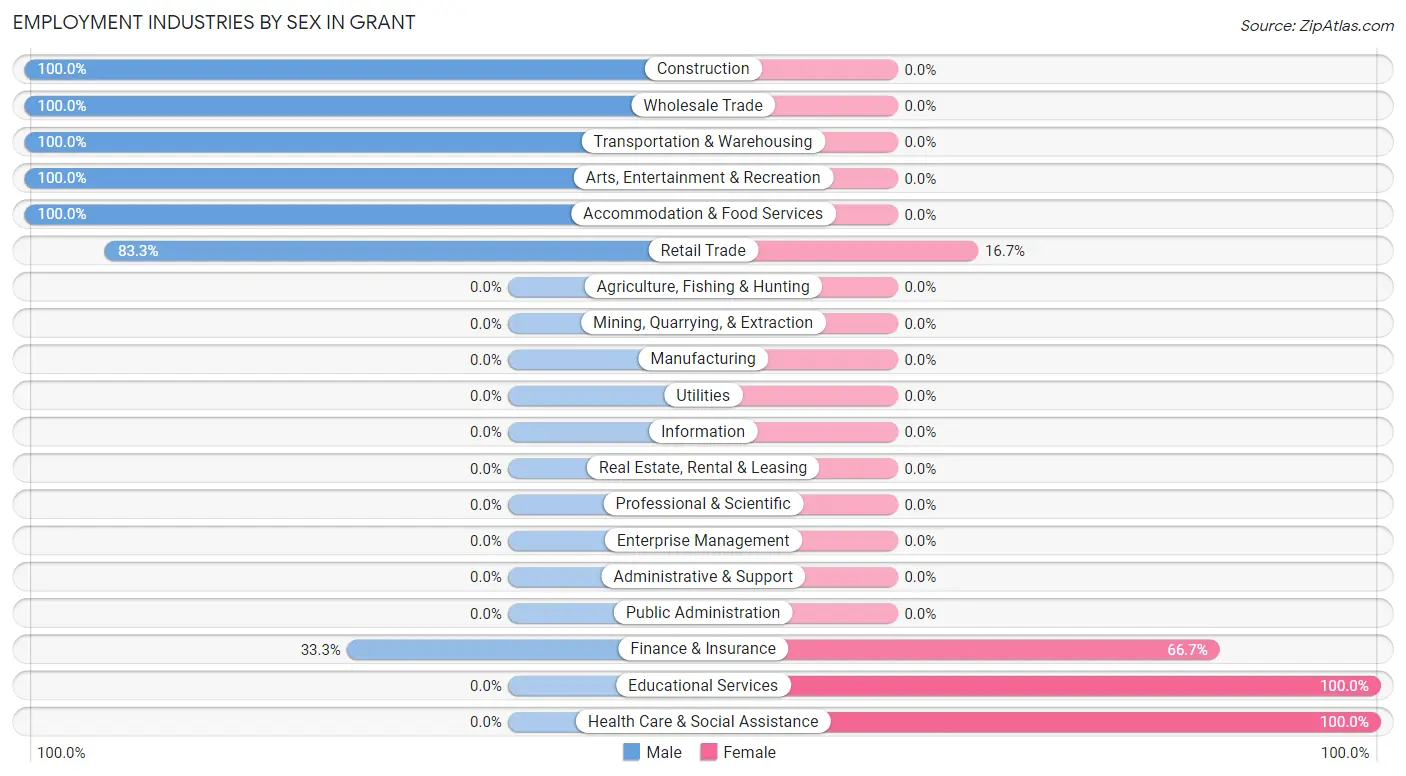
Employment Industries by Sex in Grant
The Grant industries that see more men than women are Construction (100.0%), Wholesale Trade (100.0%), and Transportation & Warehousing (100.0%), whereas the industries that tend to have a higher number of women are Educational Services (100.0%), Health Care & Social Assistance (100.0%), and Finance & Insurance (66.7%).
| Industry | Male | Female |
| Agriculture, Fishing & Hunting | 0 (0.0%) | 0 (0.0%) |
| Mining, Quarrying, & Extraction | 0 (0.0%) | 0 (0.0%) |
| Construction | 3 (100.0%) | 0 (0.0%) |
| Manufacturing | 0 (0.0%) | 0 (0.0%) |
| Wholesale Trade | 2 (100.0%) | 0 (0.0%) |
| Retail Trade | 5 (83.3%) | 1 (16.7%) |
| Transportation & Warehousing | 1 (100.0%) | 0 (0.0%) |
| Utilities | 0 (0.0%) | 0 (0.0%) |
| Information | 0 (0.0%) | 0 (0.0%) |
| Finance & Insurance | 1 (33.3%) | 2 (66.7%) |
| Real Estate, Rental & Leasing | 0 (0.0%) | 0 (0.0%) |
| Professional & Scientific | 0 (0.0%) | 0 (0.0%) |
| Enterprise Management | 0 (0.0%) | 0 (0.0%) |
| Administrative & Support | 0 (0.0%) | 0 (0.0%) |
| Educational Services | 0 (0.0%) | 3 (100.0%) |
| Health Care & Social Assistance | 0 (0.0%) | 1 (100.0%) |
| Arts, Entertainment & Recreation | 1 (100.0%) | 0 (0.0%) |
| Accommodation & Food Services | 1 (100.0%) | 0 (0.0%) |
| Public Administration | 0 (0.0%) | 0 (0.0%) |
| Total | 14 (60.9%) | 9 (39.1%) |
Education in Grant
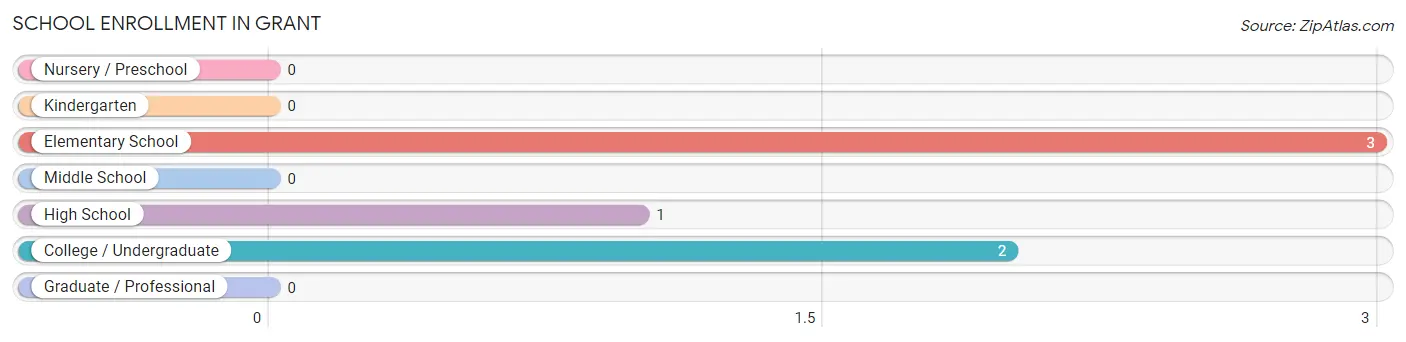
School Enrollment in Grant
The most common levels of schooling among the 6 students in Grant are elementary school (3 | 50.0%), college / undergraduate (2 | 33.3%), and high school (1 | 16.7%).
| School Level | # Students | % Students |
| Nursery / Preschool | 0 | 0.0% |
| Kindergarten | 0 | 0.0% |
| Elementary School | 3 | 50.0% |
| Middle School | 0 | 0.0% |
| High School | 1 | 16.7% |
| College / Undergraduate | 2 | 33.3% |
| Graduate / Professional | 0 | 0.0% |
| Total | 6 | 100.0% |
School Enrollment by Age by Funding Source in Grant
Out of a total of 6 students who are enrolled in schools in Grant, 4 (66.7%) attend a private institution, while the remaining 2 (33.3%) are enrolled in public schools. The age group of 5 to 9 year old has the highest likelihood of being enrolled in private schools, with 3 (100.0% in the age bracket) enrolled. Conversely, the age group of 20 to 24 year olds has the lowest likelihood of being enrolled in a private school, with 2 (100.0% in the age bracket) attending a public institution.
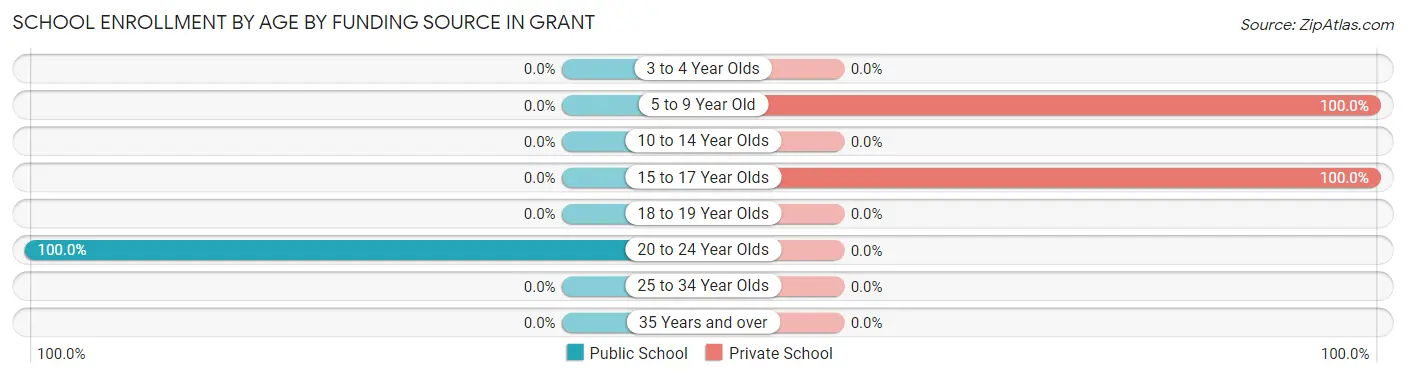
| Age Bracket | Public School | Private School |
| 3 to 4 Year Olds | 0 (0.0%) | 0 (0.0%) |
| 5 to 9 Year Old | 0 (0.0%) | 3 (100.0%) |
| 10 to 14 Year Olds | 0 (0.0%) | 0 (0.0%) |
| 15 to 17 Year Olds | 0 (0.0%) | 1 (100.0%) |
| 18 to 19 Year Olds | 0 (0.0%) | 0 (0.0%) |
| 20 to 24 Year Olds | 2 (100.0%) | 0 (0.0%) |
| 25 to 34 Year Olds | 0 (0.0%) | 0 (0.0%) |
| 35 Years and over | 0 (0.0%) | 0 (0.0%) |
| Total | 2 (33.3%) | 4 (66.7%) |
Educational Attainment by Field of Study in Grant
Psychology (2 | 33.3%), business (2 | 33.3%), and arts & humanities (2 | 33.3%) are the most common fields of study among 6 individuals in Grant who have obtained a bachelor's degree or higher.
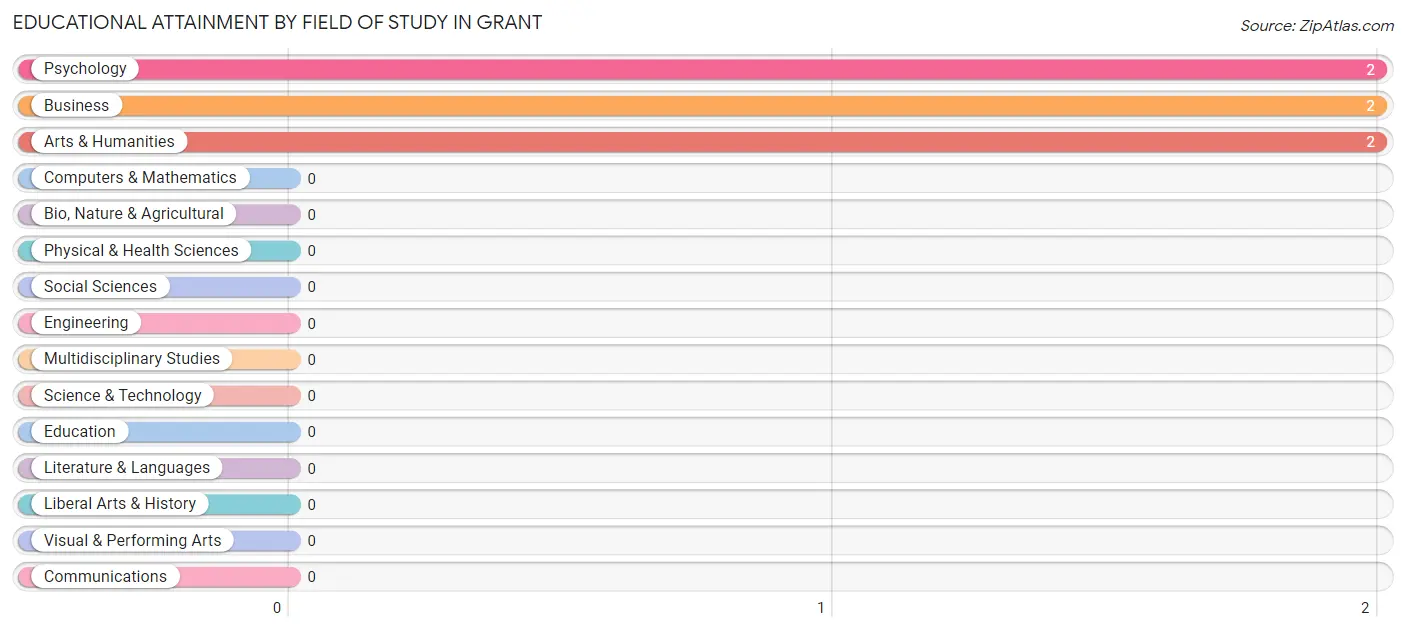
| Field of Study | # Graduates | % Graduates |
| Computers & Mathematics | 0 | 0.0% |
| Bio, Nature & Agricultural | 0 | 0.0% |
| Physical & Health Sciences | 0 | 0.0% |
| Psychology | 2 | 33.3% |
| Social Sciences | 0 | 0.0% |
| Engineering | 0 | 0.0% |
| Multidisciplinary Studies | 0 | 0.0% |
| Science & Technology | 0 | 0.0% |
| Business | 2 | 33.3% |
| Education | 0 | 0.0% |
| Literature & Languages | 0 | 0.0% |
| Liberal Arts & History | 0 | 0.0% |
| Visual & Performing Arts | 0 | 0.0% |
| Communications | 0 | 0.0% |
| Arts & Humanities | 2 | 33.3% |
| Total | 6 | 100.0% |
Transportation & Commute in Grant
Vehicle Availability by Sex in Grant
The most prevalent vehicle ownership categories in Grant are males with 1 vehicle (6, accounting for 42.9%) and females with 1 vehicle (1, making up 66.7%).
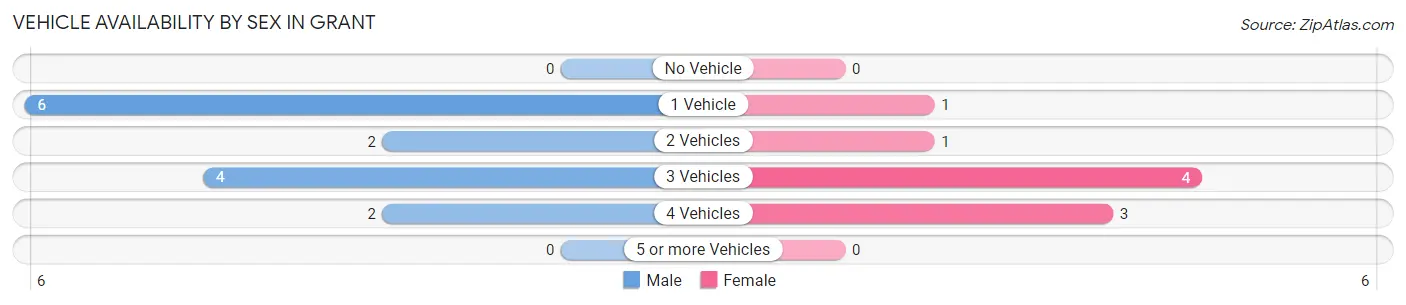
| Vehicles Available | Male | Female |
| No Vehicle | 0 (0.0%) | 0 (0.0%) |
| 1 Vehicle | 6 (42.9%) | 1 (11.1%) |
| 2 Vehicles | 2 (14.3%) | 1 (11.1%) |
| 3 Vehicles | 4 (28.6%) | 4 (44.4%) |
| 4 Vehicles | 2 (14.3%) | 3 (33.3%) |
| 5 or more Vehicles | 0 (0.0%) | 0 (0.0%) |
| Total | 14 (100.0%) | 9 (100.0%) |
Commute Time in Grant
The most frequently occuring commute durations in Grant are 60 to 89 minutes (7 commuters, 30.4%), 20 to 24 minutes (6 commuters, 26.1%), and 30 to 34 minutes (3 commuters, 13.0%).
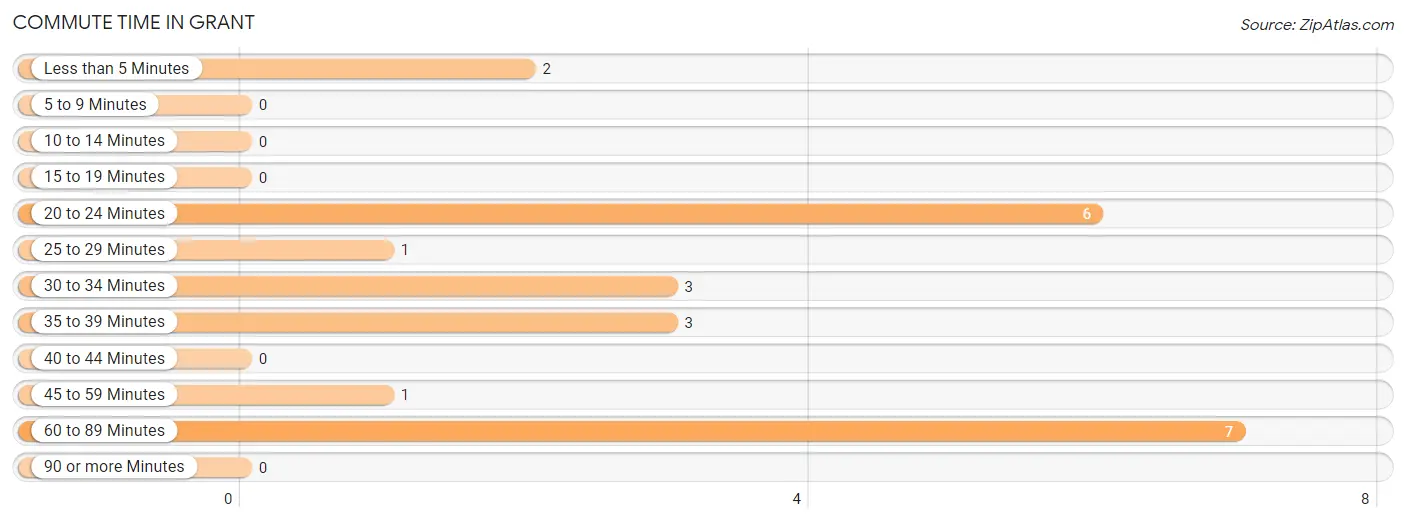
| Commute Time | # Commuters | % Commuters |
| Less than 5 Minutes | 2 | 8.7% |
| 5 to 9 Minutes | 0 | 0.0% |
| 10 to 14 Minutes | 0 | 0.0% |
| 15 to 19 Minutes | 0 | 0.0% |
| 20 to 24 Minutes | 6 | 26.1% |
| 25 to 29 Minutes | 1 | 4.3% |
| 30 to 34 Minutes | 3 | 13.0% |
| 35 to 39 Minutes | 3 | 13.0% |
| 40 to 44 Minutes | 0 | 0.0% |
| 45 to 59 Minutes | 1 | 4.3% |
| 60 to 89 Minutes | 7 | 30.4% |
| 90 or more Minutes | 0 | 0.0% |
Commute Time by Sex in Grant
The most common commute times in Grant are 60 to 89 minutes (6 commuters, 42.9%) for males and 30 to 34 minutes (3 commuters, 33.3%) for females.
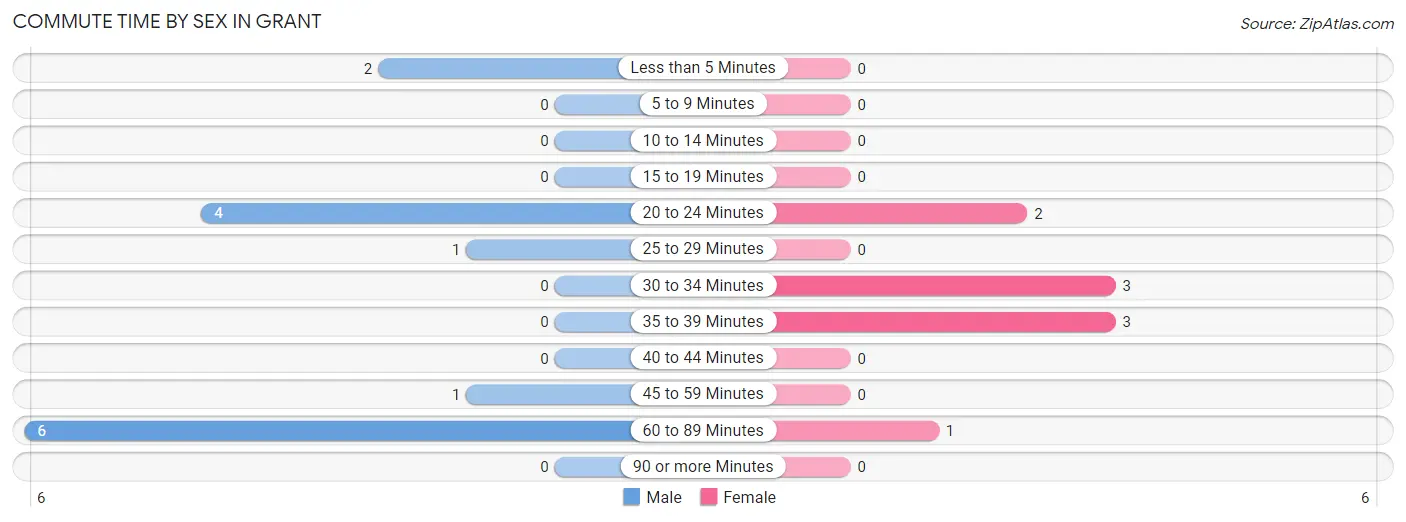
| Commute Time | Male | Female |
| Less than 5 Minutes | 2 (14.3%) | 0 (0.0%) |
| 5 to 9 Minutes | 0 (0.0%) | 0 (0.0%) |
| 10 to 14 Minutes | 0 (0.0%) | 0 (0.0%) |
| 15 to 19 Minutes | 0 (0.0%) | 0 (0.0%) |
| 20 to 24 Minutes | 4 (28.6%) | 2 (22.2%) |
| 25 to 29 Minutes | 1 (7.1%) | 0 (0.0%) |
| 30 to 34 Minutes | 0 (0.0%) | 3 (33.3%) |
| 35 to 39 Minutes | 0 (0.0%) | 3 (33.3%) |
| 40 to 44 Minutes | 0 (0.0%) | 0 (0.0%) |
| 45 to 59 Minutes | 1 (7.1%) | 0 (0.0%) |
| 60 to 89 Minutes | 6 (42.9%) | 1 (11.1%) |
| 90 or more Minutes | 0 (0.0%) | 0 (0.0%) |
Time of Departure to Work by Sex in Grant
The most frequent times of departure to work in Grant are 5:00 AM to 5:29 AM (4, 28.6%) for males and 5:30 AM to 5:59 AM (3, 33.3%) for females.
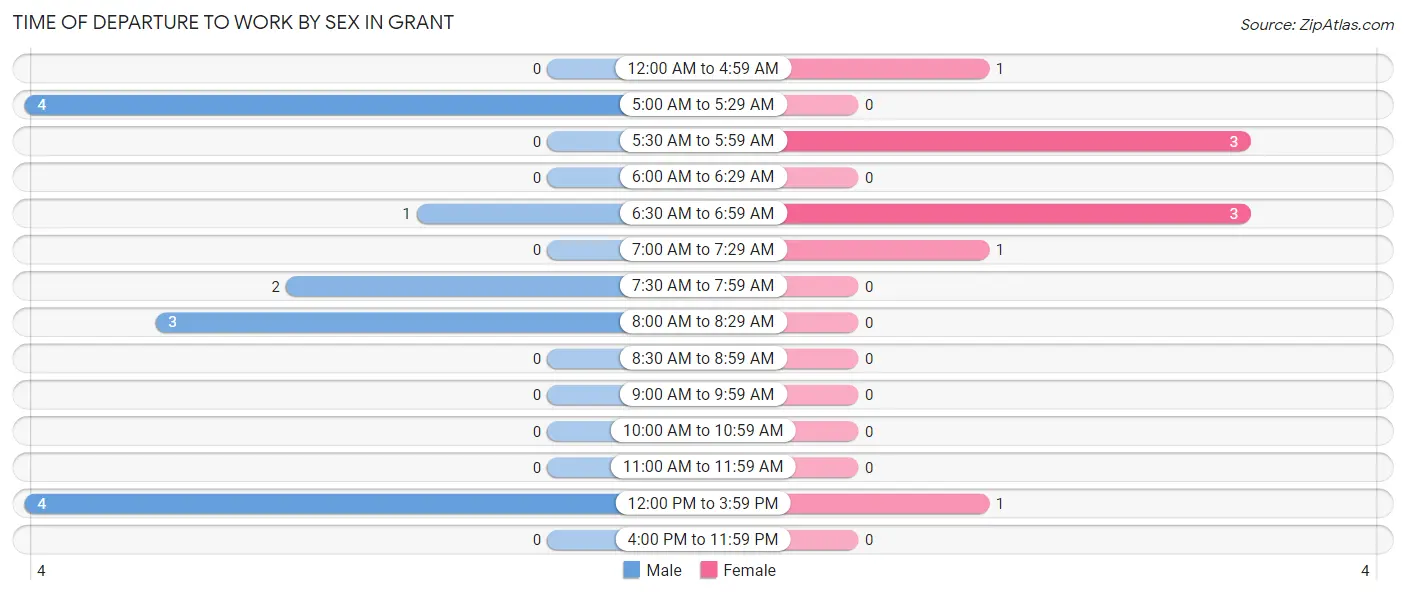
| Time of Departure | Male | Female |
| 12:00 AM to 4:59 AM | 0 (0.0%) | 1 (11.1%) |
| 5:00 AM to 5:29 AM | 4 (28.6%) | 0 (0.0%) |
| 5:30 AM to 5:59 AM | 0 (0.0%) | 3 (33.3%) |
| 6:00 AM to 6:29 AM | 0 (0.0%) | 0 (0.0%) |
| 6:30 AM to 6:59 AM | 1 (7.1%) | 3 (33.3%) |
| 7:00 AM to 7:29 AM | 0 (0.0%) | 1 (11.1%) |
| 7:30 AM to 7:59 AM | 2 (14.3%) | 0 (0.0%) |
| 8:00 AM to 8:29 AM | 3 (21.4%) | 0 (0.0%) |
| 8:30 AM to 8:59 AM | 0 (0.0%) | 0 (0.0%) |
| 9:00 AM to 9:59 AM | 0 (0.0%) | 0 (0.0%) |
| 10:00 AM to 10:59 AM | 0 (0.0%) | 0 (0.0%) |
| 11:00 AM to 11:59 AM | 0 (0.0%) | 0 (0.0%) |
| 12:00 PM to 3:59 PM | 4 (28.6%) | 1 (11.1%) |
| 4:00 PM to 11:59 PM | 0 (0.0%) | 0 (0.0%) |
| Total | 14 (100.0%) | 9 (100.0%) |
Housing Occupancy in Grant
Occupancy by Ownership in Grant
Of the total 34 dwellings in Grant, owner-occupied units account for 21 (61.8%), while renter-occupied units make up 13 (38.2%).
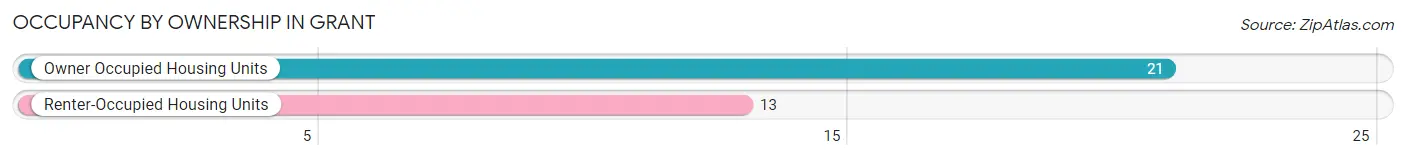
| Occupancy | # Housing Units | % Housing Units |
| Owner Occupied Housing Units | 21 | 61.8% |
| Renter-Occupied Housing Units | 13 | 38.2% |
| Total Occupied Housing Units | 34 | 100.0% |
Occupancy by Household Size in Grant
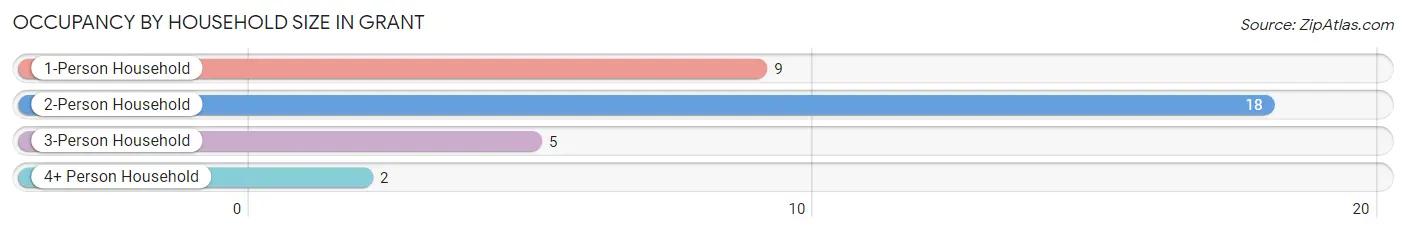
| Household Size | # Housing Units | % Housing Units |
| 1-Person Household | 9 | 26.5% |
| 2-Person Household | 18 | 52.9% |
| 3-Person Household | 5 | 14.7% |
| 4+ Person Household | 2 | 5.9% |
| Total Housing Units | 34 | 100.0% |
Occupancy by Ownership by Household Size in Grant
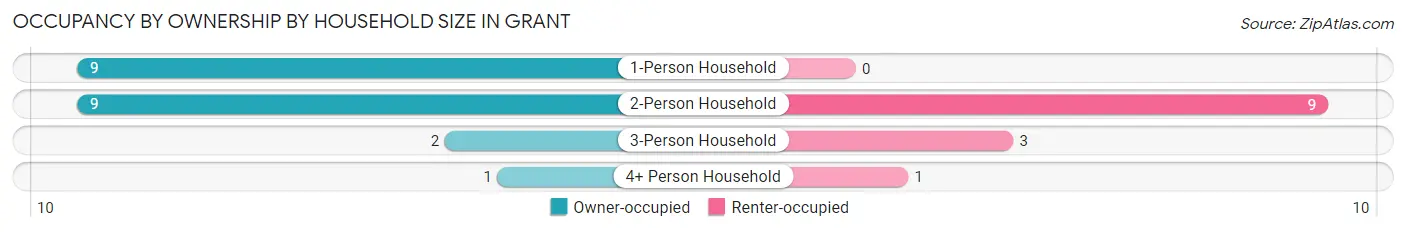
| Household Size | Owner-occupied | Renter-occupied |
| 1-Person Household | 9 (100.0%) | 0 (0.0%) |
| 2-Person Household | 9 (50.0%) | 9 (50.0%) |
| 3-Person Household | 2 (40.0%) | 3 (60.0%) |
| 4+ Person Household | 1 (50.0%) | 1 (50.0%) |
| Total Housing Units | 21 (61.8%) | 13 (38.2%) |
Occupancy by Educational Attainment in Grant
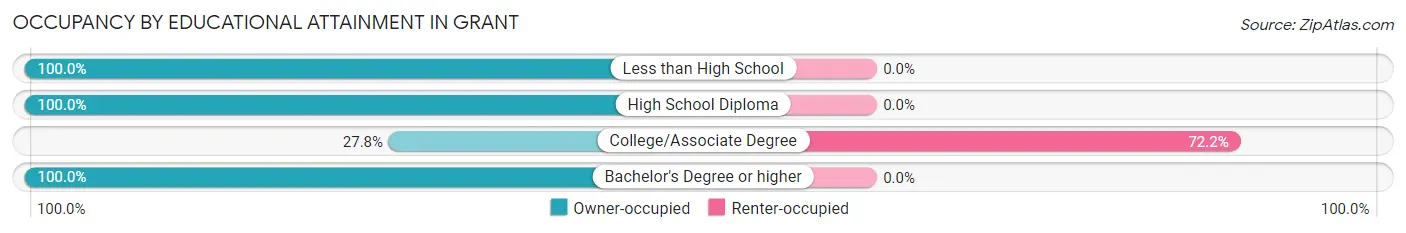
| Household Size | Owner-occupied | Renter-occupied |
| Less than High School | 3 (100.0%) | 0 (0.0%) |
| High School Diploma | 10 (100.0%) | 0 (0.0%) |
| College/Associate Degree | 5 (27.8%) | 13 (72.2%) |
| Bachelor's Degree or higher | 3 (100.0%) | 0 (0.0%) |
Occupancy by Age of Householder in Grant
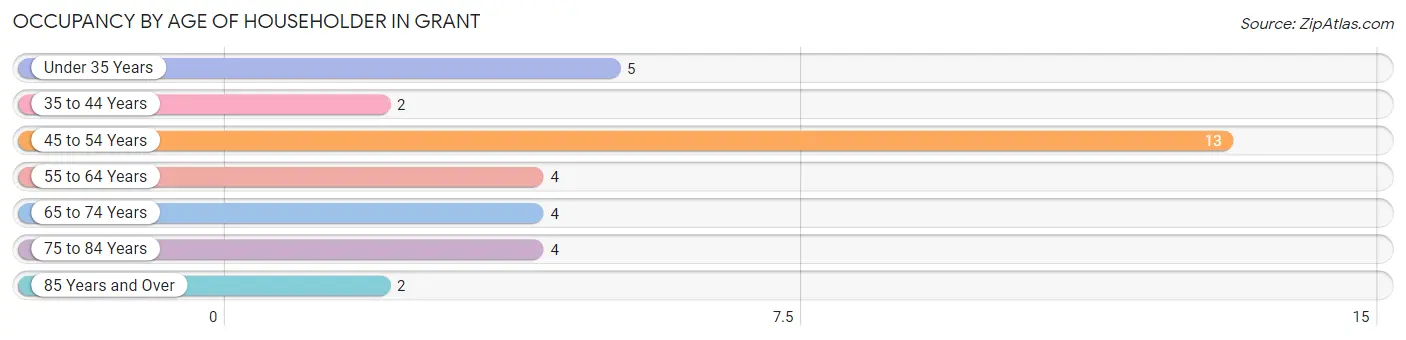
| Age Bracket | # Households | % Households |
| Under 35 Years | 5 | 14.7% |
| 35 to 44 Years | 2 | 5.9% |
| 45 to 54 Years | 13 | 38.2% |
| 55 to 64 Years | 4 | 11.8% |
| 65 to 74 Years | 4 | 11.8% |
| 75 to 84 Years | 4 | 11.8% |
| 85 Years and Over | 2 | 5.9% |
| Total | 34 | 100.0% |
Housing Finances in Grant
Median Income by Occupancy in Grant
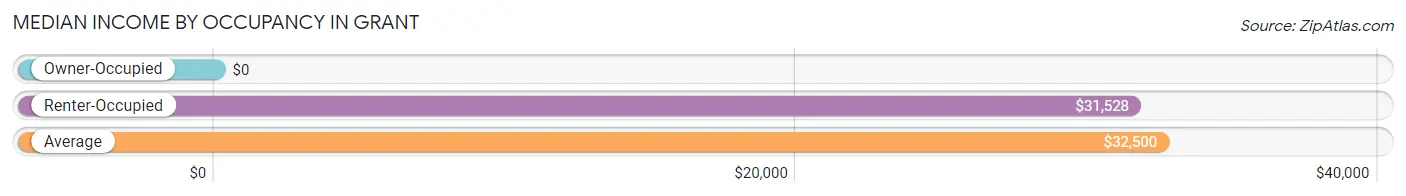
| Occupancy Type | # Households | Median Income |
| Owner-Occupied | 21 (61.8%) | $0 |
| Renter-Occupied | 13 (38.2%) | $31,528 |
| Average | 34 (100.0%) | $32,500 |
Occupancy by Householder Income Bracket in Grant
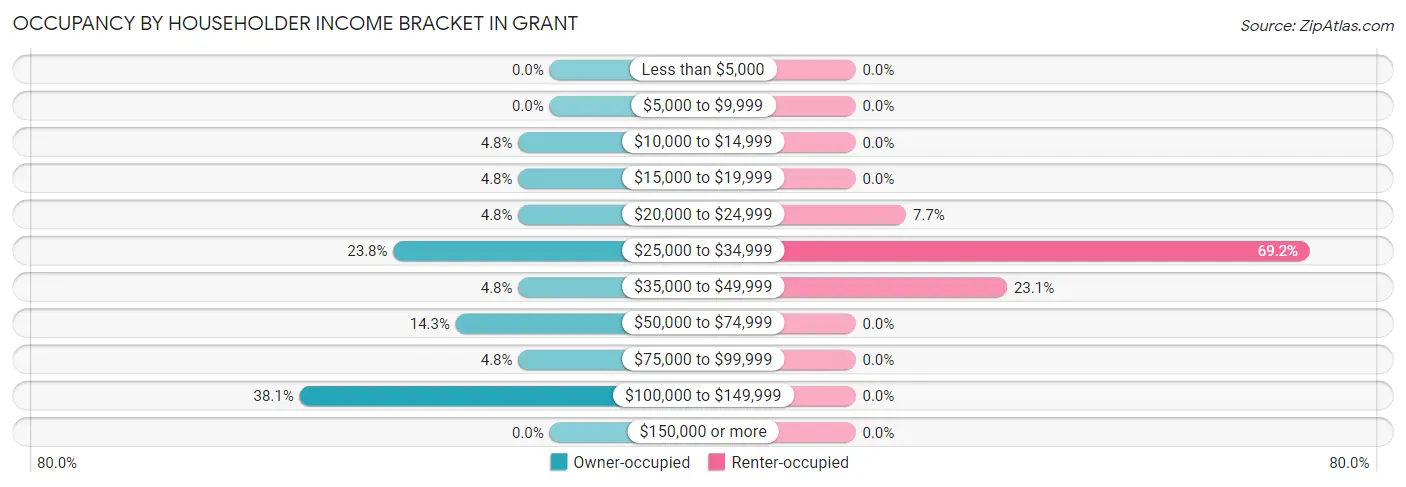
| Income Bracket | Owner-occupied | Renter-occupied |
| Less than $5,000 | 0 (0.0%) | 0 (0.0%) |
| $5,000 to $9,999 | 0 (0.0%) | 0 (0.0%) |
| $10,000 to $14,999 | 1 (4.8%) | 0 (0.0%) |
| $15,000 to $19,999 | 1 (4.8%) | 0 (0.0%) |
| $20,000 to $24,999 | 1 (4.8%) | 1 (7.7%) |
| $25,000 to $34,999 | 5 (23.8%) | 9 (69.2%) |
| $35,000 to $49,999 | 1 (4.8%) | 3 (23.1%) |
| $50,000 to $74,999 | 3 (14.3%) | 0 (0.0%) |
| $75,000 to $99,999 | 1 (4.8%) | 0 (0.0%) |
| $100,000 to $149,999 | 8 (38.1%) | 0 (0.0%) |
| $150,000 or more | 0 (0.0%) | 0 (0.0%) |
| Total | 21 (100.0%) | 13 (100.0%) |
Monthly Housing Cost Tiers in Grant
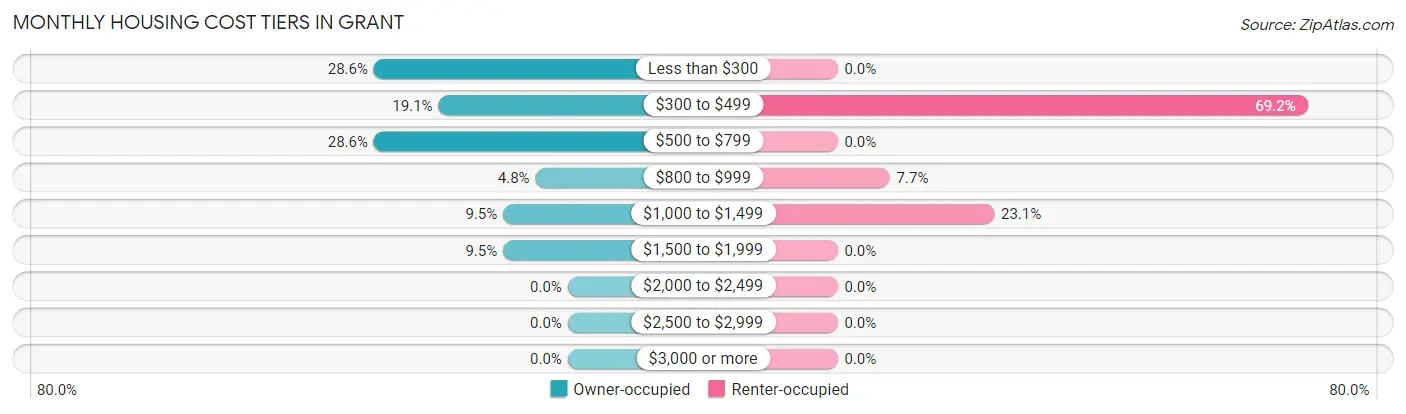
| Monthly Cost | Owner-occupied | Renter-occupied |
| Less than $300 | 6 (28.6%) | 0 (0.0%) |
| $300 to $499 | 4 (19.1%) | 9 (69.2%) |
| $500 to $799 | 6 (28.6%) | 0 (0.0%) |
| $800 to $999 | 1 (4.8%) | 1 (7.7%) |
| $1,000 to $1,499 | 2 (9.5%) | 3 (23.1%) |
| $1,500 to $1,999 | 2 (9.5%) | 0 (0.0%) |
| $2,000 to $2,499 | 0 (0.0%) | 0 (0.0%) |
| $2,500 to $2,999 | 0 (0.0%) | 0 (0.0%) |
| $3,000 or more | 0 (0.0%) | 0 (0.0%) |
| Total | 21 (100.0%) | 13 (100.0%) |
Physical Housing Characteristics in Grant
Housing Structures in Grant
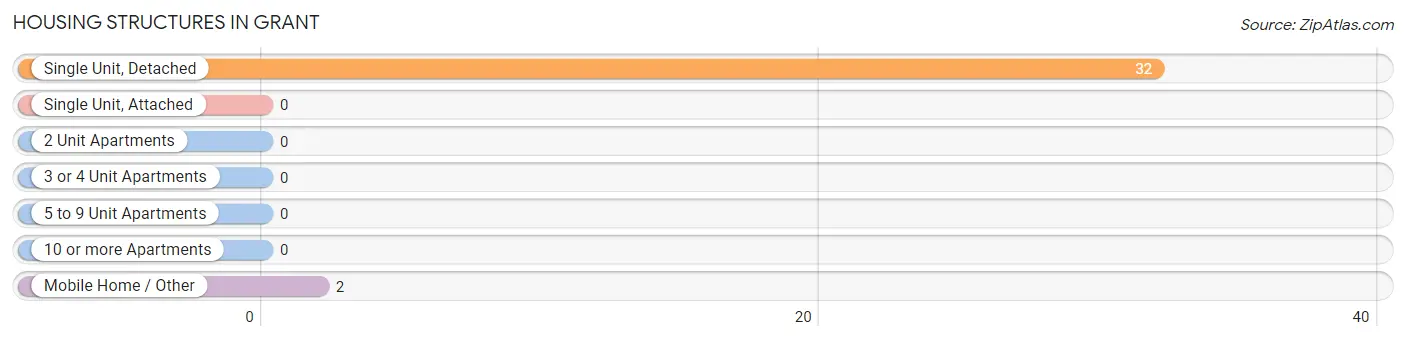
| Structure Type | # Housing Units | % Housing Units |
| Single Unit, Detached | 32 | 94.1% |
| Single Unit, Attached | 0 | 0.0% |
| 2 Unit Apartments | 0 | 0.0% |
| 3 or 4 Unit Apartments | 0 | 0.0% |
| 5 to 9 Unit Apartments | 0 | 0.0% |
| 10 or more Apartments | 0 | 0.0% |
| Mobile Home / Other | 2 | 5.9% |
| Total | 34 | 100.0% |
Housing Structures by Occupancy in Grant
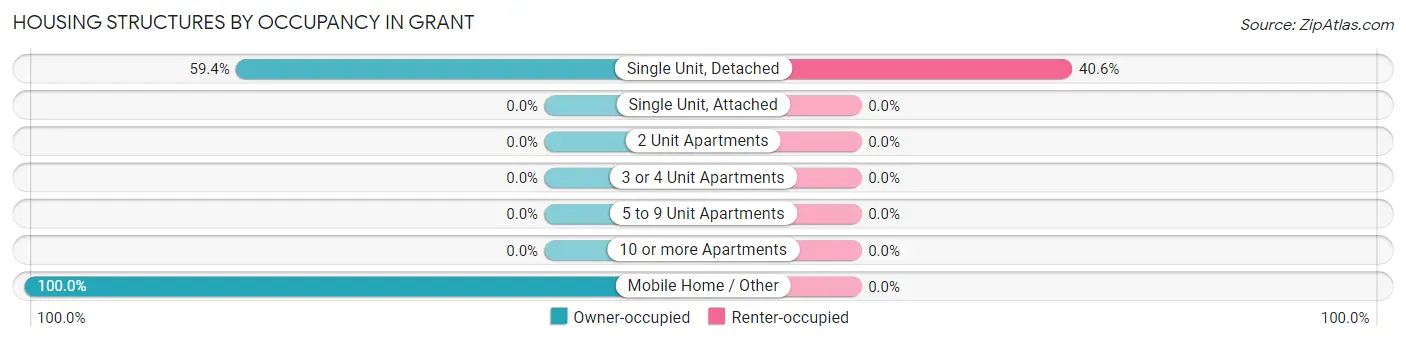
| Structure Type | Owner-occupied | Renter-occupied |
| Single Unit, Detached | 19 (59.4%) | 13 (40.6%) |
| Single Unit, Attached | 0 (0.0%) | 0 (0.0%) |
| 2 Unit Apartments | 0 (0.0%) | 0 (0.0%) |
| 3 or 4 Unit Apartments | 0 (0.0%) | 0 (0.0%) |
| 5 to 9 Unit Apartments | 0 (0.0%) | 0 (0.0%) |
| 10 or more Apartments | 0 (0.0%) | 0 (0.0%) |
| Mobile Home / Other | 2 (100.0%) | 0 (0.0%) |
| Total | 21 (61.8%) | 13 (38.2%) |
Housing Structures by Number of Rooms in Grant
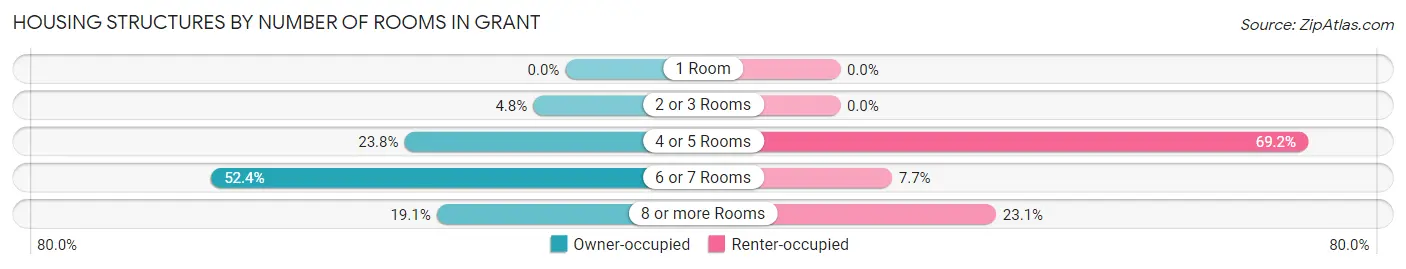
| Number of Rooms | Owner-occupied | Renter-occupied |
| 1 Room | 0 (0.0%) | 0 (0.0%) |
| 2 or 3 Rooms | 1 (4.8%) | 0 (0.0%) |
| 4 or 5 Rooms | 5 (23.8%) | 9 (69.2%) |
| 6 or 7 Rooms | 11 (52.4%) | 1 (7.7%) |
| 8 or more Rooms | 4 (19.1%) | 3 (23.1%) |
| Total | 21 (100.0%) | 13 (100.0%) |
Housing Structure by Heating Type in Grant
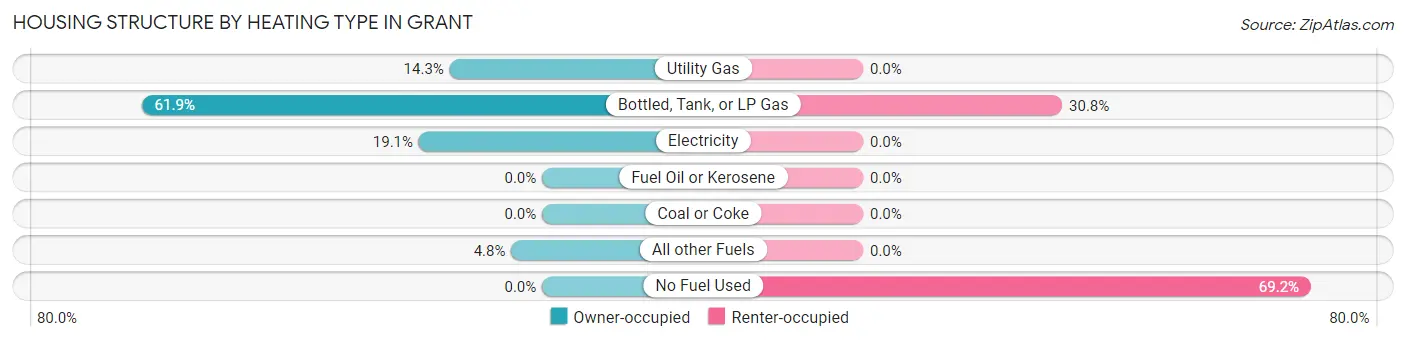
| Heating Type | Owner-occupied | Renter-occupied |
| Utility Gas | 3 (14.3%) | 0 (0.0%) |
| Bottled, Tank, or LP Gas | 13 (61.9%) | 4 (30.8%) |
| Electricity | 4 (19.1%) | 0 (0.0%) |
| Fuel Oil or Kerosene | 0 (0.0%) | 0 (0.0%) |
| Coal or Coke | 0 (0.0%) | 0 (0.0%) |
| All other Fuels | 1 (4.8%) | 0 (0.0%) |
| No Fuel Used | 0 (0.0%) | 9 (69.2%) |
| Total | 21 (100.0%) | 13 (100.0%) |
Household Vehicle Usage in Grant
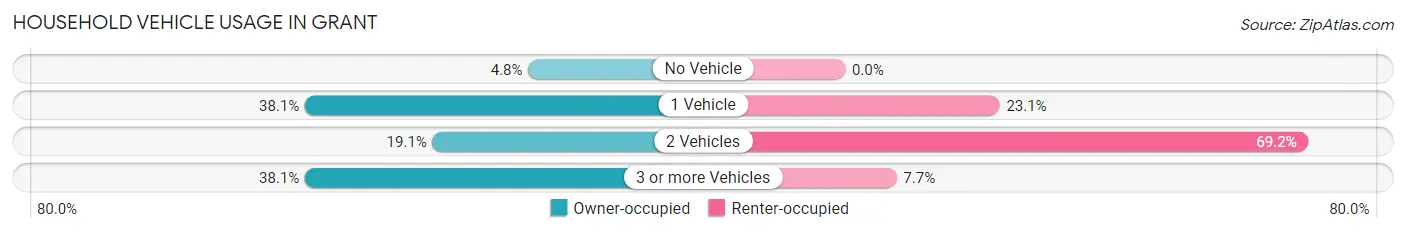
| Vehicles per Household | Owner-occupied | Renter-occupied |
| No Vehicle | 1 (4.8%) | 0 (0.0%) |
| 1 Vehicle | 8 (38.1%) | 3 (23.1%) |
| 2 Vehicles | 4 (19.1%) | 9 (69.2%) |
| 3 or more Vehicles | 8 (38.1%) | 1 (7.7%) |
| Total | 21 (100.0%) | 13 (100.0%) |
Real Estate & Mortgages in Grant
Real Estate and Mortgage Overview in Grant
| Characteristic | Without Mortgage | With Mortgage |
| Housing Units | 14 | 7 |
| Median Property Value | $45,000 | $92,500 |
| Median Household Income | - | - |
| Monthly Housing Costs | $350 | $0 |
| Real Estate Taxes | $700 | $0 |
Property Value by Mortgage Status in Grant
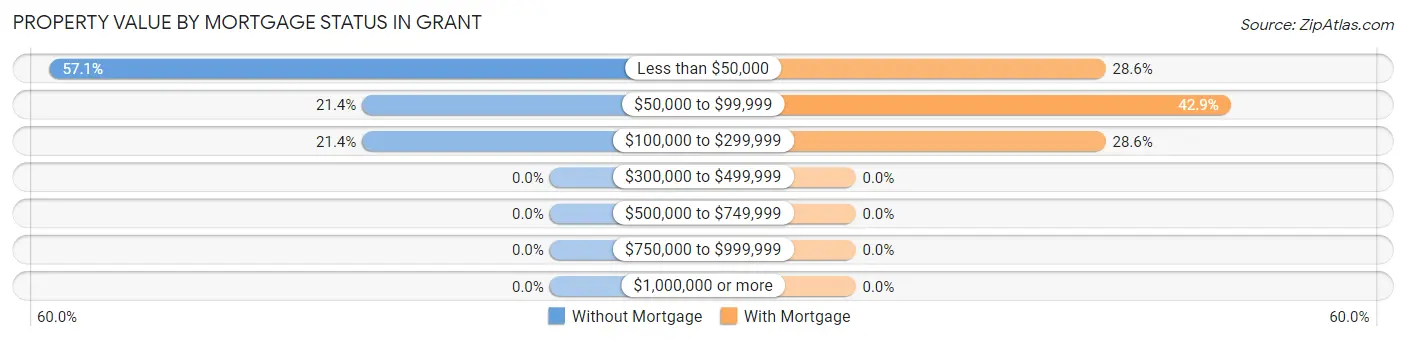
| Property Value | Without Mortgage | With Mortgage |
| Less than $50,000 | 8 (57.1%) | 2 (28.6%) |
| $50,000 to $99,999 | 3 (21.4%) | 3 (42.9%) |
| $100,000 to $299,999 | 3 (21.4%) | 2 (28.6%) |
| $300,000 to $499,999 | 0 (0.0%) | 0 (0.0%) |
| $500,000 to $749,999 | 0 (0.0%) | 0 (0.0%) |
| $750,000 to $999,999 | 0 (0.0%) | 0 (0.0%) |
| $1,000,000 or more | 0 (0.0%) | 0 (0.0%) |
| Total | 14 (100.0%) | 7 (100.0%) |
Household Income by Mortgage Status in Grant
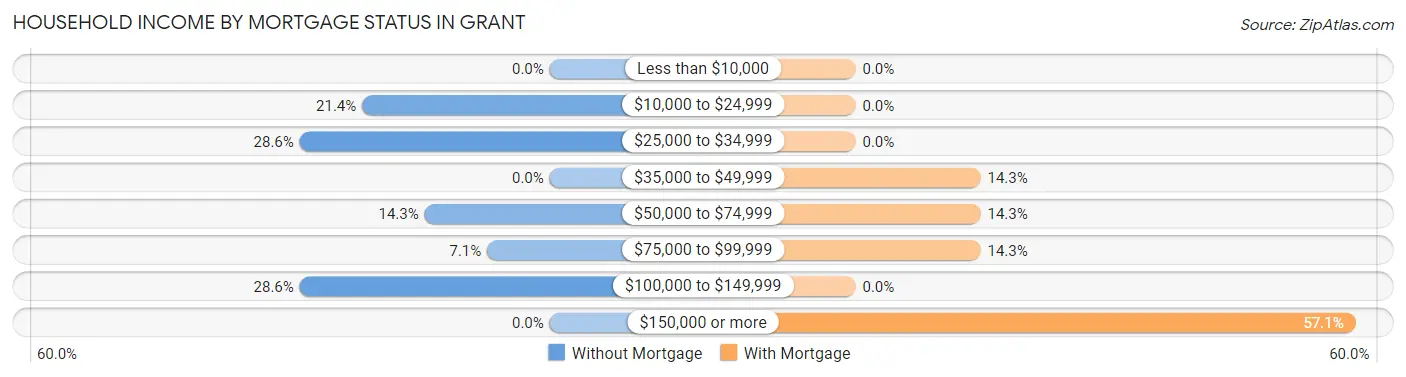
| Household Income | Without Mortgage | With Mortgage |
| Less than $10,000 | 0 (0.0%) | 0 (0.0%) |
| $10,000 to $24,999 | 3 (21.4%) | 0 (0.0%) |
| $25,000 to $34,999 | 4 (28.6%) | 0 (0.0%) |
| $35,000 to $49,999 | 0 (0.0%) | 1 (14.3%) |
| $50,000 to $74,999 | 2 (14.3%) | 1 (14.3%) |
| $75,000 to $99,999 | 1 (7.1%) | 1 (14.3%) |
| $100,000 to $149,999 | 4 (28.6%) | 0 (0.0%) |
| $150,000 or more | 0 (0.0%) | 4 (57.1%) |
| Total | 14 (100.0%) | 7 (100.0%) |
Property Value to Household Income Ratio in Grant
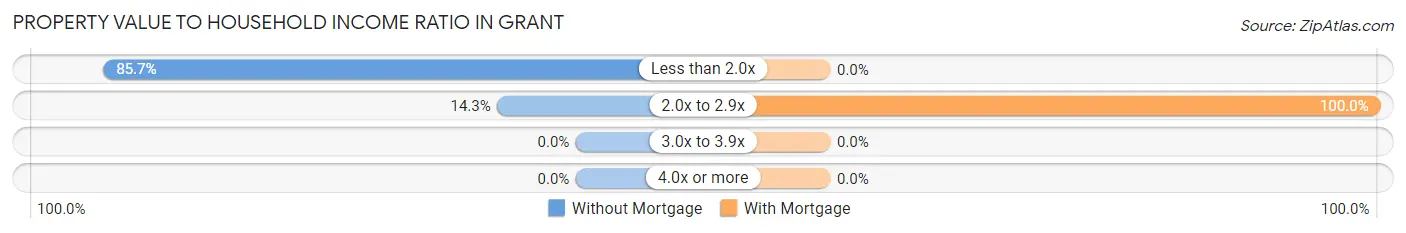
| Value-to-Income Ratio | Without Mortgage | With Mortgage |
| Less than 2.0x | 12 (85.7%) | 0 (0.0%) |
| 2.0x to 2.9x | 2 (14.3%) | 7 (100.0%) |
| 3.0x to 3.9x | 0 (0.0%) | 0 (0.0%) |
| 4.0x or more | 0 (0.0%) | 0 (0.0%) |
| Total | 14 (100.0%) | 7 (100.0%) |
Real Estate Taxes by Mortgage Status in Grant
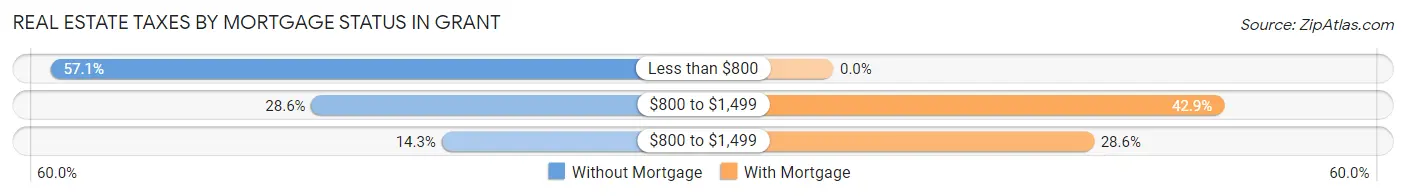
| Property Taxes | Without Mortgage | With Mortgage |
| Less than $800 | 8 (57.1%) | 0 (0.0%) |
| $800 to $1,499 | 4 (28.6%) | 3 (42.9%) |
| $800 to $1,499 | 2 (14.3%) | 2 (28.6%) |
| Total | 14 (100.0%) | 7 (100.0%) |
Health & Disability in Grant
Health Insurance Coverage by Age in Grant
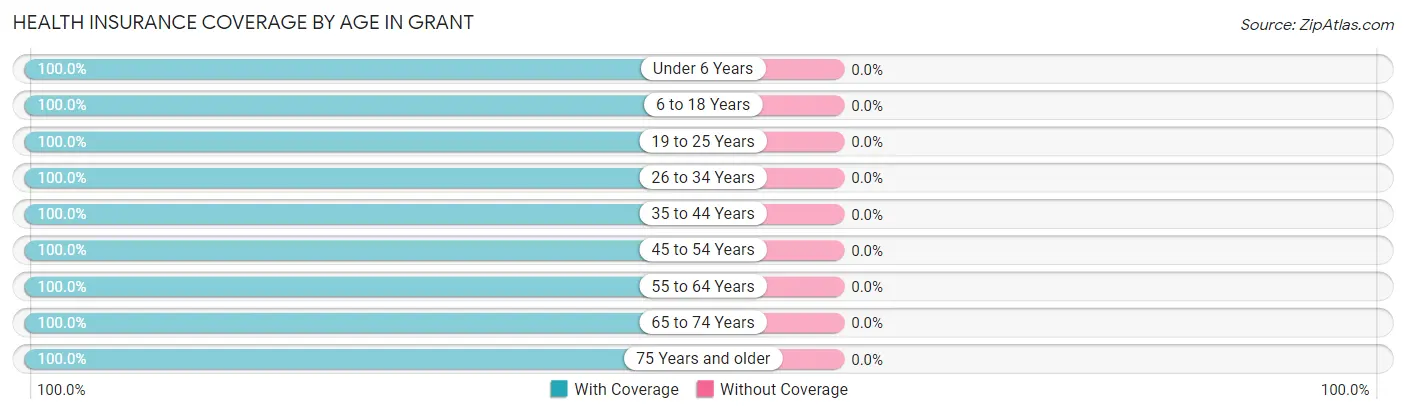
| Age Bracket | With Coverage | Without Coverage |
| Under 6 Years | 4 (100.0%) | 0 (0.0%) |
| 6 to 18 Years | 4 (100.0%) | 0 (0.0%) |
| 19 to 25 Years | 2 (100.0%) | 0 (0.0%) |
| 26 to 34 Years | 9 (100.0%) | 0 (0.0%) |
| 35 to 44 Years | 2 (100.0%) | 0 (0.0%) |
| 45 to 54 Years | 19 (100.0%) | 0 (0.0%) |
| 55 to 64 Years | 11 (100.0%) | 0 (0.0%) |
| 65 to 74 Years | 7 (100.0%) | 0 (0.0%) |
| 75 Years and older | 6 (100.0%) | 0 (0.0%) |
| Total | 64 (100.0%) | 0 (0.0%) |
Health Insurance Coverage by Citizenship Status in Grant
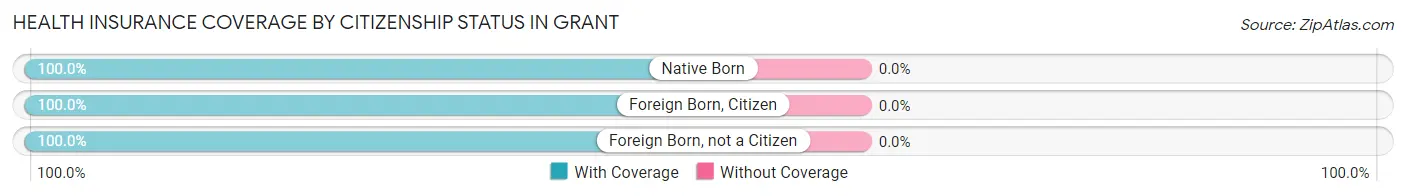
| Citizenship Status | With Coverage | Without Coverage |
| Native Born | 4 (100.0%) | 0 (0.0%) |
| Foreign Born, Citizen | 4 (100.0%) | 0 (0.0%) |
| Foreign Born, not a Citizen | 2 (100.0%) | 0 (0.0%) |
Health Insurance Coverage by Household Income in Grant
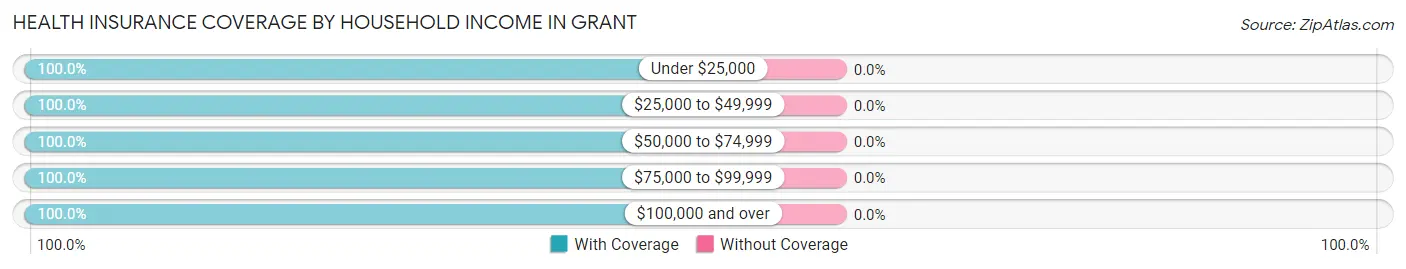
| Household Income | With Coverage | Without Coverage |
| Under $25,000 | 9 (100.0%) | 0 (0.0%) |
| $25,000 to $49,999 | 31 (100.0%) | 0 (0.0%) |
| $50,000 to $74,999 | 4 (100.0%) | 0 (0.0%) |
| $75,000 to $99,999 | 4 (100.0%) | 0 (0.0%) |
| $100,000 and over | 16 (100.0%) | 0 (0.0%) |
Public vs Private Health Insurance Coverage by Age in Grant
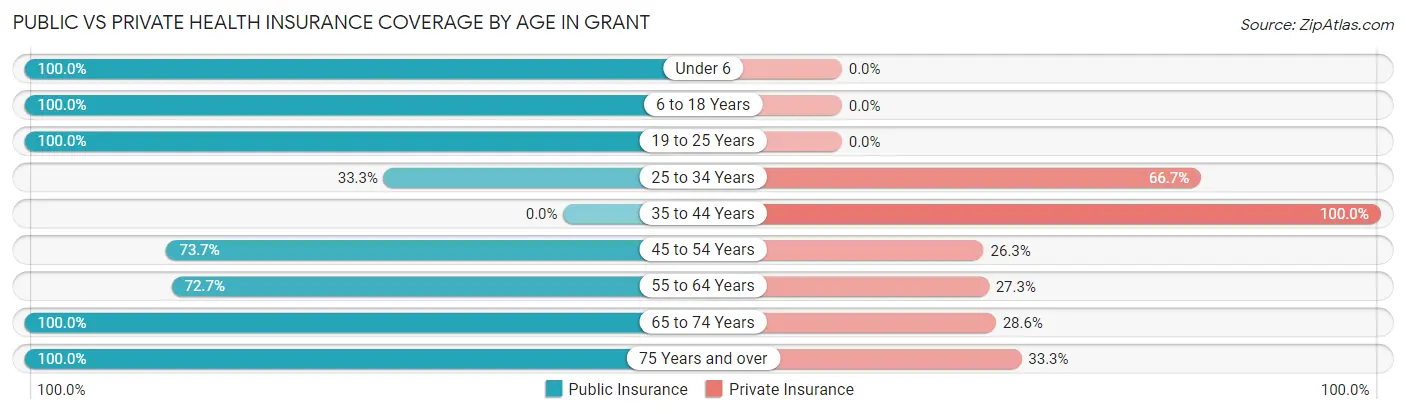
| Age Bracket | Public Insurance | Private Insurance |
| Under 6 | 4 (100.0%) | 0 (0.0%) |
| 6 to 18 Years | 4 (100.0%) | 0 (0.0%) |
| 19 to 25 Years | 2 (100.0%) | 0 (0.0%) |
| 25 to 34 Years | 3 (33.3%) | 6 (66.7%) |
| 35 to 44 Years | 0 (0.0%) | 2 (100.0%) |
| 45 to 54 Years | 14 (73.7%) | 5 (26.3%) |
| 55 to 64 Years | 8 (72.7%) | 3 (27.3%) |
| 65 to 74 Years | 7 (100.0%) | 2 (28.6%) |
| 75 Years and over | 6 (100.0%) | 2 (33.3%) |
| Total | 48 (75.0%) | 20 (31.2%) |
Disability Status by Sex by Age in Grant
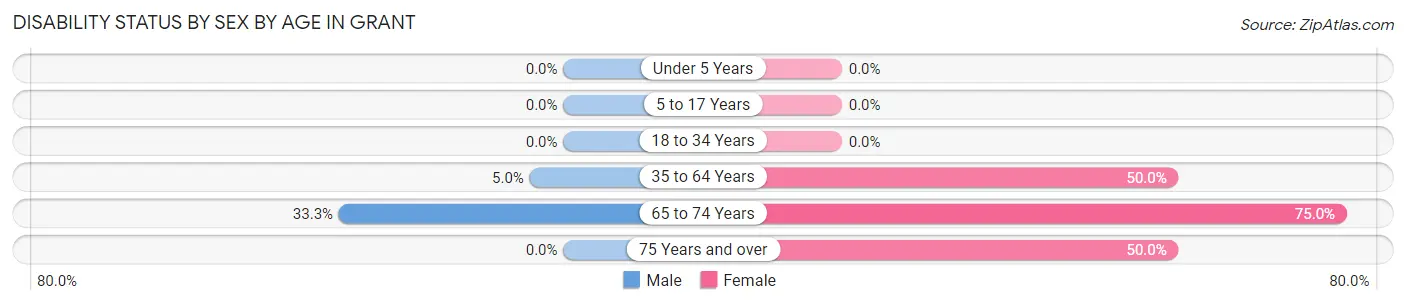
| Age Bracket | Male | Female |
| Under 5 Years | 0 (0.0%) | 0 (0.0%) |
| 5 to 17 Years | 0 (0.0%) | 0 (0.0%) |
| 18 to 34 Years | 0 (0.0%) | 0 (0.0%) |
| 35 to 64 Years | 1 (5.0%) | 6 (50.0%) |
| 65 to 74 Years | 1 (33.3%) | 3 (75.0%) |
| 75 Years and over | 0 (0.0%) | 3 (50.0%) |
Disability Class by Sex by Age in Grant
Disability Class: Hearing Difficulty
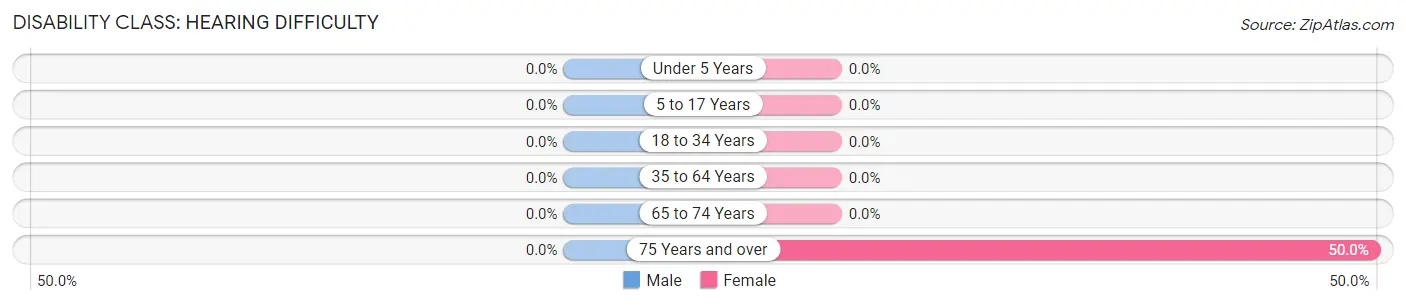
| Age Bracket | Male | Female |
| Under 5 Years | 0 (0.0%) | 0 (0.0%) |
| 5 to 17 Years | 0 (0.0%) | 0 (0.0%) |
| 18 to 34 Years | 0 (0.0%) | 0 (0.0%) |
| 35 to 64 Years | 0 (0.0%) | 0 (0.0%) |
| 65 to 74 Years | 0 (0.0%) | 0 (0.0%) |
| 75 Years and over | 0 (0.0%) | 3 (50.0%) |
Disability Class: Vision Difficulty
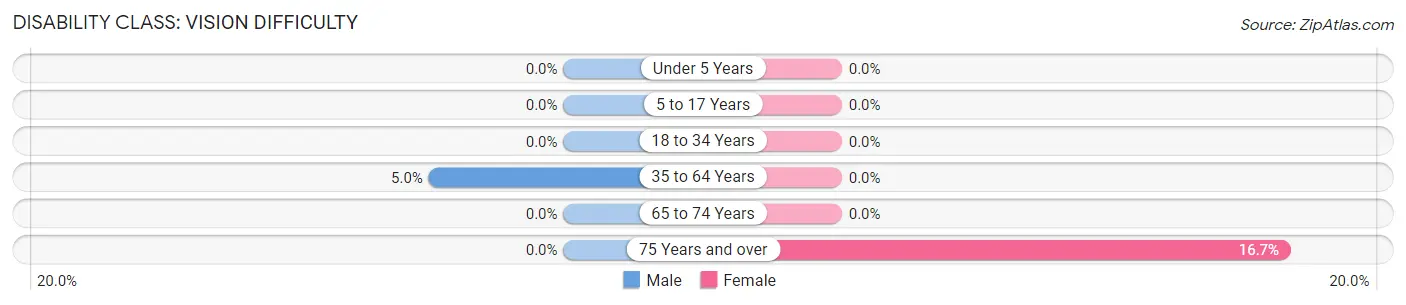
| Age Bracket | Male | Female |
| Under 5 Years | 0 (0.0%) | 0 (0.0%) |
| 5 to 17 Years | 0 (0.0%) | 0 (0.0%) |
| 18 to 34 Years | 0 (0.0%) | 0 (0.0%) |
| 35 to 64 Years | 1 (5.0%) | 0 (0.0%) |
| 65 to 74 Years | 0 (0.0%) | 0 (0.0%) |
| 75 Years and over | 0 (0.0%) | 1 (16.7%) |
Disability Class: Cognitive Difficulty
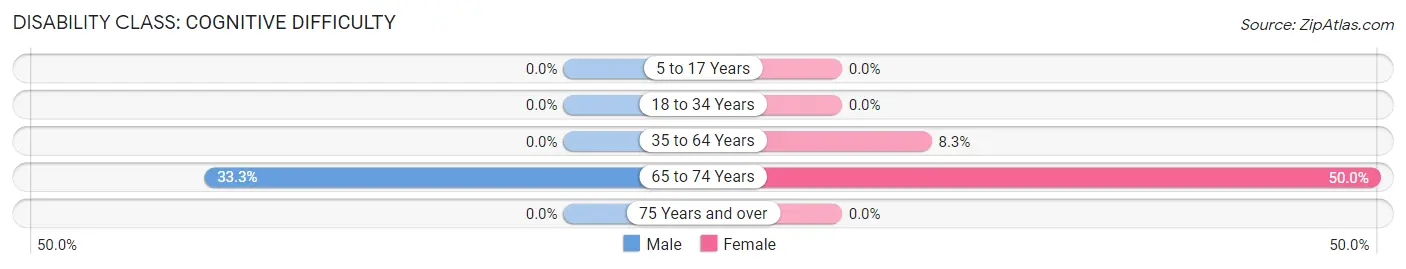
| Age Bracket | Male | Female |
| 5 to 17 Years | 0 (0.0%) | 0 (0.0%) |
| 18 to 34 Years | 0 (0.0%) | 0 (0.0%) |
| 35 to 64 Years | 0 (0.0%) | 1 (8.3%) |
| 65 to 74 Years | 1 (33.3%) | 2 (50.0%) |
| 75 Years and over | 0 (0.0%) | 0 (0.0%) |
Disability Class: Ambulatory Difficulty
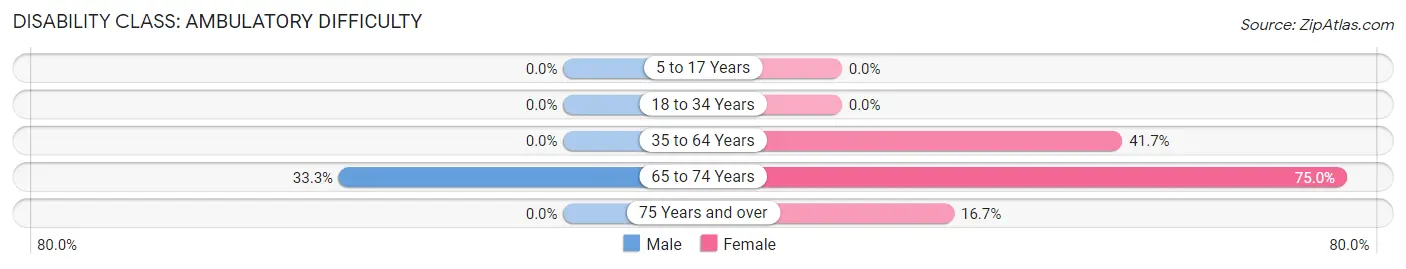
| Age Bracket | Male | Female |
| 5 to 17 Years | 0 (0.0%) | 0 (0.0%) |
| 18 to 34 Years | 0 (0.0%) | 0 (0.0%) |
| 35 to 64 Years | 0 (0.0%) | 5 (41.7%) |
| 65 to 74 Years | 1 (33.3%) | 3 (75.0%) |
| 75 Years and over | 0 (0.0%) | 1 (16.7%) |
Disability Class: Self-Care Difficulty
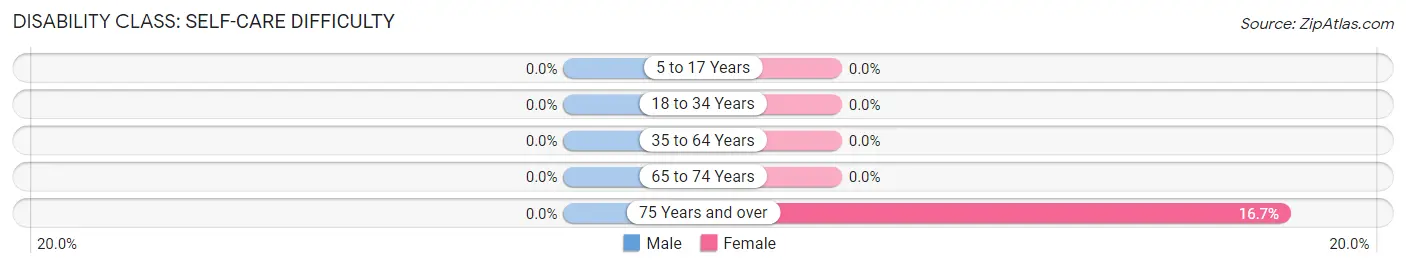
| Age Bracket | Male | Female |
| 5 to 17 Years | 0 (0.0%) | 0 (0.0%) |
| 18 to 34 Years | 0 (0.0%) | 0 (0.0%) |
| 35 to 64 Years | 0 (0.0%) | 0 (0.0%) |
| 65 to 74 Years | 0 (0.0%) | 0 (0.0%) |
| 75 Years and over | 0 (0.0%) | 1 (16.7%) |
Technology Access in Grant
Computing Device Access in Grant
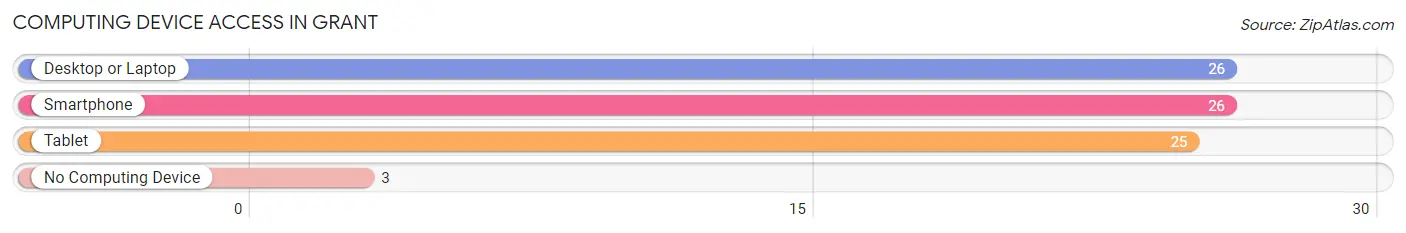
| Device Type | # Households | % Households |
| Desktop or Laptop | 26 | 76.5% |
| Smartphone | 26 | 76.5% |
| Tablet | 25 | 73.5% |
| No Computing Device | 3 | 8.8% |
| Total | 34 | 100.0% |
Internet Access in Grant
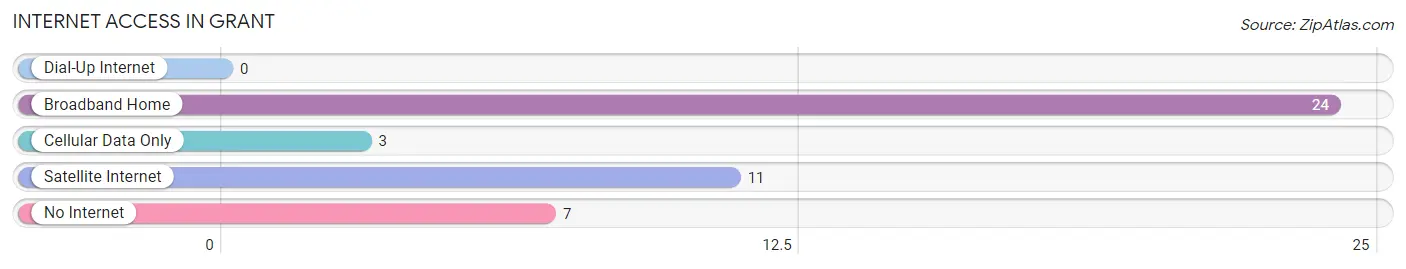
| Internet Type | # Households | % Households |
| Dial-Up Internet | 0 | 0.0% |
| Broadband Home | 24 | 70.6% |
| Cellular Data Only | 3 | 8.8% |
| Satellite Internet | 11 | 32.4% |
| No Internet | 7 | 20.6% |
| Total | 34 | 100.0% |
Grant Summary
IA History
Iowa is a state located in the Midwestern United States. It is bordered by Minnesota to the north, Wisconsin and Illinois to the east, Missouri to the south, and South Dakota and Nebraska to the west. Iowa was admitted to the Union as the 29th state on December 28, 1846.
The first inhabitants of Iowa were Native Americans, including the Sioux, Fox, and Ioway tribes. The first Europeans to explore the area were French explorers Louis Jolliet and Jacques Marquette in 1673. The first permanent European settlement in Iowa was established in 1788 by Julien Dubuque, a French-Canadian fur trader.
In 1803, Iowa became part of the Louisiana Purchase, and in 1838, the Iowa Territory was established. During this time, the state was largely populated by settlers from the eastern United States, as well as immigrants from Germany, Ireland, and Scandinavia.
In the 1840s, Iowa experienced a period of rapid growth and development. The state was opened up to settlement by the Homestead Act of 1862, which allowed settlers to claim up to 160 acres of land for free. This led to a large influx of settlers, and by 1870, Iowa had a population of 1.6 million.
During the Civil War, Iowa was a major supplier of food and other supplies to the Union Army. After the war, the state experienced a period of economic growth and development, with the establishment of railroads, factories, and other businesses.
In the late 19th and early 20th centuries, Iowa was a major producer of corn, wheat, and other agricultural products. The state also became a major center of manufacturing, with the establishment of factories in cities such as Des Moines, Cedar Rapids, and Davenport.
Geography
Iowa is located in the Midwestern United States, bordered by Minnesota to the north, Wisconsin and Illinois to the east, Missouri to the south, and South Dakota and Nebraska to the west. The state has an area of 56,272 square miles, making it the 26th largest state in the country.
Iowa is divided into 99 counties, and its capital is Des Moines. The state is divided into four distinct geographic regions: the Driftless Area in the northeast, the Central Plains in the center, the Dissected Till Plains in the southeast, and the Great Plains in the west.
The state is home to a variety of landscapes, including rolling hills, prairies, and forests. The highest point in Iowa is Hawkeye Point, located in the northwest corner of the state at 1,670 feet above sea level. The state also has several major rivers, including the Mississippi, Missouri, and Des Moines.
Economy
Iowa has a diverse economy, with a mix of agriculture, manufacturing, and services. The state is a major producer of corn, soybeans, and hogs, and is also a major producer of ethanol and biodiesel.
Manufacturing is also an important part of the state’s economy, with major industries including food processing, machinery, and chemicals. The state is also home to a number of major companies, including John Deere, Rockwell Collins, and Principal Financial Group.
The state’s service sector is also important, with major industries including finance, insurance, real estate, and health care. Tourism is also an important part of the state’s economy, with major attractions including the Iowa State Fair, the Field of Dreams movie site, and the Amana Colonies.
Demographics
As of 2019, Iowa had an estimated population of 3.2 million, making it the 30th most populous state in the country. The state has a population density of 54.7 people per square mile, making it the 24th most densely populated state.
The largest city in Iowa is Des Moines, with an estimated population of 217,521. Other major cities include Cedar Rapids, Davenport, Sioux City, and Waterloo. The state’s population is largely white (91.2%), with smaller percentages of African Americans (3.7%), Asians (2.2%), and Hispanics (2.1%).
The median household income in Iowa is $58,906, and the median home value is $164,400. The state’s unemployment rate is 2.9%, and the poverty rate is 10.2%. The state’s largest employers include the University of Iowa, MercyOne, and the Iowa Department of Transportation.
Common Questions
What is Per Capita Income in Grant?
Per Capita income in Grant is $30,386.
What is the Median Household income in Grant?
Median Household Income in Grant is $32,500.
What is Inequality or Gini Index in Grant?
Inequality or Gini Index in Grant is 0.37.
What is the Total Population of Grant?
Total Population of Grant is 64.
What is the Total Male Population of Grant?
Total Male Population of Grant is 35.
What is the Total Female Population of Grant?
Total Female Population of Grant is 29.
What is the Ratio of Males per 100 Females in Grant?
There are 120.69 Males per 100 Females in Grant.
What is the Ratio of Females per 100 Males in Grant?
There are 82.86 Females per 100 Males in Grant.
What is the Median Population Age in Grant?
Median Population Age in Grant is 50.8 Years.
What is the Average Family Size in Grant
Average Family Size in Grant is 2.1 People.
What is the Average Household Size in Grant
Average Household Size in Grant is 1.9 People.
How Large is the Labor Force in Grant?
There are 23 People in the Labor Forcein in Grant.
What is the Percentage of People in the Labor Force in Grant?
40.4% of People are in the Labor Force in Grant.