Chariton, IA Map & Demographics
Chariton Map
Chariton Overview
$25,811
PER CAPITA INCOME
$69,073
AVG FAMILY INCOME
$50,100
AVG HOUSEHOLD INCOME
41.7%
WAGE / INCOME GAP [ % ]
58.3¢/ $1
WAGE / INCOME GAP [ $ ]
$9,864
FAMILY INCOME DEFICIT
0.43
INEQUALITY / GINI INDEX
4,203
TOTAL POPULATION
2,070
MALE POPULATION
2,133
FEMALE POPULATION
97.05
MALES / 100 FEMALES
103.04
FEMALES / 100 MALES
37.2
MEDIAN AGE
3.0
AVG FAMILY SIZE
2.3
AVG HOUSEHOLD SIZE
2,061
LABOR FORCE [ PEOPLE ]
62.9%
PERCENT IN LABOR FORCE
6.4%
UNEMPLOYMENT RATE
Chariton Zip Codes
Chariton Area Codes
Income in Chariton
Income Overview in Chariton
Per Capita Income in Chariton is $25,811, while median incomes of families and households are $69,073 and $50,100 respectively.
| Characteristic | Number | Measure |
| Per Capita Income | 4,203 | $25,811 |
| Median Family Income | 1,097 | $69,073 |
| Mean Family Income | 1,097 | $69,839 |
| Median Household Income | 1,758 | $50,100 |
| Mean Household Income | 1,758 | $61,229 |
| Income Deficit | 1,097 | $9,864 |
| Wage / Income Gap (%) | 4,203 | 41.72% |
| Wage / Income Gap ($) | 4,203 | 58.28¢ per $1 |
| Gini / Inequality Index | 4,203 | 0.43 |
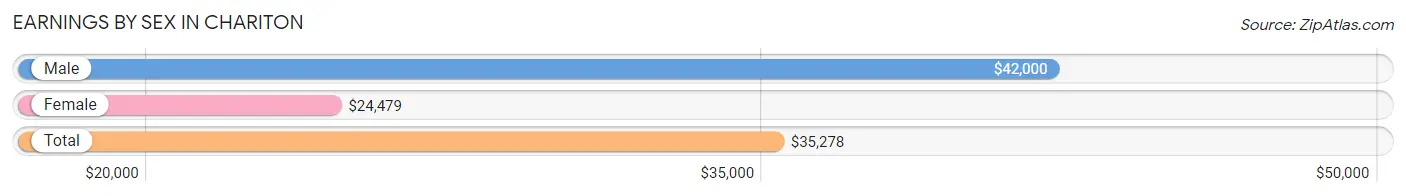
Earnings by Sex in Chariton
Average Earnings in Chariton are $35,278, $42,000 for men and $24,479 for women, a difference of 41.7%.
| Sex | Number | Average Earnings |
| Male | 1,124 (54.4%) | $42,000 |
| Female | 942 (45.6%) | $24,479 |
| Total | 2,066 (100.0%) | $35,278 |
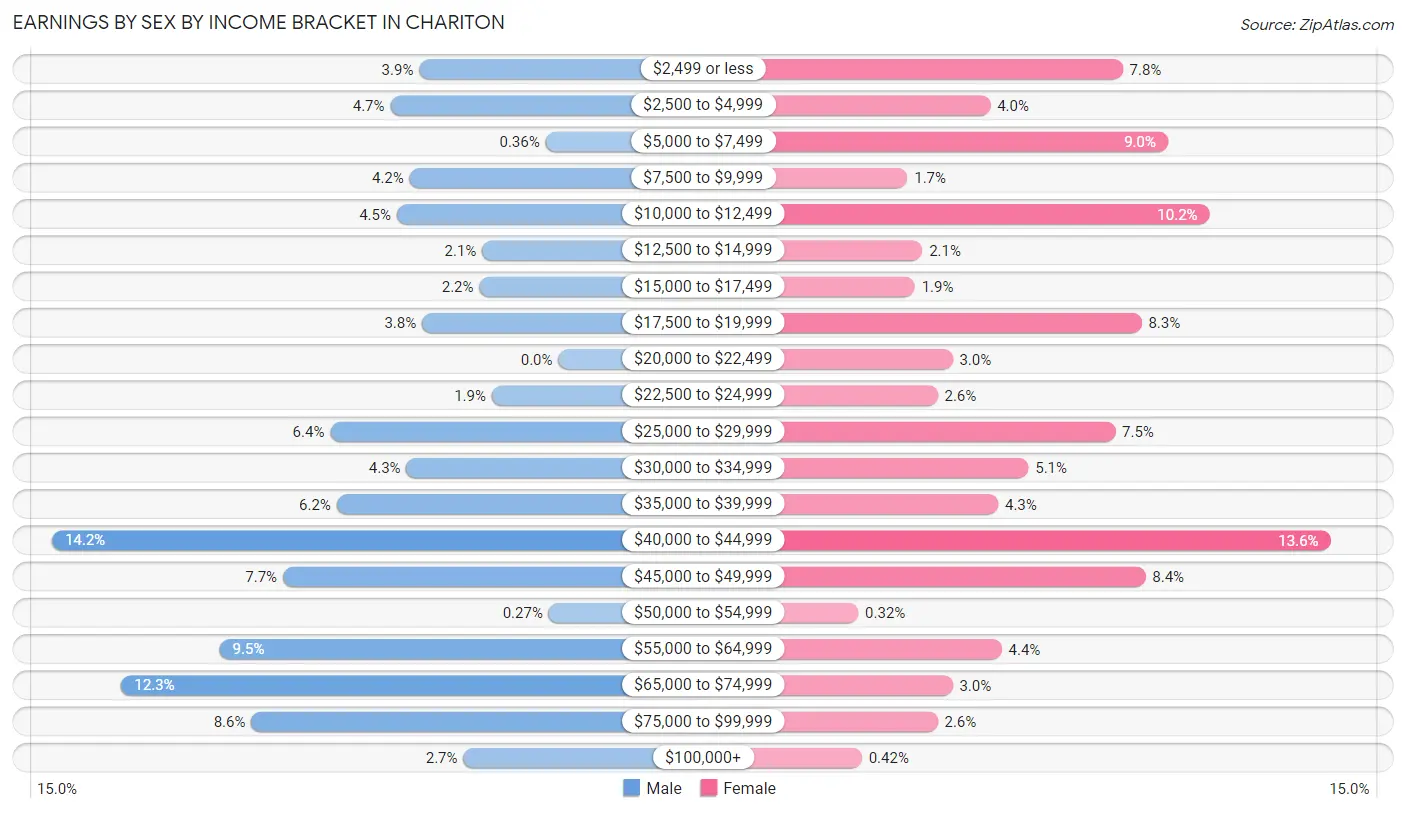
Earnings by Sex by Income Bracket in Chariton
The most common earnings brackets in Chariton are $40,000 to $44,999 for men (160 | 14.2%) and $40,000 to $44,999 for women (128 | 13.6%).
| Income | Male | Female |
| $2,499 or less | 44 (3.9%) | 73 (7.7%) |
| $2,500 to $4,999 | 53 (4.7%) | 38 (4.0%) |
| $5,000 to $7,499 | 4 (0.4%) | 85 (9.0%) |
| $7,500 to $9,999 | 47 (4.2%) | 16 (1.7%) |
| $10,000 to $12,499 | 51 (4.5%) | 96 (10.2%) |
| $12,500 to $14,999 | 24 (2.1%) | 20 (2.1%) |
| $15,000 to $17,499 | 25 (2.2%) | 18 (1.9%) |
| $17,500 to $19,999 | 43 (3.8%) | 78 (8.3%) |
| $20,000 to $22,499 | 0 (0.0%) | 28 (3.0%) |
| $22,500 to $24,999 | 21 (1.9%) | 24 (2.5%) |
| $25,000 to $29,999 | 72 (6.4%) | 71 (7.5%) |
| $30,000 to $34,999 | 48 (4.3%) | 48 (5.1%) |
| $35,000 to $39,999 | 70 (6.2%) | 40 (4.3%) |
| $40,000 to $44,999 | 160 (14.2%) | 128 (13.6%) |
| $45,000 to $49,999 | 87 (7.7%) | 79 (8.4%) |
| $50,000 to $54,999 | 3 (0.3%) | 3 (0.3%) |
| $55,000 to $64,999 | 107 (9.5%) | 41 (4.3%) |
| $65,000 to $74,999 | 138 (12.3%) | 28 (3.0%) |
| $75,000 to $99,999 | 97 (8.6%) | 24 (2.5%) |
| $100,000+ | 30 (2.7%) | 4 (0.4%) |
| Total | 1,124 (100.0%) | 942 (100.0%) |
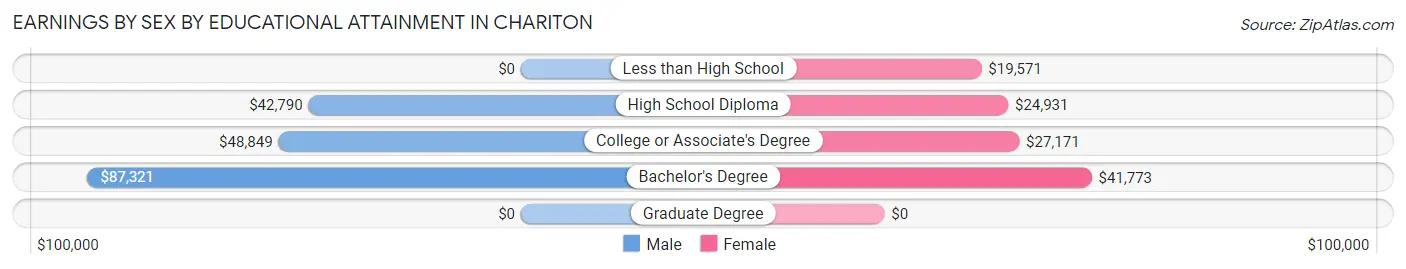
Earnings by Sex by Educational Attainment in Chariton
Average earnings in Chariton are $44,412 for men and $29,479 for women, a difference of 33.6%. Men with an educational attainment of bachelor's degree enjoy the highest average annual earnings of $87,321, while those with high school diploma education earn the least with $42,790. Women with an educational attainment of bachelor's degree earn the most with the average annual earnings of $41,773, while those with less than high school education have the smallest earnings of $19,571.
| Educational Attainment | Male Income | Female Income |
| Less than High School | - | - |
| High School Diploma | $42,790 | $24,931 |
| College or Associate's Degree | $48,849 | $27,171 |
| Bachelor's Degree | $87,321 | $41,773 |
| Graduate Degree | - | - |
| Total | $44,412 | $29,479 |
Family Income in Chariton
Family Income Brackets in Chariton
According to the Chariton family income data, there are 226 families falling into the $75,000 to $99,999 income range, which is the most common income bracket and makes up 20.6% of all families. Conversely, the $200,000+ income bracket is the least frequent group with only 2 families (0.2%) belonging to this category.
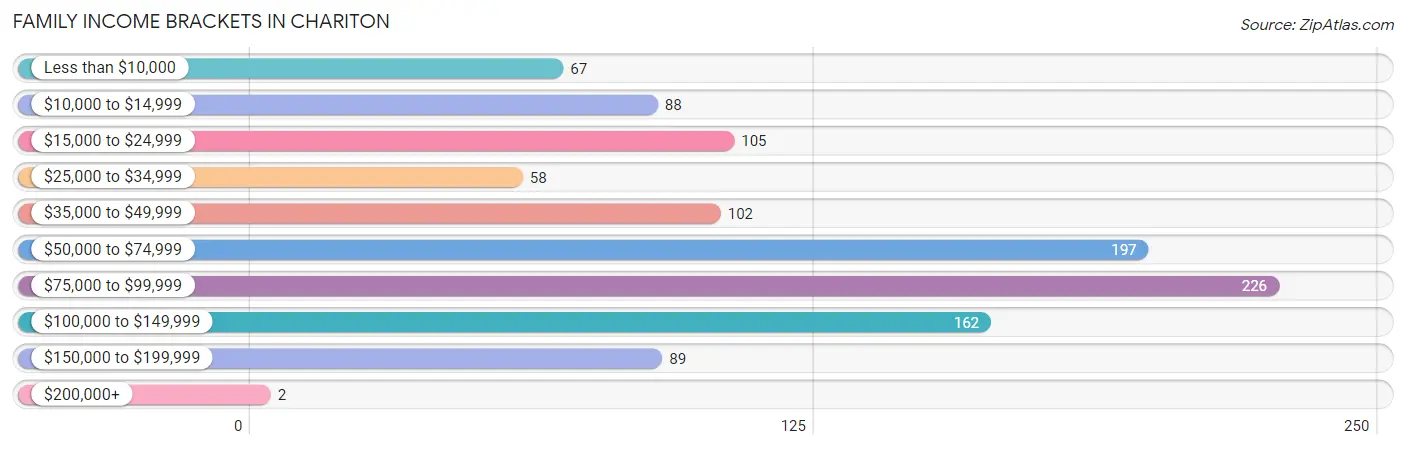
| Income Bracket | # Families | % Families |
| Less than $10,000 | 67 | 6.1% |
| $10,000 to $14,999 | 88 | 8.0% |
| $15,000 to $24,999 | 105 | 9.6% |
| $25,000 to $34,999 | 58 | 5.3% |
| $35,000 to $49,999 | 102 | 9.3% |
| $50,000 to $74,999 | 197 | 18.0% |
| $75,000 to $99,999 | 226 | 20.6% |
| $100,000 to $149,999 | 162 | 14.8% |
| $150,000 to $199,999 | 89 | 8.1% |
| $200,000+ | 2 | 0.2% |
Family Income by Famaliy Size in Chariton
2-person families (530 | 48.3%) account for the highest median family income in Chariton with $73,571 per family, while 2-person families (530 | 48.3%) have the highest median income of $36,786 per family member.
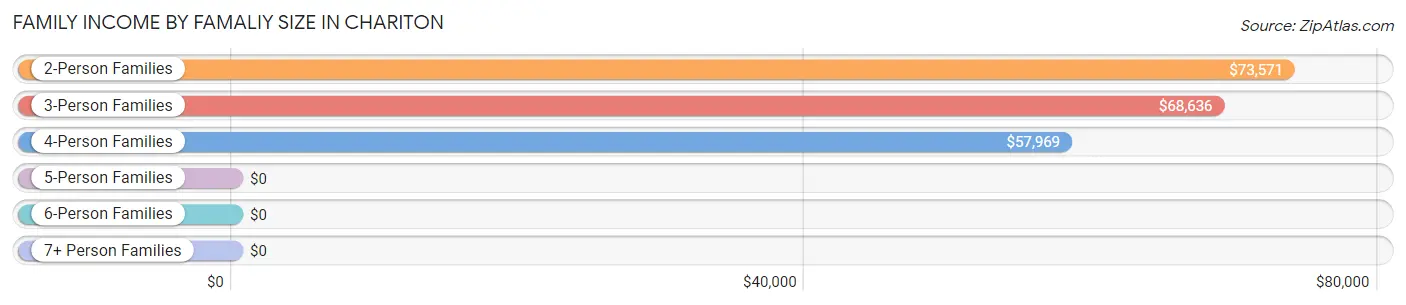
| Income Bracket | # Families | Median Income |
| 2-Person Families | 530 (48.3%) | $73,571 |
| 3-Person Families | 260 (23.7%) | $68,636 |
| 4-Person Families | 215 (19.6%) | $57,969 |
| 5-Person Families | 77 (7.0%) | $0 |
| 6-Person Families | 15 (1.4%) | $0 |
| 7+ Person Families | 0 (0.0%) | $0 |
| Total | 1,097 (100.0%) | $69,073 |
Family Income by Number of Earners in Chariton
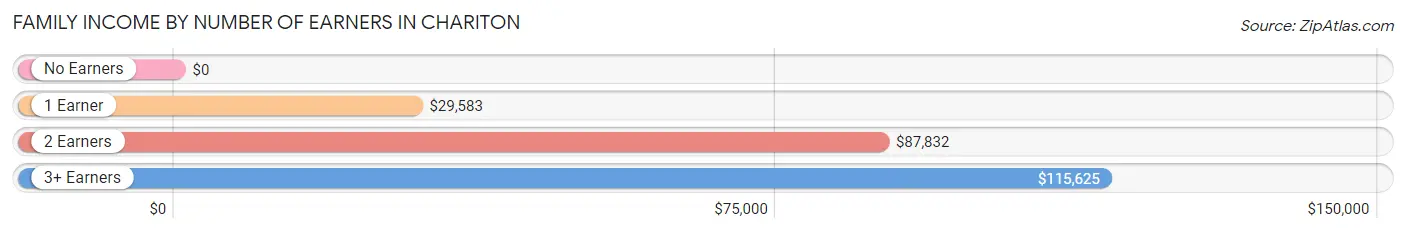
| Number of Earners | # Families | Median Income |
| No Earners | 187 (17.1%) | $0 |
| 1 Earner | 369 (33.6%) | $29,583 |
| 2 Earners | 423 (38.6%) | $87,832 |
| 3+ Earners | 118 (10.8%) | $115,625 |
| Total | 1,097 (100.0%) | $69,073 |
Household Income in Chariton
Household Income Brackets in Chariton
With 345 households falling in the category, the $50,000 to $74,999 income range is the most frequent in Chariton, accounting for 19.6% of all households. In contrast, only 21 households (1.2%) fall into the $200,000+ income bracket, making it the least populous group.
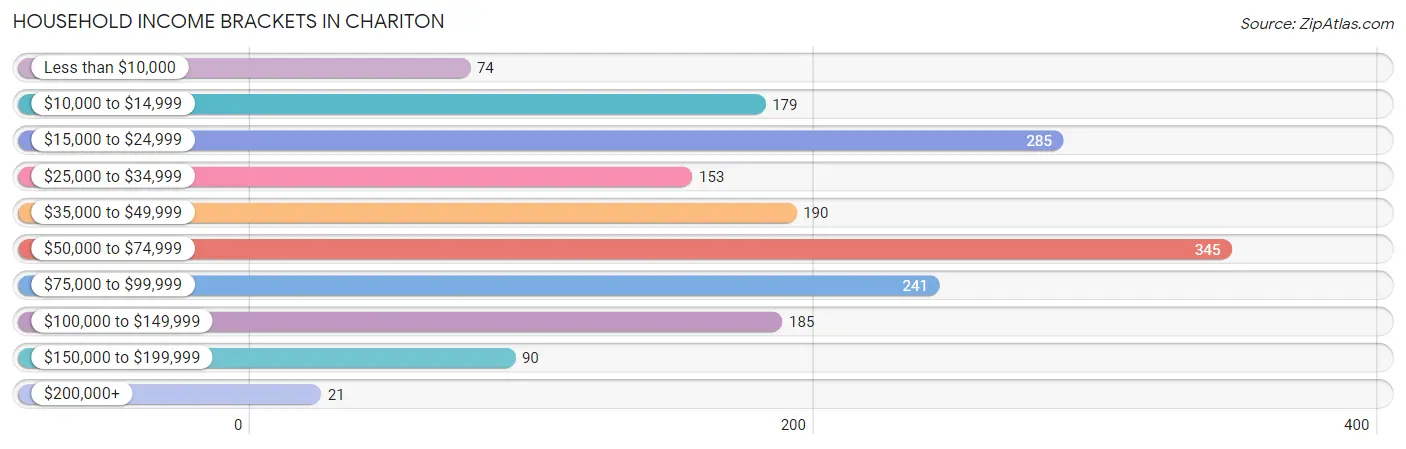
| Income Bracket | # Households | % Households |
| Less than $10,000 | 74 | 4.2% |
| $10,000 to $14,999 | 179 | 10.2% |
| $15,000 to $24,999 | 285 | 16.2% |
| $25,000 to $34,999 | 153 | 8.7% |
| $35,000 to $49,999 | 190 | 10.8% |
| $50,000 to $74,999 | 345 | 19.6% |
| $75,000 to $99,999 | 241 | 13.7% |
| $100,000 to $149,999 | 185 | 10.5% |
| $150,000 to $199,999 | 90 | 5.1% |
| $200,000+ | 21 | 1.2% |
Household Income by Householder Age in Chariton
The median household income in Chariton is $50,100, with the highest median household income of $58,516 found in the 15 to 24 years age bracket for the primary householder. A total of 94 households (5.3%) fall into this category. Meanwhile, the 65+ years age bracket for the primary householder has the lowest median household income of $35,893, with 517 households (29.4%) in this group.
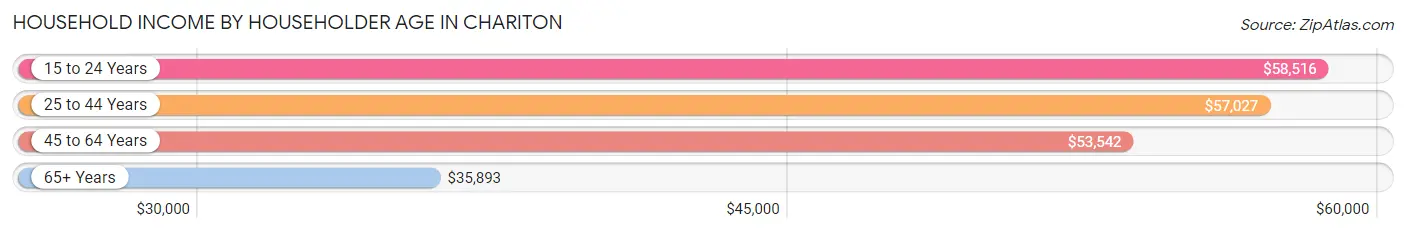
| Income Bracket | # Households | Median Income |
| 15 to 24 Years | 94 (5.3%) | $58,516 |
| 25 to 44 Years | 566 (32.2%) | $57,027 |
| 45 to 64 Years | 581 (33.1%) | $53,542 |
| 65+ Years | 517 (29.4%) | $35,893 |
| Total | 1,758 (100.0%) | $50,100 |
Poverty in Chariton
Income Below Poverty by Sex and Age in Chariton
With 24.5% poverty level for males and 23.8% for females among the residents of Chariton, 12 to 14 year old males and 15 year old females are the most vulnerable to poverty, with 60 males (60.6%) and 17 females (63.0%) in their respective age groups living below the poverty level.
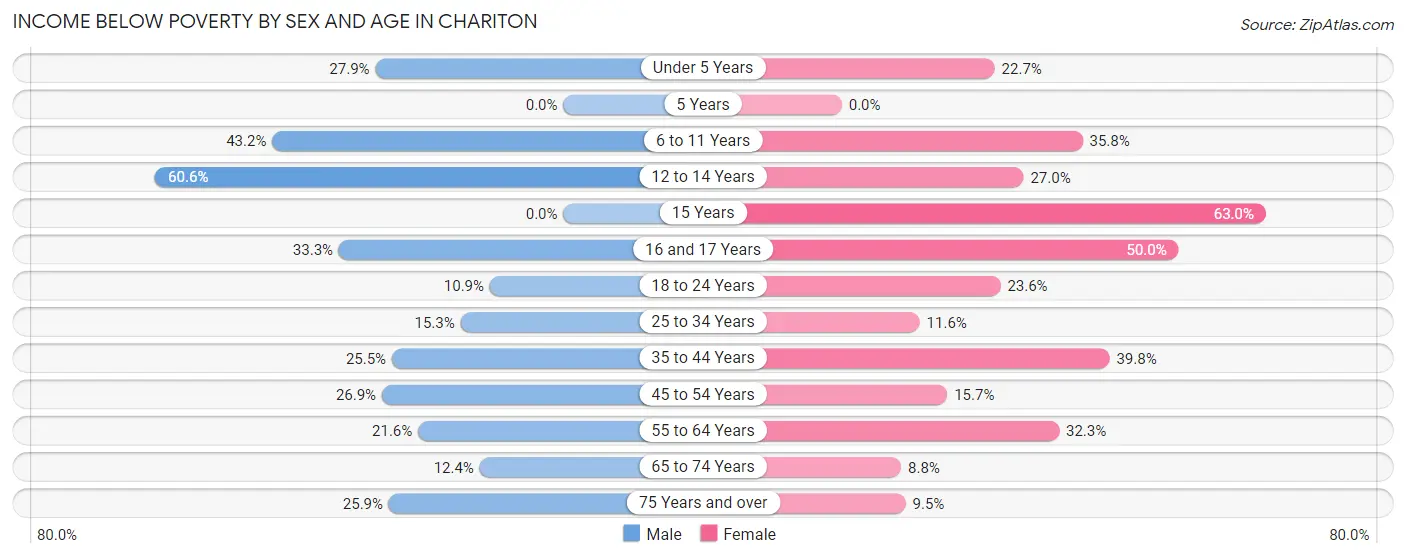
| Age Bracket | Male | Female |
| Under 5 Years | 48 (27.9%) | 37 (22.7%) |
| 5 Years | 0 (0.0%) | 0 (0.0%) |
| 6 to 11 Years | 67 (43.2%) | 74 (35.7%) |
| 12 to 14 Years | 60 (60.6%) | 17 (27.0%) |
| 15 Years | 0 (0.0%) | 17 (63.0%) |
| 16 and 17 Years | 27 (33.3%) | 9 (50.0%) |
| 18 to 24 Years | 18 (10.9%) | 49 (23.6%) |
| 25 to 34 Years | 53 (15.3%) | 23 (11.6%) |
| 35 to 44 Years | 42 (25.5%) | 97 (39.8%) |
| 45 to 54 Years | 59 (26.9%) | 26 (15.7%) |
| 55 to 64 Years | 55 (21.6%) | 100 (32.3%) |
| 65 to 74 Years | 20 (12.4%) | 17 (8.8%) |
| 75 Years and over | 50 (25.9%) | 25 (9.5%) |
| Total | 499 (24.5%) | 491 (23.8%) |
Income Above Poverty by Sex and Age in Chariton
According to the poverty statistics in Chariton, males aged 5 years and females aged 65 to 74 years are the age groups that are most secure financially, with 100.0% of males and 91.2% of females in these age groups living above the poverty line.
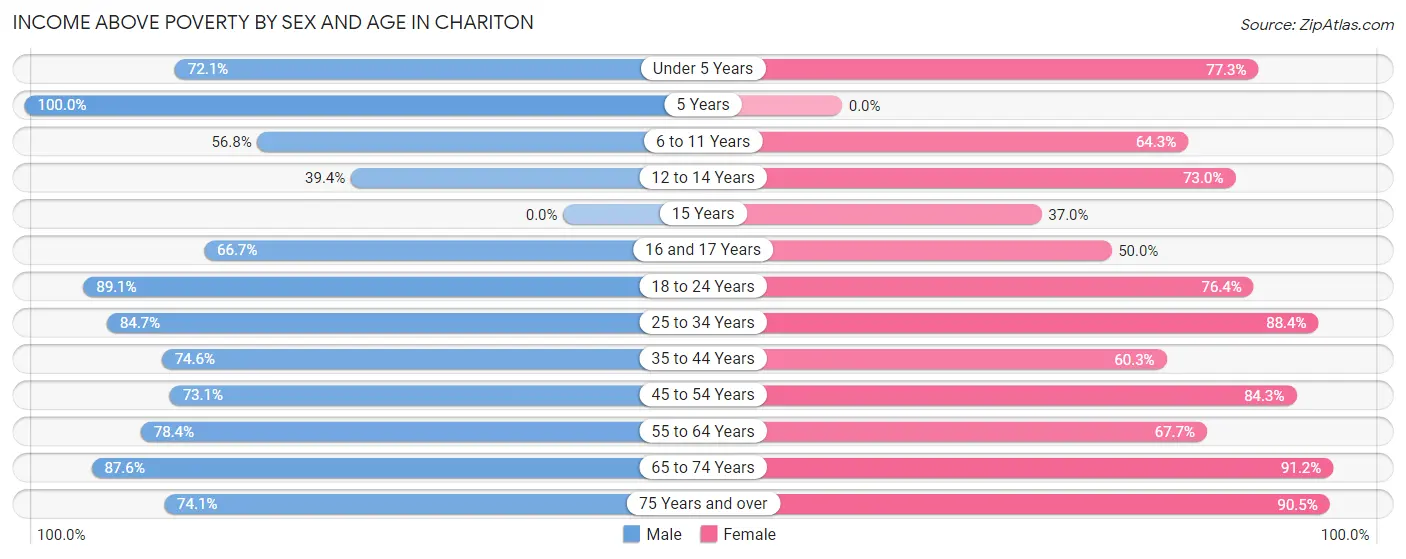
| Age Bracket | Male | Female |
| Under 5 Years | 124 (72.1%) | 126 (77.3%) |
| 5 Years | 24 (100.0%) | 0 (0.0%) |
| 6 to 11 Years | 88 (56.8%) | 133 (64.2%) |
| 12 to 14 Years | 39 (39.4%) | 46 (73.0%) |
| 15 Years | 0 (0.0%) | 10 (37.0%) |
| 16 and 17 Years | 54 (66.7%) | 9 (50.0%) |
| 18 to 24 Years | 147 (89.1%) | 159 (76.4%) |
| 25 to 34 Years | 294 (84.7%) | 176 (88.4%) |
| 35 to 44 Years | 123 (74.6%) | 147 (60.3%) |
| 45 to 54 Years | 160 (73.1%) | 140 (84.3%) |
| 55 to 64 Years | 200 (78.4%) | 210 (67.7%) |
| 65 to 74 Years | 141 (87.6%) | 176 (91.2%) |
| 75 Years and over | 143 (74.1%) | 239 (90.5%) |
| Total | 1,537 (75.5%) | 1,571 (76.2%) |
Income Below Poverty Among Married-Couple Families in Chariton
The poverty statistics for married-couple families in Chariton show that 6.9% or 54 of the total 785 families live below the poverty line. Families with no children have the highest poverty rate of 8.3%, comprising of 43 families. On the other hand, families with 3 or 4 children have the lowest poverty rate of 0.0%, which includes 0 families.
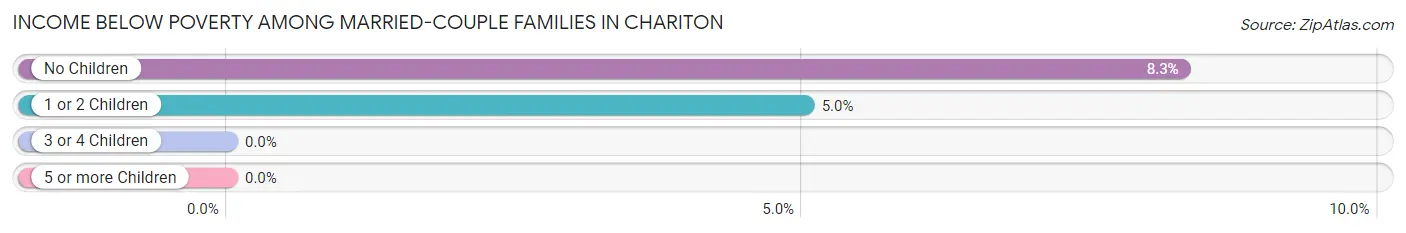
| Children | Above Poverty | Below Poverty |
| No Children | 476 (91.7%) | 43 (8.3%) |
| 1 or 2 Children | 208 (95.0%) | 11 (5.0%) |
| 3 or 4 Children | 47 (100.0%) | 0 (0.0%) |
| 5 or more Children | 0 (0.0%) | 0 (0.0%) |
| Total | 731 (93.1%) | 54 (6.9%) |
Income Below Poverty Among Single-Parent Households in Chariton
According to the poverty data in Chariton, 40.2% or 35 single-father households and 73.8% or 166 single-mother households are living below the poverty line. Among single-father households, those with 3 or 4 children have the highest poverty rate, with 13 households (61.9%) experiencing poverty. Likewise, among single-mother households, those with 3 or 4 children have the highest poverty rate, with 52 households (82.5%) falling below the poverty line.
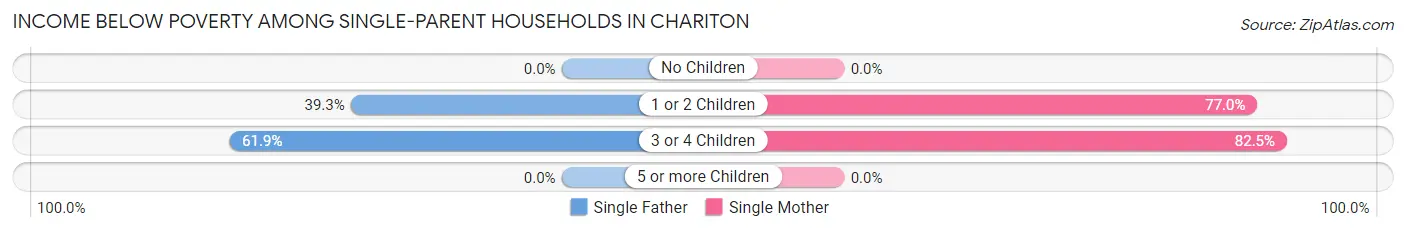
| Children | Single Father | Single Mother |
| No Children | 0 (0.0%) | 0 (0.0%) |
| 1 or 2 Children | 22 (39.3%) | 114 (77.0%) |
| 3 or 4 Children | 13 (61.9%) | 52 (82.5%) |
| 5 or more Children | 0 (0.0%) | 0 (0.0%) |
| Total | 35 (40.2%) | 166 (73.8%) |
Income Below Poverty Among Married-Couple vs Single-Parent Households in Chariton
The poverty data for Chariton shows that 54 of the married-couple family households (6.9%) and 201 of the single-parent households (64.4%) are living below the poverty level. Within the married-couple family households, those with no children have the highest poverty rate, with 43 households (8.3%) falling below the poverty line. Among the single-parent households, those with 3 or 4 children have the highest poverty rate, with 65 household (77.4%) living below poverty.
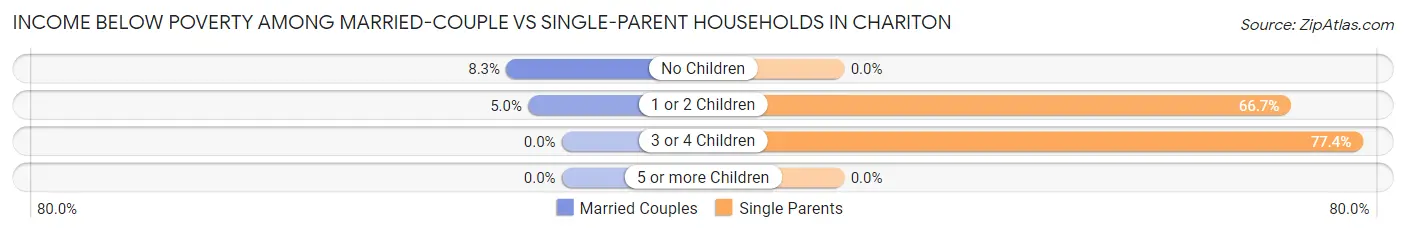
| Children | Married-Couple Families | Single-Parent Households |
| No Children | 43 (8.3%) | 0 (0.0%) |
| 1 or 2 Children | 11 (5.0%) | 136 (66.7%) |
| 3 or 4 Children | 0 (0.0%) | 65 (77.4%) |
| 5 or more Children | 0 (0.0%) | 0 (0.0%) |
| Total | 54 (6.9%) | 201 (64.4%) |
Race in Chariton
The most populous races in Chariton are White / Caucasian (4,009 | 95.4%), Hispanic or Latino (160 | 3.8%), and Two or more Races (94 | 2.2%).
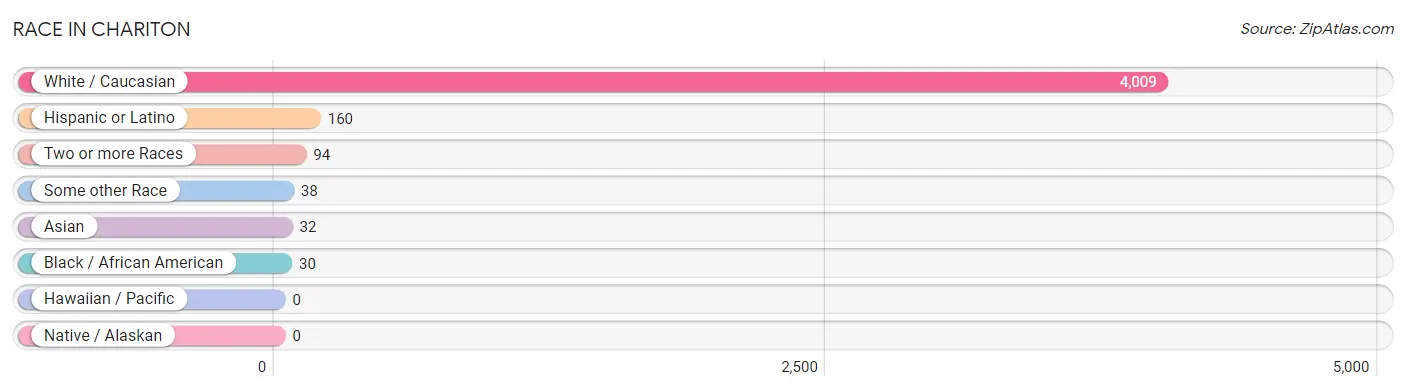
| Race | # Population | % Population |
| Asian | 32 | 0.8% |
| Black / African American | 30 | 0.7% |
| Hawaiian / Pacific | 0 | 0.0% |
| Hispanic or Latino | 160 | 3.8% |
| Native / Alaskan | 0 | 0.0% |
| White / Caucasian | 4,009 | 95.4% |
| Two or more Races | 94 | 2.2% |
| Some other Race | 38 | 0.9% |
| Total | 4,203 | 100.0% |
Ancestry in Chariton
The most populous ancestries reported in Chariton are German (857 | 20.4%), English (695 | 16.5%), Irish (584 | 13.9%), American (414 | 9.9%), and European (132 | 3.1%), together accounting for 63.8% of all Chariton residents.
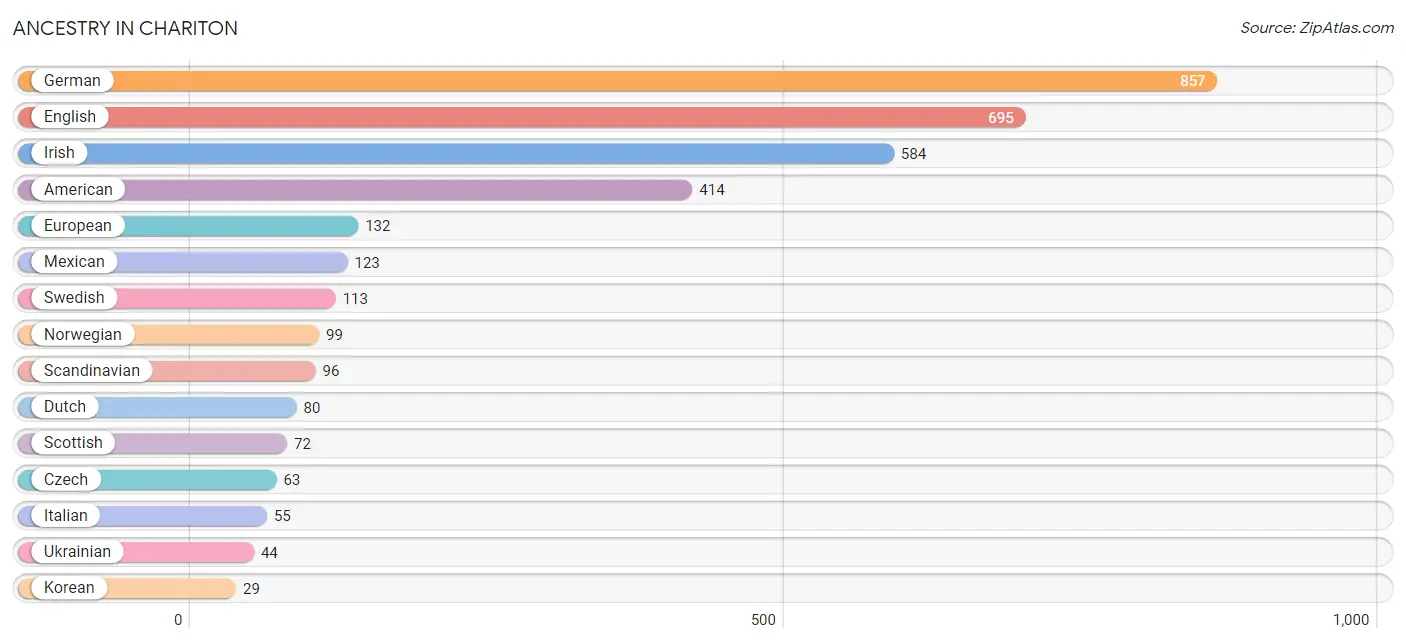
| Ancestry | # Population | % Population |
| American | 414 | 9.9% |
| British | 15 | 0.4% |
| Cajun | 11 | 0.3% |
| Colombian | 10 | 0.2% |
| Czech | 63 | 1.5% |
| Danish | 15 | 0.4% |
| Dutch | 80 | 1.9% |
| Eastern European | 4 | 0.1% |
| English | 695 | 16.5% |
| European | 132 | 3.1% |
| French | 26 | 0.6% |
| German | 857 | 20.4% |
| Irish | 584 | 13.9% |
| Italian | 55 | 1.3% |
| Korean | 29 | 0.7% |
| Mexican | 123 | 2.9% |
| Northern European | 9 | 0.2% |
| Norwegian | 99 | 2.4% |
| Polish | 9 | 0.2% |
| Russian | 22 | 0.5% |
| Scandinavian | 96 | 2.3% |
| Scotch-Irish | 22 | 0.5% |
| Scottish | 72 | 1.7% |
| South American | 10 | 0.2% |
| Spaniard | 26 | 0.6% |
| Swedish | 113 | 2.7% |
| Thai | 12 | 0.3% |
| Ukrainian | 44 | 1.1% |
| Yugoslavian | 6 | 0.1% | View All 29 Rows |
Immigrants in Chariton
The most numerous immigrant groups reported in Chariton came from Europe (85 | 2.0%), Latin America (56 | 1.3%), Eastern Europe (54 | 1.3%), Central America (46 | 1.1%), and Mexico (46 | 1.1%), together accounting for 6.8% of all Chariton residents.
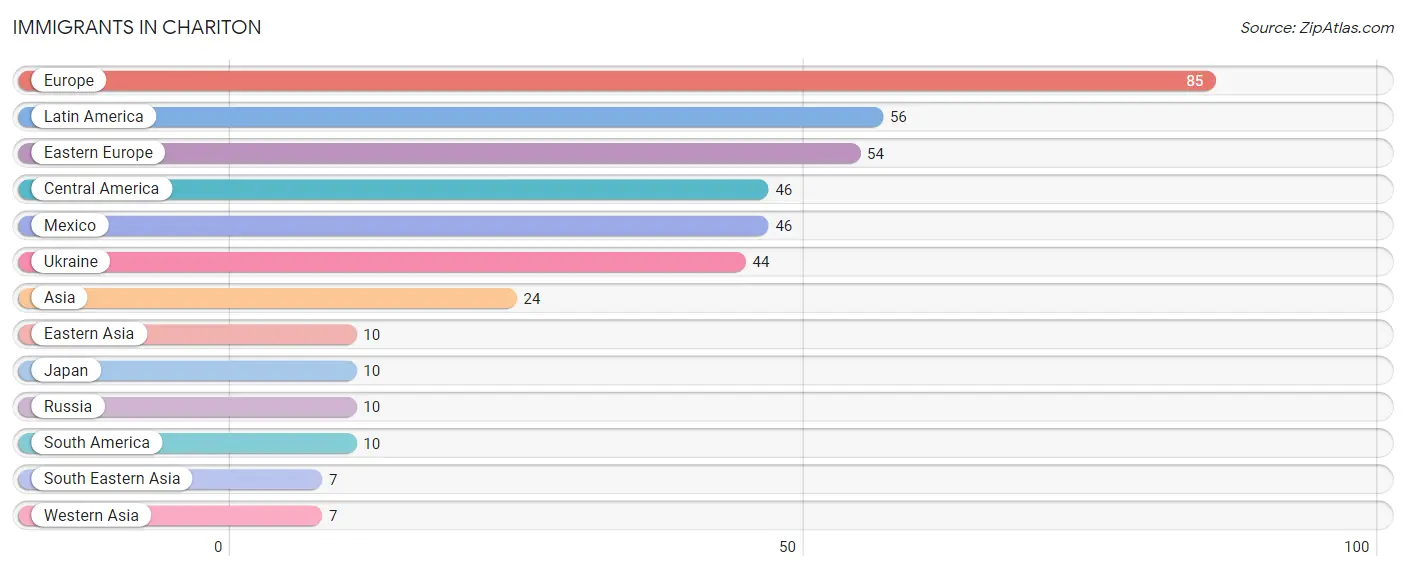
| Immigration Origin | # Population | % Population |
| Asia | 24 | 0.6% |
| Central America | 46 | 1.1% |
| Eastern Asia | 10 | 0.2% |
| Eastern Europe | 54 | 1.3% |
| Europe | 85 | 2.0% |
| Japan | 10 | 0.2% |
| Latin America | 56 | 1.3% |
| Mexico | 46 | 1.1% |
| Russia | 10 | 0.2% |
| South America | 10 | 0.2% |
| South Eastern Asia | 7 | 0.2% |
| Ukraine | 44 | 1.1% |
| Western Asia | 7 | 0.2% | View All 13 Rows |
Sex and Age in Chariton
Sex and Age in Chariton
The most populous age groups in Chariton are 25 to 29 Years (180 | 8.7%) for men and 60 to 64 Years (225 | 10.5%) for women.
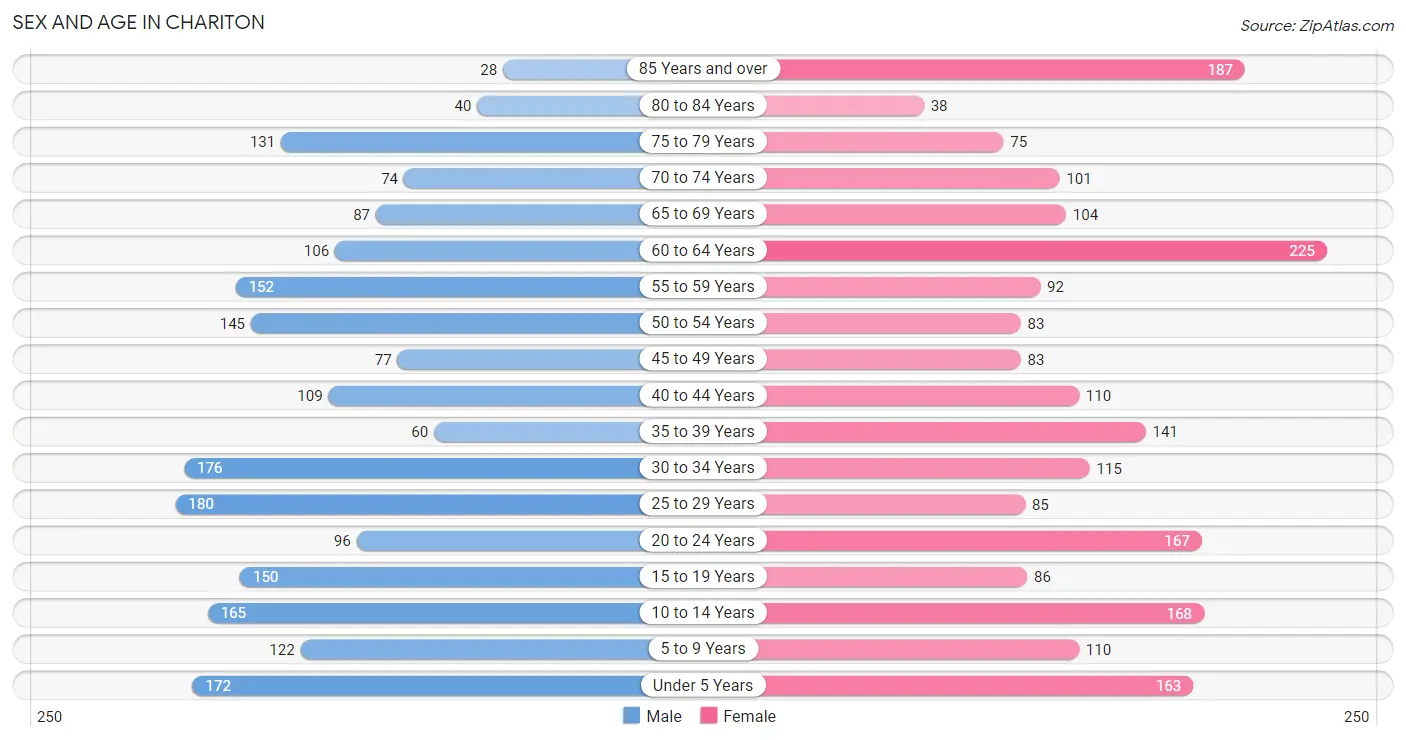
| Age Bracket | Male | Female |
| Under 5 Years | 172 (8.3%) | 163 (7.6%) |
| 5 to 9 Years | 122 (5.9%) | 110 (5.2%) |
| 10 to 14 Years | 165 (8.0%) | 168 (7.9%) |
| 15 to 19 Years | 150 (7.2%) | 86 (4.0%) |
| 20 to 24 Years | 96 (4.6%) | 167 (7.8%) |
| 25 to 29 Years | 180 (8.7%) | 85 (4.0%) |
| 30 to 34 Years | 176 (8.5%) | 115 (5.4%) |
| 35 to 39 Years | 60 (2.9%) | 141 (6.6%) |
| 40 to 44 Years | 109 (5.3%) | 110 (5.2%) |
| 45 to 49 Years | 77 (3.7%) | 83 (3.9%) |
| 50 to 54 Years | 145 (7.0%) | 83 (3.9%) |
| 55 to 59 Years | 152 (7.3%) | 92 (4.3%) |
| 60 to 64 Years | 106 (5.1%) | 225 (10.5%) |
| 65 to 69 Years | 87 (4.2%) | 104 (4.9%) |
| 70 to 74 Years | 74 (3.6%) | 101 (4.7%) |
| 75 to 79 Years | 131 (6.3%) | 75 (3.5%) |
| 80 to 84 Years | 40 (1.9%) | 38 (1.8%) |
| 85 Years and over | 28 (1.3%) | 187 (8.8%) |
| Total | 2,070 (100.0%) | 2,133 (100.0%) |
Families and Households in Chariton
Median Family Size in Chariton
The median family size in Chariton is 2.97 persons per family, with single male/father families (87 | 7.9%) accounting for the largest median family size of 3.38 persons per family. On the other hand, single female/mother families (225 | 20.5%) represent the smallest median family size with 2.70 persons per family.
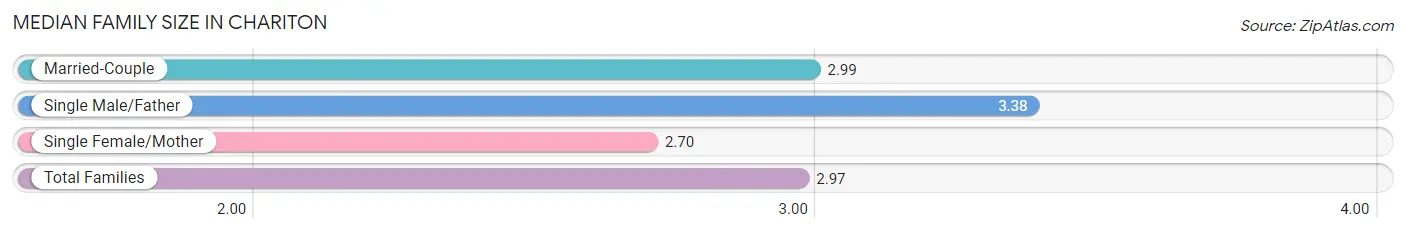
| Family Type | # Families | Family Size |
| Married-Couple | 785 (71.6%) | 2.99 |
| Single Male/Father | 87 (7.9%) | 3.38 |
| Single Female/Mother | 225 (20.5%) | 2.70 |
| Total Families | 1,097 (100.0%) | 2.97 |
Median Household Size in Chariton
The median household size in Chariton is 2.33 persons per household, with single male/father households (87 | 5.0%) accounting for the largest median household size of 3.82 persons per household. non-family households (661 | 37.6%) represent the smallest median household size with 1.09 persons per household.
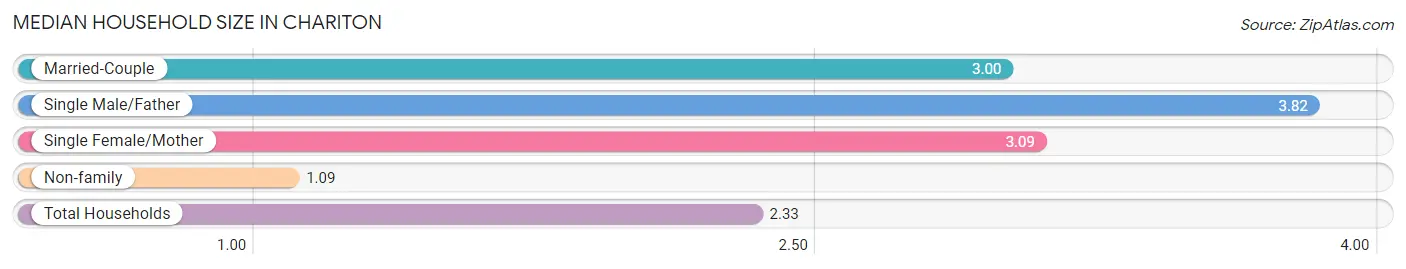
| Household Type | # Households | Household Size |
| Married-Couple | 785 (44.7%) | 3.00 |
| Single Male/Father | 87 (5.0%) | 3.82 |
| Single Female/Mother | 225 (12.8%) | 3.09 |
| Non-family | 661 (37.6%) | 1.09 |
| Total Households | 1,758 (100.0%) | 2.33 |
Household Size by Marriage Status in Chariton
Out of a total of 1,758 households in Chariton, 1,097 (62.4%) are family households, while 661 (37.6%) are nonfamily households. The most numerous type of family households are 2-person households, comprising 476, and the most common type of nonfamily households are 1-person households, comprising 607.
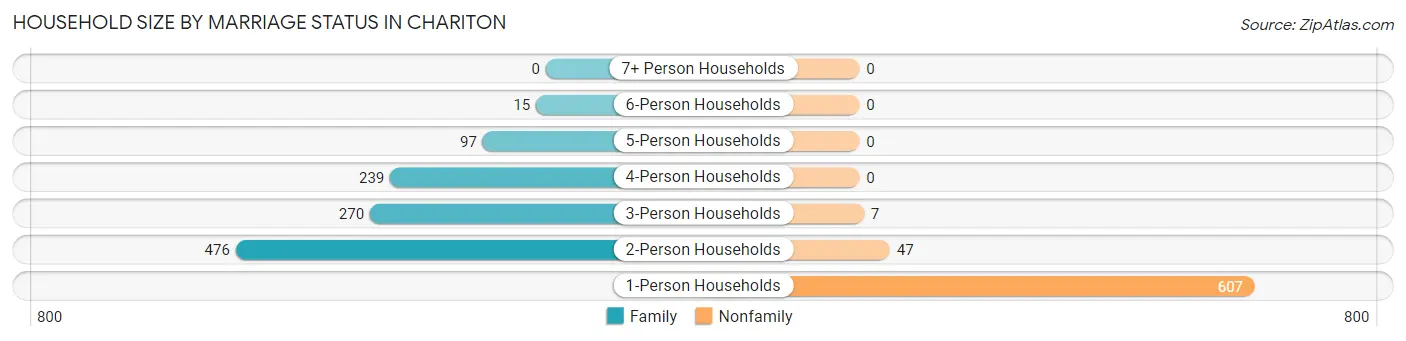
| Household Size | Family Households | Nonfamily Households |
| 1-Person Households | - | 607 (34.5%) |
| 2-Person Households | 476 (27.1%) | 47 (2.7%) |
| 3-Person Households | 270 (15.4%) | 7 (0.4%) |
| 4-Person Households | 239 (13.6%) | 0 (0.0%) |
| 5-Person Households | 97 (5.5%) | 0 (0.0%) |
| 6-Person Households | 15 (0.9%) | 0 (0.0%) |
| 7+ Person Households | 0 (0.0%) | 0 (0.0%) |
| Total | 1,097 (62.4%) | 661 (37.6%) |
Female Fertility in Chariton
Fertility by Age in Chariton
Average fertility rate in Chariton is 51.0 births per 1,000 women. Women in the age bracket of 20 to 34 years have the highest fertility rate with 112.0 births per 1,000 women. Women in the age bracket of 20 to 34 years acount for 100.0% of all women with births.
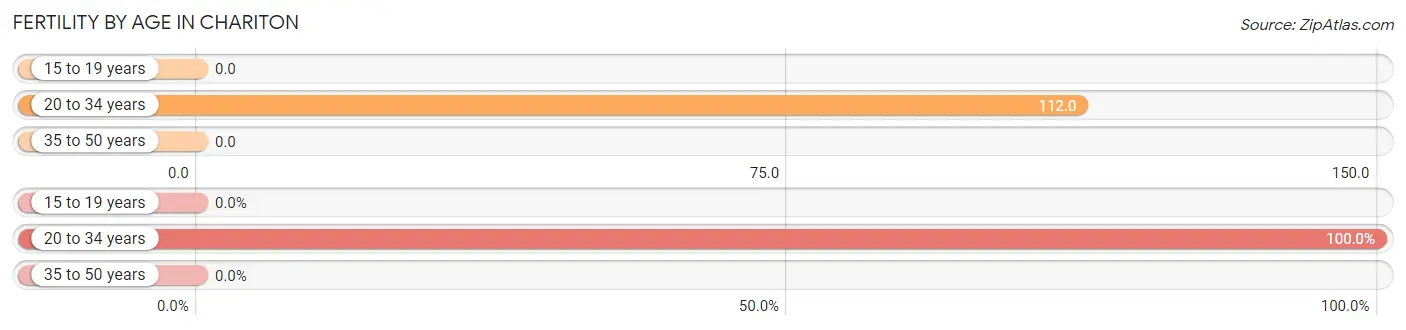
| Age Bracket | Women with Births | Births / 1,000 Women |
| 15 to 19 years | 0 (0.0%) | 0.0 |
| 20 to 34 years | 41 (100.0%) | 112.0 |
| 35 to 50 years | 0 (0.0%) | 0.0 |
| Total | 41 (100.0%) | 51.0 |
Fertility by Age by Marriage Status in Chariton
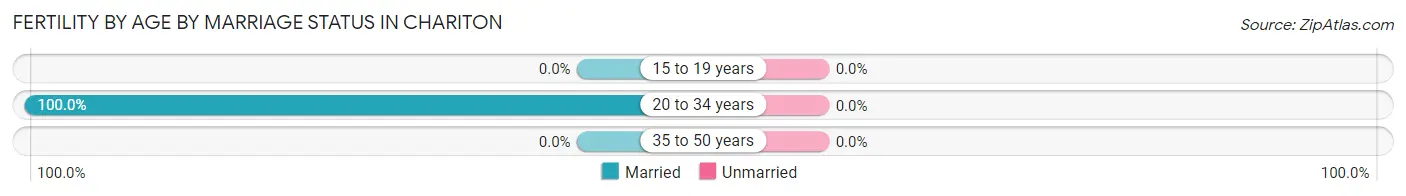
| Age Bracket | Married | Unmarried |
| 15 to 19 years | 0 (0.0%) | 0 (0.0%) |
| 20 to 34 years | 41 (100.0%) | 0 (0.0%) |
| 35 to 50 years | 0 (0.0%) | 0 (0.0%) |
| Total | 41 (100.0%) | 0 (0.0%) |
Fertility by Education in Chariton
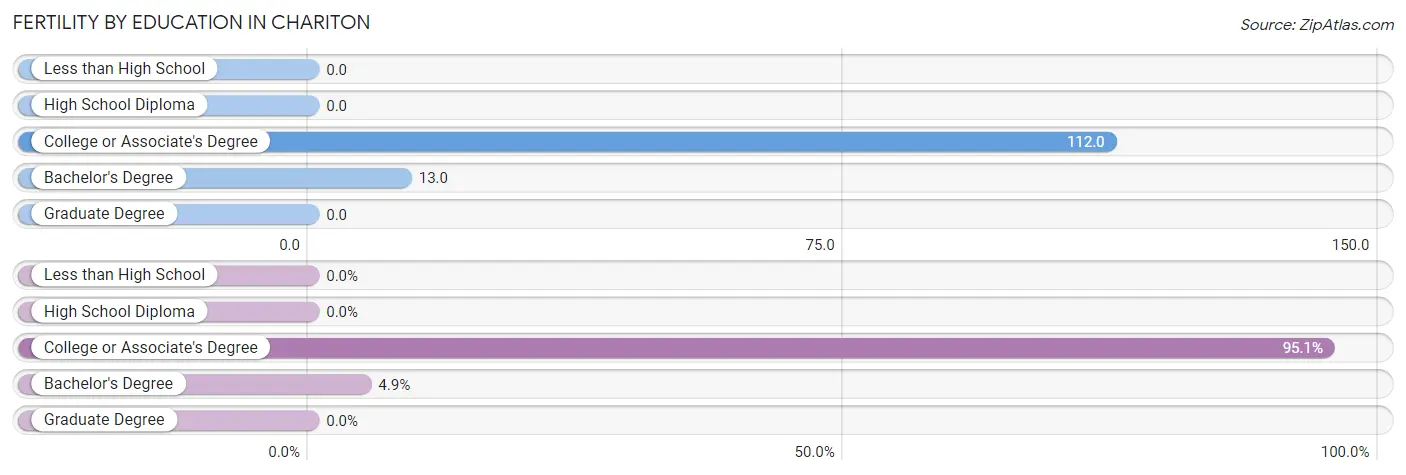
| Educational Attainment | Women with Births | Births / 1,000 Women |
| Less than High School | 0 (0.0%) | 0.0 |
| High School Diploma | 0 (0.0%) | 0.0 |
| College or Associate's Degree | 39 (95.1%) | 112.0 |
| Bachelor's Degree | 2 (4.9%) | 13.0 |
| Graduate Degree | 0 (0.0%) | 0.0 |
| Total | 41 (100.0%) | 51.0 |
Fertility by Education by Marriage Status in Chariton
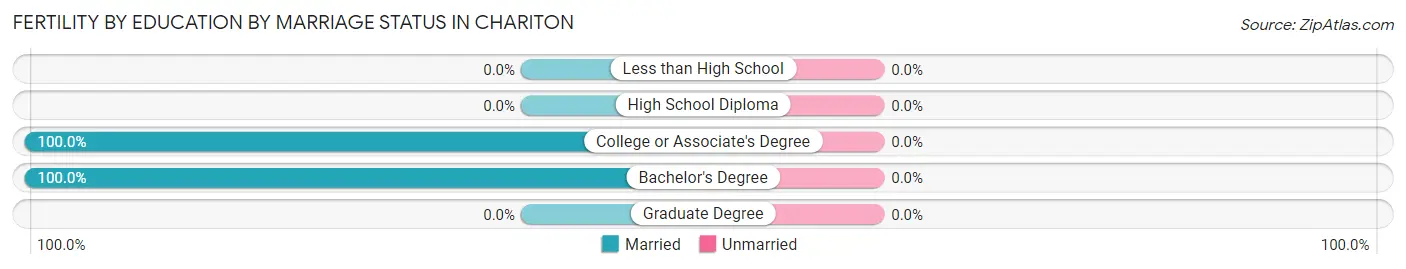
| Educational Attainment | Married | Unmarried |
| Less than High School | 0 (0.0%) | 0 (0.0%) |
| High School Diploma | 0 (0.0%) | 0 (0.0%) |
| College or Associate's Degree | 39 (100.0%) | 0 (0.0%) |
| Bachelor's Degree | 2 (100.0%) | 0 (0.0%) |
| Graduate Degree | 0 (0.0%) | 0 (0.0%) |
| Total | 41 (100.0%) | 0 (0.0%) |
Employment Characteristics in Chariton
Employment by Class of Employer in Chariton
Among the 1,905 employed individuals in Chariton, private company employees (1,333 | 70.0%), local government employees (245 | 12.9%), and self-employed (not incorporated) (114 | 6.0%) make up the most common classes of employment.
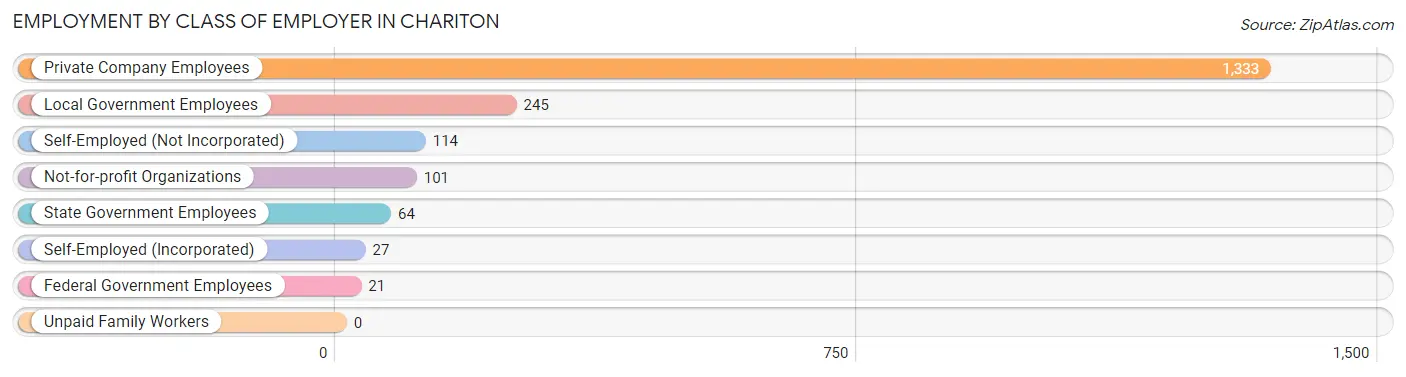
| Employer Class | # Employees | % Employees |
| Private Company Employees | 1,333 | 70.0% |
| Self-Employed (Incorporated) | 27 | 1.4% |
| Self-Employed (Not Incorporated) | 114 | 6.0% |
| Not-for-profit Organizations | 101 | 5.3% |
| Local Government Employees | 245 | 12.9% |
| State Government Employees | 64 | 3.4% |
| Federal Government Employees | 21 | 1.1% |
| Unpaid Family Workers | 0 | 0.0% |
| Total | 1,905 | 100.0% |
Employment Status by Age in Chariton
According to the labor force statistics for Chariton, out of the total population over 16 years of age (3,276), 62.9% or 2,061 individuals are in the labor force, with 6.4% or 132 of them unemployed. The age group with the highest labor force participation rate is 25 to 29 years, with 100.0% or 265 individuals in the labor force. Within the labor force, the 16 to 19 years age range has the highest percentage of unemployed individuals, with 25.9% or 42 of them being unemployed.
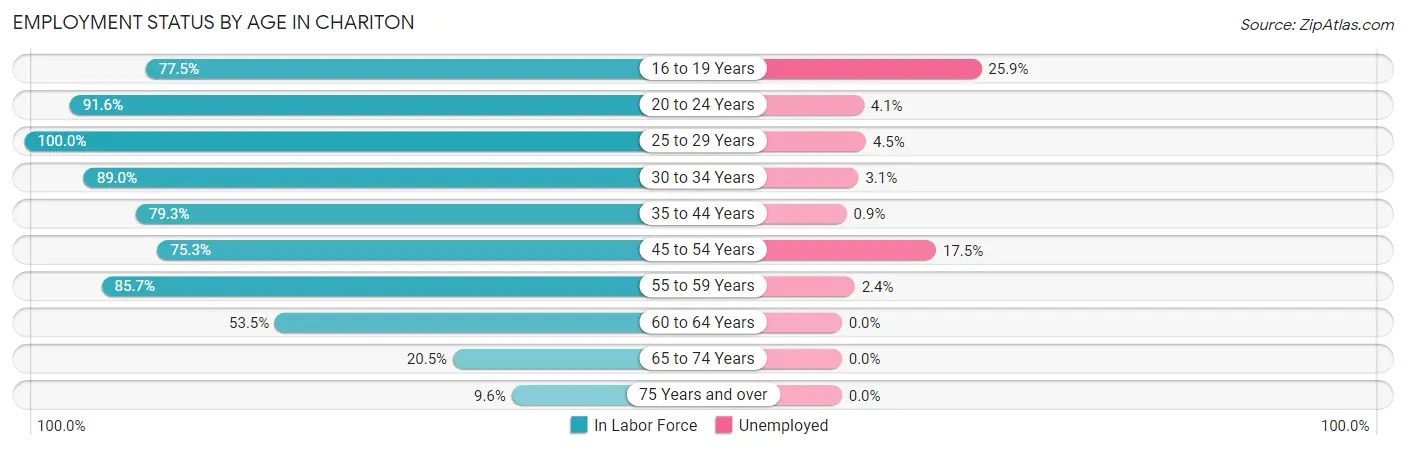
| Age Bracket | In Labor Force | Unemployed |
| 16 to 19 Years | 162 (77.5%) | 42 (25.9%) |
| 20 to 24 Years | 241 (91.6%) | 10 (4.1%) |
| 25 to 29 Years | 265 (100.0%) | 12 (4.5%) |
| 30 to 34 Years | 259 (89.0%) | 8 (3.1%) |
| 35 to 44 Years | 333 (79.3%) | 3 (0.9%) |
| 45 to 54 Years | 292 (75.3%) | 51 (17.5%) |
| 55 to 59 Years | 209 (85.7%) | 5 (2.4%) |
| 60 to 64 Years | 177 (53.5%) | 0 (0.0%) |
| 65 to 74 Years | 75 (20.5%) | 0 (0.0%) |
| 75 Years and over | 48 (9.6%) | 0 (0.0%) |
| Total | 2,061 (62.9%) | 132 (6.4%) |
Employment Status by Educational Attainment in Chariton
According to labor force statistics for Chariton, 79.2% of individuals (1,536) out of the total population between 25 and 64 years of age (1,939) are in the labor force, with 5.1% or 78 of them being unemployed. The group with the highest labor force participation rate are those with the educational attainment of bachelor's degree or higher, with 81.9% or 208 individuals in the labor force. Within the labor force, individuals with high school diploma education have the highest percentage of unemployment, with 12.6% or 76 of them being unemployed.
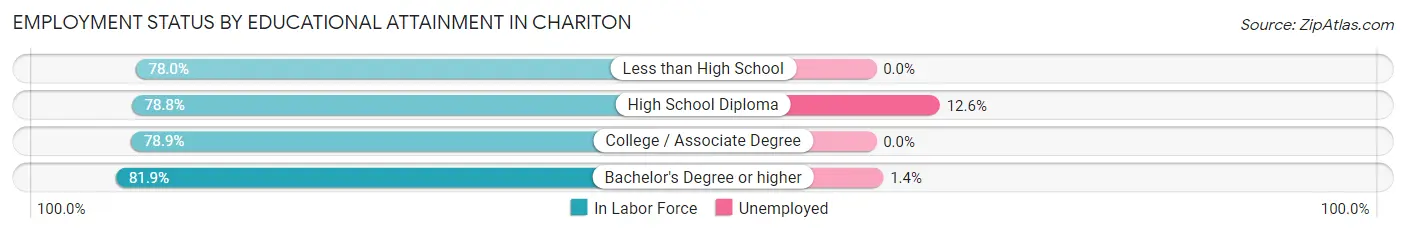
| Educational Attainment | In Labor Force | Unemployed |
| Less than High School | 117 (78.0%) | 0 (0.0%) |
| High School Diploma | 602 (78.8%) | 96 (12.6%) |
| College / Associate Degree | 608 (78.9%) | 0 (0.0%) |
| Bachelor's Degree or higher | 208 (81.9%) | 4 (1.4%) |
| Total | 1,536 (79.2%) | 99 (5.1%) |
Employment Occupations by Sex in Chariton
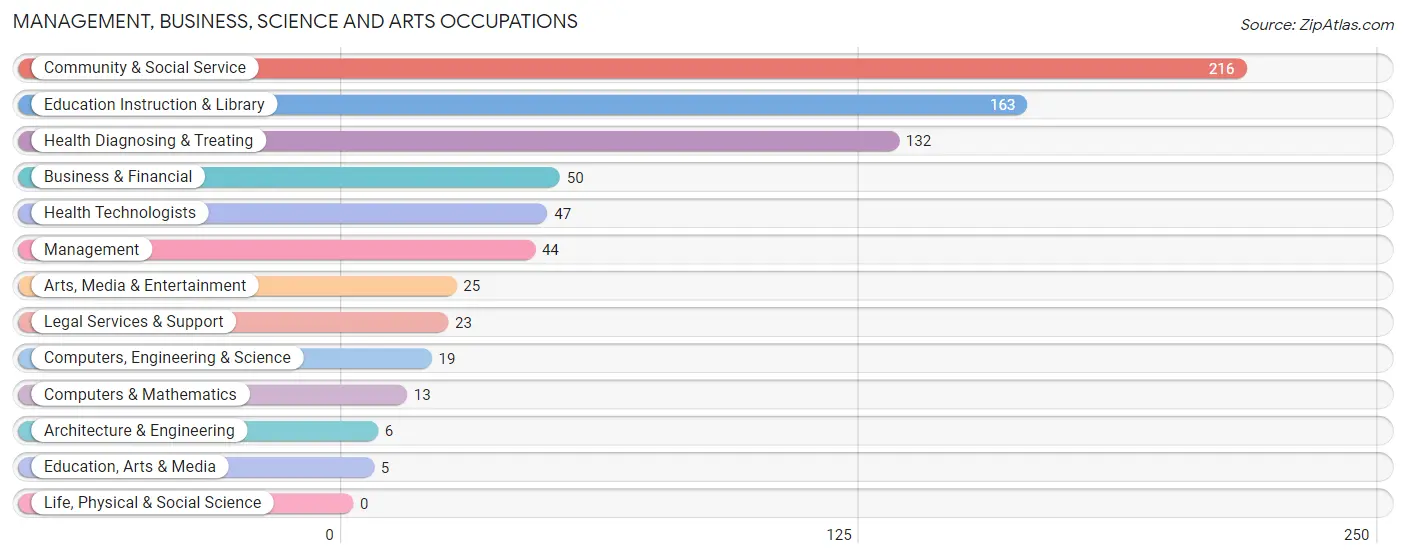
Management, Business, Science and Arts Occupations
The most common Management, Business, Science and Arts occupations in Chariton are Community & Social Service (216 | 11.2%), Education Instruction & Library (163 | 8.5%), Health Diagnosing & Treating (132 | 6.8%), Business & Financial (50 | 2.6%), and Health Technologists (47 | 2.4%).
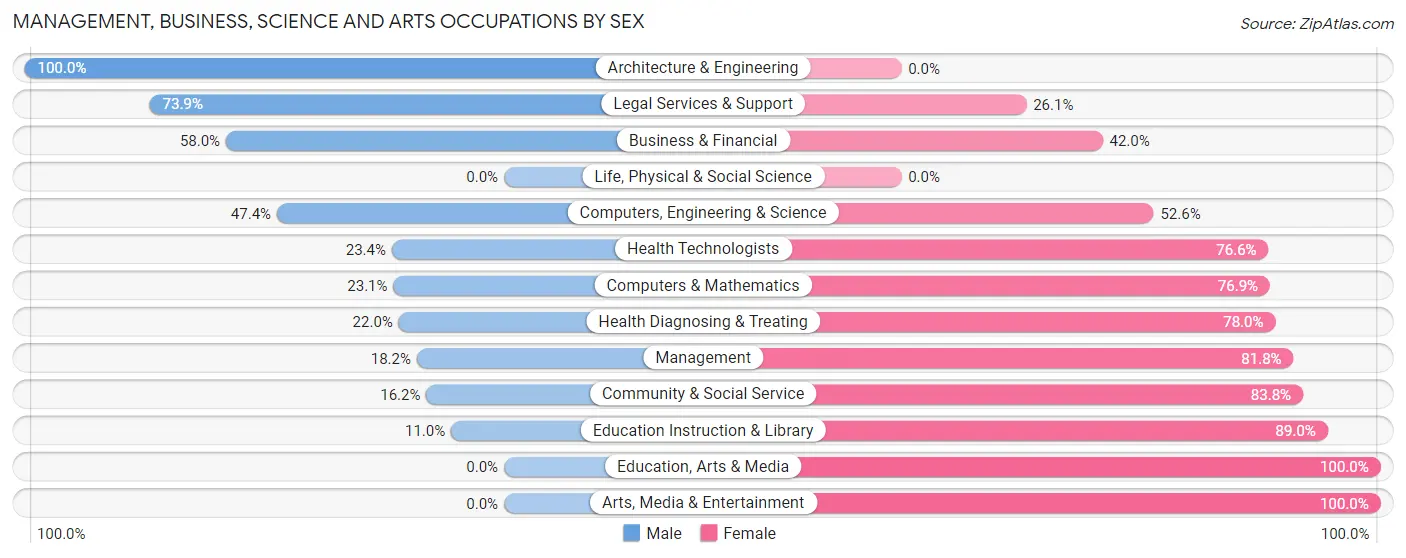
Management, Business, Science and Arts Occupations by Sex
Within the Management, Business, Science and Arts occupations in Chariton, the most male-oriented occupations are Architecture & Engineering (100.0%), Legal Services & Support (73.9%), and Business & Financial (58.0%), while the most female-oriented occupations are Education, Arts & Media (100.0%), Arts, Media & Entertainment (100.0%), and Education Instruction & Library (89.0%).
| Occupation | Male | Female |
| Management | 8 (18.2%) | 36 (81.8%) |
| Business & Financial | 29 (58.0%) | 21 (42.0%) |
| Computers, Engineering & Science | 9 (47.4%) | 10 (52.6%) |
| Computers & Mathematics | 3 (23.1%) | 10 (76.9%) |
| Architecture & Engineering | 6 (100.0%) | 0 (0.0%) |
| Life, Physical & Social Science | 0 (0.0%) | 0 (0.0%) |
| Community & Social Service | 35 (16.2%) | 181 (83.8%) |
| Education, Arts & Media | 0 (0.0%) | 5 (100.0%) |
| Legal Services & Support | 17 (73.9%) | 6 (26.1%) |
| Education Instruction & Library | 18 (11.0%) | 145 (89.0%) |
| Arts, Media & Entertainment | 0 (0.0%) | 25 (100.0%) |
| Health Diagnosing & Treating | 29 (22.0%) | 103 (78.0%) |
| Health Technologists | 11 (23.4%) | 36 (76.6%) |
| Total (Category) | 110 (23.9%) | 351 (76.1%) |
| Total (Overall) | 1,052 (54.5%) | 878 (45.5%) |
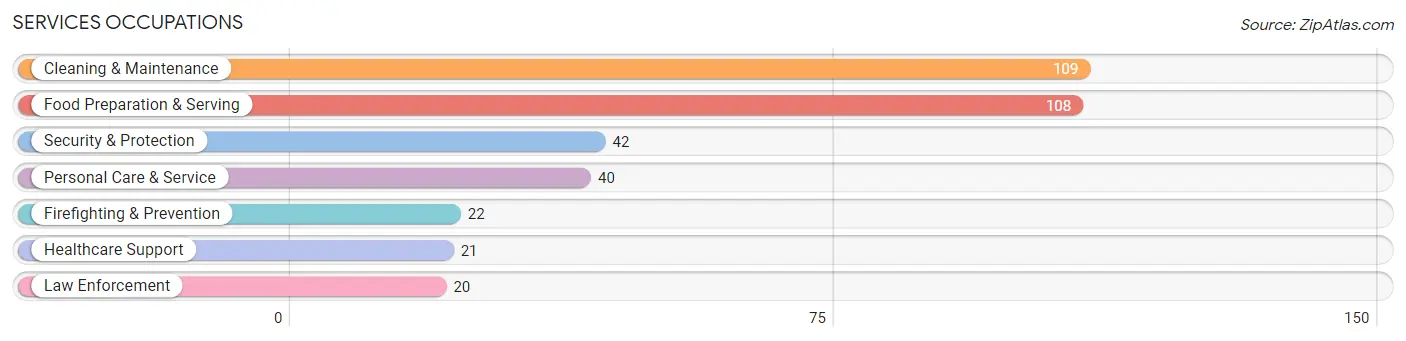
Services Occupations
The most common Services occupations in Chariton are Cleaning & Maintenance (109 | 5.7%), Food Preparation & Serving (108 | 5.6%), Security & Protection (42 | 2.2%), Personal Care & Service (40 | 2.1%), and Firefighting & Prevention (22 | 1.1%).
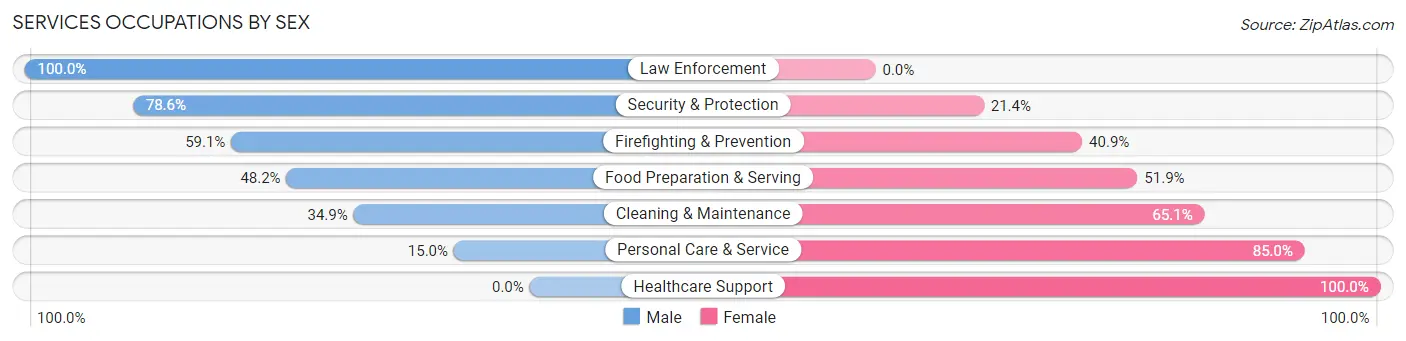
Services Occupations by Sex
Within the Services occupations in Chariton, the most male-oriented occupations are Law Enforcement (100.0%), Security & Protection (78.6%), and Firefighting & Prevention (59.1%), while the most female-oriented occupations are Healthcare Support (100.0%), Personal Care & Service (85.0%), and Cleaning & Maintenance (65.1%).
| Occupation | Male | Female |
| Healthcare Support | 0 (0.0%) | 21 (100.0%) |
| Security & Protection | 33 (78.6%) | 9 (21.4%) |
| Firefighting & Prevention | 13 (59.1%) | 9 (40.9%) |
| Law Enforcement | 20 (100.0%) | 0 (0.0%) |
| Food Preparation & Serving | 52 (48.1%) | 56 (51.8%) |
| Cleaning & Maintenance | 38 (34.9%) | 71 (65.1%) |
| Personal Care & Service | 6 (15.0%) | 34 (85.0%) |
| Total (Category) | 129 (40.3%) | 191 (59.7%) |
| Total (Overall) | 1,052 (54.5%) | 878 (45.5%) |
Sales and Office Occupations
The most common Sales and Office occupations in Chariton are Sales & Related (250 | 13.0%), and Office & Administration (213 | 11.0%).
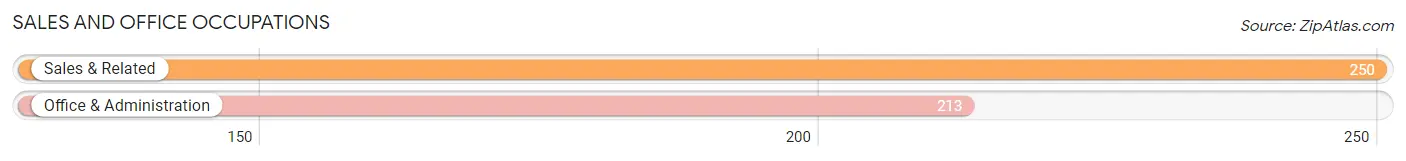
Sales and Office Occupations by Sex
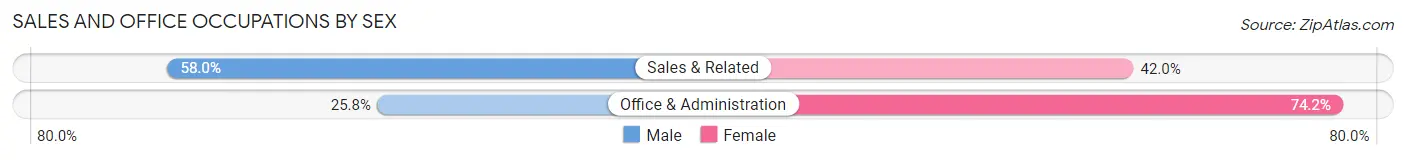
| Occupation | Male | Female |
| Sales & Related | 145 (58.0%) | 105 (42.0%) |
| Office & Administration | 55 (25.8%) | 158 (74.2%) |
| Total (Category) | 200 (43.2%) | 263 (56.8%) |
| Total (Overall) | 1,052 (54.5%) | 878 (45.5%) |
Natural Resources, Construction and Maintenance Occupations
The most common Natural Resources, Construction and Maintenance occupations in Chariton are Construction & Extraction (136 | 7.0%), Installation, Maintenance & Repair (53 | 2.8%), and Farming, Fishing & Forestry (29 | 1.5%).
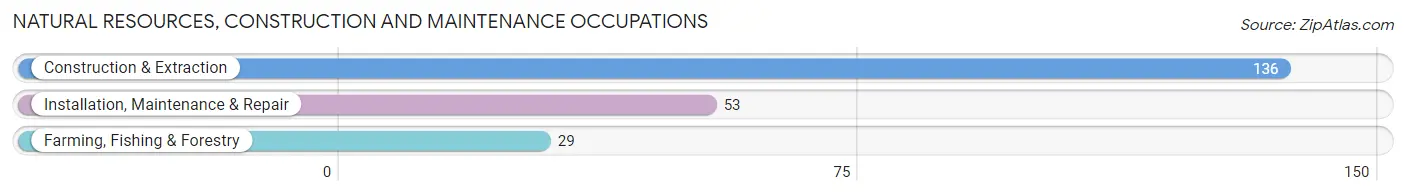
Natural Resources, Construction and Maintenance Occupations by Sex
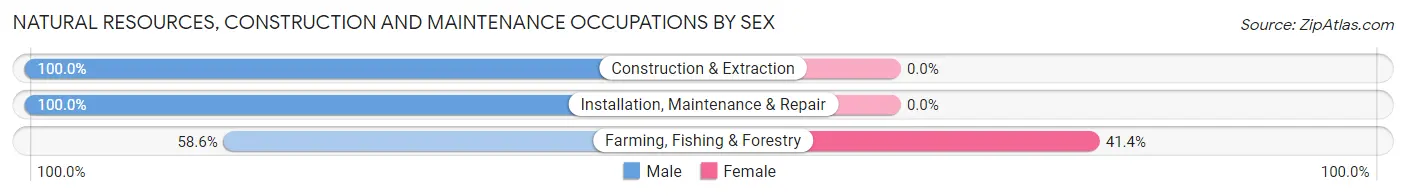
| Occupation | Male | Female |
| Farming, Fishing & Forestry | 17 (58.6%) | 12 (41.4%) |
| Construction & Extraction | 136 (100.0%) | 0 (0.0%) |
| Installation, Maintenance & Repair | 53 (100.0%) | 0 (0.0%) |
| Total (Category) | 206 (94.5%) | 12 (5.5%) |
| Total (Overall) | 1,052 (54.5%) | 878 (45.5%) |
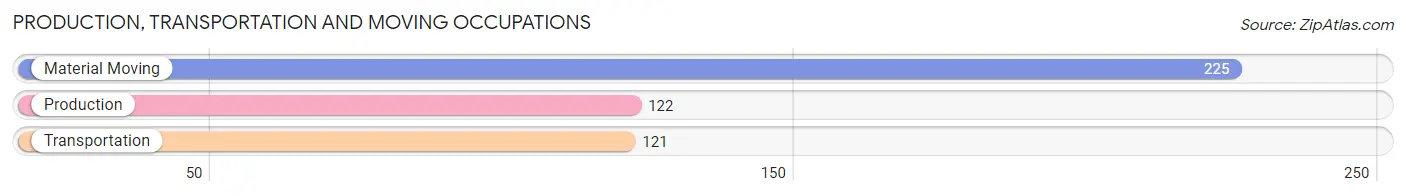
Production, Transportation and Moving Occupations
The most common Production, Transportation and Moving occupations in Chariton are Material Moving (225 | 11.7%), Production (122 | 6.3%), and Transportation (121 | 6.3%).
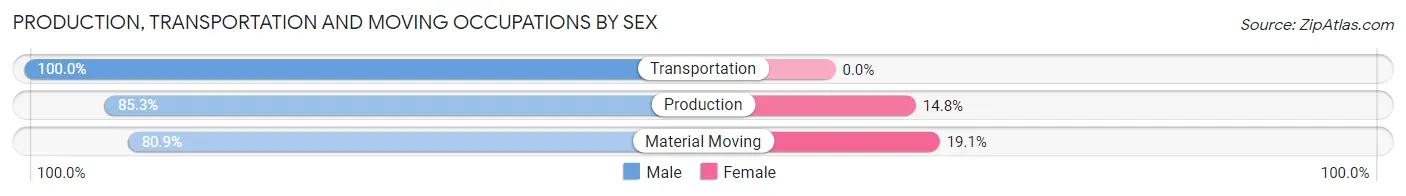
Production, Transportation and Moving Occupations by Sex
| Occupation | Male | Female |
| Production | 104 (85.3%) | 18 (14.7%) |
| Transportation | 121 (100.0%) | 0 (0.0%) |
| Material Moving | 182 (80.9%) | 43 (19.1%) |
| Total (Category) | 407 (87.0%) | 61 (13.0%) |
| Total (Overall) | 1,052 (54.5%) | 878 (45.5%) |
Employment Industries by Sex in Chariton
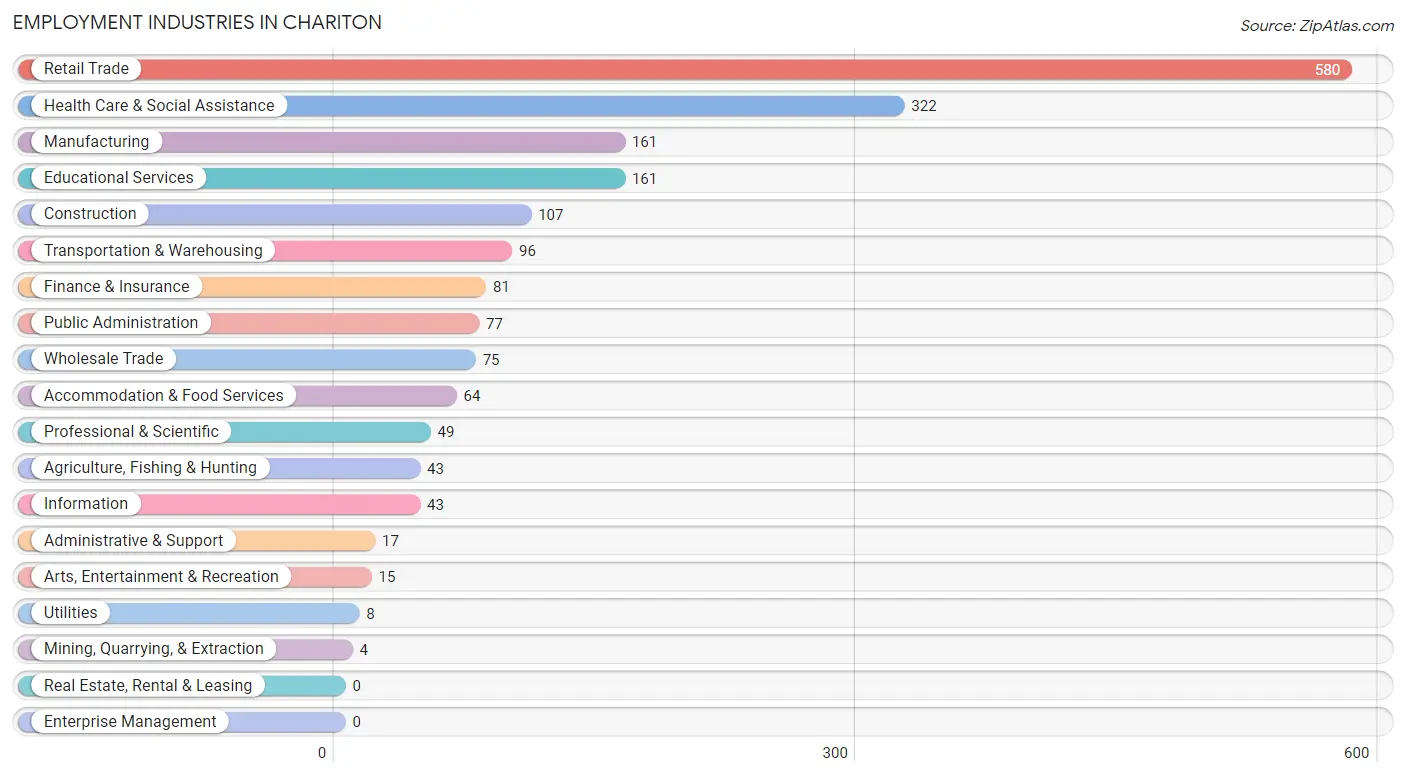
Employment Industries in Chariton
The major employment industries in Chariton include Retail Trade (580 | 30.0%), Health Care & Social Assistance (322 | 16.7%), Manufacturing (161 | 8.3%), Educational Services (161 | 8.3%), and Construction (107 | 5.5%).
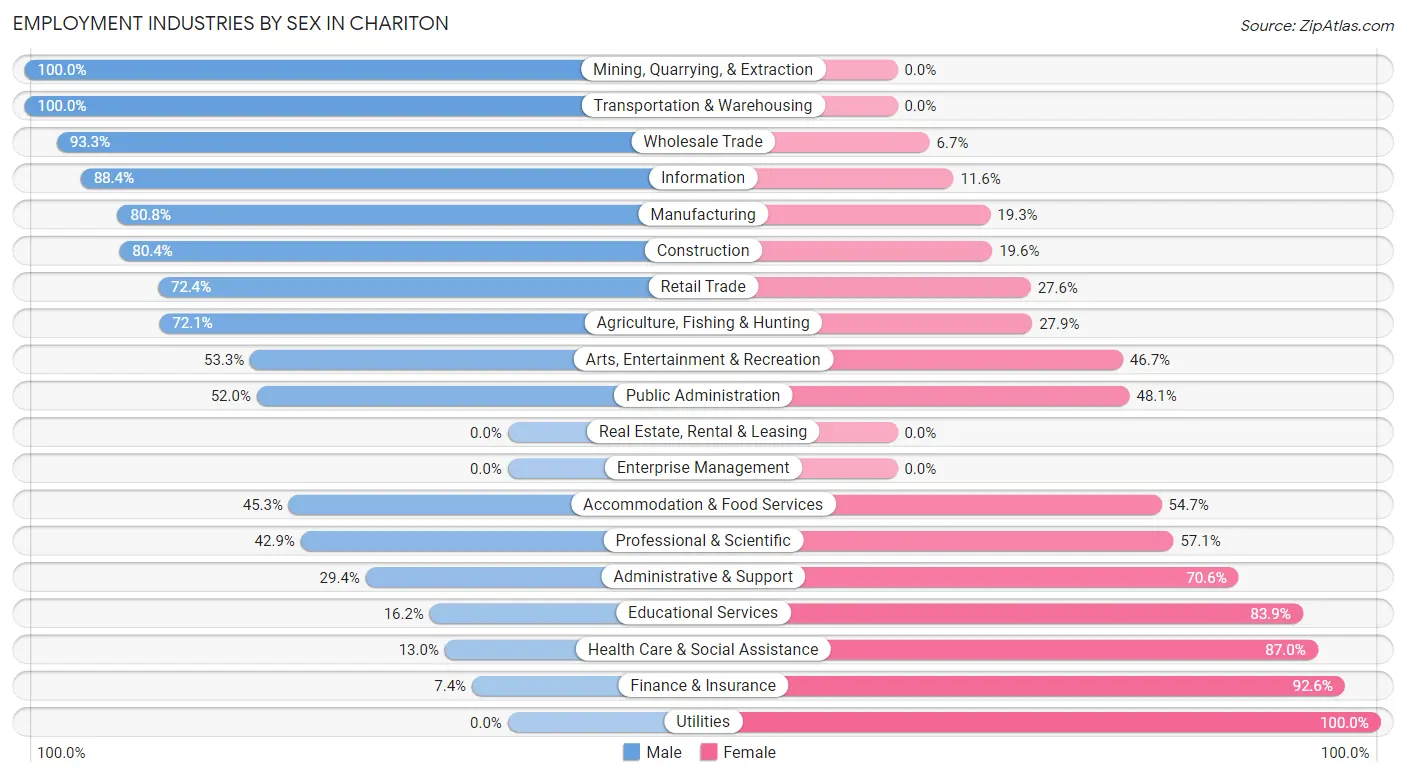
Employment Industries by Sex in Chariton
The Chariton industries that see more men than women are Mining, Quarrying, & Extraction (100.0%), Transportation & Warehousing (100.0%), and Wholesale Trade (93.3%), whereas the industries that tend to have a higher number of women are Utilities (100.0%), Finance & Insurance (92.6%), and Health Care & Social Assistance (87.0%).
| Industry | Male | Female |
| Agriculture, Fishing & Hunting | 31 (72.1%) | 12 (27.9%) |
| Mining, Quarrying, & Extraction | 4 (100.0%) | 0 (0.0%) |
| Construction | 86 (80.4%) | 21 (19.6%) |
| Manufacturing | 130 (80.7%) | 31 (19.3%) |
| Wholesale Trade | 70 (93.3%) | 5 (6.7%) |
| Retail Trade | 420 (72.4%) | 160 (27.6%) |
| Transportation & Warehousing | 96 (100.0%) | 0 (0.0%) |
| Utilities | 0 (0.0%) | 8 (100.0%) |
| Information | 38 (88.4%) | 5 (11.6%) |
| Finance & Insurance | 6 (7.4%) | 75 (92.6%) |
| Real Estate, Rental & Leasing | 0 (0.0%) | 0 (0.0%) |
| Professional & Scientific | 21 (42.9%) | 28 (57.1%) |
| Enterprise Management | 0 (0.0%) | 0 (0.0%) |
| Administrative & Support | 5 (29.4%) | 12 (70.6%) |
| Educational Services | 26 (16.2%) | 135 (83.9%) |
| Health Care & Social Assistance | 42 (13.0%) | 280 (87.0%) |
| Arts, Entertainment & Recreation | 8 (53.3%) | 7 (46.7%) |
| Accommodation & Food Services | 29 (45.3%) | 35 (54.7%) |
| Public Administration | 40 (51.9%) | 37 (48.0%) |
| Total | 1,052 (54.5%) | 878 (45.5%) |
Education in Chariton
School Enrollment in Chariton
The most common levels of schooling among the 968 students in Chariton are elementary school (340 | 35.1%), high school (213 | 22.0%), and middle school (196 | 20.3%).
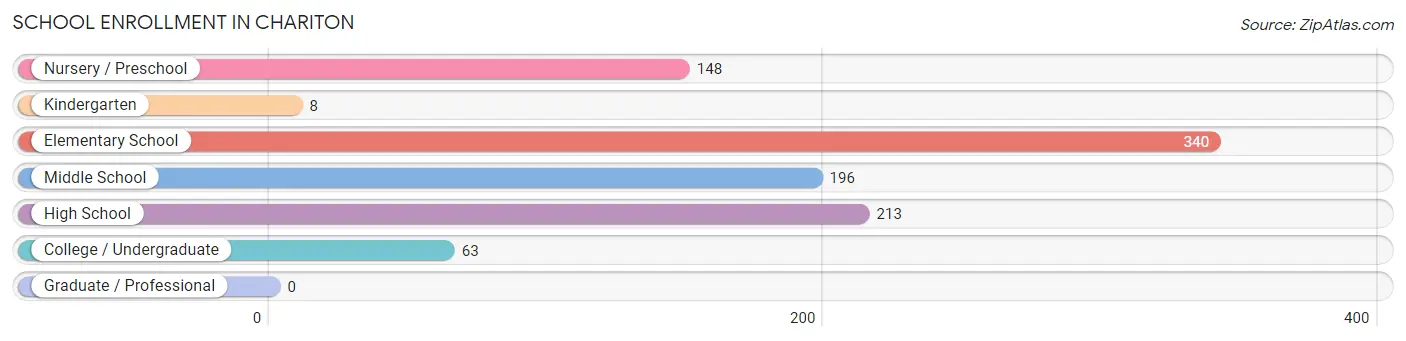
| School Level | # Students | % Students |
| Nursery / Preschool | 148 | 15.3% |
| Kindergarten | 8 | 0.8% |
| Elementary School | 340 | 35.1% |
| Middle School | 196 | 20.3% |
| High School | 213 | 22.0% |
| College / Undergraduate | 63 | 6.5% |
| Graduate / Professional | 0 | 0.0% |
| Total | 968 | 100.0% |
School Enrollment by Age by Funding Source in Chariton
Out of a total of 968 students who are enrolled in schools in Chariton, 50 (5.2%) attend a private institution, while the remaining 918 (94.8%) are enrolled in public schools. The age group of 35 years and over has the highest likelihood of being enrolled in private schools, with 6 (54.5% in the age bracket) enrolled. Conversely, the age group of 3 to 4 year olds has the lowest likelihood of being enrolled in a private school, with 146 (100.0% in the age bracket) attending a public institution.
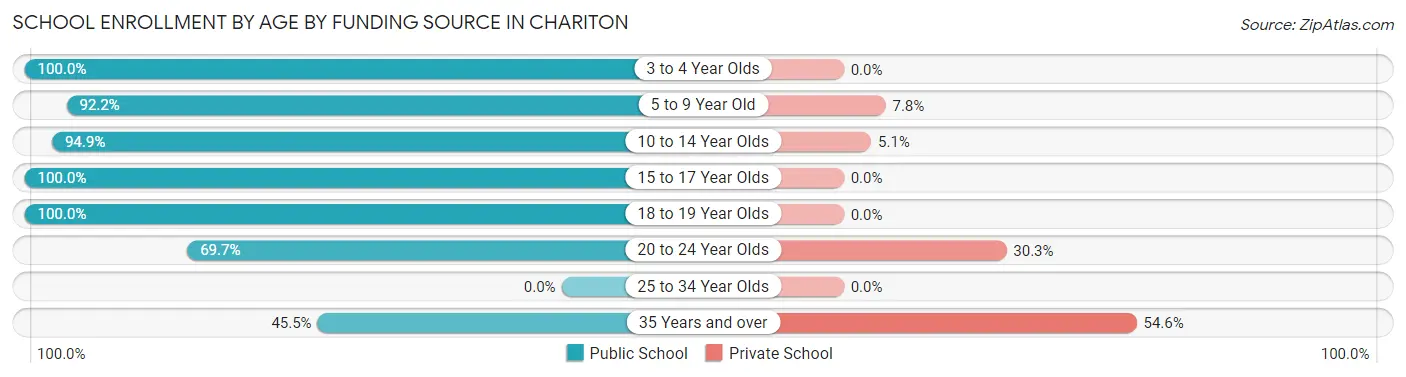
| Age Bracket | Public School | Private School |
| 3 to 4 Year Olds | 146 (100.0%) | 0 (0.0%) |
| 5 to 9 Year Old | 201 (92.2%) | 17 (7.8%) |
| 10 to 14 Year Olds | 316 (94.9%) | 17 (5.1%) |
| 15 to 17 Year Olds | 126 (100.0%) | 0 (0.0%) |
| 18 to 19 Year Olds | 101 (100.0%) | 0 (0.0%) |
| 20 to 24 Year Olds | 23 (69.7%) | 10 (30.3%) |
| 25 to 34 Year Olds | 0 (0.0%) | 0 (0.0%) |
| 35 Years and over | 5 (45.5%) | 6 (54.5%) |
| Total | 918 (94.8%) | 50 (5.2%) |
Educational Attainment by Field of Study in Chariton
Education (115 | 30.7%), arts & humanities (47 | 12.5%), business (45 | 12.0%), science & technology (29 | 7.7%), and communications (26 | 6.9%) are the most common fields of study among 375 individuals in Chariton who have obtained a bachelor's degree or higher.
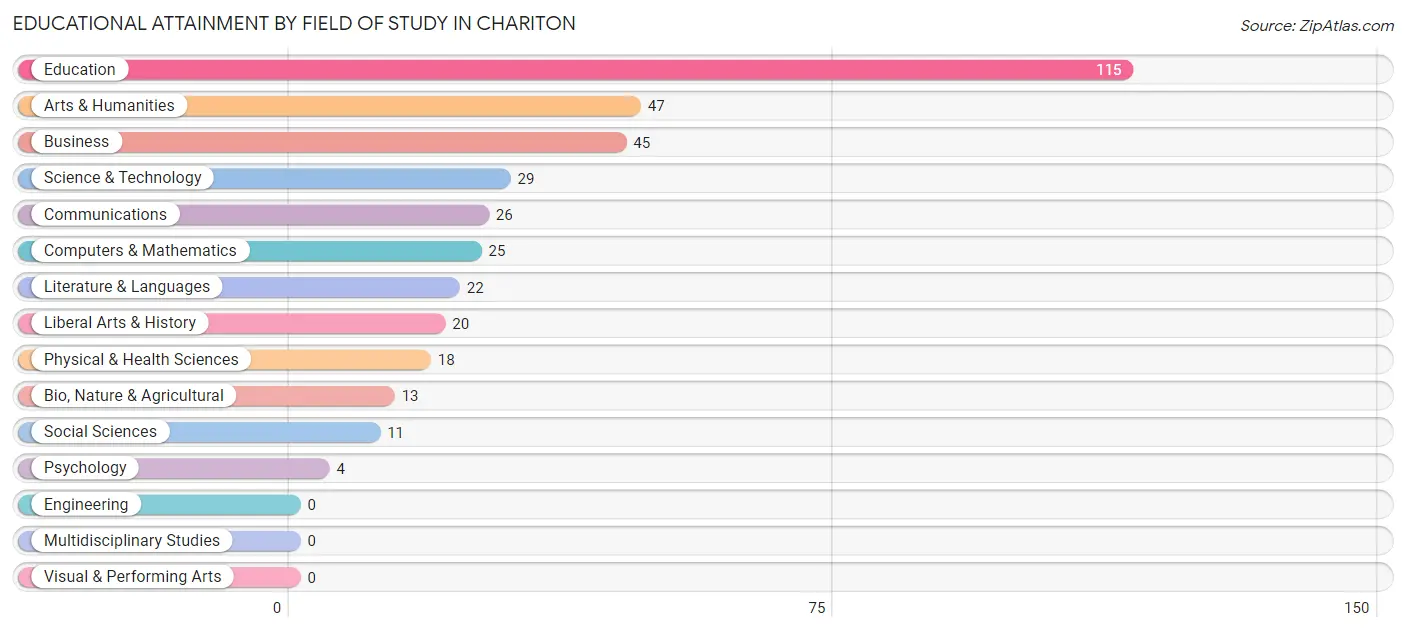
| Field of Study | # Graduates | % Graduates |
| Computers & Mathematics | 25 | 6.7% |
| Bio, Nature & Agricultural | 13 | 3.5% |
| Physical & Health Sciences | 18 | 4.8% |
| Psychology | 4 | 1.1% |
| Social Sciences | 11 | 2.9% |
| Engineering | 0 | 0.0% |
| Multidisciplinary Studies | 0 | 0.0% |
| Science & Technology | 29 | 7.7% |
| Business | 45 | 12.0% |
| Education | 115 | 30.7% |
| Literature & Languages | 22 | 5.9% |
| Liberal Arts & History | 20 | 5.3% |
| Visual & Performing Arts | 0 | 0.0% |
| Communications | 26 | 6.9% |
| Arts & Humanities | 47 | 12.5% |
| Total | 375 | 100.0% |
Transportation & Commute in Chariton
Vehicle Availability by Sex in Chariton
The most prevalent vehicle ownership categories in Chariton are males with 2 vehicles (439, accounting for 42.3%) and females with 2 vehicles (425, making up 50.6%).
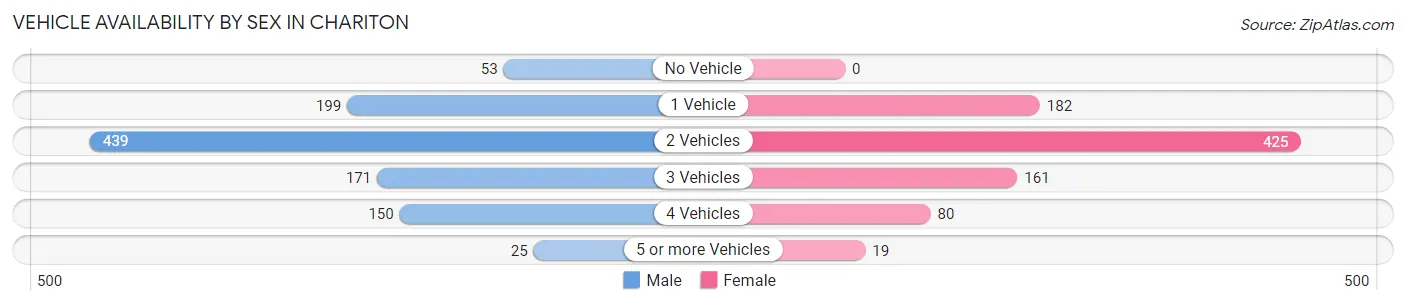
| Vehicles Available | Male | Female |
| No Vehicle | 53 (5.1%) | 0 (0.0%) |
| 1 Vehicle | 199 (19.2%) | 182 (21.0%) |
| 2 Vehicles | 439 (42.3%) | 425 (49.0%) |
| 3 Vehicles | 171 (16.5%) | 161 (18.6%) |
| 4 Vehicles | 150 (14.5%) | 80 (9.2%) |
| 5 or more Vehicles | 25 (2.4%) | 19 (2.2%) |
| Total | 1,037 (100.0%) | 867 (100.0%) |
Commute Time in Chariton
The most frequently occuring commute durations in Chariton are 5 to 9 minutes (829 commuters, 44.5%), 10 to 14 minutes (237 commuters, 12.7%), and less than 5 minutes (224 commuters, 12.0%).
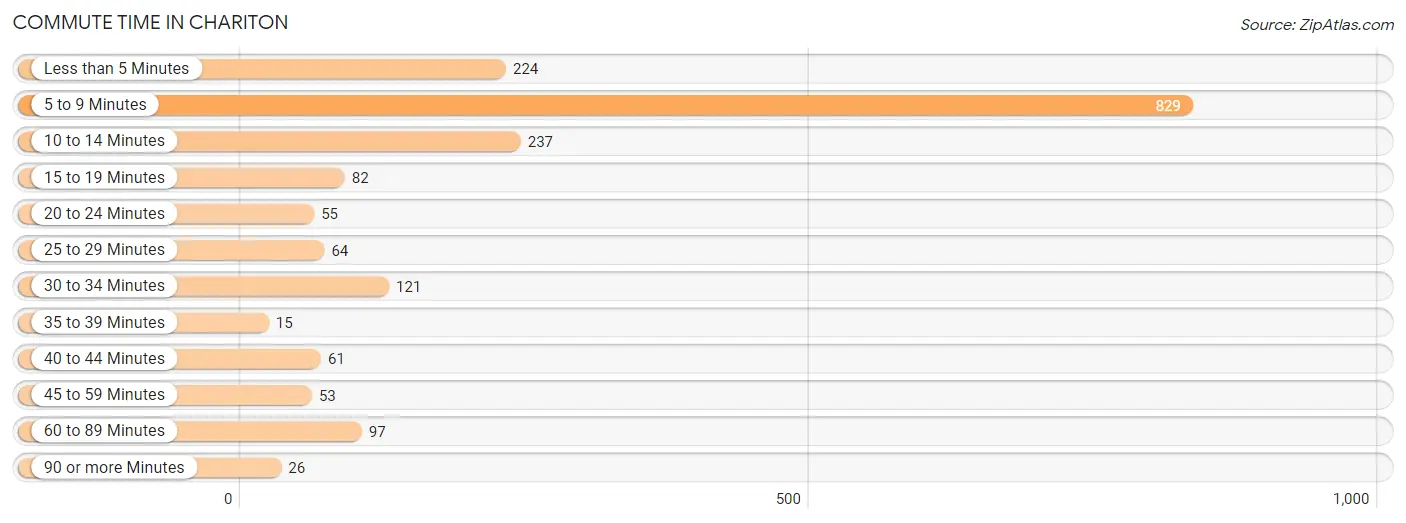
| Commute Time | # Commuters | % Commuters |
| Less than 5 Minutes | 224 | 12.0% |
| 5 to 9 Minutes | 829 | 44.5% |
| 10 to 14 Minutes | 237 | 12.7% |
| 15 to 19 Minutes | 82 | 4.4% |
| 20 to 24 Minutes | 55 | 2.9% |
| 25 to 29 Minutes | 64 | 3.4% |
| 30 to 34 Minutes | 121 | 6.5% |
| 35 to 39 Minutes | 15 | 0.8% |
| 40 to 44 Minutes | 61 | 3.3% |
| 45 to 59 Minutes | 53 | 2.8% |
| 60 to 89 Minutes | 97 | 5.2% |
| 90 or more Minutes | 26 | 1.4% |
Commute Time by Sex in Chariton
The most common commute times in Chariton are 5 to 9 minutes (400 commuters, 39.3%) for males and 5 to 9 minutes (429 commuters, 50.6%) for females.
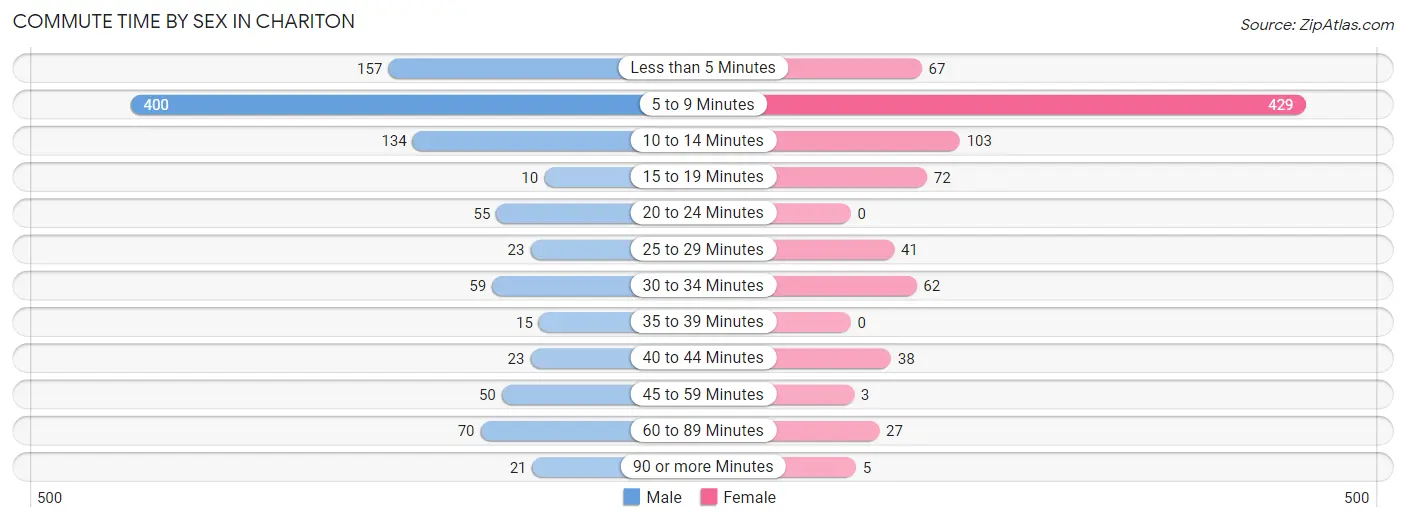
| Commute Time | Male | Female |
| Less than 5 Minutes | 157 (15.4%) | 67 (7.9%) |
| 5 to 9 Minutes | 400 (39.3%) | 429 (50.6%) |
| 10 to 14 Minutes | 134 (13.2%) | 103 (12.2%) |
| 15 to 19 Minutes | 10 (1.0%) | 72 (8.5%) |
| 20 to 24 Minutes | 55 (5.4%) | 0 (0.0%) |
| 25 to 29 Minutes | 23 (2.3%) | 41 (4.8%) |
| 30 to 34 Minutes | 59 (5.8%) | 62 (7.3%) |
| 35 to 39 Minutes | 15 (1.5%) | 0 (0.0%) |
| 40 to 44 Minutes | 23 (2.3%) | 38 (4.5%) |
| 45 to 59 Minutes | 50 (4.9%) | 3 (0.4%) |
| 60 to 89 Minutes | 70 (6.9%) | 27 (3.2%) |
| 90 or more Minutes | 21 (2.1%) | 5 (0.6%) |
Time of Departure to Work by Sex in Chariton
The most frequent times of departure to work in Chariton are 6:30 AM to 6:59 AM (203, 20.0%) for males and 7:30 AM to 7:59 AM (218, 25.7%) for females.
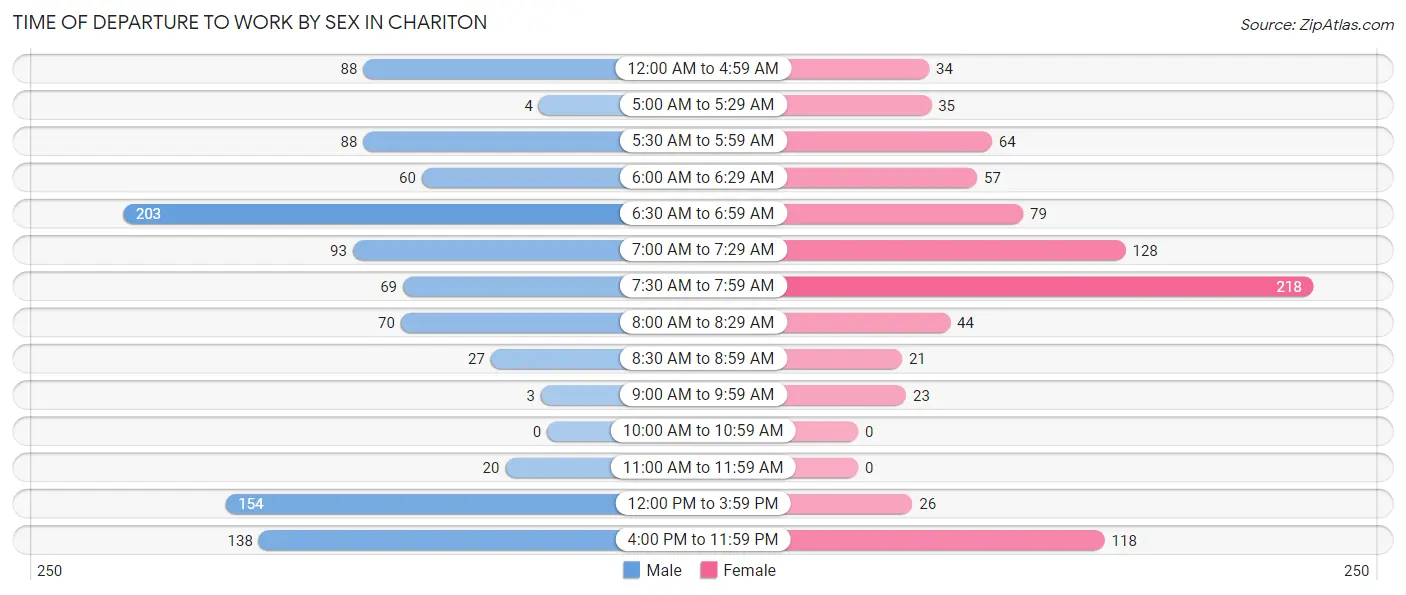
| Time of Departure | Male | Female |
| 12:00 AM to 4:59 AM | 88 (8.6%) | 34 (4.0%) |
| 5:00 AM to 5:29 AM | 4 (0.4%) | 35 (4.1%) |
| 5:30 AM to 5:59 AM | 88 (8.6%) | 64 (7.6%) |
| 6:00 AM to 6:29 AM | 60 (5.9%) | 57 (6.7%) |
| 6:30 AM to 6:59 AM | 203 (20.0%) | 79 (9.3%) |
| 7:00 AM to 7:29 AM | 93 (9.1%) | 128 (15.1%) |
| 7:30 AM to 7:59 AM | 69 (6.8%) | 218 (25.7%) |
| 8:00 AM to 8:29 AM | 70 (6.9%) | 44 (5.2%) |
| 8:30 AM to 8:59 AM | 27 (2.6%) | 21 (2.5%) |
| 9:00 AM to 9:59 AM | 3 (0.3%) | 23 (2.7%) |
| 10:00 AM to 10:59 AM | 0 (0.0%) | 0 (0.0%) |
| 11:00 AM to 11:59 AM | 20 (2.0%) | 0 (0.0%) |
| 12:00 PM to 3:59 PM | 154 (15.1%) | 26 (3.1%) |
| 4:00 PM to 11:59 PM | 138 (13.6%) | 118 (13.9%) |
| Total | 1,017 (100.0%) | 847 (100.0%) |
Housing Occupancy in Chariton
Occupancy by Ownership in Chariton
Of the total 1,758 dwellings in Chariton, owner-occupied units account for 1,147 (65.2%), while renter-occupied units make up 611 (34.8%).
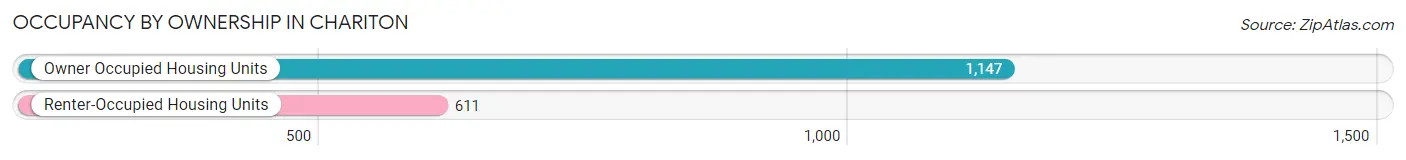
| Occupancy | # Housing Units | % Housing Units |
| Owner Occupied Housing Units | 1,147 | 65.2% |
| Renter-Occupied Housing Units | 611 | 34.8% |
| Total Occupied Housing Units | 1,758 | 100.0% |
Occupancy by Household Size in Chariton
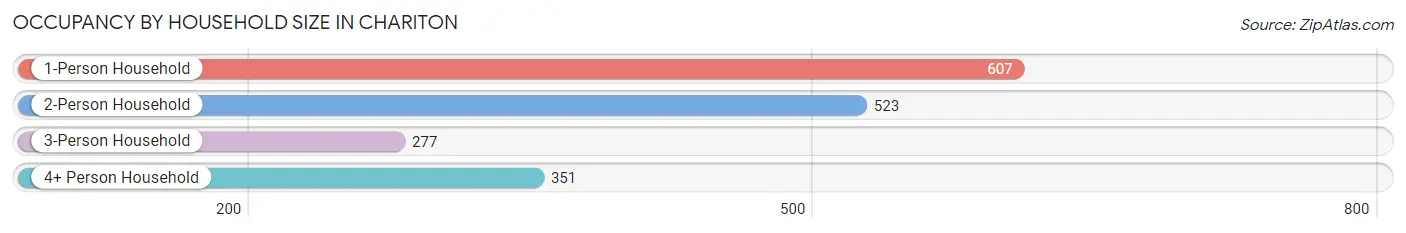
| Household Size | # Housing Units | % Housing Units |
| 1-Person Household | 607 | 34.5% |
| 2-Person Household | 523 | 29.7% |
| 3-Person Household | 277 | 15.8% |
| 4+ Person Household | 351 | 20.0% |
| Total Housing Units | 1,758 | 100.0% |
Occupancy by Ownership by Household Size in Chariton
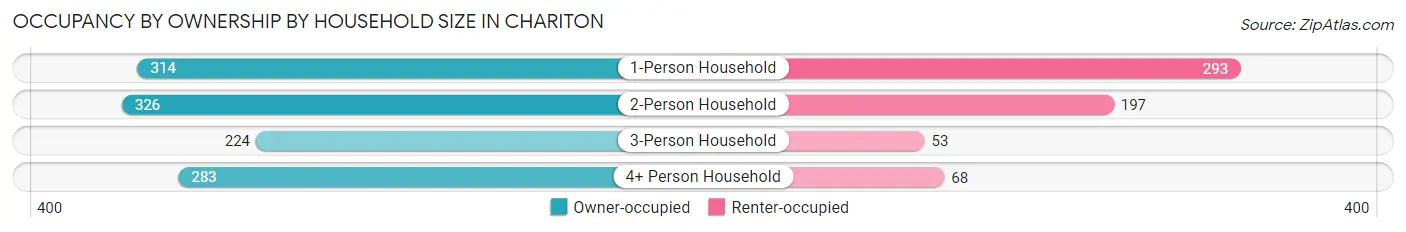
| Household Size | Owner-occupied | Renter-occupied |
| 1-Person Household | 314 (51.7%) | 293 (48.3%) |
| 2-Person Household | 326 (62.3%) | 197 (37.7%) |
| 3-Person Household | 224 (80.9%) | 53 (19.1%) |
| 4+ Person Household | 283 (80.6%) | 68 (19.4%) |
| Total Housing Units | 1,147 (65.2%) | 611 (34.8%) |
Occupancy by Educational Attainment in Chariton
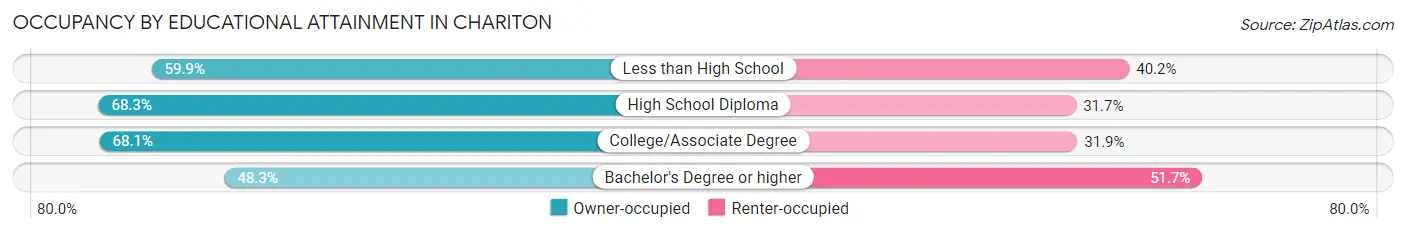
| Household Size | Owner-occupied | Renter-occupied |
| Less than High School | 79 (59.9%) | 53 (40.2%) |
| High School Diploma | 553 (68.3%) | 257 (31.7%) |
| College/Associate Degree | 416 (68.1%) | 195 (31.9%) |
| Bachelor's Degree or higher | 99 (48.3%) | 106 (51.7%) |
Occupancy by Age of Householder in Chariton
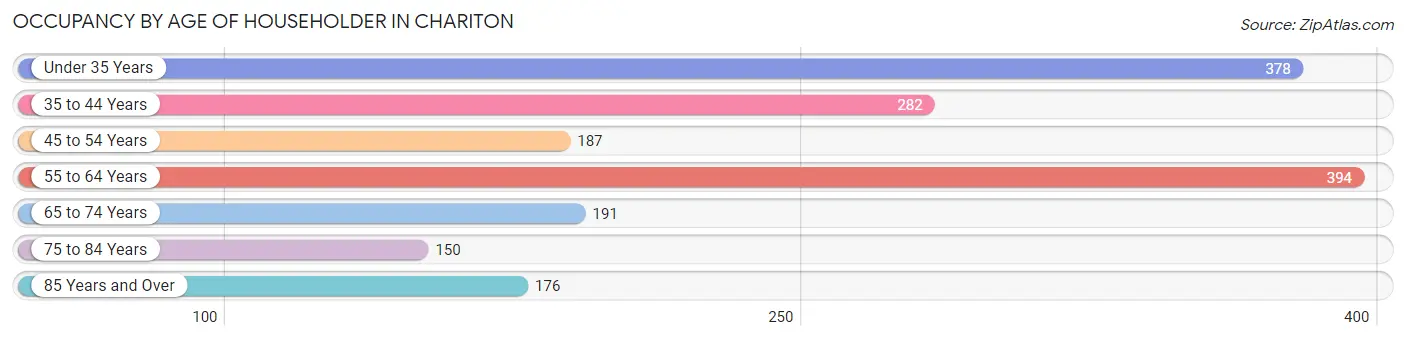
| Age Bracket | # Households | % Households |
| Under 35 Years | 378 | 21.5% |
| 35 to 44 Years | 282 | 16.0% |
| 45 to 54 Years | 187 | 10.6% |
| 55 to 64 Years | 394 | 22.4% |
| 65 to 74 Years | 191 | 10.9% |
| 75 to 84 Years | 150 | 8.5% |
| 85 Years and Over | 176 | 10.0% |
| Total | 1,758 | 100.0% |
Housing Finances in Chariton
Median Income by Occupancy in Chariton
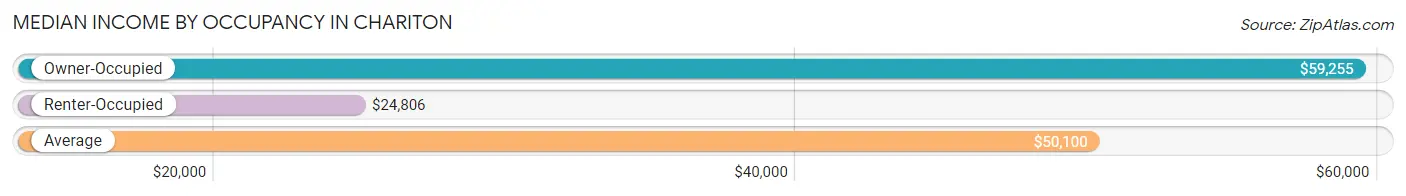
| Occupancy Type | # Households | Median Income |
| Owner-Occupied | 1,147 (65.2%) | $59,255 |
| Renter-Occupied | 611 (34.8%) | $24,806 |
| Average | 1,758 (100.0%) | $50,100 |
Occupancy by Householder Income Bracket in Chariton
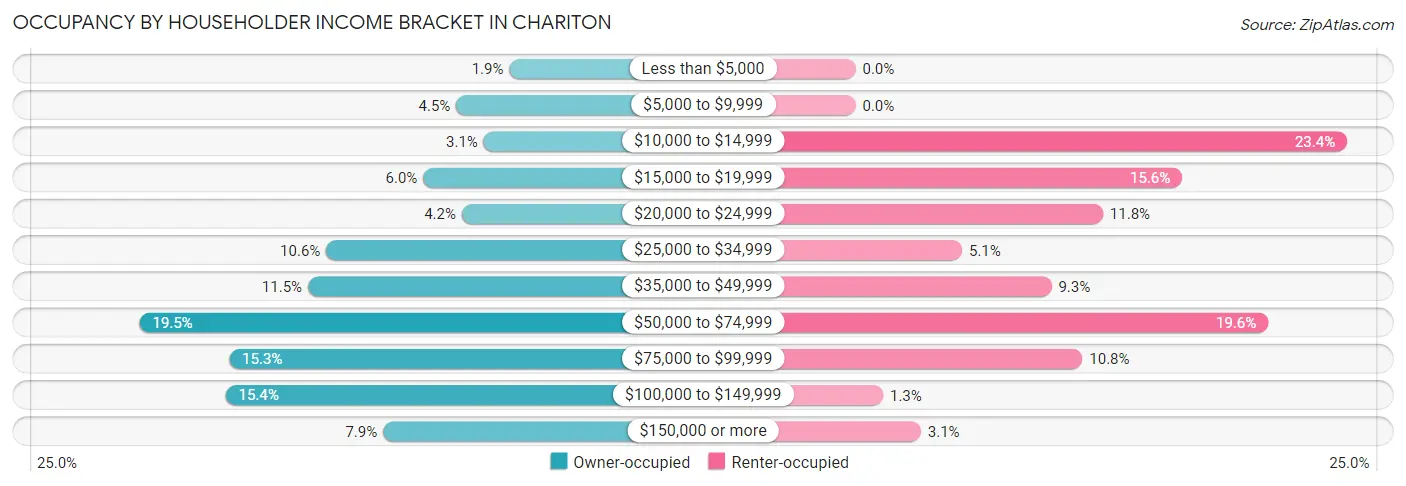
| Income Bracket | Owner-occupied | Renter-occupied |
| Less than $5,000 | 22 (1.9%) | 0 (0.0%) |
| $5,000 to $9,999 | 51 (4.4%) | 0 (0.0%) |
| $10,000 to $14,999 | 36 (3.1%) | 143 (23.4%) |
| $15,000 to $19,999 | 69 (6.0%) | 95 (15.5%) |
| $20,000 to $24,999 | 48 (4.2%) | 72 (11.8%) |
| $25,000 to $34,999 | 122 (10.6%) | 31 (5.1%) |
| $35,000 to $49,999 | 132 (11.5%) | 57 (9.3%) |
| $50,000 to $74,999 | 224 (19.5%) | 120 (19.6%) |
| $75,000 to $99,999 | 175 (15.3%) | 66 (10.8%) |
| $100,000 to $149,999 | 177 (15.4%) | 8 (1.3%) |
| $150,000 or more | 91 (7.9%) | 19 (3.1%) |
| Total | 1,147 (100.0%) | 611 (100.0%) |
Monthly Housing Cost Tiers in Chariton
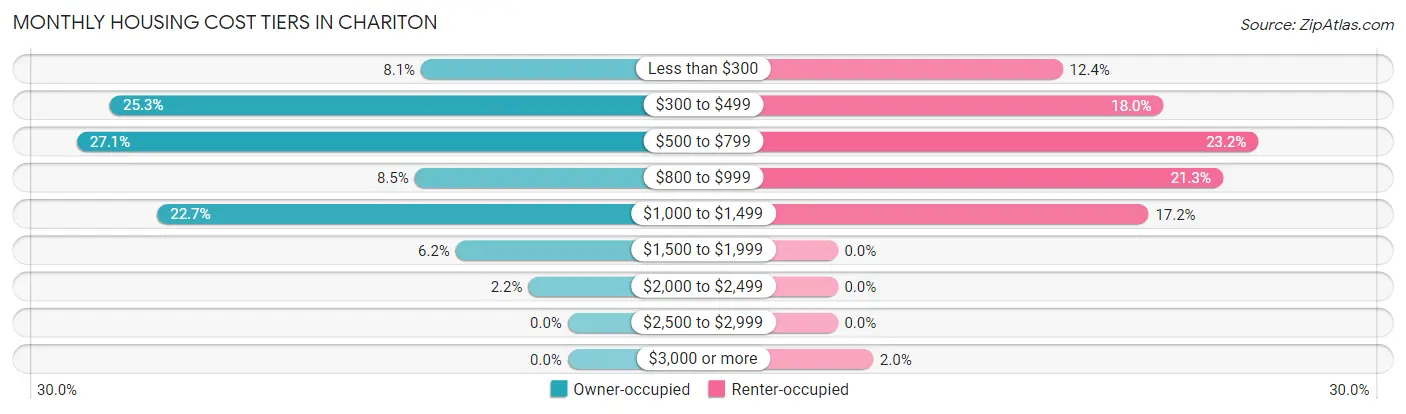
| Monthly Cost | Owner-occupied | Renter-occupied |
| Less than $300 | 93 (8.1%) | 76 (12.4%) |
| $300 to $499 | 290 (25.3%) | 110 (18.0%) |
| $500 to $799 | 311 (27.1%) | 142 (23.2%) |
| $800 to $999 | 97 (8.5%) | 130 (21.3%) |
| $1,000 to $1,499 | 260 (22.7%) | 105 (17.2%) |
| $1,500 to $1,999 | 71 (6.2%) | 0 (0.0%) |
| $2,000 to $2,499 | 25 (2.2%) | 0 (0.0%) |
| $2,500 to $2,999 | 0 (0.0%) | 0 (0.0%) |
| $3,000 or more | 0 (0.0%) | 12 (2.0%) |
| Total | 1,147 (100.0%) | 611 (100.0%) |
Physical Housing Characteristics in Chariton
Housing Structures in Chariton
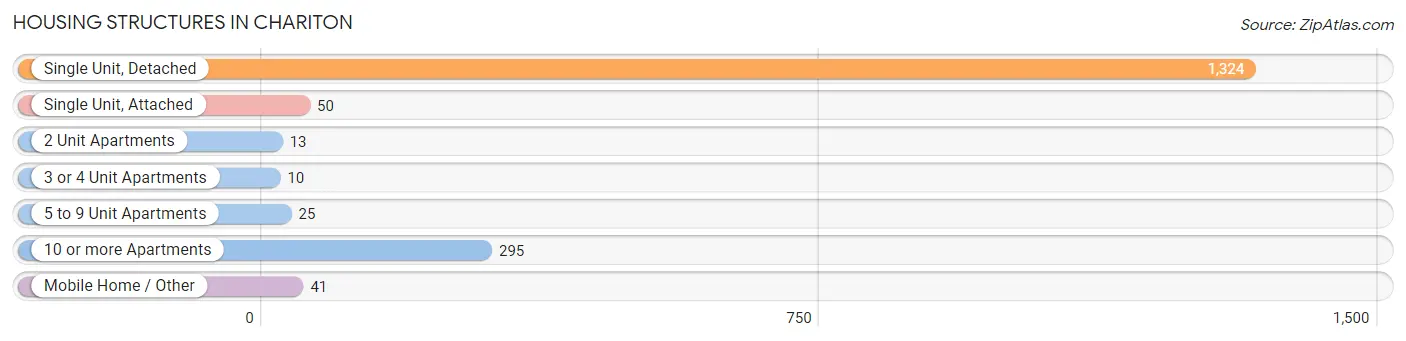
| Structure Type | # Housing Units | % Housing Units |
| Single Unit, Detached | 1,324 | 75.3% |
| Single Unit, Attached | 50 | 2.8% |
| 2 Unit Apartments | 13 | 0.7% |
| 3 or 4 Unit Apartments | 10 | 0.6% |
| 5 to 9 Unit Apartments | 25 | 1.4% |
| 10 or more Apartments | 295 | 16.8% |
| Mobile Home / Other | 41 | 2.3% |
| Total | 1,758 | 100.0% |
Housing Structures by Occupancy in Chariton
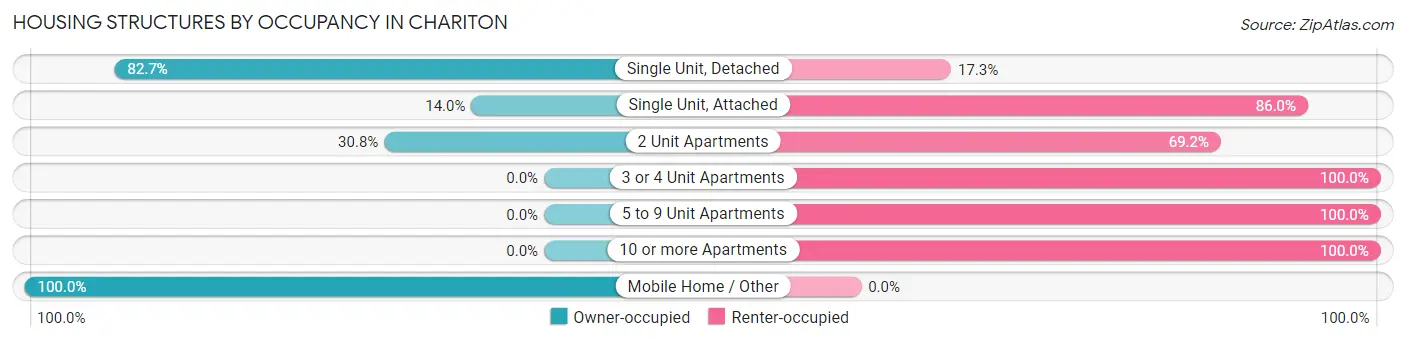
| Structure Type | Owner-occupied | Renter-occupied |
| Single Unit, Detached | 1,095 (82.7%) | 229 (17.3%) |
| Single Unit, Attached | 7 (14.0%) | 43 (86.0%) |
| 2 Unit Apartments | 4 (30.8%) | 9 (69.2%) |
| 3 or 4 Unit Apartments | 0 (0.0%) | 10 (100.0%) |
| 5 to 9 Unit Apartments | 0 (0.0%) | 25 (100.0%) |
| 10 or more Apartments | 0 (0.0%) | 295 (100.0%) |
| Mobile Home / Other | 41 (100.0%) | 0 (0.0%) |
| Total | 1,147 (65.2%) | 611 (34.8%) |
Housing Structures by Number of Rooms in Chariton
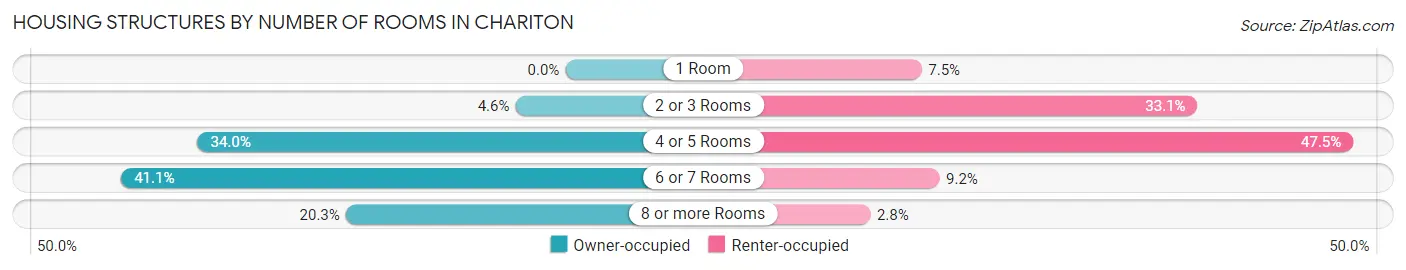
| Number of Rooms | Owner-occupied | Renter-occupied |
| 1 Room | 0 (0.0%) | 46 (7.5%) |
| 2 or 3 Rooms | 53 (4.6%) | 202 (33.1%) |
| 4 or 5 Rooms | 390 (34.0%) | 290 (47.5%) |
| 6 or 7 Rooms | 471 (41.1%) | 56 (9.2%) |
| 8 or more Rooms | 233 (20.3%) | 17 (2.8%) |
| Total | 1,147 (100.0%) | 611 (100.0%) |
Housing Structure by Heating Type in Chariton
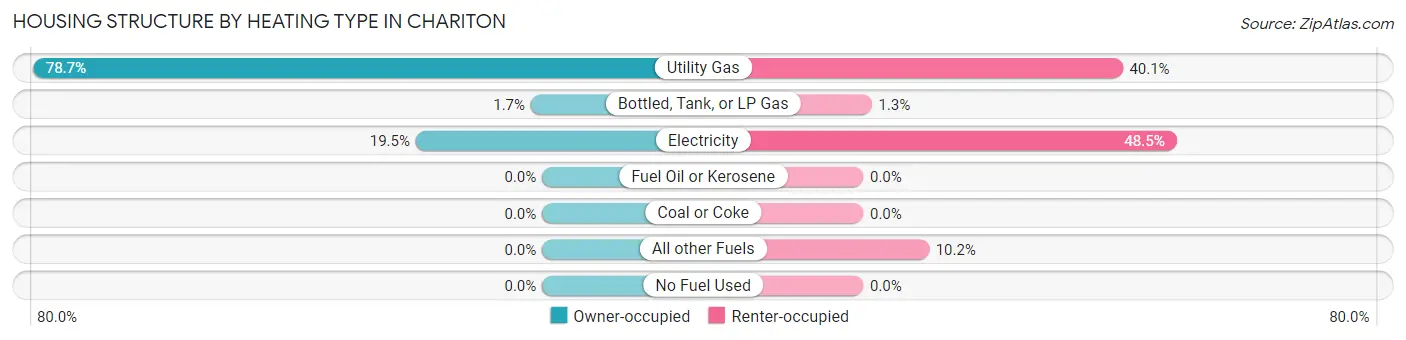
| Heating Type | Owner-occupied | Renter-occupied |
| Utility Gas | 903 (78.7%) | 245 (40.1%) |
| Bottled, Tank, or LP Gas | 20 (1.7%) | 8 (1.3%) |
| Electricity | 224 (19.5%) | 296 (48.4%) |
| Fuel Oil or Kerosene | 0 (0.0%) | 0 (0.0%) |
| Coal or Coke | 0 (0.0%) | 0 (0.0%) |
| All other Fuels | 0 (0.0%) | 62 (10.2%) |
| No Fuel Used | 0 (0.0%) | 0 (0.0%) |
| Total | 1,147 (100.0%) | 611 (100.0%) |
Household Vehicle Usage in Chariton
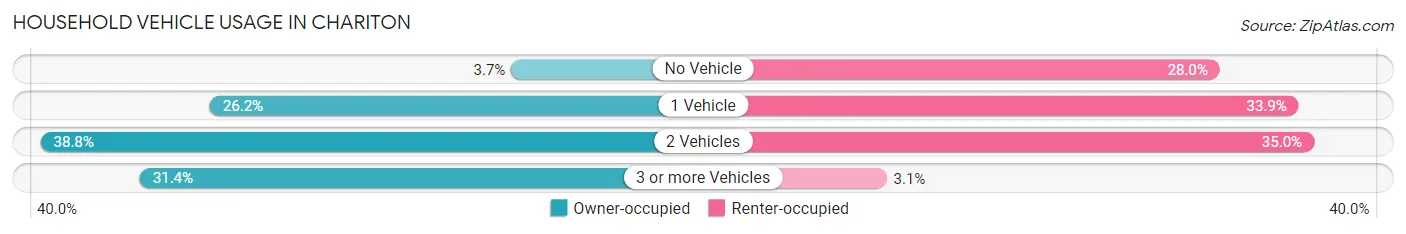
| Vehicles per Household | Owner-occupied | Renter-occupied |
| No Vehicle | 42 (3.7%) | 171 (28.0%) |
| 1 Vehicle | 300 (26.2%) | 207 (33.9%) |
| 2 Vehicles | 445 (38.8%) | 214 (35.0%) |
| 3 or more Vehicles | 360 (31.4%) | 19 (3.1%) |
| Total | 1,147 (100.0%) | 611 (100.0%) |
Real Estate & Mortgages in Chariton
Real Estate and Mortgage Overview in Chariton
| Characteristic | Without Mortgage | With Mortgage |
| Housing Units | 622 | 525 |
| Median Property Value | $85,600 | $101,500 |
| Median Household Income | $46,136 | $47 |
| Monthly Housing Costs | $465 | $0 |
| Real Estate Taxes | $1,653 | $35 |
Property Value by Mortgage Status in Chariton
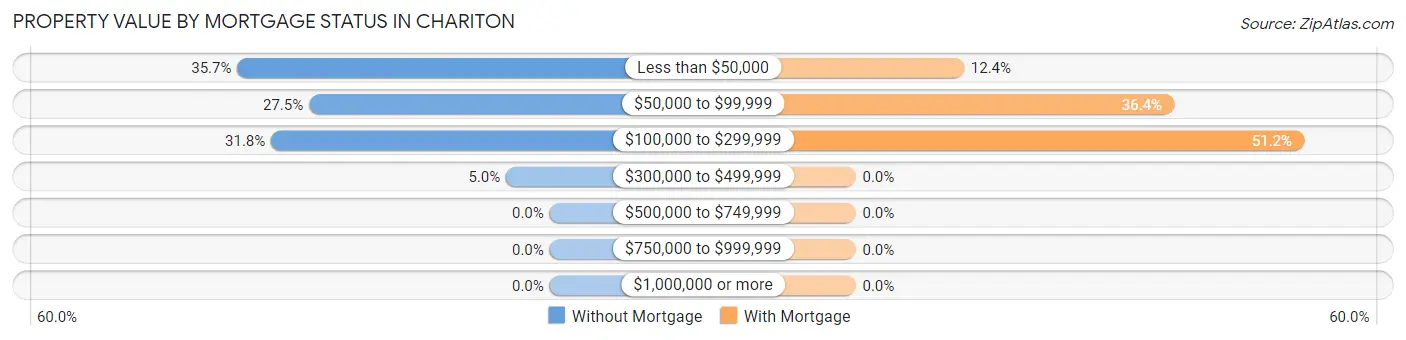
| Property Value | Without Mortgage | With Mortgage |
| Less than $50,000 | 222 (35.7%) | 65 (12.4%) |
| $50,000 to $99,999 | 171 (27.5%) | 191 (36.4%) |
| $100,000 to $299,999 | 198 (31.8%) | 269 (51.2%) |
| $300,000 to $499,999 | 31 (5.0%) | 0 (0.0%) |
| $500,000 to $749,999 | 0 (0.0%) | 0 (0.0%) |
| $750,000 to $999,999 | 0 (0.0%) | 0 (0.0%) |
| $1,000,000 or more | 0 (0.0%) | 0 (0.0%) |
| Total | 622 (100.0%) | 525 (100.0%) |
Household Income by Mortgage Status in Chariton
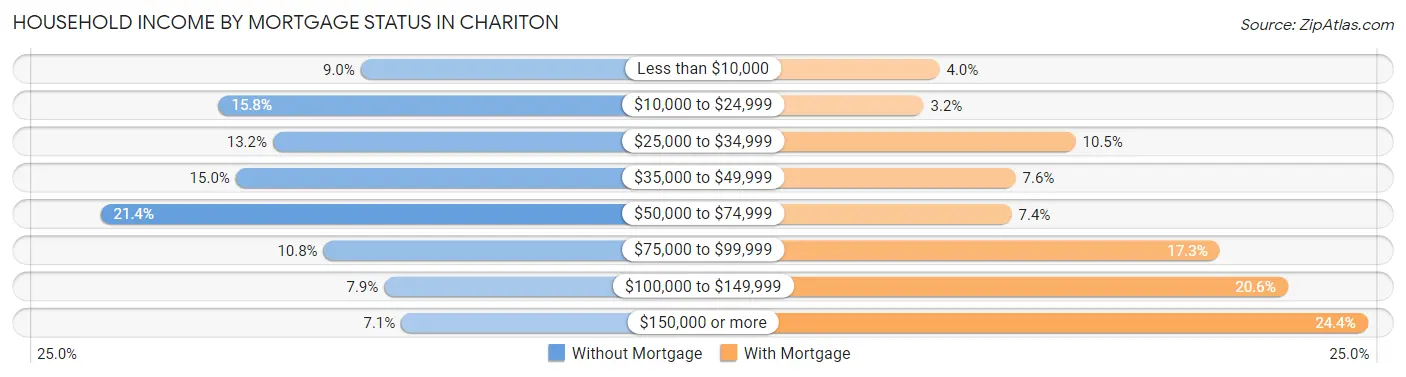
| Household Income | Without Mortgage | With Mortgage |
| Less than $10,000 | 56 (9.0%) | 21 (4.0%) |
| $10,000 to $24,999 | 98 (15.8%) | 17 (3.2%) |
| $25,000 to $34,999 | 82 (13.2%) | 55 (10.5%) |
| $35,000 to $49,999 | 93 (14.9%) | 40 (7.6%) |
| $50,000 to $74,999 | 133 (21.4%) | 39 (7.4%) |
| $75,000 to $99,999 | 67 (10.8%) | 91 (17.3%) |
| $100,000 to $149,999 | 49 (7.9%) | 108 (20.6%) |
| $150,000 or more | 44 (7.1%) | 128 (24.4%) |
| Total | 622 (100.0%) | 525 (100.0%) |
Property Value to Household Income Ratio in Chariton
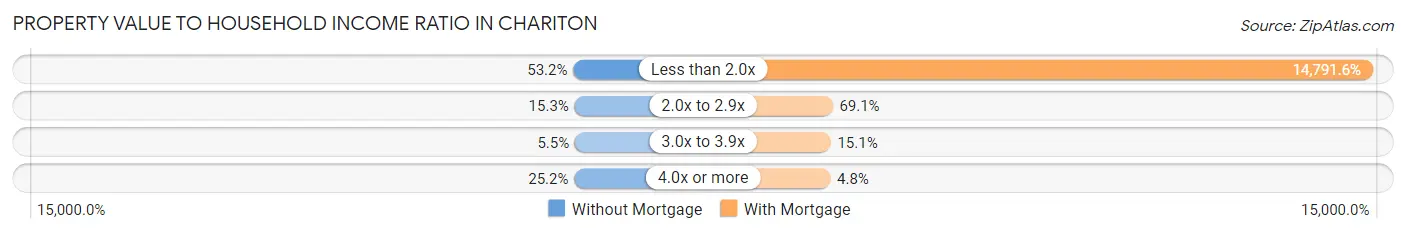
| Value-to-Income Ratio | Without Mortgage | With Mortgage |
| Less than 2.0x | 331 (53.2%) | 77,656 (14,791.6%) |
| 2.0x to 2.9x | 95 (15.3%) | 363 (69.1%) |
| 3.0x to 3.9x | 34 (5.5%) | 79 (15.0%) |
| 4.0x or more | 157 (25.2%) | 25 (4.8%) |
| Total | 622 (100.0%) | 525 (100.0%) |
Real Estate Taxes by Mortgage Status in Chariton
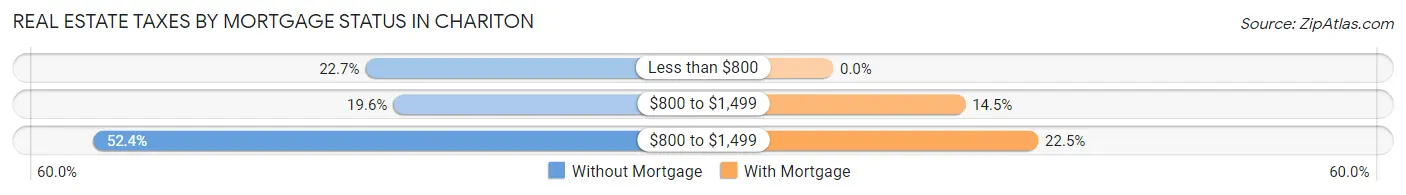
| Property Taxes | Without Mortgage | With Mortgage |
| Less than $800 | 141 (22.7%) | 0 (0.0%) |
| $800 to $1,499 | 122 (19.6%) | 76 (14.5%) |
| $800 to $1,499 | 326 (52.4%) | 118 (22.5%) |
| Total | 622 (100.0%) | 525 (100.0%) |
Health & Disability in Chariton
Health Insurance Coverage by Age in Chariton
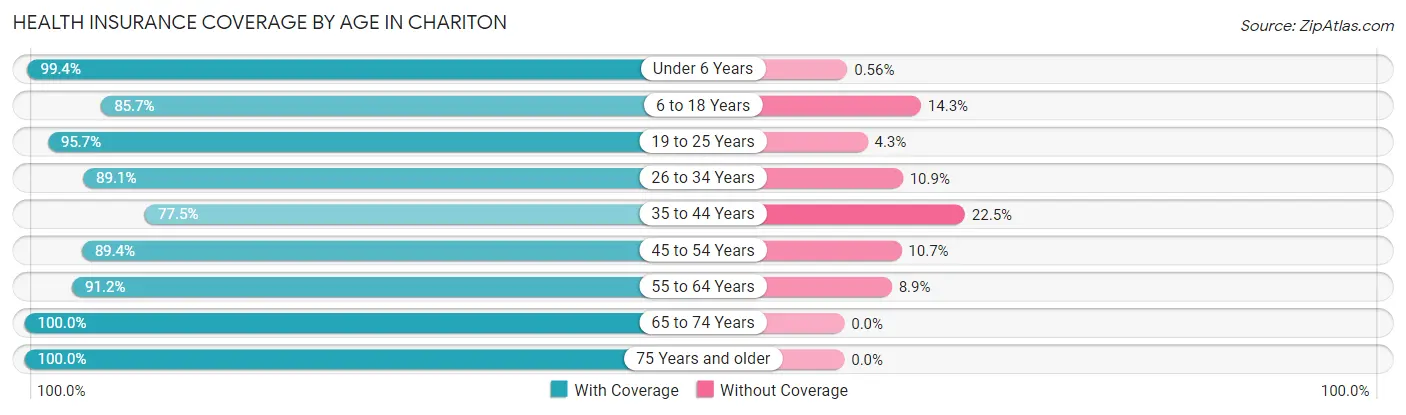
| Age Bracket | With Coverage | Without Coverage |
| Under 6 Years | 357 (99.4%) | 2 (0.6%) |
| 6 to 18 Years | 654 (85.7%) | 109 (14.3%) |
| 19 to 25 Years | 287 (95.7%) | 13 (4.3%) |
| 26 to 34 Years | 466 (89.1%) | 57 (10.9%) |
| 35 to 44 Years | 317 (77.5%) | 92 (22.5%) |
| 45 to 54 Years | 344 (89.3%) | 41 (10.6%) |
| 55 to 64 Years | 515 (91.1%) | 50 (8.8%) |
| 65 to 74 Years | 354 (100.0%) | 0 (0.0%) |
| 75 Years and older | 457 (100.0%) | 0 (0.0%) |
| Total | 3,751 (91.1%) | 364 (8.8%) |
Health Insurance Coverage by Citizenship Status in Chariton
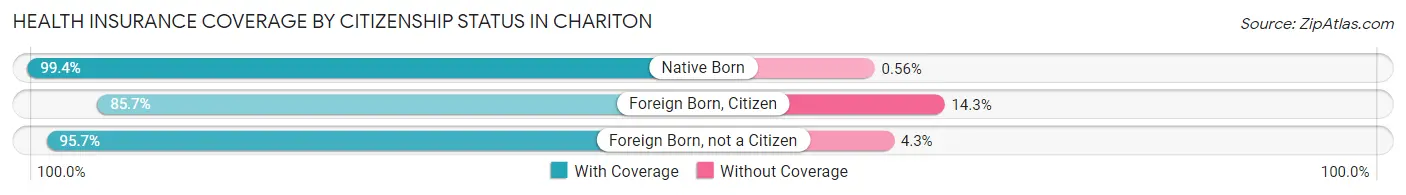
| Citizenship Status | With Coverage | Without Coverage |
| Native Born | 357 (99.4%) | 2 (0.6%) |
| Foreign Born, Citizen | 654 (85.7%) | 109 (14.3%) |
| Foreign Born, not a Citizen | 287 (95.7%) | 13 (4.3%) |
Health Insurance Coverage by Household Income in Chariton
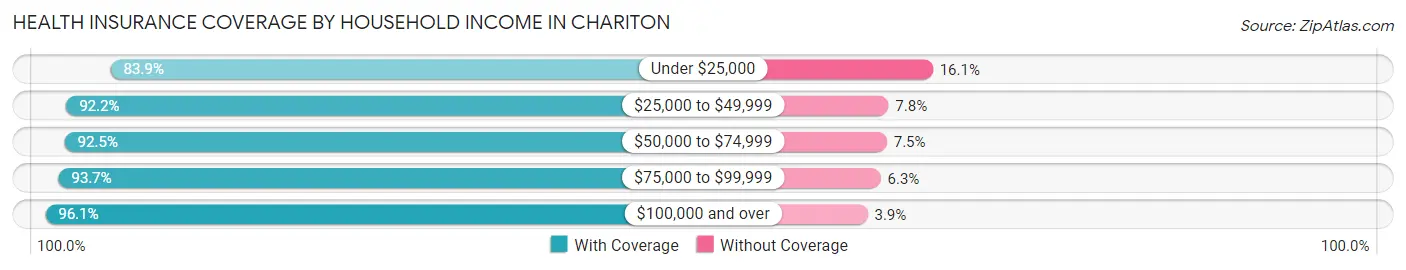
| Household Income | With Coverage | Without Coverage |
| Under $25,000 | 891 (83.9%) | 171 (16.1%) |
| $25,000 to $49,999 | 745 (92.2%) | 63 (7.8%) |
| $50,000 to $74,999 | 753 (92.5%) | 61 (7.5%) |
| $75,000 to $99,999 | 533 (93.7%) | 36 (6.3%) |
| $100,000 and over | 817 (96.1%) | 33 (3.9%) |
Public vs Private Health Insurance Coverage by Age in Chariton
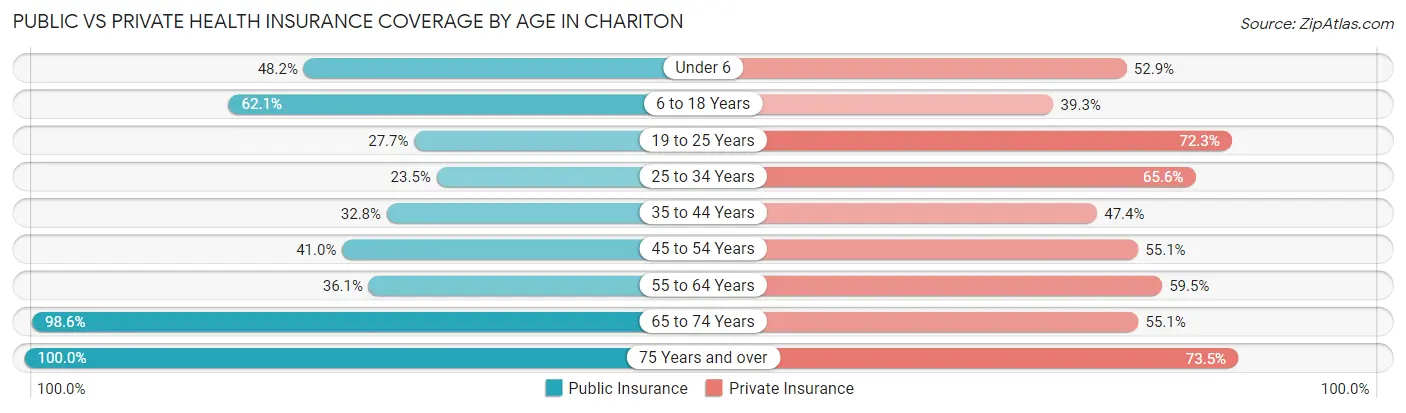
| Age Bracket | Public Insurance | Private Insurance |
| Under 6 | 173 (48.2%) | 190 (52.9%) |
| 6 to 18 Years | 474 (62.1%) | 300 (39.3%) |
| 19 to 25 Years | 83 (27.7%) | 217 (72.3%) |
| 25 to 34 Years | 123 (23.5%) | 343 (65.6%) |
| 35 to 44 Years | 134 (32.8%) | 194 (47.4%) |
| 45 to 54 Years | 158 (41.0%) | 212 (55.1%) |
| 55 to 64 Years | 204 (36.1%) | 336 (59.5%) |
| 65 to 74 Years | 349 (98.6%) | 195 (55.1%) |
| 75 Years and over | 457 (100.0%) | 336 (73.5%) |
| Total | 2,155 (52.4%) | 2,323 (56.5%) |
Disability Status by Sex by Age in Chariton
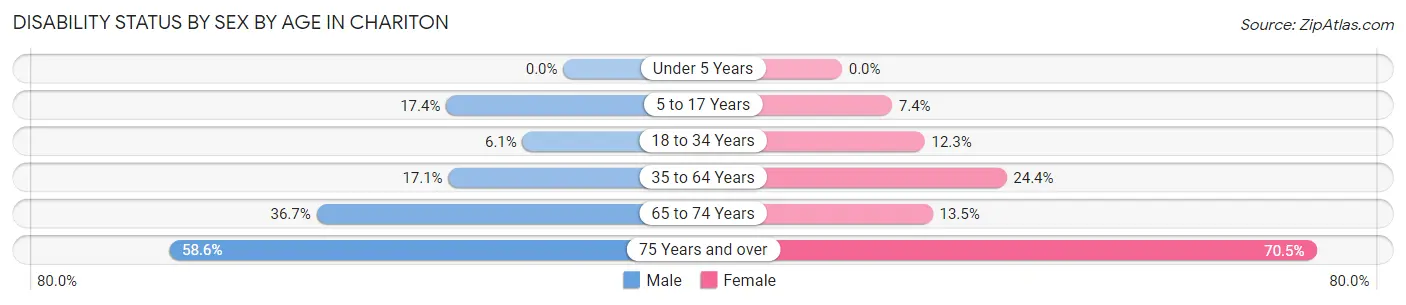
| Age Bracket | Male | Female |
| Under 5 Years | 0 (0.0%) | 0 (0.0%) |
| 5 to 17 Years | 64 (17.4%) | 24 (7.4%) |
| 18 to 34 Years | 31 (6.0%) | 50 (12.3%) |
| 35 to 64 Years | 109 (17.1%) | 176 (24.4%) |
| 65 to 74 Years | 59 (36.6%) | 26 (13.5%) |
| 75 Years and over | 113 (58.6%) | 186 (70.5%) |
Disability Class by Sex by Age in Chariton
Disability Class: Hearing Difficulty
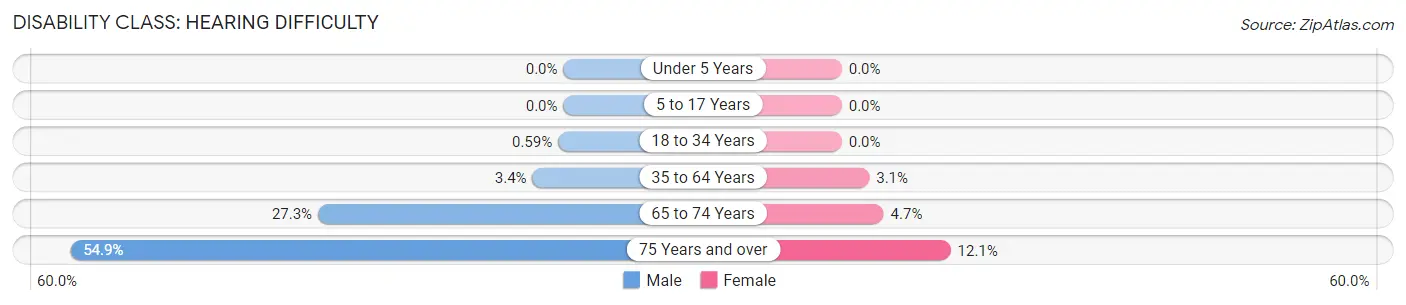
| Age Bracket | Male | Female |
| Under 5 Years | 0 (0.0%) | 0 (0.0%) |
| 5 to 17 Years | 0 (0.0%) | 0 (0.0%) |
| 18 to 34 Years | 3 (0.6%) | 0 (0.0%) |
| 35 to 64 Years | 22 (3.4%) | 22 (3.1%) |
| 65 to 74 Years | 44 (27.3%) | 9 (4.7%) |
| 75 Years and over | 106 (54.9%) | 32 (12.1%) |
Disability Class: Vision Difficulty
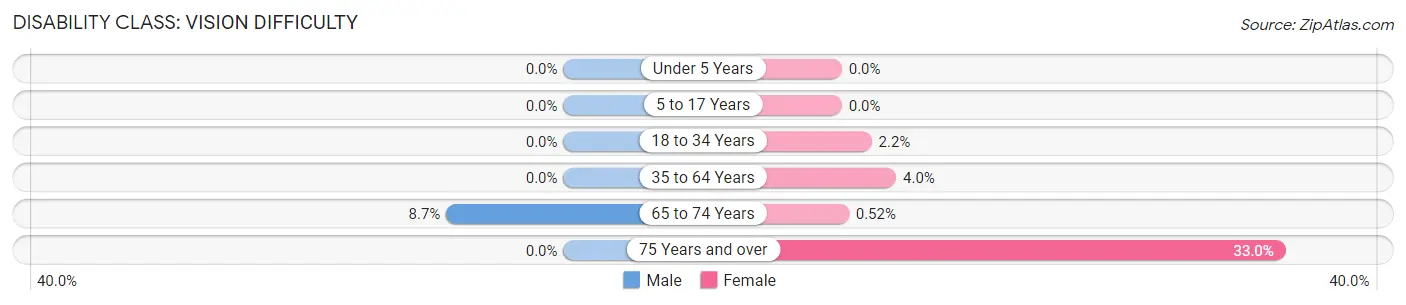
| Age Bracket | Male | Female |
| Under 5 Years | 0 (0.0%) | 0 (0.0%) |
| 5 to 17 Years | 0 (0.0%) | 0 (0.0%) |
| 18 to 34 Years | 0 (0.0%) | 9 (2.2%) |
| 35 to 64 Years | 0 (0.0%) | 29 (4.0%) |
| 65 to 74 Years | 14 (8.7%) | 1 (0.5%) |
| 75 Years and over | 0 (0.0%) | 87 (33.0%) |
Disability Class: Cognitive Difficulty
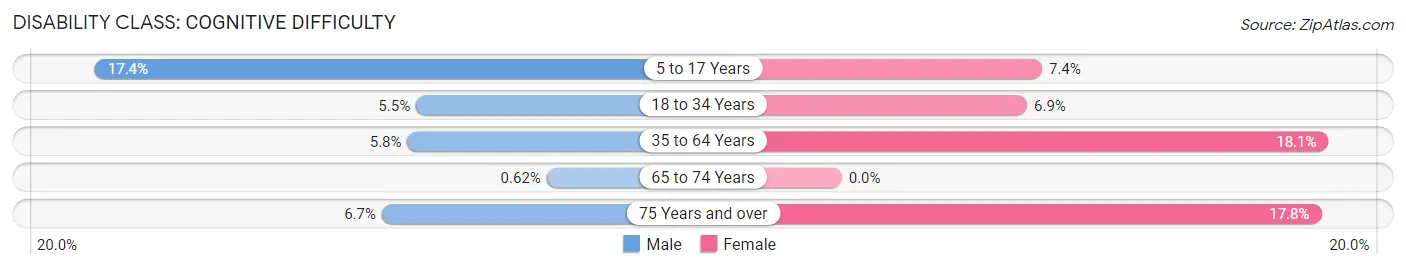
| Age Bracket | Male | Female |
| 5 to 17 Years | 64 (17.4%) | 24 (7.4%) |
| 18 to 34 Years | 28 (5.5%) | 28 (6.9%) |
| 35 to 64 Years | 37 (5.8%) | 130 (18.1%) |
| 65 to 74 Years | 1 (0.6%) | 0 (0.0%) |
| 75 Years and over | 13 (6.7%) | 47 (17.8%) |
Disability Class: Ambulatory Difficulty
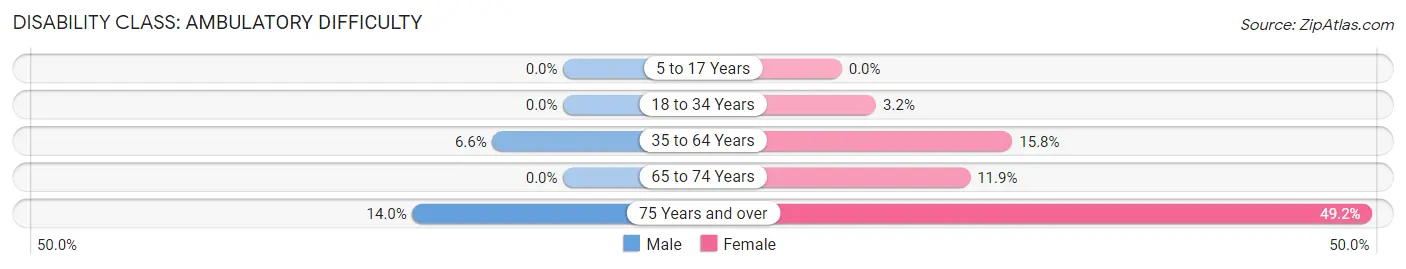
| Age Bracket | Male | Female |
| 5 to 17 Years | 0 (0.0%) | 0 (0.0%) |
| 18 to 34 Years | 0 (0.0%) | 13 (3.2%) |
| 35 to 64 Years | 42 (6.6%) | 114 (15.8%) |
| 65 to 74 Years | 0 (0.0%) | 23 (11.9%) |
| 75 Years and over | 27 (14.0%) | 130 (49.2%) |
Disability Class: Self-Care Difficulty
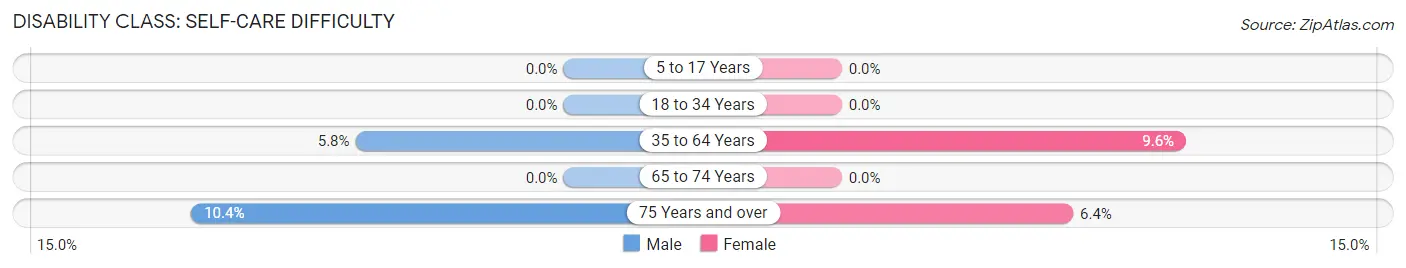
| Age Bracket | Male | Female |
| 5 to 17 Years | 0 (0.0%) | 0 (0.0%) |
| 18 to 34 Years | 0 (0.0%) | 0 (0.0%) |
| 35 to 64 Years | 37 (5.8%) | 69 (9.6%) |
| 65 to 74 Years | 0 (0.0%) | 0 (0.0%) |
| 75 Years and over | 20 (10.4%) | 17 (6.4%) |
Technology Access in Chariton
Computing Device Access in Chariton
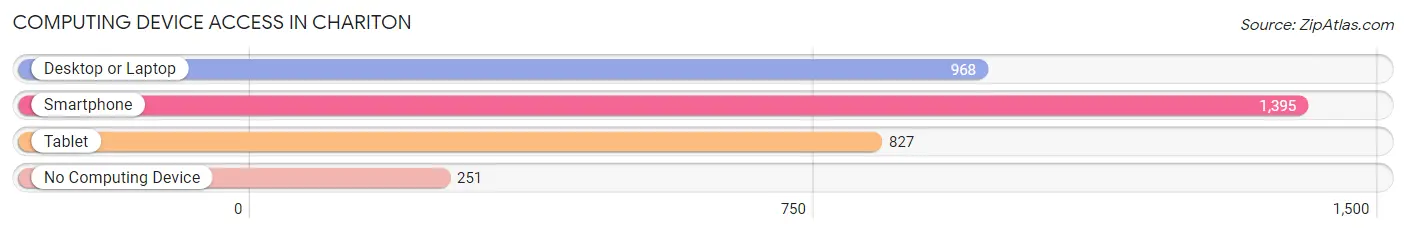
| Device Type | # Households | % Households |
| Desktop or Laptop | 968 | 55.1% |
| Smartphone | 1,395 | 79.3% |
| Tablet | 827 | 47.0% |
| No Computing Device | 251 | 14.3% |
| Total | 1,758 | 100.0% |
Internet Access in Chariton
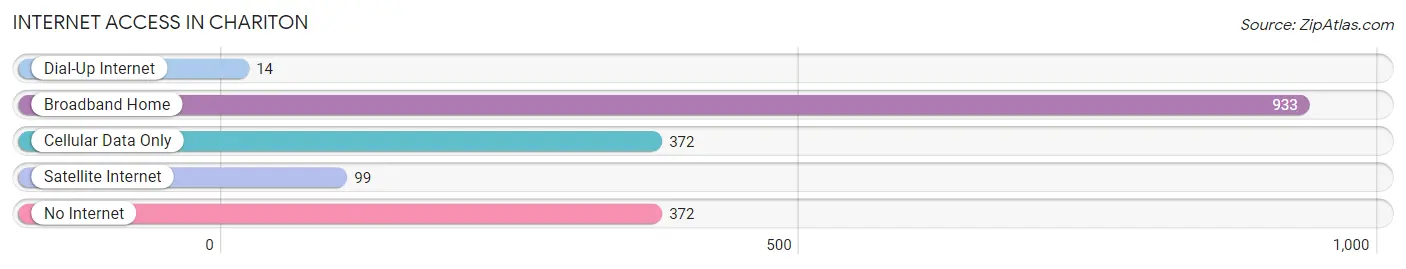
| Internet Type | # Households | % Households |
| Dial-Up Internet | 14 | 0.8% |
| Broadband Home | 933 | 53.1% |
| Cellular Data Only | 372 | 21.2% |
| Satellite Internet | 99 | 5.6% |
| No Internet | 372 | 21.2% |
| Total | 1,758 | 100.0% |
Chariton Summary
Chariton, Iowa is a small city located in Lucas County in the south-central part of the state. It is the county seat and the largest city in the county. The city is situated along the Chariton River, which is a tributary of the Des Moines River. The population of Chariton was 4,321 at the 2010 census, making it the second-largest city in Lucas County.
History
The area that is now Chariton was first settled in 1837 by a group of settlers from Kentucky. The town was originally known as Chariton Station, named after the Chariton River. The town was officially incorporated in 1855.
In the late 19th century, Chariton was a major stop on the Chicago, Burlington & Quincy Railroad. The railroad brought many new businesses to the town, including a flour mill, a brickyard, and a furniture factory.
In the early 20th century, Chariton was a major center for the production of agricultural equipment. The town was home to several factories, including the Chariton Implement Company, which produced farm machinery.
Geography
Chariton is located at the intersection of U.S. Route 34 and Iowa Highway 14. The city is situated along the Chariton River, which is a tributary of the Des Moines River. The city is located in the rolling hills of southern Iowa, and is surrounded by farmland.
The climate in Chariton is typical of the Midwest, with hot summers and cold winters. The average annual temperature is 52°F (11°C). The average annual precipitation is 36 inches (91 cm).
Economy
The economy of Chariton is largely based on agriculture and manufacturing. The city is home to several factories, including the Chariton Implement Company, which produces farm machinery. The city is also home to several food processing plants, including a meat packing plant and a canning factory.
Chariton is also home to several retail stores, including a Walmart Supercenter and a Hy-Vee grocery store. The city is also home to several restaurants, including a McDonald's and a Pizza Hut.
Demographics
As of the 2010 census, the population of Chariton was 4,321. The racial makeup of the city was 95.3% White, 0.7% African American, 0.3% Native American, 0.4% Asian, 0.1% Pacific Islander, 1.3% from other races, and 1.9% from two or more races. Hispanic or Latino of any race were 3.2% of the population.
The median household income in Chariton was $41,944, and the median family income was $50,938. The per capita income was $20,945. About 11.2% of families and 14.2% of the population were below the poverty line, including 19.2% of those under age 18 and 8.2% of those age 65 or over.
Common Questions
What is Per Capita Income in Chariton?
Per Capita income in Chariton is $25,811.
What is the Median Family Income in Chariton?
Median Family Income in Chariton is $69,073.
What is the Median Household income in Chariton?
Median Household Income in Chariton is $50,100.
What is Income or Wage Gap in Chariton?
Income or Wage Gap in Chariton is 41.7%.
Women in Chariton earn 58.3 cents for every dollar earned by a man.
What is Family Income Deficit in Chariton?
Family Income Deficit in Chariton is $9,864.
Families that are below poverty line in Chariton earn $9,864 less on average than the poverty threshold level.
What is Inequality or Gini Index in Chariton?
Inequality or Gini Index in Chariton is 0.43.
What is the Total Population of Chariton?
Total Population of Chariton is 4,203.
What is the Total Male Population of Chariton?
Total Male Population of Chariton is 2,070.
What is the Total Female Population of Chariton?
Total Female Population of Chariton is 2,133.
What is the Ratio of Males per 100 Females in Chariton?
There are 97.05 Males per 100 Females in Chariton.
What is the Ratio of Females per 100 Males in Chariton?
There are 103.04 Females per 100 Males in Chariton.
What is the Median Population Age in Chariton?
Median Population Age in Chariton is 37.2 Years.
What is the Average Family Size in Chariton
Average Family Size in Chariton is 3.0 People.
What is the Average Household Size in Chariton
Average Household Size in Chariton is 2.3 People.
How Large is the Labor Force in Chariton?
There are 2,061 People in the Labor Forcein in Chariton.
What is the Percentage of People in the Labor Force in Chariton?
62.9% of People are in the Labor Force in Chariton.
What is the Unemployment Rate in Chariton?
Unemployment Rate in Chariton is 6.4%.