Taiwanese Married-couple Households
COMPARE
Taiwanese
Select to Compare
Married-couple Households
Taiwanese Married-couple Households
45.9%
MARRIED-COUPLE HOUSEHOLDS
23.4/ 100
METRIC RATING
193rd/ 347
METRIC RANK
Taiwanese Married-couple Households Correlation Chart
The statistical analysis conducted on geographies consisting of 31,715,954 people shows a weak positive correlation between the proportion of Taiwanese and percentage of married-couple family households in the United States with a correlation coefficient (R) of 0.222 and weighted average of 45.9%. On average, for every 1% (one percent) increase in Taiwanese within a typical geography, there is an increase of 8.6% in percentage of married-couple family households.
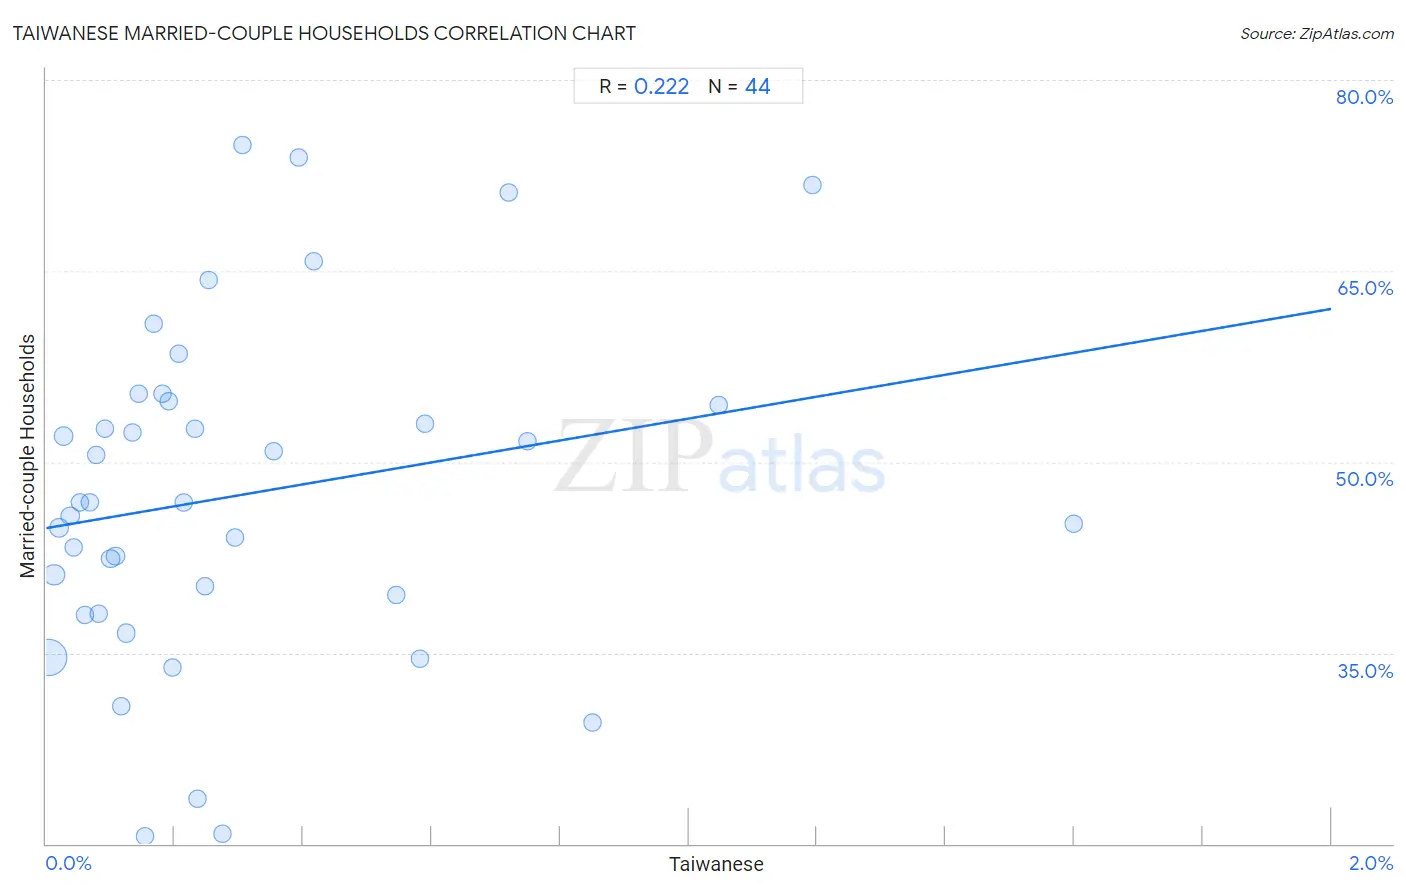
It is essential to understand that the correlation between the percentage of Taiwanese and percentage of married-couple family households does not imply a direct cause-and-effect relationship. It remains uncertain whether the presence of Taiwanese influences an upward or downward trend in the level of percentage of married-couple family households within an area, or if Taiwanese simply ended up residing in those areas with higher or lower levels of percentage of married-couple family households due to other factors.
Demographics Similar to Taiwanese by Married-couple Households
In terms of married-couple households, the demographic groups most similar to Taiwanese are Mexican American Indian (45.9%, a difference of 0.010%), Chickasaw (45.9%, a difference of 0.040%), Immigrants from Northern Africa (46.0%, a difference of 0.060%), Immigrants from South America (45.9%, a difference of 0.070%), and Choctaw (46.0%, a difference of 0.080%).
| Demographics | Rating | Rank | Married-couple Households |
| Albanians | 31.1 /100 | #186 | Fair 46.1% |
| Fijians | 29.2 /100 | #187 | Fair 46.1% |
| South American Indians | 28.4 /100 | #188 | Fair 46.0% |
| Immigrants from Latvia | 26.9 /100 | #189 | Fair 46.0% |
| Immigrants from Kuwait | 25.6 /100 | #190 | Fair 46.0% |
| Choctaw | 24.9 /100 | #191 | Fair 46.0% |
| Immigrants from Northern Africa | 24.6 /100 | #192 | Fair 46.0% |
| Taiwanese | 23.4 /100 | #193 | Fair 45.9% |
| Mexican American Indians | 23.3 /100 | #194 | Fair 45.9% |
| Chickasaw | 22.7 /100 | #195 | Fair 45.9% |
| Immigrants from South America | 22.2 /100 | #196 | Fair 45.9% |
| Cambodians | 21.3 /100 | #197 | Fair 45.9% |
| Ottawa | 19.4 /100 | #198 | Poor 45.8% |
| Carpatho Rusyns | 15.7 /100 | #199 | Poor 45.7% |
| Potawatomi | 15.6 /100 | #200 | Poor 45.7% |
Taiwanese Married-couple Households Correlation Summary
| Measurement | Taiwanese Data | Married-couple Households Data |
| Minimum | 0.0036% | 20.6% |
| Maximum | 1.6% | 74.9% |
| Range | 1.6% | 54.3% |
| Mean | 0.31% | 47.4% |
| Median | 0.19% | 46.8% |
| Interquartile 25% (IQ1) | 0.087% | 38.8% |
| Interquartile 75% (IQ3) | 0.37% | 54.6% |
| Interquartile Range (IQR) | 0.29% | 15.8% |
| Standard Deviation (Sample) | 0.34% | 13.3% |
| Standard Deviation (Population) | 0.34% | 13.1% |
Correlation Details
| Taiwanese Percentile | Sample Size | Married-couple Households |
[ 0.0% - 0.5% ] 0.0036% | 22,155,783 | 34.7% |
[ 0.0% - 0.5% ] 0.012% | 3,425,756 | 41.1% |
[ 0.0% - 0.5% ] 0.020% | 720,519 | 44.8% |
[ 0.0% - 0.5% ] 0.027% | 1,852,207 | 52.0% |
[ 0.0% - 0.5% ] 0.037% | 874,999 | 45.8% |
[ 0.0% - 0.5% ] 0.043% | 240,264 | 43.3% |
[ 0.0% - 0.5% ] 0.052% | 257,610 | 46.8% |
[ 0.0% - 0.5% ] 0.060% | 80,643 | 38.0% |
[ 0.0% - 0.5% ] 0.068% | 303,351 | 46.8% |
[ 0.0% - 0.5% ] 0.077% | 135,550 | 50.6% |
[ 0.0% - 0.5% ] 0.082% | 93,688 | 38.0% |
[ 0.0% - 0.5% ] 0.091% | 204,048 | 52.6% |
[ 0.0% - 0.5% ] 0.10% | 93,917 | 42.4% |
[ 0.0% - 0.5% ] 0.11% | 335,510 | 42.6% |
[ 0.0% - 0.5% ] 0.12% | 66,658 | 30.8% |
[ 0.0% - 0.5% ] 0.12% | 32,883 | 36.5% |
[ 0.0% - 0.5% ] 0.13% | 85,525 | 52.3% |
[ 0.0% - 0.5% ] 0.14% | 47,549 | 55.3% |
[ 0.0% - 0.5% ] 0.15% | 33,890 | 20.6% |
[ 0.0% - 0.5% ] 0.17% | 33,297 | 60.8% |
[ 0.0% - 0.5% ] 0.18% | 77,868 | 55.3% |
[ 0.0% - 0.5% ] 0.19% | 63,422 | 54.8% |
[ 0.0% - 0.5% ] 0.20% | 36,806 | 33.9% |
[ 0.0% - 0.5% ] 0.21% | 61,757 | 58.5% |
[ 0.0% - 0.5% ] 0.21% | 17,808 | 46.8% |
[ 0.0% - 0.5% ] 0.23% | 37,298 | 52.6% |
[ 0.0% - 0.5% ] 0.23% | 21,712 | 23.5% |
[ 0.0% - 0.5% ] 0.25% | 40,064 | 40.3% |
[ 0.0% - 0.5% ] 0.25% | 30,509 | 64.3% |
[ 0.0% - 0.5% ] 0.28% | 18,536 | 20.8% |
[ 0.0% - 0.5% ] 0.29% | 7,471 | 44.1% |
[ 0.0% - 0.5% ] 0.31% | 654 | 74.9% |
[ 0.0% - 0.5% ] 0.35% | 83,401 | 50.8% |
[ 0.0% - 0.5% ] 0.39% | 7,626 | 73.9% |
[ 0.0% - 0.5% ] 0.42% | 32,665 | 65.8% |
[ 0.5% - 1.0% ] 0.54% | 1,471 | 39.6% |
[ 0.5% - 1.0% ] 0.58% | 23,689 | 34.5% |
[ 0.5% - 1.0% ] 0.59% | 3,051 | 53.0% |
[ 0.5% - 1.0% ] 0.72% | 278 | 71.1% |
[ 0.5% - 1.0% ] 0.75% | 66,249 | 51.7% |
[ 0.5% - 1.0% ] 0.85% | 470 | 29.5% |
[ 1.0% - 1.5% ] 1.05% | 4,487 | 54.5% |
[ 1.0% - 1.5% ] 1.19% | 2,515 | 71.7% |
[ 1.5% - 2.0% ] 1.60% | 2,500 | 45.1% |