Mexican Married-couple Households
COMPARE
Mexican
Select to Compare
Married-couple Households
Mexican Married-couple Households
47.1%
MARRIED-COUPLE HOUSEHOLDS
83.4/ 100
METRIC RATING
144th/ 347
METRIC RANK
Mexican Married-couple Households Correlation Chart
The statistical analysis conducted on geographies consisting of 560,704,291 people shows a mild positive correlation between the proportion of Mexicans and percentage of married-couple family households in the United States with a correlation coefficient (R) of 0.347 and weighted average of 47.1%. On average, for every 1% (one percent) increase in Mexicans within a typical geography, there is an increase of 0.038% in percentage of married-couple family households.
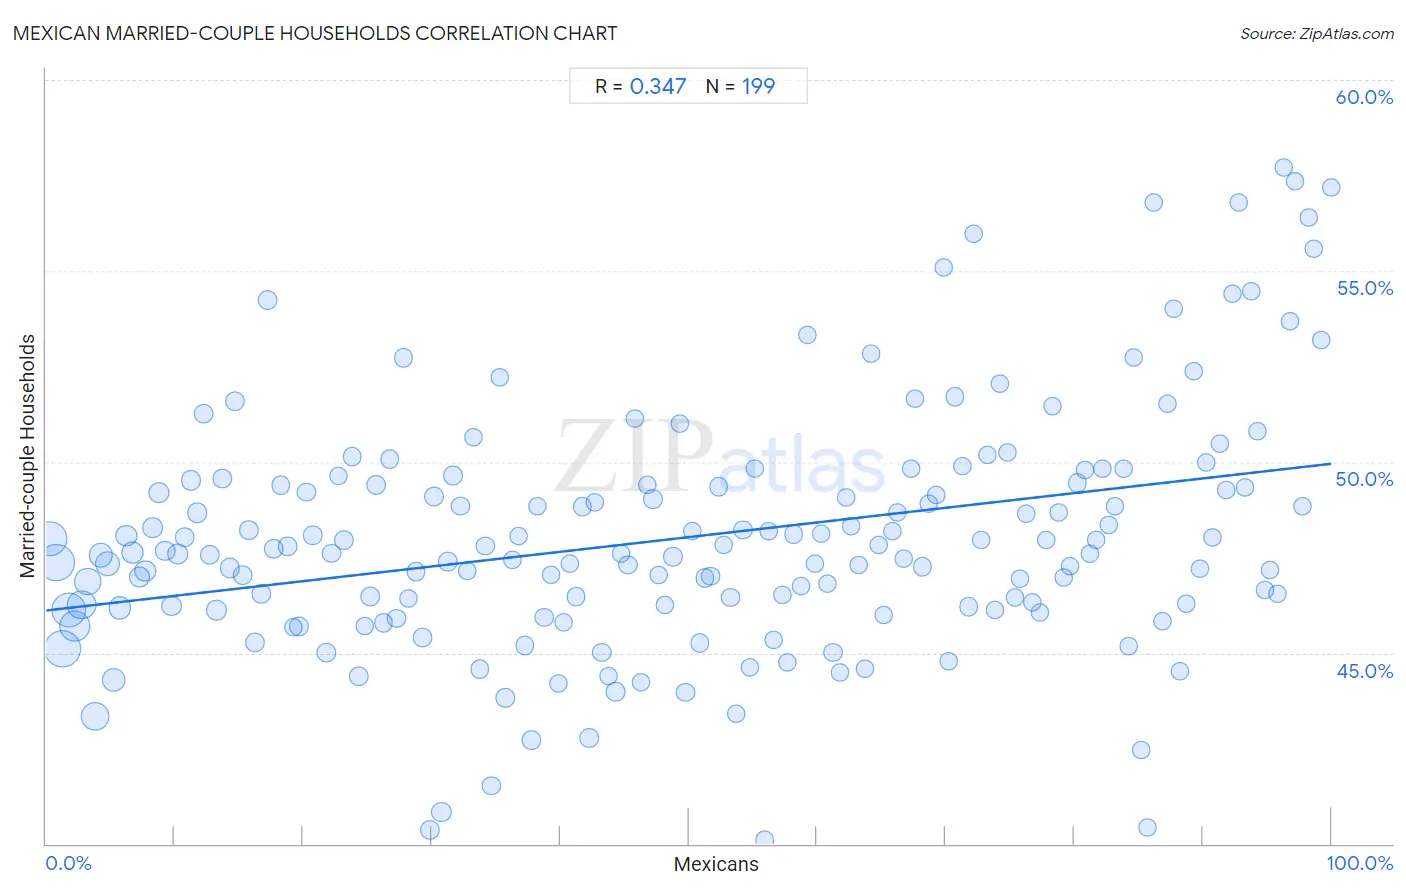
It is essential to understand that the correlation between the percentage of Mexicans and percentage of married-couple family households does not imply a direct cause-and-effect relationship. It remains uncertain whether the presence of Mexicans influences an upward or downward trend in the level of percentage of married-couple family households within an area, or if Mexicans simply ended up residing in those areas with higher or lower levels of percentage of married-couple family households due to other factors.
Demographics Similar to Mexicans by Married-couple Households
In terms of married-couple households, the demographic groups most similar to Mexicans are Immigrants from Belarus (47.2%, a difference of 0.020%), Spaniard (47.2%, a difference of 0.050%), Spanish (47.2%, a difference of 0.070%), Costa Rican (47.2%, a difference of 0.070%), and Immigrants from Sweden (47.2%, a difference of 0.090%).
| Demographics | Rating | Rank | Married-couple Households |
| Immigrants from Malaysia | 85.2 /100 | #137 | Excellent 47.2% |
| Immigrants from Afghanistan | 85.1 /100 | #138 | Excellent 47.2% |
| Immigrants from Sweden | 84.7 /100 | #139 | Excellent 47.2% |
| Spanish | 84.5 /100 | #140 | Excellent 47.2% |
| Costa Ricans | 84.4 /100 | #141 | Excellent 47.2% |
| Spaniards | 84.1 /100 | #142 | Excellent 47.2% |
| Immigrants from Belarus | 83.8 /100 | #143 | Excellent 47.2% |
| Mexicans | 83.4 /100 | #144 | Excellent 47.1% |
| Slovenes | 81.7 /100 | #145 | Excellent 47.1% |
| Immigrants from Western Europe | 81.6 /100 | #146 | Excellent 47.1% |
| Immigrants from Syria | 81.6 /100 | #147 | Excellent 47.1% |
| Icelanders | 79.5 /100 | #148 | Good 47.0% |
| Paraguayans | 78.7 /100 | #149 | Good 47.0% |
| Immigrants from Russia | 77.6 /100 | #150 | Good 47.0% |
| Immigrants from Bulgaria | 76.8 /100 | #151 | Good 47.0% |
Mexican Married-couple Households Correlation Summary
| Measurement | Mexican Data | Married-couple Households Data |
| Minimum | 0.28% | 40.1% |
| Maximum | 100.0% | 57.7% |
| Range | 99.7% | 17.6% |
| Mean | 50.1% | 48.0% |
| Median | 50.3% | 47.6% |
| Interquartile 25% (IQ1) | 25.2% | 46.2% |
| Interquartile 75% (IQ3) | 75.3% | 49.4% |
| Interquartile Range (IQR) | 50.1% | 3.2% |
| Standard Deviation (Sample) | 28.9% | 3.2% |
| Standard Deviation (Population) | 28.9% | 3.2% |
Correlation Details
| Mexican Percentile | Sample Size | Married-couple Households |
[ 0.0% - 0.5% ] 0.28% | 40,120,087 | 48.0% |
[ 0.5% - 1.0% ] 0.75% | 45,631,462 | 47.4% |
[ 1.0% - 1.5% ] 1.25% | 46,075,008 | 45.1% |
[ 1.5% - 2.0% ] 1.75% | 39,722,460 | 46.1% |
[ 2.0% - 2.5% ] 2.23% | 31,674,583 | 45.7% |
[ 2.5% - 3.0% ] 2.74% | 25,632,893 | 46.3% |
[ 3.0% - 3.5% ] 3.23% | 20,298,254 | 46.9% |
[ 3.5% - 4.0% ] 3.81% | 24,059,406 | 43.3% |
[ 4.0% - 4.5% ] 4.26% | 14,381,179 | 47.6% |
[ 4.5% - 5.0% ] 4.75% | 15,393,797 | 47.3% |
[ 5.0% - 5.5% ] 5.26% | 12,618,102 | 44.3% |
[ 5.5% - 6.0% ] 5.74% | 10,199,471 | 46.2% |
[ 6.0% - 6.5% ] 6.27% | 8,799,223 | 48.1% |
[ 6.5% - 7.0% ] 6.76% | 9,100,356 | 47.6% |
[ 7.0% - 7.5% ] 7.26% | 8,476,488 | 47.0% |
[ 7.5% - 8.0% ] 7.72% | 7,537,447 | 47.1% |
[ 8.0% - 8.5% ] 8.25% | 5,506,587 | 48.3% |
[ 8.5% - 9.0% ] 8.75% | 5,268,466 | 49.2% |
[ 9.0% - 9.5% ] 9.24% | 5,047,646 | 47.7% |
[ 9.5% - 10.0% ] 9.73% | 4,445,523 | 46.2% |
[ 10.0% - 10.5% ] 10.24% | 5,119,791 | 47.6% |
[ 10.5% - 11.0% ] 10.77% | 4,416,506 | 48.0% |
[ 11.0% - 11.5% ] 11.26% | 4,369,645 | 49.5% |
[ 11.5% - 12.0% ] 11.76% | 4,635,768 | 48.7% |
[ 12.0% - 12.5% ] 12.24% | 3,462,591 | 51.3% |
[ 12.5% - 13.0% ] 12.72% | 4,042,547 | 47.6% |
[ 13.0% - 13.5% ] 13.27% | 5,166,731 | 46.1% |
[ 13.5% - 14.0% ] 13.73% | 3,991,695 | 49.6% |
[ 14.0% - 14.5% ] 14.25% | 3,765,856 | 47.2% |
[ 14.5% - 15.0% ] 14.73% | 3,215,830 | 51.6% |
[ 15.0% - 15.5% ] 15.26% | 2,437,951 | 47.0% |
[ 15.5% - 16.0% ] 15.76% | 2,368,645 | 48.2% |
[ 16.0% - 16.5% ] 16.23% | 3,314,744 | 45.3% |
[ 16.5% - 17.0% ] 16.75% | 2,506,213 | 46.5% |
[ 17.0% - 17.5% ] 17.24% | 2,578,286 | 54.2% |
[ 17.5% - 18.0% ] 17.73% | 3,074,910 | 47.7% |
[ 18.0% - 18.5% ] 18.25% | 2,233,702 | 49.4% |
[ 18.5% - 19.0% ] 18.76% | 2,436,925 | 47.8% |
[ 19.0% - 19.5% ] 19.25% | 1,522,824 | 45.7% |
[ 19.5% - 20.0% ] 19.69% | 2,232,163 | 45.7% |
[ 20.0% - 20.5% ] 20.24% | 2,028,639 | 49.2% |
[ 20.5% - 21.0% ] 20.75% | 1,617,437 | 48.1% |
[ 21.5% - 22.0% ] 21.78% | 2,572,828 | 45.0% |
[ 22.0% - 22.5% ] 22.20% | 1,916,509 | 47.6% |
[ 22.5% - 23.0% ] 22.74% | 1,512,719 | 49.6% |
[ 23.0% - 23.5% ] 23.18% | 2,285,063 | 48.0% |
[ 23.5% - 24.0% ] 23.79% | 1,512,533 | 50.1% |
[ 24.0% - 24.5% ] 24.29% | 2,982,311 | 44.4% |
[ 24.5% - 25.0% ] 24.77% | 1,332,156 | 45.7% |
[ 25.0% - 25.5% ] 25.24% | 1,950,243 | 46.5% |
[ 25.5% - 26.0% ] 25.66% | 3,585,523 | 49.4% |
[ 26.0% - 26.5% ] 26.22% | 1,266,120 | 45.8% |
[ 26.5% - 27.0% ] 26.73% | 1,323,208 | 50.1% |
[ 27.0% - 27.5% ] 27.24% | 1,657,475 | 45.9% |
[ 27.5% - 28.0% ] 27.81% | 1,431,206 | 52.7% |
[ 28.0% - 28.5% ] 28.19% | 1,425,783 | 46.4% |
[ 28.5% - 29.0% ] 28.76% | 1,211,015 | 47.1% |
[ 29.0% - 29.5% ] 29.30% | 3,003,115 | 45.4% |
[ 29.5% - 30.0% ] 29.85% | 3,386,214 | 40.4% |
[ 30.0% - 30.5% ] 30.19% | 1,866,289 | 49.1% |
[ 30.5% - 31.0% ] 30.78% | 5,515,585 | 40.8% |
[ 31.0% - 31.5% ] 31.27% | 1,406,268 | 47.4% |
[ 31.5% - 32.0% ] 31.66% | 609,183 | 49.6% |
[ 32.0% - 32.5% ] 32.22% | 891,451 | 48.8% |
[ 32.5% - 33.0% ] 32.75% | 1,314,403 | 47.1% |
[ 33.0% - 33.5% ] 33.23% | 1,402,128 | 50.7% |
[ 33.5% - 34.0% ] 33.74% | 1,164,542 | 44.6% |
[ 34.0% - 34.5% ] 34.19% | 1,410,328 | 47.8% |
[ 34.5% - 35.0% ] 34.64% | 2,494,289 | 41.5% |
[ 35.0% - 35.5% ] 35.30% | 994,643 | 52.2% |
[ 35.5% - 36.0% ] 35.72% | 1,590,018 | 43.8% |
[ 36.0% - 36.5% ] 36.24% | 532,615 | 47.4% |
[ 36.5% - 37.0% ] 36.73% | 929,370 | 48.1% |
[ 37.0% - 37.5% ] 37.24% | 816,108 | 45.2% |
[ 37.5% - 38.0% ] 37.74% | 2,443,240 | 42.7% |
[ 38.0% - 38.5% ] 38.20% | 402,941 | 48.8% |
[ 38.5% - 39.0% ] 38.76% | 761,890 | 45.9% |
[ 39.0% - 39.5% ] 39.26% | 747,331 | 47.0% |
[ 39.5% - 40.0% ] 39.85% | 1,539,922 | 44.2% |
[ 40.0% - 40.5% ] 40.24% | 687,361 | 45.8% |
[ 40.5% - 41.0% ] 40.78% | 739,237 | 47.3% |
[ 41.0% - 41.5% ] 41.25% | 1,103,767 | 46.5% |
[ 41.5% - 42.0% ] 41.73% | 806,629 | 48.8% |
[ 42.0% - 42.5% ] 42.24% | 1,001,409 | 42.8% |
[ 42.5% - 43.0% ] 42.73% | 652,325 | 48.9% |
[ 43.0% - 43.5% ] 43.23% | 496,212 | 45.0% |
[ 43.5% - 44.0% ] 43.73% | 961,247 | 44.4% |
[ 44.0% - 44.5% ] 44.30% | 633,518 | 44.0% |
[ 44.5% - 45.0% ] 44.74% | 890,043 | 47.6% |
[ 45.0% - 45.5% ] 45.26% | 730,371 | 47.3% |
[ 45.5% - 46.0% ] 45.77% | 871,938 | 51.1% |
[ 46.0% - 46.5% ] 46.29% | 1,150,215 | 44.2% |
[ 46.5% - 47.0% ] 46.78% | 990,772 | 49.4% |
[ 47.0% - 47.5% ] 47.20% | 1,121,830 | 49.0% |
[ 47.5% - 48.0% ] 47.66% | 218,790 | 47.0% |
[ 48.0% - 48.5% ] 48.16% | 518,776 | 46.2% |
[ 48.5% - 49.0% ] 48.77% | 889,766 | 47.5% |
[ 49.0% - 49.5% ] 49.29% | 493,661 | 51.0% |
[ 49.5% - 50.0% ] 49.75% | 547,285 | 44.0% |
[ 50.0% - 50.5% ] 50.28% | 703,504 | 48.2% |
[ 50.5% - 51.0% ] 50.85% | 684,098 | 45.3% |
[ 51.0% - 51.5% ] 51.29% | 674,174 | 47.0% |
[ 51.5% - 52.0% ] 51.70% | 312,914 | 47.0% |
[ 52.0% - 52.5% ] 52.34% | 673,430 | 49.3% |
[ 52.5% - 53.0% ] 52.71% | 522,549 | 47.8% |
[ 53.0% - 53.5% ] 53.25% | 330,047 | 46.4% |
[ 53.5% - 54.0% ] 53.69% | 127,698 | 43.4% |
[ 54.0% - 54.5% ] 54.23% | 506,556 | 48.2% |
[ 54.5% - 55.0% ] 54.80% | 356,753 | 44.6% |
[ 55.0% - 55.5% ] 55.16% | 792,015 | 49.8% |
[ 55.5% - 56.0% ] 55.92% | 1,730,904 | 40.1% |
[ 56.0% - 56.5% ] 56.21% | 290,875 | 48.2% |
[ 56.5% - 57.0% ] 56.65% | 408,380 | 45.3% |
[ 57.0% - 57.5% ] 57.31% | 392,766 | 46.5% |
[ 57.5% - 58.0% ] 57.69% | 573,497 | 44.7% |
[ 58.0% - 58.5% ] 58.19% | 726,723 | 48.1% |
[ 58.5% - 59.0% ] 58.76% | 834,106 | 46.7% |
[ 59.0% - 59.5% ] 59.24% | 527,005 | 53.3% |
[ 59.5% - 60.0% ] 59.79% | 424,602 | 47.3% |
[ 60.0% - 60.5% ] 60.32% | 408,822 | 48.1% |
[ 60.5% - 61.0% ] 60.76% | 476,104 | 46.8% |
[ 61.0% - 61.5% ] 61.23% | 281,769 | 45.0% |
[ 61.5% - 62.0% ] 61.76% | 217,607 | 44.5% |
[ 62.0% - 62.5% ] 62.26% | 270,013 | 49.1% |
[ 62.5% - 63.0% ] 62.63% | 449,820 | 48.3% |
[ 63.0% - 63.5% ] 63.21% | 305,179 | 47.3% |
[ 63.5% - 64.0% ] 63.73% | 195,267 | 44.6% |
[ 64.0% - 64.5% ] 64.15% | 567,789 | 52.8% |
[ 64.5% - 65.0% ] 64.82% | 168,536 | 47.8% |
[ 65.0% - 65.5% ] 65.21% | 203,859 | 46.0% |
[ 65.5% - 66.0% ] 65.89% | 445,746 | 48.2% |
[ 66.0% - 66.5% ] 66.24% | 176,805 | 48.7% |
[ 66.5% - 67.0% ] 66.71% | 296,632 | 47.5% |
[ 67.0% - 67.5% ] 67.29% | 307,612 | 49.8% |
[ 67.5% - 68.0% ] 67.62% | 344,341 | 51.6% |
[ 68.0% - 68.5% ] 68.21% | 466,375 | 47.3% |
[ 68.5% - 69.0% ] 68.71% | 210,860 | 48.9% |
[ 69.0% - 69.5% ] 69.26% | 492,079 | 49.1% |
[ 69.5% - 70.0% ] 69.85% | 264,207 | 55.1% |
[ 70.0% - 70.5% ] 70.20% | 224,662 | 44.8% |
[ 70.5% - 71.0% ] 70.71% | 504,387 | 51.7% |
[ 71.0% - 71.5% ] 71.26% | 545,024 | 49.9% |
[ 71.5% - 72.0% ] 71.75% | 581,760 | 46.2% |
[ 72.0% - 72.5% ] 72.17% | 193,763 | 56.0% |
[ 72.5% - 73.0% ] 72.78% | 385,998 | 47.9% |
[ 73.0% - 73.5% ] 73.22% | 405,058 | 50.2% |
[ 73.5% - 74.0% ] 73.79% | 191,126 | 46.1% |
[ 74.0% - 74.5% ] 74.21% | 397,820 | 52.1% |
[ 74.5% - 75.0% ] 74.76% | 190,337 | 50.2% |
[ 75.0% - 75.5% ] 75.34% | 392,157 | 46.4% |
[ 75.5% - 76.0% ] 75.81% | 240,043 | 47.0% |
[ 76.0% - 76.5% ] 76.29% | 237,471 | 48.6% |
[ 76.5% - 77.0% ] 76.71% | 856,084 | 46.3% |
[ 77.0% - 77.5% ] 77.31% | 383,491 | 46.1% |
[ 77.5% - 78.0% ] 77.85% | 198,774 | 48.0% |
[ 78.0% - 78.5% ] 78.30% | 149,710 | 51.5% |
[ 78.5% - 79.0% ] 78.83% | 271,914 | 48.7% |
[ 79.0% - 79.5% ] 79.22% | 295,581 | 47.0% |
[ 79.5% - 80.0% ] 79.62% | 121,906 | 47.3% |
[ 80.0% - 80.5% ] 80.24% | 673,592 | 49.4% |
[ 80.5% - 81.0% ] 80.81% | 104,903 | 49.8% |
[ 81.0% - 81.5% ] 81.18% | 325,245 | 47.6% |
[ 81.5% - 82.0% ] 81.74% | 357,068 | 48.0% |
[ 82.0% - 82.5% ] 82.18% | 191,477 | 49.8% |
[ 82.5% - 83.0% ] 82.66% | 105,641 | 48.3% |
[ 83.0% - 83.5% ] 83.15% | 265,636 | 48.8% |
[ 83.5% - 84.0% ] 83.84% | 210,058 | 49.8% |
[ 84.0% - 84.5% ] 84.26% | 285,886 | 45.2% |
[ 84.5% - 85.0% ] 84.67% | 77,718 | 52.7% |
[ 85.0% - 85.5% ] 85.20% | 80,600 | 42.5% |
[ 85.5% - 86.0% ] 85.74% | 23,865 | 40.4% |
[ 86.0% - 86.5% ] 86.16% | 108,707 | 56.8% |
[ 86.5% - 87.0% ] 86.85% | 169,567 | 45.8% |
[ 87.0% - 87.5% ] 87.27% | 246,907 | 51.5% |
[ 87.5% - 88.0% ] 87.70% | 229,558 | 54.0% |
[ 88.0% - 88.5% ] 88.19% | 132,543 | 44.5% |
[ 88.5% - 89.0% ] 88.74% | 80,081 | 46.3% |
[ 89.0% - 89.5% ] 89.27% | 143,906 | 52.4% |
[ 89.5% - 90.0% ] 89.81% | 318,610 | 47.2% |
[ 90.0% - 90.5% ] 90.22% | 360,166 | 50.0% |
[ 90.5% - 91.0% ] 90.73% | 198,502 | 48.0% |
[ 91.0% - 91.5% ] 91.34% | 514,098 | 50.5% |
[ 91.5% - 92.0% ] 91.78% | 292,897 | 49.3% |
[ 92.0% - 92.5% ] 92.33% | 54,451 | 54.4% |
[ 92.5% - 93.0% ] 92.78% | 178,418 | 56.8% |
[ 93.0% - 93.5% ] 93.28% | 94,969 | 49.3% |
[ 93.5% - 94.0% ] 93.77% | 99,772 | 54.5% |
[ 94.0% - 94.5% ] 94.27% | 178,878 | 50.8% |
[ 94.5% - 95.0% ] 94.80% | 121,556 | 46.6% |
[ 95.0% - 95.5% ] 95.26% | 75,853 | 47.2% |
[ 95.5% - 96.0% ] 95.84% | 24,421 | 46.5% |
[ 96.0% - 96.5% ] 96.29% | 28,097 | 57.7% |
[ 96.5% - 97.0% ] 96.77% | 28,254 | 53.7% |
[ 97.0% - 97.5% ] 97.21% | 22,835 | 57.3% |
[ 97.5% - 98.0% ] 97.76% | 43,324 | 48.8% |
[ 98.0% - 98.5% ] 98.25% | 19,383 | 56.4% |
[ 98.5% - 99.0% ] 98.66% | 27,671 | 55.6% |
[ 99.0% - 99.5% ] 99.18% | 16,801 | 53.2% |
[ 99.5% - 100.0% ] 99.95% | 63,739 | 57.2% |