Kenyan vs Arapaho Married-couple Households

COMPARE

Kenyan
Race
Ancestry
AfghanAfricanAlaska NativeAlaskan AthabascanAlbanianAleutAlsatianAmericanApacheArabArgentineanArmenianAssyrian/Chaldean/SyriacAustralianAustrianBahamianBangladeshiBarbadianBasqueBelgianBelizeanBermudanBhutaneseBlackfeetBolivianBrazilianBritishBritish West IndianBulgarianBurmeseCajunCambodianCanadianCape VerdeanCarpatho RusynCelticCentral AmericanCentral American IndianCherokeeCheyenneChickasawChileanChineseChippewaChoctawColombianColvilleComancheCosta RicanCreeCreekCroatianCrowCubanCypriotCzechCzechoslovakianDanishDelawareDominicanDutchDutch West IndianEastern EuropeanEcuadorianEgyptianEnglishEstonianEthiopianEuropeanFijianFilipinoFinnishFrenchFrench American IndianFrench CanadianGermanGerman RussianGhanaianGreekGuamanian/ChamorroGuatemalanGuyaneseHaitianHmongHonduranHopiHoumaHungarianIcelanderIndian (Asian)IndonesianInupiatIranianIraqiIrishIroquoisIsraeliItalianJamaicanJapaneseJordanianKenyanKiowaKoreanLaotianLatvianLebaneseLiberianLithuanianLumbeeLuxembourgerMacedonianMalaysianMalteseMarshalleseMenomineeMexicanMexican American IndianMongolianMoroccanNative HawaiianNavajoNepaleseNew ZealanderNicaraguanNigerianNorthern EuropeanNorwegianOkinawanOsageOttawaPaiutePakistaniPalestinianPanamanianParaguayanPennsylvania GermanPeruvianPimaPolishPortuguesePotawatomiPuebloPuerto RicanPuget Sound SalishRomanianRussianSalvadoranSamoanScandinavianScotch-IrishScottishSeminoleSenegaleseSerbianShoshoneSierra LeoneanSiouxSlavicSlovakSloveneSomaliSouth AfricanSouth AmericanSouth American IndianSoviet UnionSpaniardSpanishSpanish AmericanSpanish American IndianSri LankanSubsaharan AfricanSudaneseSwedishSwissSyrianTaiwaneseThaiTlingit-HaidaTohono O'OdhamTonganTrinidadian and TobagonianTsimshianTurkishU.S. Virgin IslanderUgandanUkrainianUruguayanUteVenezuelanVietnameseWelshWest IndianYakamaYaquiYugoslavianYumanYup'ikZimbabwean
Immigration
NonimmigrantsImmigrantsAfghanistanAfricaAlbaniaArgentinaArmeniaAsiaAustraliaAustriaBahamasBangladeshBarbadosBelarusBelgiumBelizeBoliviaBosnia and HerzegovinaBrazilBulgariaBurma/MyanmarCabo VerdeCambodiaCameroonCanadaCaribbeanCentral AmericaChileChinaColombiaCongoCosta RicaCroatiaCubaCzechoslovakiaDenmarkDominicaDominican RepublicEastern AfricaEastern AsiaEastern EuropeEcuadorEgyptEl SalvadorEnglandEritreaEthiopiaEuropeFijiFranceGermanyGhanaGreeceGrenadaGuatemalaGuyanaHaitiHondurasHong KongHungaryIndiaIndonesiaIranIraqIrelandIsraelItalyJamaicaJapanJordanKazakhstanKenyaKoreaKuwaitLaosLatin AmericaLatviaLebanonLiberiaLithuaniaMalaysiaMexicoMicronesiaMiddle AfricaMoldovaMoroccoNepalNetherlandsNicaraguaNigeriaNorth AmericaNorth MacedoniaNorthern AfricaNorthern EuropeNorwayOceaniaPakistanPanamaPeruPhilippinesPolandPortugalRomaniaRussiaSaudi ArabiaScotlandSenegalSerbiaSierra LeoneSingaporeSomaliaSouth AfricaSouth AmericaSouth Central AsiaSouth Eastern AsiaSouthern EuropeSpainSri LankaSt. Vincent and the GrenadinesSudanSwedenSwitzerlandSyriaTaiwanThailandTrinidad and TobagoTurkeyUgandaUkraineUruguayUzbekistanVenezuelaVietnamWest IndiesWestern AfricaWestern AsiaWestern EuropeYemenZaireZimbabweAzores
Arapaho
Race
Ancestry
AfghanAfricanAlaska NativeAlaskan AthabascanAlbanianAleutAlsatianAmericanApacheArabArapahoArgentineanArmenianAssyrian/Chaldean/SyriacAustralianAustrianBahamianBangladeshiBarbadianBasqueBelgianBelizeanBermudanBhutaneseBlackfeetBolivianBrazilianBritishBritish West IndianBulgarianBurmeseCajunCambodianCanadianCape VerdeanCarpatho RusynCelticCentral AmericanCentral American IndianCherokeeCheyenneChickasawChileanChineseChippewaChoctawColombianColvilleComancheCosta RicanCreeCreekCroatianCrowCubanCypriotCzechCzechoslovakianDanishDelawareDominicanDutchDutch West IndianEastern EuropeanEcuadorianEgyptianEnglishEstonianEthiopianEuropeanFijianFilipinoFinnishFrenchFrench American IndianFrench CanadianGermanGerman RussianGhanaianGreekGuamanian/ChamorroGuatemalanGuyaneseHaitianHmongHonduranHopiHoumaHungarianIcelanderIndian (Asian)IndonesianInupiatIranianIraqiIrishIroquoisIsraeliItalianJamaicanJapaneseJordanianKiowaKoreanLaotianLatvianLebaneseLiberianLithuanianLumbeeLuxembourgerMacedonianMalaysianMalteseMarshalleseMenomineeMexicanMexican American IndianMongolianMoroccanNative HawaiianNavajoNepaleseNew ZealanderNicaraguanNigerianNorthern EuropeanNorwegianOkinawanOsageOttawaPaiutePakistaniPalestinianPanamanianParaguayanPennsylvania GermanPeruvianPimaPolishPortuguesePotawatomiPuebloPuerto RicanPuget Sound SalishRomanianRussianSalvadoranSamoanScandinavianScotch-IrishScottishSeminoleSenegaleseSerbianShoshoneSierra LeoneanSiouxSlavicSlovakSloveneSomaliSouth AfricanSouth AmericanSouth American IndianSoviet UnionSpaniardSpanishSpanish AmericanSpanish American IndianSri LankanSubsaharan AfricanSudaneseSwedishSwissSyrianTaiwaneseThaiTlingit-HaidaTohono O'OdhamTonganTrinidadian and TobagonianTsimshianTurkishU.S. Virgin IslanderUgandanUkrainianUruguayanUteVenezuelanVietnameseWelshWest IndianYakamaYaquiYugoslavianYumanYup'ikZimbabwean
Immigration
NonimmigrantsImmigrantsAfghanistanAfricaAlbaniaArgentinaArmeniaAsiaAustraliaAustriaBahamasBangladeshBarbadosBelarusBelgiumBelizeBoliviaBosnia and HerzegovinaBrazilBulgariaBurma/MyanmarCabo VerdeCambodiaCameroonCanadaCaribbeanCentral AmericaChileChinaColombiaCongoCosta RicaCroatiaCubaCzechoslovakiaDenmarkDominicaDominican RepublicEastern AfricaEastern AsiaEastern EuropeEcuadorEgyptEl SalvadorEnglandEritreaEthiopiaEuropeFijiFranceGermanyGhanaGreeceGrenadaGuatemalaGuyanaHaitiHondurasHong KongHungaryIndiaIndonesiaIranIraqIrelandIsraelItalyJamaicaJapanJordanKazakhstanKenyaKoreaKuwaitLaosLatin AmericaLatviaLebanonLiberiaLithuaniaMalaysiaMexicoMicronesiaMiddle AfricaMoldovaMoroccoNepalNetherlandsNicaraguaNigeriaNorth AmericaNorth MacedoniaNorthern AfricaNorthern EuropeNorwayOceaniaPakistanPanamaPeruPhilippinesPolandPortugalRomaniaRussiaSaudi ArabiaScotlandSenegalSerbiaSierra LeoneSingaporeSomaliaSouth AfricaSouth AmericaSouth Central AsiaSouth Eastern AsiaSouthern EuropeSpainSri LankaSt. Vincent and the GrenadinesSudanSwedenSwitzerlandSyriaTaiwanThailandTrinidad and TobagoTurkeyUgandaUkraineUruguayUzbekistanVenezuelaVietnamWest IndiesWestern AfricaWestern AsiaWestern EuropeYemenZaireZimbabweAzores
Married-couple Households
Income
Poverty
Unemployment
Labor Participation
Family Structure
Vehicle Availability
Education Level
Disability

Married-couple Households Comparison

Kenyans

Arapaho

Tragic
Tragic
44.7%
MARRIED-COUPLE HOUSEHOLDS
1.7/ 100
METRIC RATING
228th/ 347
METRIC RANK
41.8%
MARRIED-COUPLE HOUSEHOLDS
0.0/ 100
METRIC RATING
297th/ 347
METRIC RANK

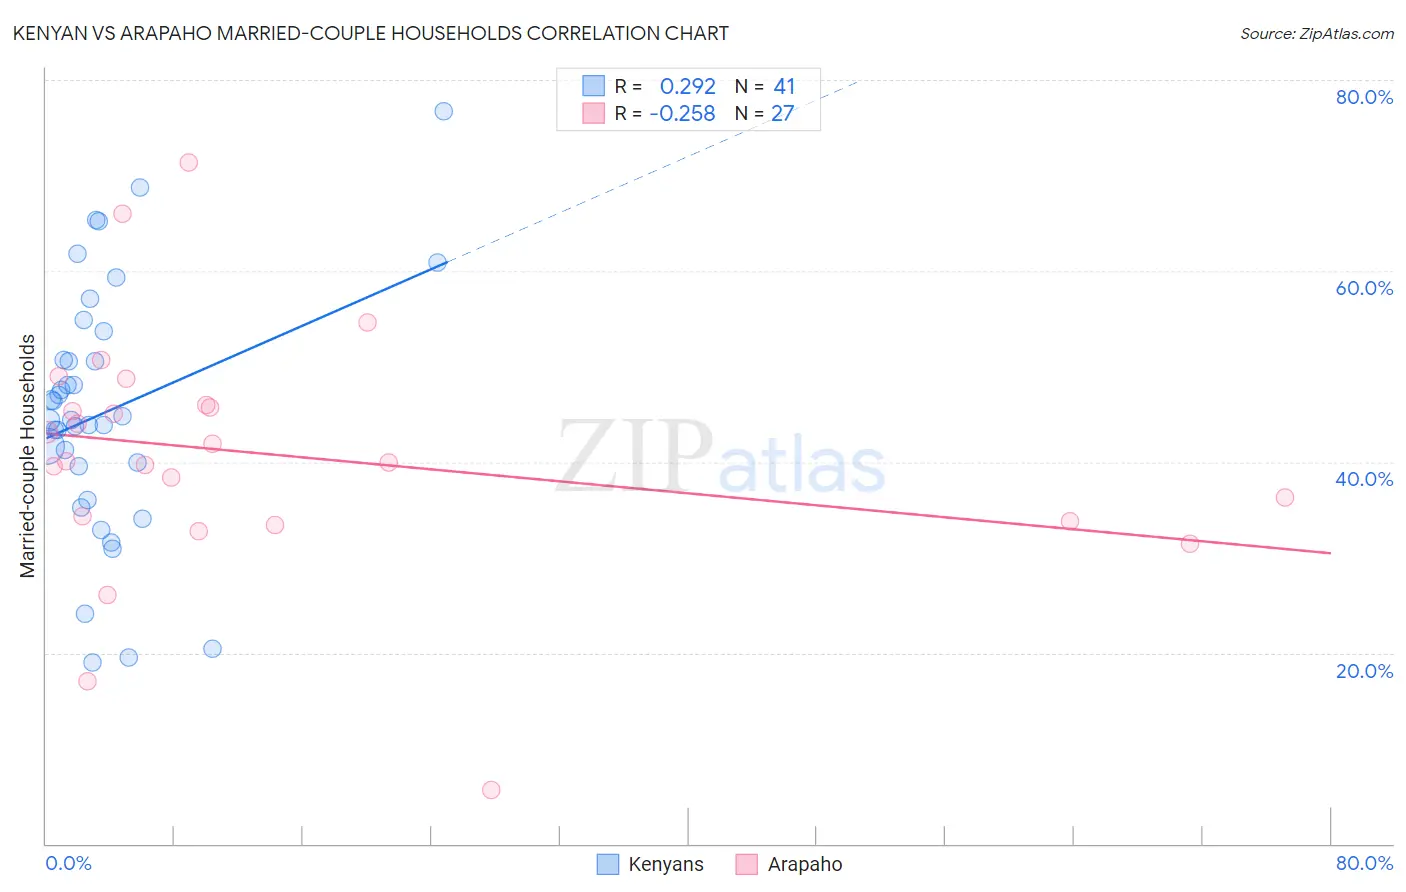
Kenyan vs Arapaho Married-couple Households Correlation Chart

The statistical analysis conducted on geographies consisting of 168,165,214 people shows a weak positive correlation between the proportion of Kenyans and percentage of married-couple family households in the United States with a correlation coefficient (R) of 0.292 and weighted average of 44.7%. Similarly, the statistical analysis conducted on geographies consisting of 29,778,233 people shows a weak negative correlation between the proportion of Arapaho and percentage of married-couple family households in the United States with a correlation coefficient (R) of -0.258 and weighted average of 41.8%, a difference of 6.8%.
Kenyan vs Arapaho Married-couple Households

Married-couple Households Correlation Summary

MeasurementKenyanArapaho
Minimum18.9%5.6%
Maximum76.7%71.4%
Range57.7%65.7%
Mean45.3%40.7%
Median44.4%40.1%
Interquartile 25% (IQ1)37.8%33.7%
Interquartile 75% (IQ3)52.2%46.0%
Interquartile Range (IQR)14.4%12.2%
Standard Deviation (Sample)13.1%13.1%
Standard Deviation (Population)12.9%12.8%

Similar Demographics by Married-couple Households

Demographics Similar to Kenyans by Married-couple Households

In terms of married-couple households, the demographic groups most similar to Kenyans are Immigrants from Latin America (44.7%, a difference of 0.050%), Soviet Union (44.6%, a difference of 0.090%), Houma (44.6%, a difference of 0.10%), Marshallese (44.6%, a difference of 0.10%), and Salvadoran (44.7%, a difference of 0.13%).
DemographicsRating | RankMarried-couple Households
Tlingit-Haida
4.9
/100
|
#221
Tragic
45.1%
Immigrants | Laos
4.6
/100
|
#222
Tragic
45.1%
Immigrants | Cambodia
2.7
/100
|
#223
Tragic
44.9%
Immigrants | Micronesia
2.6
/100
|
#224
Tragic
44.9%
Dutch West Indians
2.6
/100
|
#225
Tragic
44.9%
Alsatians
2.3
/100
|
#226
Tragic
44.8%
Salvadorans
1.9
/100
|
#227
Tragic
44.7%
Kenyans
1.7
/100
|
#228
Tragic
44.7%
Immigrants | Latin America
1.6
/100
|
#229
Tragic
44.7%
Soviet Union
1.6
/100
|
#230
Tragic
44.6%
Houma
1.5
/100
|
#231
Tragic
44.6%
Marshallese
1.5
/100
|
#232
Tragic
44.6%
Immigrants | Uganda
1.5
/100
|
#233
Tragic
44.6%
Immigrants | Panama
1.3
/100
|
#234
Tragic
44.6%
Immigrants | Nicaragua
1.2
/100
|
#235
Tragic
44.5%

Demographics Similar to Arapaho by Married-couple Households

In terms of married-couple households, the demographic groups most similar to Arapaho are Immigrants from Middle Africa (41.8%, a difference of 0.040%), Immigrants from Ghana (41.8%, a difference of 0.11%), Immigrants from Belize (41.8%, a difference of 0.13%), Immigrants from Sudan (41.9%, a difference of 0.30%), and Immigrants from Bahamas (41.7%, a difference of 0.34%).
DemographicsRating | RankMarried-couple Households
Hondurans
0.0
/100
|
#290
Tragic
42.1%
Paiute
0.0
/100
|
#291
Tragic
42.1%
Indonesians
0.0
/100
|
#292
Tragic
42.0%
Menominee
0.0
/100
|
#293
Tragic
42.0%
Immigrants | Yemen
0.0
/100
|
#294
Tragic
42.0%
Kiowa
0.0
/100
|
#295
Tragic
42.0%
Immigrants | Sudan
0.0
/100
|
#296
Tragic
41.9%
Arapaho
0.0
/100
|
#297
Tragic
41.8%
Immigrants | Middle Africa
0.0
/100
|
#298
Tragic
41.8%
Immigrants | Ghana
0.0
/100
|
#299
Tragic
41.8%
Immigrants | Belize
0.0
/100
|
#300
Tragic
41.8%
Immigrants | Bahamas
0.0
/100
|
#301
Tragic
41.7%
Immigrants | Honduras
0.0
/100
|
#302
Tragic
41.6%
Sub-Saharan Africans
0.0
/100
|
#303
Tragic
41.6%
Immigrants | Guyana
0.0
/100
|
#304
Tragic
41.6%