Kenyan vs Austrian Married-couple Households
COMPARE
Kenyan
Austrian
Married-couple Households
Married-couple Households Comparison
Kenyans
Austrians
44.7%
MARRIED-COUPLE HOUSEHOLDS
1.7/ 100
METRIC RATING
228th/ 347
METRIC RANK
48.6%
MARRIED-COUPLE HOUSEHOLDS
99.3/ 100
METRIC RATING
55th/ 347
METRIC RANK
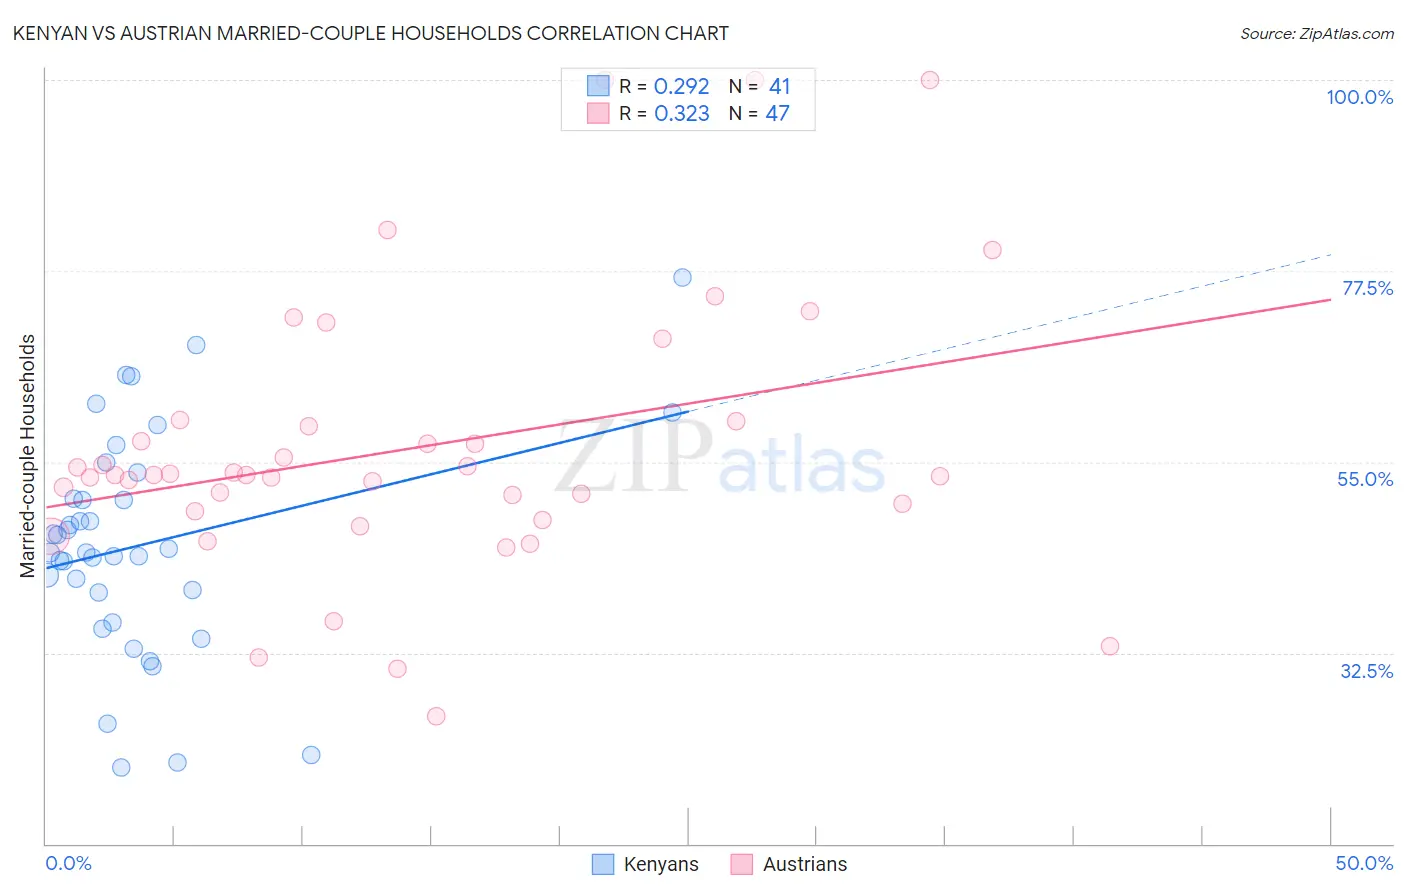
Kenyan vs Austrian Married-couple Households Correlation Chart
The statistical analysis conducted on geographies consisting of 168,165,214 people shows a weak positive correlation between the proportion of Kenyans and percentage of married-couple family households in the United States with a correlation coefficient (R) of 0.292 and weighted average of 44.7%. Similarly, the statistical analysis conducted on geographies consisting of 451,781,839 people shows a mild positive correlation between the proportion of Austrians and percentage of married-couple family households in the United States with a correlation coefficient (R) of 0.323 and weighted average of 48.6%, a difference of 8.8%.
Married-couple Households Correlation Summary
| Measurement | Kenyan | Austrian |
| Minimum | 18.9% | 25.0% |
| Maximum | 76.7% | 100.0% |
| Range | 57.7% | 75.0% |
| Mean | 45.3% | 56.7% |
| Median | 44.4% | 53.5% |
| Interquartile 25% (IQ1) | 37.8% | 49.2% |
| Interquartile 75% (IQ3) | 52.2% | 59.8% |
| Interquartile Range (IQR) | 14.4% | 10.6% |
| Standard Deviation (Sample) | 13.1% | 16.4% |
| Standard Deviation (Population) | 12.9% | 16.2% |
Similar Demographics by Married-couple Households
Demographics Similar to Kenyans by Married-couple Households
In terms of married-couple households, the demographic groups most similar to Kenyans are Immigrants from Latin America (44.7%, a difference of 0.050%), Soviet Union (44.6%, a difference of 0.090%), Houma (44.6%, a difference of 0.10%), Marshallese (44.6%, a difference of 0.10%), and Salvadoran (44.7%, a difference of 0.13%).
| Demographics | Rating | Rank | Married-couple Households |
| Tlingit-Haida | 4.9 /100 | #221 | Tragic 45.1% |
| Immigrants | Laos | 4.6 /100 | #222 | Tragic 45.1% |
| Immigrants | Cambodia | 2.7 /100 | #223 | Tragic 44.9% |
| Immigrants | Micronesia | 2.6 /100 | #224 | Tragic 44.9% |
| Dutch West Indians | 2.6 /100 | #225 | Tragic 44.9% |
| Alsatians | 2.3 /100 | #226 | Tragic 44.8% |
| Salvadorans | 1.9 /100 | #227 | Tragic 44.7% |
| Kenyans | 1.7 /100 | #228 | Tragic 44.7% |
| Immigrants | Latin America | 1.6 /100 | #229 | Tragic 44.7% |
| Soviet Union | 1.6 /100 | #230 | Tragic 44.6% |
| Houma | 1.5 /100 | #231 | Tragic 44.6% |
| Marshallese | 1.5 /100 | #232 | Tragic 44.6% |
| Immigrants | Uganda | 1.5 /100 | #233 | Tragic 44.6% |
| Immigrants | Panama | 1.3 /100 | #234 | Tragic 44.6% |
| Immigrants | Nicaragua | 1.2 /100 | #235 | Tragic 44.5% |
Demographics Similar to Austrians by Married-couple Households
In terms of married-couple households, the demographic groups most similar to Austrians are Immigrants from Northern Europe (48.6%, a difference of 0.0%), White/Caucasian (48.6%, a difference of 0.010%), Immigrants from Lithuania (48.6%, a difference of 0.010%), Irish (48.6%, a difference of 0.060%), and Polish (48.5%, a difference of 0.090%).
| Demographics | Rating | Rank | Married-couple Households |
| Indians (Asian) | 99.4 /100 | #48 | Exceptional 48.7% |
| Immigrants | Sri Lanka | 99.4 /100 | #49 | Exceptional 48.7% |
| Samoans | 99.4 /100 | #50 | Exceptional 48.7% |
| Eastern Europeans | 99.3 /100 | #51 | Exceptional 48.6% |
| Irish | 99.3 /100 | #52 | Exceptional 48.6% |
| Whites/Caucasians | 99.3 /100 | #53 | Exceptional 48.6% |
| Immigrants | Lithuania | 99.3 /100 | #54 | Exceptional 48.6% |
| Austrians | 99.3 /100 | #55 | Exceptional 48.6% |
| Immigrants | Northern Europe | 99.3 /100 | #56 | Exceptional 48.6% |
| Poles | 99.2 /100 | #57 | Exceptional 48.5% |
| Immigrants | Indonesia | 99.2 /100 | #58 | Exceptional 48.5% |
| Czechoslovakians | 99.2 /100 | #59 | Exceptional 48.5% |
| Croatians | 99.1 /100 | #60 | Exceptional 48.5% |
| Bulgarians | 99.1 /100 | #61 | Exceptional 48.5% |
| Luxembourgers | 99.1 /100 | #62 | Exceptional 48.5% |