Croatian Male Disability
COMPARE
Croatian
Select to Compare
Male Disability
Croatian Male Disability
11.8%
DISABILITY | MALES
2.1/ 100
METRIC RATING
230th/ 347
METRIC RANK
Croatian Male Disability Correlation Chart
The statistical analysis conducted on geographies consisting of 375,704,968 people shows a slight positive correlation between the proportion of Croatians and percentage of males with a disability in the United States with a correlation coefficient (R) of 0.090 and weighted average of 11.8%. On average, for every 1% (one percent) increase in Croatians within a typical geography, there is an increase of 0.064% in percentage of males with a disability.
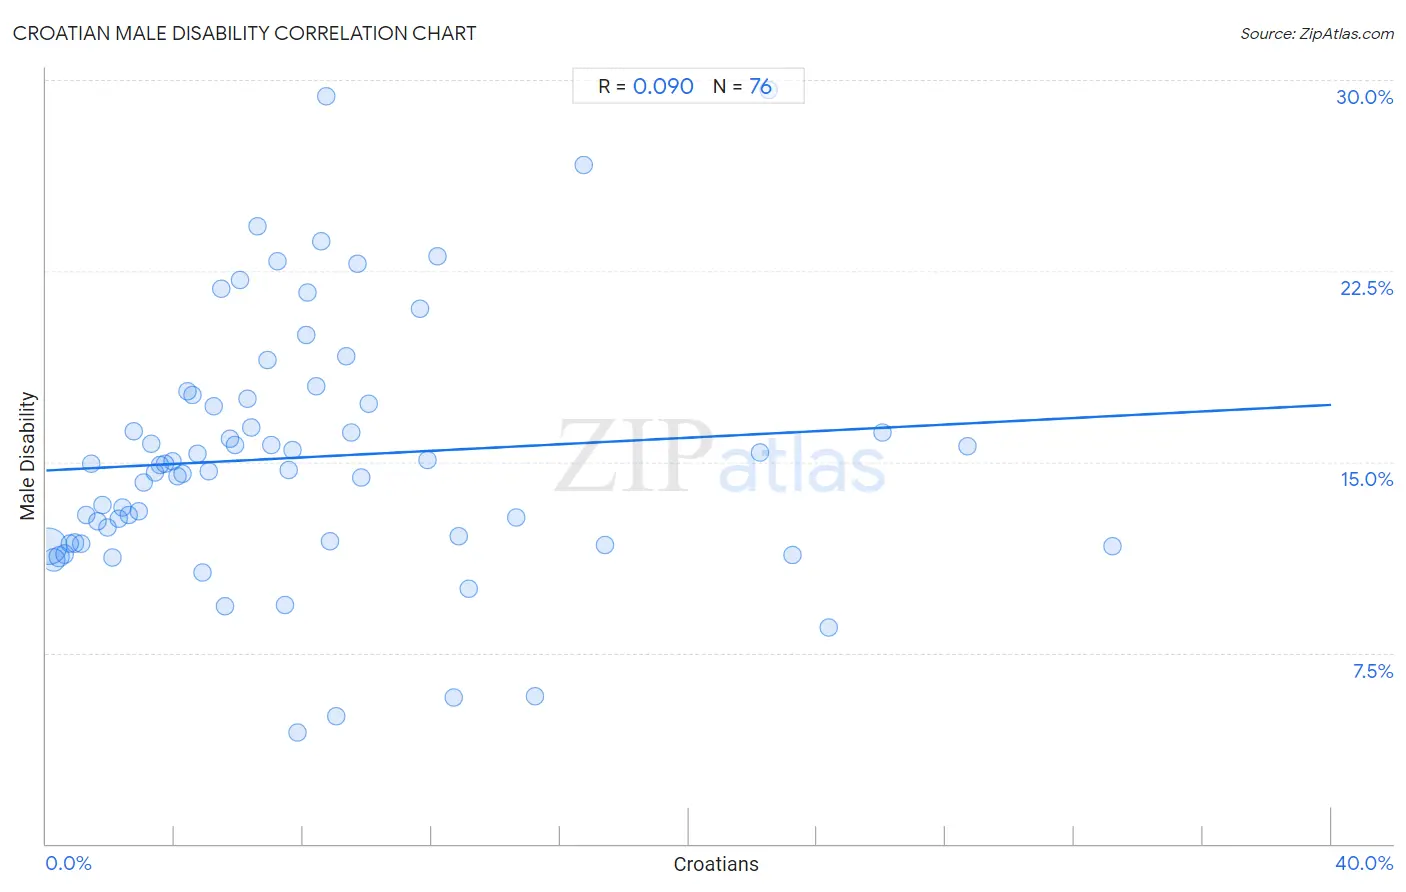
It is essential to understand that the correlation between the percentage of Croatians and percentage of males with a disability does not imply a direct cause-and-effect relationship. It remains uncertain whether the presence of Croatians influences an upward or downward trend in the level of percentage of males with a disability within an area, or if Croatians simply ended up residing in those areas with higher or lower levels of percentage of males with a disability due to other factors.
Demographics Similar to Croatians by Male Disability
In terms of male disability, the demographic groups most similar to Croatians are Bermudan (11.8%, a difference of 0.090%), Hispanic or Latino (11.8%, a difference of 0.12%), Austrian (11.8%, a difference of 0.20%), Dominican (11.8%, a difference of 0.20%), and Malaysian (11.8%, a difference of 0.26%).
| Demographics | Rating | Rank | Male Disability |
| Immigrants from Bahamas | 3.2 /100 | #223 | Tragic 11.7% |
| Japanese | 3.1 /100 | #224 | Tragic 11.7% |
| Liberians | 3.1 /100 | #225 | Tragic 11.8% |
| Sub-Saharan Africans | 2.8 /100 | #226 | Tragic 11.8% |
| Austrians | 2.5 /100 | #227 | Tragic 11.8% |
| Hispanics or Latinos | 2.3 /100 | #228 | Tragic 11.8% |
| Bermudans | 2.3 /100 | #229 | Tragic 11.8% |
| Croatians | 2.1 /100 | #230 | Tragic 11.8% |
| Dominicans | 1.8 /100 | #231 | Tragic 11.8% |
| Malaysians | 1.8 /100 | #232 | Tragic 11.8% |
| Mexicans | 1.7 /100 | #233 | Tragic 11.8% |
| Immigrants from Canada | 1.6 /100 | #234 | Tragic 11.9% |
| Immigrants from North America | 1.5 /100 | #235 | Tragic 11.9% |
| U.S. Virgin Islanders | 1.3 /100 | #236 | Tragic 11.9% |
| Carpatho Rusyns | 1.3 /100 | #237 | Tragic 11.9% |
Croatian Male Disability Correlation Summary
| Measurement | Croatian Data | Male Disability Data |
| Minimum | 0.073% | 4.4% |
| Maximum | 33.2% | 29.6% |
| Range | 33.1% | 25.2% |
| Mean | 8.0% | 15.2% |
| Median | 6.3% | 14.8% |
| Interquartile 25% (IQ1) | 3.1% | 11.8% |
| Interquartile 75% (IQ3) | 9.7% | 17.4% |
| Interquartile Range (IQR) | 6.6% | 5.6% |
| Standard Deviation (Sample) | 7.0% | 5.0% |
| Standard Deviation (Population) | 7.0% | 5.0% |
Correlation Details
| Croatian Percentile | Sample Size | Male Disability |
[ 0.0% - 0.5% ] 0.073% | 256,197,601 | 11.7% |
[ 0.0% - 0.5% ] 0.23% | 70,291,193 | 11.2% |
[ 0.0% - 0.5% ] 0.40% | 22,929,622 | 11.3% |
[ 0.5% - 1.0% ] 0.57% | 9,835,864 | 11.4% |
[ 0.5% - 1.0% ] 0.74% | 5,828,183 | 11.8% |
[ 0.5% - 1.0% ] 0.91% | 3,180,989 | 11.8% |
[ 1.0% - 1.5% ] 1.08% | 1,827,068 | 11.8% |
[ 1.0% - 1.5% ] 1.24% | 1,037,545 | 12.9% |
[ 1.0% - 1.5% ] 1.40% | 661,472 | 14.9% |
[ 1.5% - 2.0% ] 1.58% | 548,921 | 12.7% |
[ 1.5% - 2.0% ] 1.75% | 639,448 | 13.3% |
[ 1.5% - 2.0% ] 1.91% | 516,684 | 12.4% |
[ 2.0% - 2.5% ] 2.07% | 364,273 | 11.3% |
[ 2.0% - 2.5% ] 2.24% | 373,236 | 12.7% |
[ 2.0% - 2.5% ] 2.39% | 334,179 | 13.2% |
[ 2.5% - 3.0% ] 2.58% | 168,497 | 12.9% |
[ 2.5% - 3.0% ] 2.71% | 113,580 | 16.2% |
[ 2.5% - 3.0% ] 2.89% | 168,996 | 13.0% |
[ 3.0% - 3.5% ] 3.03% | 127,954 | 14.2% |
[ 3.0% - 3.5% ] 3.26% | 31,699 | 15.7% |
[ 3.0% - 3.5% ] 3.39% | 67,822 | 14.6% |
[ 3.5% - 4.0% ] 3.56% | 41,701 | 14.9% |
[ 3.5% - 4.0% ] 3.71% | 83,505 | 14.9% |
[ 3.5% - 4.0% ] 3.92% | 20,779 | 15.0% |
[ 4.0% - 4.5% ] 4.08% | 31,818 | 14.4% |
[ 4.0% - 4.5% ] 4.23% | 115,319 | 14.5% |
[ 4.0% - 4.5% ] 4.41% | 9,580 | 17.8% |
[ 4.5% - 5.0% ] 4.54% | 16,263 | 17.6% |
[ 4.5% - 5.0% ] 4.71% | 10,344 | 15.3% |
[ 4.5% - 5.0% ] 4.88% | 8,704 | 10.7% |
[ 5.0% - 5.5% ] 5.07% | 4,797 | 14.6% |
[ 5.0% - 5.5% ] 5.19% | 14,553 | 17.2% |
[ 5.0% - 5.5% ] 5.44% | 2,943 | 21.8% |
[ 5.5% - 6.0% ] 5.58% | 29,415 | 9.3% |
[ 5.5% - 6.0% ] 5.73% | 7,942 | 15.9% |
[ 5.5% - 6.0% ] 5.86% | 11,015 | 15.6% |
[ 6.0% - 6.5% ] 6.03% | 5,767 | 22.1% |
[ 6.0% - 6.5% ] 6.26% | 3,307 | 17.5% |
[ 6.0% - 6.5% ] 6.39% | 3,223 | 16.4% |
[ 6.5% - 7.0% ] 6.57% | 731 | 24.3% |
[ 6.5% - 7.0% ] 6.89% | 5,226 | 19.0% |
[ 7.0% - 7.5% ] 7.00% | 9,094 | 15.6% |
[ 7.0% - 7.5% ] 7.21% | 652 | 22.9% |
[ 7.0% - 7.5% ] 7.43% | 2,019 | 9.4% |
[ 7.5% - 8.0% ] 7.57% | 1,731 | 14.7% |
[ 7.5% - 8.0% ] 7.68% | 612 | 15.5% |
[ 7.5% - 8.0% ] 7.83% | 1,251 | 4.4% |
[ 8.0% - 8.5% ] 8.10% | 1,494 | 20.0% |
[ 8.0% - 8.5% ] 8.14% | 172 | 21.6% |
[ 8.0% - 8.5% ] 8.42% | 1,164 | 18.0% |
[ 8.5% - 9.0% ] 8.56% | 397 | 23.7% |
[ 8.5% - 9.0% ] 8.72% | 447 | 29.3% |
[ 8.5% - 9.0% ] 8.82% | 204 | 11.9% |
[ 9.0% - 9.5% ] 9.03% | 299 | 5.0% |
[ 9.0% - 9.5% ] 9.35% | 492 | 19.2% |
[ 9.0% - 9.5% ] 9.50% | 1,674 | 16.2% |
[ 9.5% - 10.0% ] 9.68% | 589 | 22.8% |
[ 9.5% - 10.0% ] 9.82% | 1,181 | 14.4% |
[ 10.0% - 10.5% ] 10.02% | 409 | 17.3% |
[ 11.5% - 12.0% ] 11.62% | 912 | 21.0% |
[ 11.5% - 12.0% ] 11.87% | 396 | 15.1% |
[ 12.0% - 12.5% ] 12.16% | 148 | 23.1% |
[ 12.5% - 13.0% ] 12.67% | 1,318 | 5.7% |
[ 12.5% - 13.0% ] 12.85% | 358 | 12.1% |
[ 13.0% - 13.5% ] 13.16% | 38 | 10.0% |
[ 14.5% - 15.0% ] 14.62% | 253 | 12.8% |
[ 15.0% - 15.5% ] 15.23% | 348 | 5.8% |
[ 16.5% - 17.0% ] 16.74% | 1,111 | 26.7% |
[ 17.0% - 17.5% ] 17.41% | 1,252 | 11.7% |
[ 22.0% - 22.5% ] 22.22% | 18 | 15.4% |
[ 22.0% - 22.5% ] 22.49% | 369 | 29.6% |
[ 23.0% - 23.5% ] 23.25% | 985 | 11.3% |
[ 24.0% - 24.5% ] 24.36% | 312 | 8.5% |
[ 26.0% - 26.5% ] 26.04% | 672 | 16.1% |
[ 28.5% - 29.0% ] 28.69% | 610 | 15.6% |
[ 33.0% - 33.5% ] 33.19% | 229 | 11.7% |