Alsatian Male Disability
COMPARE
Alsatian
Select to Compare
Male Disability
Alsatian Male Disability
11.7%
DISABILITY | MALES
3.3/ 100
METRIC RATING
222nd/ 347
METRIC RANK
Alsatian Male Disability Correlation Chart
The statistical analysis conducted on geographies consisting of 82,682,247 people shows a poor negative correlation between the proportion of Alsatians and percentage of males with a disability in the United States with a correlation coefficient (R) of -0.171 and weighted average of 11.7%. On average, for every 1% (one percent) increase in Alsatians within a typical geography, there is a decrease of 0.35% in percentage of males with a disability.
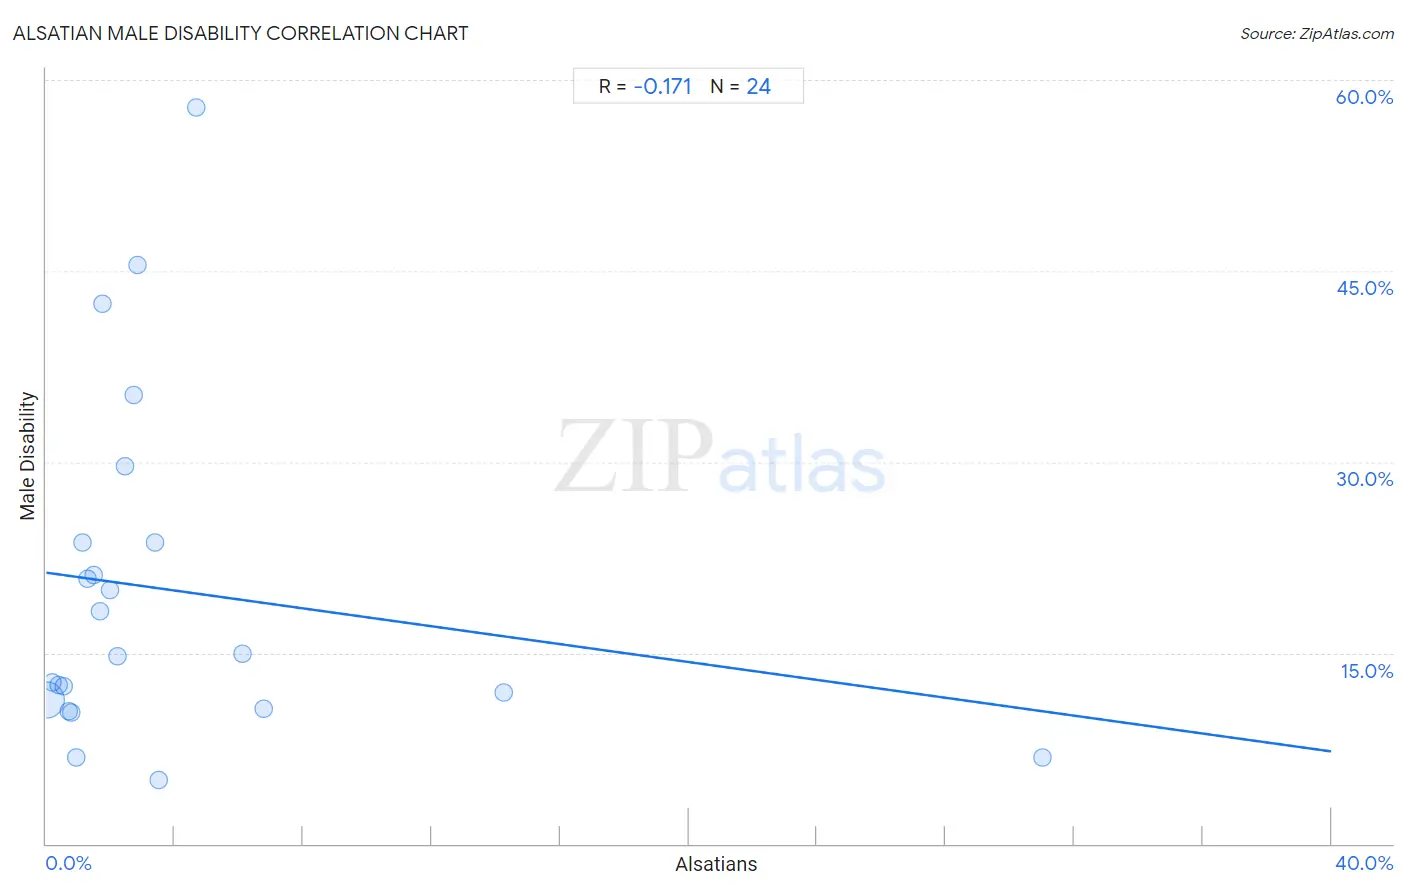
It is essential to understand that the correlation between the percentage of Alsatians and percentage of males with a disability does not imply a direct cause-and-effect relationship. It remains uncertain whether the presence of Alsatians influences an upward or downward trend in the level of percentage of males with a disability within an area, or if Alsatians simply ended up residing in those areas with higher or lower levels of percentage of males with a disability due to other factors.
Demographics Similar to Alsatians by Male Disability
In terms of male disability, the demographic groups most similar to Alsatians are Immigrants from Bahamas (11.7%, a difference of 0.080%), Japanese (11.7%, a difference of 0.11%), Liberian (11.8%, a difference of 0.12%), Immigrants from Congo (11.7%, a difference of 0.15%), and Panamanian (11.7%, a difference of 0.17%).
| Demographics | Rating | Rank | Male Disability |
| Indonesians | 5.9 /100 | #215 | Tragic 11.6% |
| Immigrants from Dominican Republic | 4.9 /100 | #216 | Tragic 11.7% |
| Immigrants from Dominica | 4.6 /100 | #217 | Tragic 11.7% |
| Immigrants from England | 4.0 /100 | #218 | Tragic 11.7% |
| Panamanians | 3.8 /100 | #219 | Tragic 11.7% |
| Immigrants from Western Europe | 3.8 /100 | #220 | Tragic 11.7% |
| Immigrants from Congo | 3.7 /100 | #221 | Tragic 11.7% |
| Alsatians | 3.3 /100 | #222 | Tragic 11.7% |
| Immigrants from Bahamas | 3.2 /100 | #223 | Tragic 11.7% |
| Japanese | 3.1 /100 | #224 | Tragic 11.7% |
| Liberians | 3.1 /100 | #225 | Tragic 11.8% |
| Sub-Saharan Africans | 2.8 /100 | #226 | Tragic 11.8% |
| Austrians | 2.5 /100 | #227 | Tragic 11.8% |
| Hispanics or Latinos | 2.3 /100 | #228 | Tragic 11.8% |
| Bermudans | 2.3 /100 | #229 | Tragic 11.8% |
Alsatian Male Disability Correlation Summary
| Measurement | Alsatian Data | Male Disability Data |
| Minimum | 0.016% | 5.0% |
| Maximum | 31.0% | 57.8% |
| Range | 31.0% | 52.8% |
| Mean | 3.9% | 19.9% |
| Median | 1.9% | 14.9% |
| Interquartile 25% (IQ1) | 0.87% | 10.9% |
| Interquartile 75% (IQ3) | 3.5% | 23.6% |
| Interquartile Range (IQR) | 2.6% | 12.7% |
| Standard Deviation (Sample) | 6.5% | 13.4% |
| Standard Deviation (Population) | 6.4% | 13.1% |
Correlation Details
| Alsatian Percentile | Sample Size | Male Disability |
[ 0.0% - 0.5% ] 0.016% | 81,406,856 | 11.3% |
[ 0.0% - 0.5% ] 0.20% | 928,029 | 12.7% |
[ 0.0% - 0.5% ] 0.38% | 113,092 | 12.5% |
[ 0.5% - 1.0% ] 0.56% | 119,006 | 12.4% |
[ 0.5% - 1.0% ] 0.72% | 32,091 | 10.4% |
[ 0.5% - 1.0% ] 0.79% | 42,079 | 10.3% |
[ 0.5% - 1.0% ] 0.95% | 5,784 | 6.8% |
[ 1.0% - 1.5% ] 1.15% | 262 | 23.6% |
[ 1.0% - 1.5% ] 1.29% | 4,355 | 20.8% |
[ 1.0% - 1.5% ] 1.47% | 2,792 | 21.1% |
[ 1.5% - 2.0% ] 1.65% | 5,440 | 18.3% |
[ 1.5% - 2.0% ] 1.75% | 1,604 | 42.4% |
[ 1.5% - 2.0% ] 1.97% | 1,017 | 20.0% |
[ 2.0% - 2.5% ] 2.23% | 1,573 | 14.8% |
[ 2.0% - 2.5% ] 2.47% | 243 | 29.6% |
[ 2.5% - 3.0% ] 2.73% | 1,321 | 35.3% |
[ 2.5% - 3.0% ] 2.86% | 70 | 45.5% |
[ 3.0% - 3.5% ] 3.39% | 827 | 23.7% |
[ 3.5% - 4.0% ] 3.52% | 1,848 | 5.0% |
[ 4.5% - 5.0% ] 4.67% | 707 | 57.8% |
[ 6.0% - 6.5% ] 6.11% | 2,994 | 15.0% |
[ 6.5% - 7.0% ] 6.77% | 9,202 | 10.6% |
[ 14.0% - 14.5% ] 14.25% | 723 | 11.9% |
[ 31.0% - 31.5% ] 31.02% | 332 | 6.8% |