Scotch-Irish Male Disability
COMPARE
Scotch-Irish
Select to Compare
Male Disability
Scotch-Irish Male Disability
13.2%
DISABILITY | MALES
0.0/ 100
METRIC RATING
303rd/ 347
METRIC RANK
Scotch-Irish Male Disability Correlation Chart
The statistical analysis conducted on geographies consisting of 548,574,277 people shows a moderate positive correlation between the proportion of Scotch-Irish and percentage of males with a disability in the United States with a correlation coefficient (R) of 0.478 and weighted average of 13.2%. On average, for every 1% (one percent) increase in Scotch-Irish within a typical geography, there is an increase of 0.31% in percentage of males with a disability.
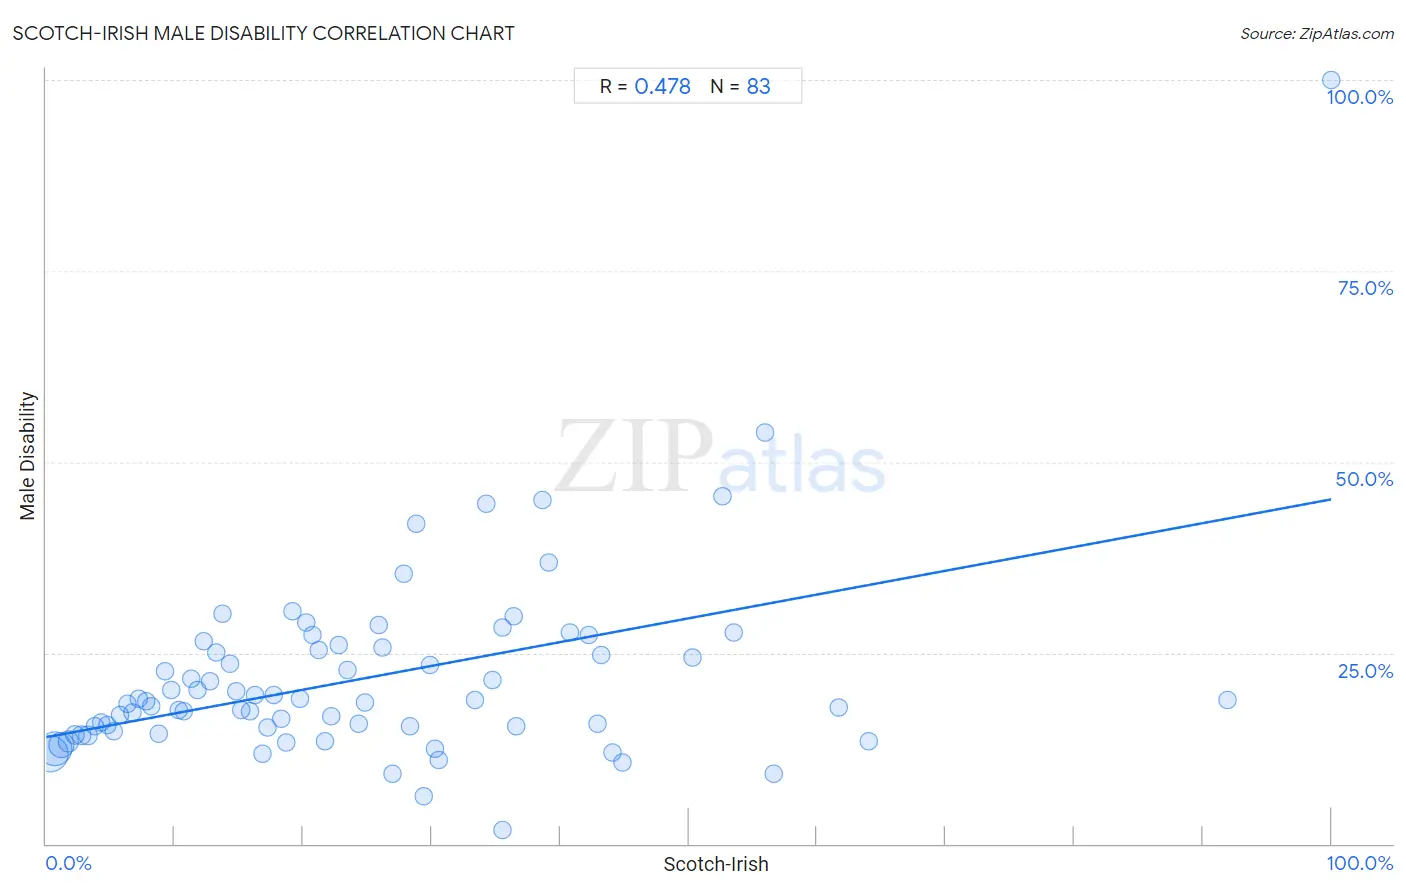
It is essential to understand that the correlation between the percentage of Scotch-Irish and percentage of males with a disability does not imply a direct cause-and-effect relationship. It remains uncertain whether the presence of Scotch-Irish influences an upward or downward trend in the level of percentage of males with a disability within an area, or if Scotch-Irish simply ended up residing in those areas with higher or lower levels of percentage of males with a disability due to other factors.
Demographics Similar to Scotch-Irish by Male Disability
In terms of male disability, the demographic groups most similar to Scotch-Irish are Black/African American (13.2%, a difference of 0.32%), Crow (13.1%, a difference of 0.54%), French Canadian (13.3%, a difference of 0.74%), Spanish American (13.3%, a difference of 0.94%), and French (13.0%, a difference of 1.1%).
| Demographics | Rating | Rank | Male Disability |
| Nonimmigrants | 0.0 /100 | #296 | Tragic 12.9% |
| Inupiat | 0.0 /100 | #297 | Tragic 13.0% |
| Pennsylvania Germans | 0.0 /100 | #298 | Tragic 13.0% |
| Celtics | 0.0 /100 | #299 | Tragic 13.0% |
| Cheyenne | 0.0 /100 | #300 | Tragic 13.0% |
| French | 0.0 /100 | #301 | Tragic 13.0% |
| Crow | 0.0 /100 | #302 | Tragic 13.1% |
| Scotch-Irish | 0.0 /100 | #303 | Tragic 13.2% |
| Blacks/African Americans | 0.0 /100 | #304 | Tragic 13.2% |
| French Canadians | 0.0 /100 | #305 | Tragic 13.3% |
| Spanish Americans | 0.0 /100 | #306 | Tragic 13.3% |
| Arapaho | 0.0 /100 | #307 | Tragic 13.3% |
| French American Indians | 0.0 /100 | #308 | Tragic 13.4% |
| Blackfeet | 0.0 /100 | #309 | Tragic 13.4% |
| Immigrants from the Azores | 0.0 /100 | #310 | Tragic 13.4% |
Scotch-Irish Male Disability Correlation Summary
| Measurement | Scotch-Irish Data | Male Disability Data |
| Minimum | 0.25% | 1.8% |
| Maximum | 100.0% | 100.0% |
| Range | 99.7% | 98.2% |
| Mean | 24.7% | 21.6% |
| Median | 20.7% | 18.6% |
| Interquartile 25% (IQ1) | 10.3% | 14.8% |
| Interquartile 75% (IQ3) | 35.5% | 25.6% |
| Interquartile Range (IQR) | 25.2% | 10.9% |
| Standard Deviation (Sample) | 19.4% | 12.6% |
| Standard Deviation (Population) | 19.3% | 12.6% |
Correlation Details
| Scotch-Irish Percentile | Sample Size | Male Disability |
[ 0.0% - 0.5% ] 0.25% | 210,760,876 | 11.8% |
[ 0.5% - 1.0% ] 0.72% | 183,260,124 | 12.4% |
[ 1.0% - 1.5% ] 1.21% | 82,704,691 | 12.9% |
[ 1.5% - 2.0% ] 1.72% | 36,468,332 | 13.4% |
[ 2.0% - 2.5% ] 2.21% | 15,892,319 | 14.2% |
[ 2.5% - 3.0% ] 2.73% | 7,863,530 | 14.2% |
[ 3.0% - 3.5% ] 3.23% | 5,131,073 | 14.2% |
[ 3.5% - 4.0% ] 3.75% | 2,458,403 | 15.4% |
[ 4.0% - 4.5% ] 4.25% | 1,273,258 | 15.9% |
[ 4.5% - 5.0% ] 4.76% | 747,501 | 15.5% |
[ 5.0% - 5.5% ] 5.23% | 642,133 | 14.8% |
[ 5.5% - 6.0% ] 5.71% | 325,039 | 16.9% |
[ 6.0% - 6.5% ] 6.29% | 210,333 | 18.3% |
[ 6.5% - 7.0% ] 6.71% | 139,832 | 17.2% |
[ 7.0% - 7.5% ] 7.23% | 120,353 | 19.1% |
[ 7.5% - 8.0% ] 7.79% | 112,317 | 18.6% |
[ 8.0% - 8.5% ] 8.22% | 75,851 | 18.1% |
[ 8.5% - 9.0% ] 8.75% | 59,942 | 14.3% |
[ 9.0% - 9.5% ] 9.25% | 40,212 | 22.6% |
[ 9.5% - 10.0% ] 9.76% | 38,844 | 20.1% |
[ 10.0% - 10.5% ] 10.27% | 39,275 | 17.5% |
[ 10.5% - 11.0% ] 10.70% | 26,696 | 17.3% |
[ 11.0% - 11.5% ] 11.24% | 19,949 | 21.5% |
[ 11.5% - 12.0% ] 11.80% | 17,598 | 20.1% |
[ 12.0% - 12.5% ] 12.23% | 8,677 | 26.5% |
[ 12.5% - 13.0% ] 12.75% | 5,049 | 21.3% |
[ 13.0% - 13.5% ] 13.22% | 19,027 | 25.0% |
[ 13.5% - 14.0% ] 13.70% | 16,987 | 30.2% |
[ 14.0% - 14.5% ] 14.25% | 16,160 | 23.5% |
[ 14.5% - 15.0% ] 14.83% | 3,568 | 19.9% |
[ 15.0% - 15.5% ] 15.17% | 6,528 | 17.6% |
[ 15.5% - 16.0% ] 15.85% | 5,437 | 17.4% |
[ 16.0% - 16.5% ] 16.20% | 10,859 | 19.5% |
[ 16.5% - 17.0% ] 16.81% | 5,104 | 11.7% |
[ 17.0% - 17.5% ] 17.25% | 7,912 | 15.2% |
[ 17.5% - 18.0% ] 17.66% | 9,569 | 19.4% |
[ 18.0% - 18.5% ] 18.30% | 2,300 | 16.3% |
[ 18.5% - 19.0% ] 18.65% | 2,970 | 13.2% |
[ 19.0% - 19.5% ] 19.13% | 993 | 30.5% |
[ 19.5% - 20.0% ] 19.73% | 1,171 | 19.0% |
[ 20.0% - 20.5% ] 20.26% | 770 | 28.9% |
[ 20.5% - 21.0% ] 20.73% | 2,865 | 27.3% |
[ 21.0% - 21.5% ] 21.24% | 1,356 | 25.4% |
[ 21.5% - 22.0% ] 21.71% | 1,773 | 13.5% |
[ 22.0% - 22.5% ] 22.22% | 18 | 16.7% |
[ 22.5% - 23.0% ] 22.77% | 1,458 | 26.0% |
[ 23.0% - 23.5% ] 23.48% | 903 | 22.7% |
[ 24.0% - 24.5% ] 24.34% | 226 | 15.7% |
[ 24.5% - 25.0% ] 24.85% | 1,827 | 18.5% |
[ 25.5% - 26.0% ] 25.83% | 724 | 28.7% |
[ 26.0% - 26.5% ] 26.16% | 237 | 25.6% |
[ 26.5% - 27.0% ] 26.91% | 431 | 9.1% |
[ 27.5% - 28.0% ] 27.85% | 237 | 35.3% |
[ 28.0% - 28.5% ] 28.26% | 92 | 15.4% |
[ 28.5% - 29.0% ] 28.81% | 361 | 41.9% |
[ 29.0% - 29.5% ] 29.40% | 500 | 6.2% |
[ 29.5% - 30.0% ] 29.86% | 807 | 23.4% |
[ 30.0% - 30.5% ] 30.26% | 3,024 | 12.5% |
[ 30.5% - 31.0% ] 30.57% | 386 | 11.0% |
[ 33.0% - 33.5% ] 33.33% | 36 | 18.8% |
[ 34.0% - 34.5% ] 34.26% | 683 | 44.6% |
[ 34.5% - 35.0% ] 34.73% | 357 | 21.5% |
[ 35.0% - 35.5% ] 35.46% | 141 | 28.3% |
[ 35.5% - 36.0% ] 35.54% | 166 | 1.8% |
[ 36.0% - 36.5% ] 36.40% | 728 | 29.8% |
[ 36.5% - 37.0% ] 36.53% | 605 | 15.4% |
[ 38.5% - 39.0% ] 38.61% | 101 | 44.9% |
[ 39.0% - 39.5% ] 39.08% | 87 | 36.8% |
[ 40.5% - 41.0% ] 40.78% | 103 | 27.6% |
[ 42.0% - 42.5% ] 42.19% | 64 | 27.3% |
[ 42.5% - 43.0% ] 42.86% | 35 | 15.8% |
[ 43.0% - 43.5% ] 43.17% | 556 | 24.8% |
[ 44.0% - 44.5% ] 44.08% | 338 | 11.9% |
[ 44.5% - 45.0% ] 44.84% | 339 | 10.6% |
[ 50.0% - 50.5% ] 50.34% | 149 | 24.4% |
[ 52.5% - 53.0% ] 52.63% | 38 | 45.5% |
[ 53.5% - 54.0% ] 53.51% | 299 | 27.7% |
[ 55.5% - 56.0% ] 55.93% | 59 | 53.8% |
[ 56.5% - 57.0% ] 56.63% | 83 | 9.1% |
[ 61.5% - 62.0% ] 61.67% | 60 | 17.8% |
[ 64.0% - 64.5% ] 64.00% | 175 | 13.5% |
[ 91.5% - 92.0% ] 91.89% | 222 | 18.8% |
[ 99.5% - 100.0% ] 100.00% | 66 | 100.0% |