New Zealander Male Disability

COMPARE

New Zealander
Race
Ancestry
AfghanAfricanAlaska NativeAlaskan AthabascanAlbanianAleutAlsatianAmericanApacheArabArapahoArgentineanArmenianAssyrian/Chaldean/SyriacAustralianAustrianBahamianBangladeshiBarbadianBasqueBelgianBelizeanBermudanBhutaneseBlackfeetBolivianBrazilianBritishBritish West IndianBulgarianBurmeseCajunCambodianCanadianCape VerdeanCarpatho RusynCelticCentral AmericanCentral American IndianCherokeeCheyenneChickasawChileanChineseChippewaChoctawColombianColvilleComancheCosta RicanCreeCreekCroatianCrowCubanCypriotCzechCzechoslovakianDanishDelawareDominicanDutchDutch West IndianEastern EuropeanEcuadorianEgyptianEnglishEstonianEthiopianEuropeanFijianFilipinoFinnishFrenchFrench American IndianFrench CanadianGermanGerman RussianGhanaianGreekGuamanian/ChamorroGuatemalanGuyaneseHaitianHmongHonduranHopiHoumaHungarianIcelanderIndian (Asian)IndonesianInupiatIranianIraqiIrishIroquoisIsraeliItalianJamaicanJapaneseJordanianKenyanKiowaKoreanLaotianLatvianLebaneseLiberianLithuanianLumbeeLuxembourgerMacedonianMalaysianMalteseMarshalleseMenomineeMexicanMexican American IndianMongolianMoroccanNative HawaiianNavajoNepaleseNew ZealanderNicaraguanNigerianNorthern EuropeanNorwegianOkinawanOsageOttawaPaiutePakistaniPalestinianPanamanianParaguayanPennsylvania GermanPeruvianPimaPolishPortuguesePotawatomiPuebloPuerto RicanPuget Sound SalishRomanianRussianSalvadoranSamoanScandinavianScotch-IrishScottishSeminoleSenegaleseSerbianShoshoneSierra LeoneanSiouxSlavicSlovakSloveneSomaliSouth AfricanSouth AmericanSouth American IndianSoviet UnionSpaniardSpanishSpanish AmericanSpanish American IndianSri LankanSubsaharan AfricanSudaneseSwedishSwissSyrianTaiwaneseThaiTlingit-HaidaTohono O'OdhamTonganTrinidadian and TobagonianTsimshianTurkishU.S. Virgin IslanderUgandanUkrainianUruguayanUteVenezuelanVietnameseWelshWest IndianYakamaYaquiYugoslavianYumanYup'ikZimbabwean
Immigration
NonimmigrantsImmigrantsAfghanistanAfricaAlbaniaArgentinaArmeniaAsiaAustraliaAustriaBahamasBangladeshBarbadosBelarusBelgiumBelizeBoliviaBosnia and HerzegovinaBrazilBulgariaBurma/MyanmarCabo VerdeCambodiaCameroonCanadaCaribbeanCentral AmericaChileChinaColombiaCongoCosta RicaCroatiaCubaCzechoslovakiaDenmarkDominicaDominican RepublicEastern AfricaEastern AsiaEastern EuropeEcuadorEgyptEl SalvadorEnglandEritreaEthiopiaEuropeFijiFranceGermanyGhanaGreeceGrenadaGuatemalaGuyanaHaitiHondurasHong KongHungaryIndiaIndonesiaIranIraqIrelandIsraelItalyJamaicaJapanJordanKazakhstanKenyaKoreaKuwaitLaosLatin AmericaLatviaLebanonLiberiaLithuaniaMalaysiaMexicoMicronesiaMiddle AfricaMoldovaMoroccoNepalNetherlandsNicaraguaNigeriaNorth AmericaNorth MacedoniaNorthern AfricaNorthern EuropeNorwayOceaniaPakistanPanamaPeruPhilippinesPolandPortugalRomaniaRussiaSaudi ArabiaScotlandSenegalSerbiaSierra LeoneSingaporeSomaliaSouth AfricaSouth AmericaSouth Central AsiaSouth Eastern AsiaSouthern EuropeSpainSri LankaSt. Vincent and the GrenadinesSudanSwedenSwitzerlandSyriaTaiwanThailandTrinidad and TobagoTurkeyUgandaUkraineUruguayUzbekistanVenezuelaVietnamWest IndiesWestern AfricaWestern AsiaWestern EuropeYemenZaireZimbabweAzores
Select to Compare
Race
Ancestry
AfghanAfricanAlaska NativeAlaskan AthabascanAlbanianAleutAlsatianAmericanApacheArabArapahoArgentineanArmenianAssyrian/Chaldean/SyriacAustralianAustrianBahamianBangladeshiBarbadianBasqueBelgianBelizeanBermudanBhutaneseBlackfeetBolivianBrazilianBritishBritish West IndianBulgarianBurmeseCajunCambodianCanadianCape VerdeanCarpatho RusynCelticCentral AmericanCentral American IndianCherokeeCheyenneChickasawChileanChineseChippewaChoctawColombianColvilleComancheCosta RicanCreeCreekCroatianCrowCubanCypriotCzechCzechoslovakianDanishDelawareDominicanDutchDutch West IndianEastern EuropeanEcuadorianEgyptianEnglishEstonianEthiopianEuropeanFijianFilipinoFinnishFrenchFrench American IndianFrench CanadianGermanGerman RussianGhanaianGreekGuamanian/ChamorroGuatemalanGuyaneseHaitianHmongHonduranHopiHoumaHungarianIcelanderIndian (Asian)IndonesianInupiatIranianIraqiIrishIroquoisIsraeliItalianJamaicanJapaneseJordanianKenyanKiowaKoreanLaotianLatvianLebaneseLiberianLithuanianLumbeeLuxembourgerMacedonianMalaysianMalteseMarshalleseMenomineeMexicanMexican American IndianMongolianMoroccanNative HawaiianNavajoNepaleseNicaraguanNigerianNorthern EuropeanNorwegianOkinawanOsageOttawaPaiutePakistaniPalestinianPanamanianParaguayanPennsylvania GermanPeruvianPimaPolishPortuguesePotawatomiPuebloPuerto RicanPuget Sound SalishRomanianRussianSalvadoranSamoanScandinavianScotch-IrishScottishSeminoleSenegaleseSerbianShoshoneSierra LeoneanSiouxSlavicSlovakSloveneSomaliSouth AfricanSouth AmericanSouth American IndianSoviet UnionSpaniardSpanishSpanish AmericanSpanish American IndianSri LankanSubsaharan AfricanSudaneseSwedishSwissSyrianTaiwaneseThaiTlingit-HaidaTohono O'OdhamTonganTrinidadian and TobagonianTsimshianTurkishU.S. Virgin IslanderUgandanUkrainianUruguayanUteVenezuelanVietnameseWelshWest IndianYakamaYaquiYugoslavianYumanYup'ikZimbabwean
Immigration
NonimmigrantsImmigrantsAfghanistanAfricaAlbaniaArgentinaArmeniaAsiaAustraliaAustriaBahamasBangladeshBarbadosBelarusBelgiumBelizeBoliviaBosnia and HerzegovinaBrazilBulgariaBurma/MyanmarCabo VerdeCambodiaCameroonCanadaCaribbeanCentral AmericaChileChinaColombiaCongoCosta RicaCroatiaCubaCzechoslovakiaDenmarkDominicaDominican RepublicEastern AfricaEastern AsiaEastern EuropeEcuadorEgyptEl SalvadorEnglandEritreaEthiopiaEuropeFijiFranceGermanyGhanaGreeceGrenadaGuatemalaGuyanaHaitiHondurasHong KongHungaryIndiaIndonesiaIranIraqIrelandIsraelItalyJamaicaJapanJordanKazakhstanKenyaKoreaKuwaitLaosLatin AmericaLatviaLebanonLiberiaLithuaniaMalaysiaMexicoMicronesiaMiddle AfricaMoldovaMoroccoNepalNetherlandsNicaraguaNigeriaNorth AmericaNorth MacedoniaNorthern AfricaNorthern EuropeNorwayOceaniaPakistanPanamaPeruPhilippinesPolandPortugalRomaniaRussiaSaudi ArabiaScotlandSenegalSerbiaSierra LeoneSingaporeSomaliaSouth AfricaSouth AmericaSouth Central AsiaSouth Eastern AsiaSouthern EuropeSpainSri LankaSt. Vincent and the GrenadinesSudanSwedenSwitzerlandSyriaTaiwanThailandTrinidad and TobagoTurkeyUgandaUkraineUruguayUzbekistanVenezuelaVietnamWest IndiesWestern AfricaWestern AsiaWestern EuropeYemenZaireZimbabweAzores
Male Disability
Income
Poverty
Unemployment
Labor Participation
Family Structure
Vehicle Availability
Education Level
Disability

New Zealander Male Disability
Average

11.2%
DISABILITY | MALES
52.9/ 100
METRIC RATING
170th/ 347
METRIC RANK

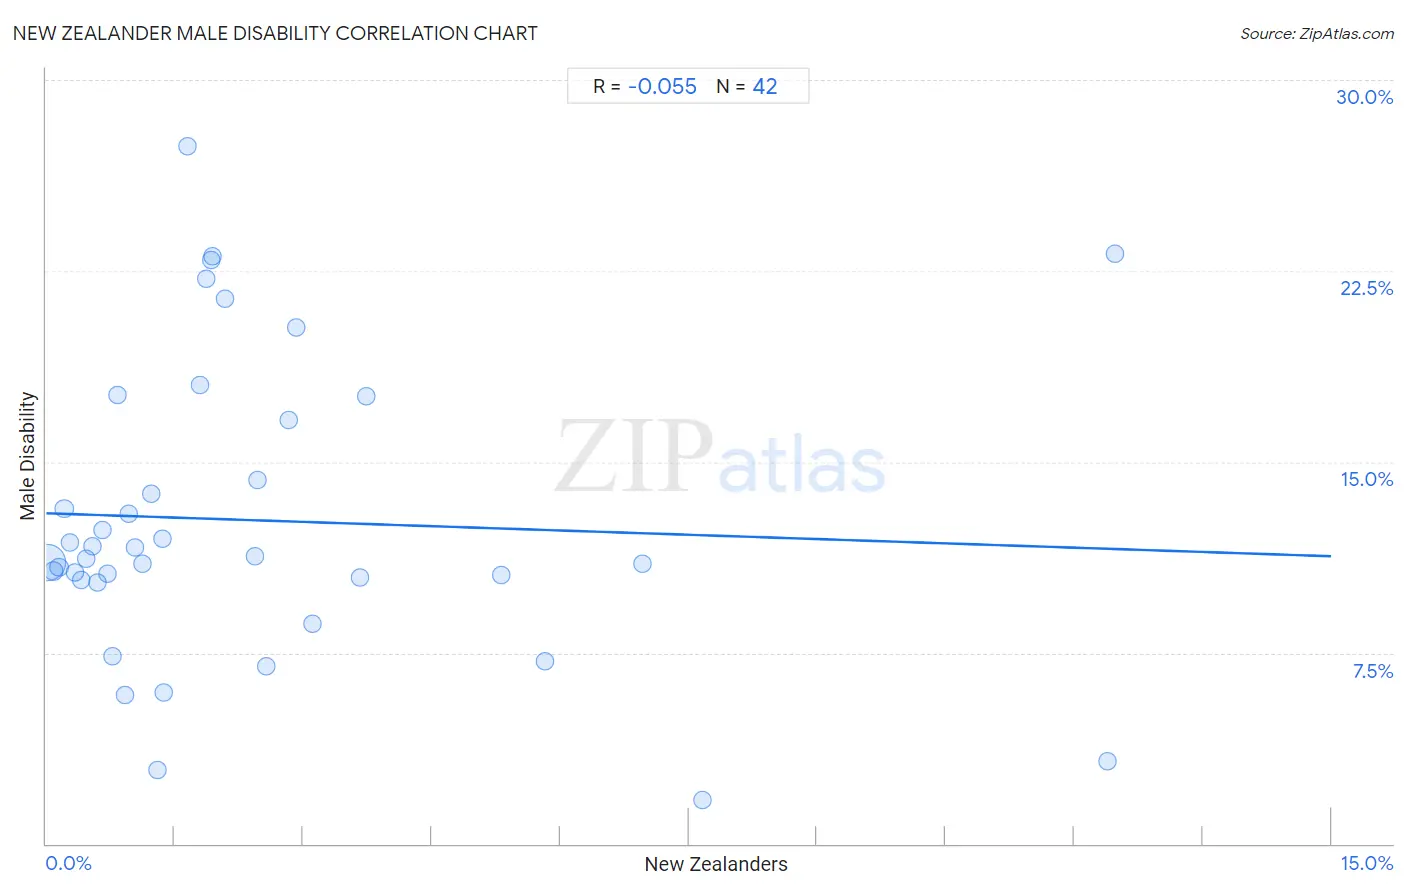
New Zealander Male Disability Correlation Chart

The statistical analysis conducted on geographies consisting of 106,918,286 people shows a slight negative correlation between the proportion of New Zealanders and percentage of males with a disability in the United States with a correlation coefficient (R) of -0.055 and weighted average of 11.2%. On average, for every 1% (one percent) increase in New Zealanders within a typical geography, there is a decrease of 0.11% in percentage of males with a disability.
New Zealander Male Disability
It is essential to understand that the correlation between the percentage of New Zealanders and percentage of males with a disability does not imply a direct cause-and-effect relationship. It remains uncertain whether the presence of New Zealanders influences an upward or downward trend in the level of percentage of males with a disability within an area, or if New Zealanders simply ended up residing in those areas with higher or lower levels of percentage of males with a disability due to other factors.

Demographics Similar to New Zealanders by Male Disability

In terms of male disability, the demographic groups most similar to New Zealanders are Haitian (11.2%, a difference of 0.020%), Barbadian (11.2%, a difference of 0.030%), Immigrants from Latin America (11.2%, a difference of 0.060%), Immigrants from Southern Europe (11.2%, a difference of 0.080%), and Romanian (11.2%, a difference of 0.12%).
DemographicsRating | RankMale Disability
Immigrants from Kenya
63.8
/100
|
#163
Good
11.1%
British West Indians
62.8
/100
|
#164
Good
11.1%
Luxembourgers
61.9
/100
|
#165
Good
11.1%
Immigrants from Hungary
61.2
/100
|
#166
Good
11.1%
Immigrants from Southern Europe
54.4
/100
|
#167
Average
11.2%
Immigrants from Latin America
54.0
/100
|
#168
Average
11.2%
Barbadians
53.4
/100
|
#169
Average
11.2%
New Zealanders
52.9
/100
|
#170
Average
11.2%
Haitians
52.5
/100
|
#171
Average
11.2%
Romanians
50.7
/100
|
#172
Average
11.2%
Immigrants from Burma/Myanmar
50.4
/100
|
#173
Average
11.2%
Maltese
50.0
/100
|
#174
Average
11.2%
Immigrants from Honduras
48.7
/100
|
#175
Average
11.2%
Syrians
46.6
/100
|
#176
Average
11.2%
Immigrants from Norway
44.2
/100
|
#177
Average
11.3%

New Zealander Male Disability Correlation Summary

MeasurementNew Zealander DataMale Disability Data
Minimum0.016%1.7%
Maximum12.5%27.4%
Range12.5%25.7%
Mean2.4%12.7%
Median1.4%11.3%
Interquartile 25% (IQ1)0.66%10.4%
Interquartile 75% (IQ3)2.8%16.7%
Interquartile Range (IQR)2.2%6.3%
Standard Deviation (Sample)2.9%5.9%
Standard Deviation (Population)2.9%5.8%

Correlation Details

New Zealander PercentileSample SizeMale Disability
[
0.0%
-
0.5%
]
0.016%
93,462,30611.0%
[
0.0%
-
0.5%
]
0.086%
7,622,68610.7%
[
0.0%
-
0.5%
]
0.15%
2,744,64610.9%
[
0.0%
-
0.5%
]
0.21%
996,29313.2%
[
0.0%
-
0.5%
]
0.27%
672,95611.8%
[
0.0%
-
0.5%
]
0.34%
447,21610.7%
[
0.0%
-
0.5%
]
0.40%
215,32710.4%
[
0.0%
-
0.5%
]
0.47%
202,53711.2%
[
0.5%
-
1.0%
]
0.54%
140,06511.7%
[
0.5%
-
1.0%
]
0.60%
54,43610.3%
[
0.5%
-
1.0%
]
0.66%
62,60812.3%
[
0.5%
-
1.0%
]
0.71%
57,51610.6%
[
0.5%
-
1.0%
]
0.78%
29,4367.4%
[
0.5%
-
1.0%
]
0.84%
58,83517.6%
[
0.5%
-
1.0%
]
0.92%
35,5875.9%
[
0.5%
-
1.0%
]
0.96%
26,02313.0%
[
1.0%
-
1.5%
]
1.03%
7,64511.6%
[
1.0%
-
1.5%
]
1.12%
5,01211.0%
[
1.0%
-
1.5%
]
1.23%
7,78713.7%
[
1.0%
-
1.5%
]
1.30%
12,6332.9%
[
1.0%
-
1.5%
]
1.35%
13,32212.0%
[
1.0%
-
1.5%
]
1.38%
6,5346.0%
[
1.5%
-
2.0%
]
1.65%
36327.4%
[
1.5%
-
2.0%
]
1.79%
6,46718.0%
[
1.5%
-
2.0%
]
1.86%
1,01922.2%
[
1.5%
-
2.0%
]
1.92%
1,24722.9%
[
1.5%
-
2.0%
]
1.95%
97623.1%
[
2.0%
-
2.5%
]
2.09%
3,30521.4%
[
2.0%
-
2.5%
]
2.43%
2,01611.3%
[
2.0%
-
2.5%
]
2.47%
3,36714.3%
[
2.5%
-
3.0%
]
2.57%
4,4027.0%
[
2.5%
-
3.0%
]
2.84%
28216.7%
[
2.5%
-
3.0%
]
2.92%
6,34520.3%
[
3.0%
-
3.5%
]
3.11%
1,4138.7%
[
3.5%
-
4.0%
]
3.67%
49110.5%
[
3.5%
-
4.0%
]
3.73%
1,34017.6%
[
5.0%
-
5.5%
]
5.30%
88610.6%
[
5.5%
-
6.0%
]
5.82%
4987.2%
[
6.5%
-
7.0%
]
6.95%
60411.0%
[
7.5%
-
8.0%
]
7.66%
1,2401.7%
[
12.0%
-
12.5%
]
12.39%
2183.3%
[
12.0%
-
12.5%
]
12.47%
40123.2%