Israeli Male Disability
COMPARE
Israeli
Select to Compare
Male Disability
Israeli Male Disability
10.3%
DISABILITY | MALES
99.7/ 100
METRIC RATING
48th/ 347
METRIC RANK
Israeli Male Disability Correlation Chart
The statistical analysis conducted on geographies consisting of 211,170,801 people shows a mild positive correlation between the proportion of Israelis and percentage of males with a disability in the United States with a correlation coefficient (R) of 0.393 and weighted average of 10.3%. On average, for every 1% (one percent) increase in Israelis within a typical geography, there is an increase of 0.35% in percentage of males with a disability.
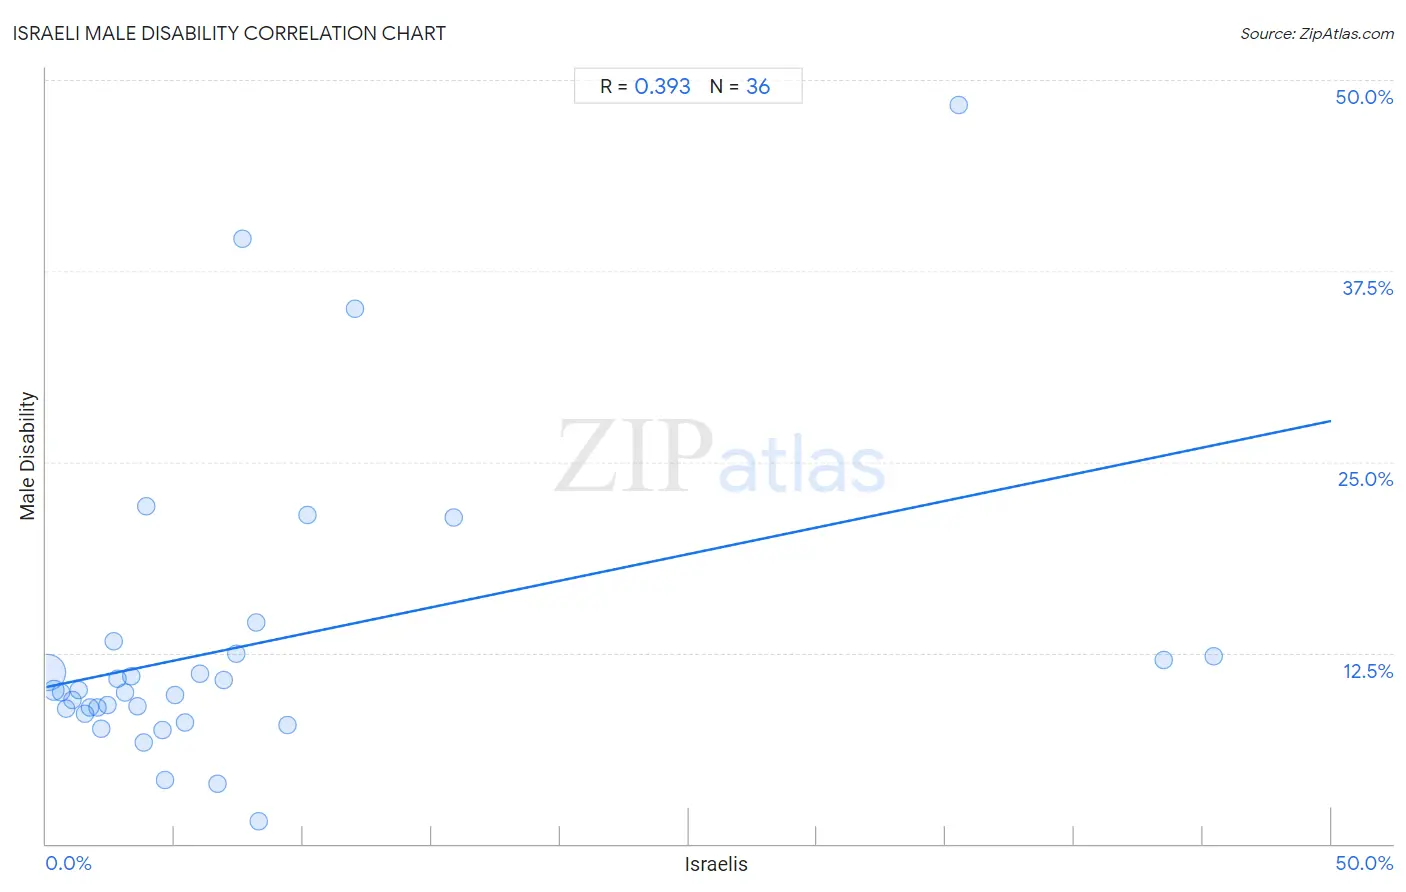
It is essential to understand that the correlation between the percentage of Israelis and percentage of males with a disability does not imply a direct cause-and-effect relationship. It remains uncertain whether the presence of Israelis influences an upward or downward trend in the level of percentage of males with a disability within an area, or if Israelis simply ended up residing in those areas with higher or lower levels of percentage of males with a disability due to other factors.
Demographics Similar to Israelis by Male Disability
In terms of male disability, the demographic groups most similar to Israelis are Immigrants from Peru (10.3%, a difference of 0.030%), Immigrants from Spain (10.3%, a difference of 0.060%), Cambodian (10.3%, a difference of 0.070%), Immigrants from El Salvador (10.3%, a difference of 0.15%), and Turkish (10.3%, a difference of 0.15%).
| Demographics | Rating | Rank | Male Disability |
| Taiwanese | 99.8 /100 | #41 | Exceptional 10.3% |
| Mongolians | 99.7 /100 | #42 | Exceptional 10.3% |
| Immigrants from Bangladesh | 99.7 /100 | #43 | Exceptional 10.3% |
| Immigrants from El Salvador | 99.7 /100 | #44 | Exceptional 10.3% |
| Turks | 99.7 /100 | #45 | Exceptional 10.3% |
| Cambodians | 99.7 /100 | #46 | Exceptional 10.3% |
| Immigrants from Peru | 99.7 /100 | #47 | Exceptional 10.3% |
| Israelis | 99.7 /100 | #48 | Exceptional 10.3% |
| Immigrants from Spain | 99.7 /100 | #49 | Exceptional 10.3% |
| South Americans | 99.6 /100 | #50 | Exceptional 10.3% |
| Salvadorans | 99.6 /100 | #51 | Exceptional 10.4% |
| Immigrants from Saudi Arabia | 99.6 /100 | #52 | Exceptional 10.4% |
| Immigrants from Uzbekistan | 99.6 /100 | #53 | Exceptional 10.4% |
| Peruvians | 99.6 /100 | #54 | Exceptional 10.4% |
| Immigrants from Eritrea | 99.6 /100 | #55 | Exceptional 10.4% |
Israeli Male Disability Correlation Summary
| Measurement | Israeli Data | Male Disability Data |
| Minimum | 0.067% | 1.5% |
| Maximum | 45.4% | 48.4% |
| Range | 45.4% | 46.9% |
| Mean | 7.8% | 13.0% |
| Median | 4.2% | 10.0% |
| Interquartile 25% (IQ1) | 2.1% | 8.7% |
| Interquartile 75% (IQ3) | 7.9% | 12.4% |
| Interquartile Range (IQR) | 5.9% | 3.7% |
| Standard Deviation (Sample) | 11.0% | 9.7% |
| Standard Deviation (Population) | 10.8% | 9.6% |
Correlation Details
| Israeli Percentile | Sample Size | Male Disability |
[ 0.0% - 0.5% ] 0.067% | 182,741,578 | 11.2% |
[ 0.0% - 0.5% ] 0.31% | 18,436,010 | 10.0% |
[ 0.5% - 1.0% ] 0.57% | 4,295,122 | 9.9% |
[ 0.5% - 1.0% ] 0.78% | 2,004,396 | 8.8% |
[ 1.0% - 1.5% ] 1.02% | 1,398,781 | 9.4% |
[ 1.0% - 1.5% ] 1.26% | 624,589 | 10.0% |
[ 1.5% - 2.0% ] 1.50% | 254,179 | 8.5% |
[ 1.5% - 2.0% ] 1.70% | 376,622 | 8.9% |
[ 1.5% - 2.0% ] 1.98% | 240,808 | 8.9% |
[ 2.0% - 2.5% ] 2.12% | 237,176 | 7.5% |
[ 2.0% - 2.5% ] 2.40% | 130,559 | 9.1% |
[ 2.5% - 3.0% ] 2.63% | 66,201 | 13.3% |
[ 2.5% - 3.0% ] 2.76% | 57,201 | 10.8% |
[ 3.0% - 3.5% ] 3.06% | 68,936 | 9.9% |
[ 3.0% - 3.5% ] 3.29% | 70,940 | 10.9% |
[ 3.5% - 4.0% ] 3.53% | 71,502 | 9.0% |
[ 3.5% - 4.0% ] 3.79% | 32,884 | 6.7% |
[ 3.5% - 4.0% ] 3.90% | 5,617 | 22.1% |
[ 4.5% - 5.0% ] 4.52% | 598 | 7.4% |
[ 4.5% - 5.0% ] 4.61% | 18,210 | 4.2% |
[ 5.0% - 5.5% ] 5.00% | 520 | 9.8% |
[ 5.0% - 5.5% ] 5.39% | 5,564 | 8.0% |
[ 5.5% - 6.0% ] 5.98% | 8,851 | 11.2% |
[ 6.5% - 7.0% ] 6.66% | 4,550 | 3.9% |
[ 6.5% - 7.0% ] 6.91% | 7,307 | 10.8% |
[ 7.0% - 7.5% ] 7.39% | 717 | 12.4% |
[ 7.5% - 8.0% ] 7.65% | 810 | 39.6% |
[ 8.0% - 8.5% ] 8.15% | 319 | 14.5% |
[ 8.0% - 8.5% ] 8.26% | 1,066 | 1.5% |
[ 9.0% - 9.5% ] 9.41% | 6,123 | 7.7% |
[ 10.0% - 10.5% ] 10.17% | 1,534 | 21.5% |
[ 12.0% - 12.5% ] 12.03% | 349 | 35.0% |
[ 15.5% - 16.0% ] 15.84% | 486 | 21.4% |
[ 35.0% - 35.5% ] 35.48% | 93 | 48.4% |
[ 43.5% - 44.0% ] 43.51% | 308 | 12.0% |
[ 45.0% - 45.5% ] 45.42% | 295 | 12.3% |