Cities with the Highest Percentage of Population Employed in Construction in Arkansas
RELATED REPORTS & OPTIONS
Construction
Arkansas
Compare Cities
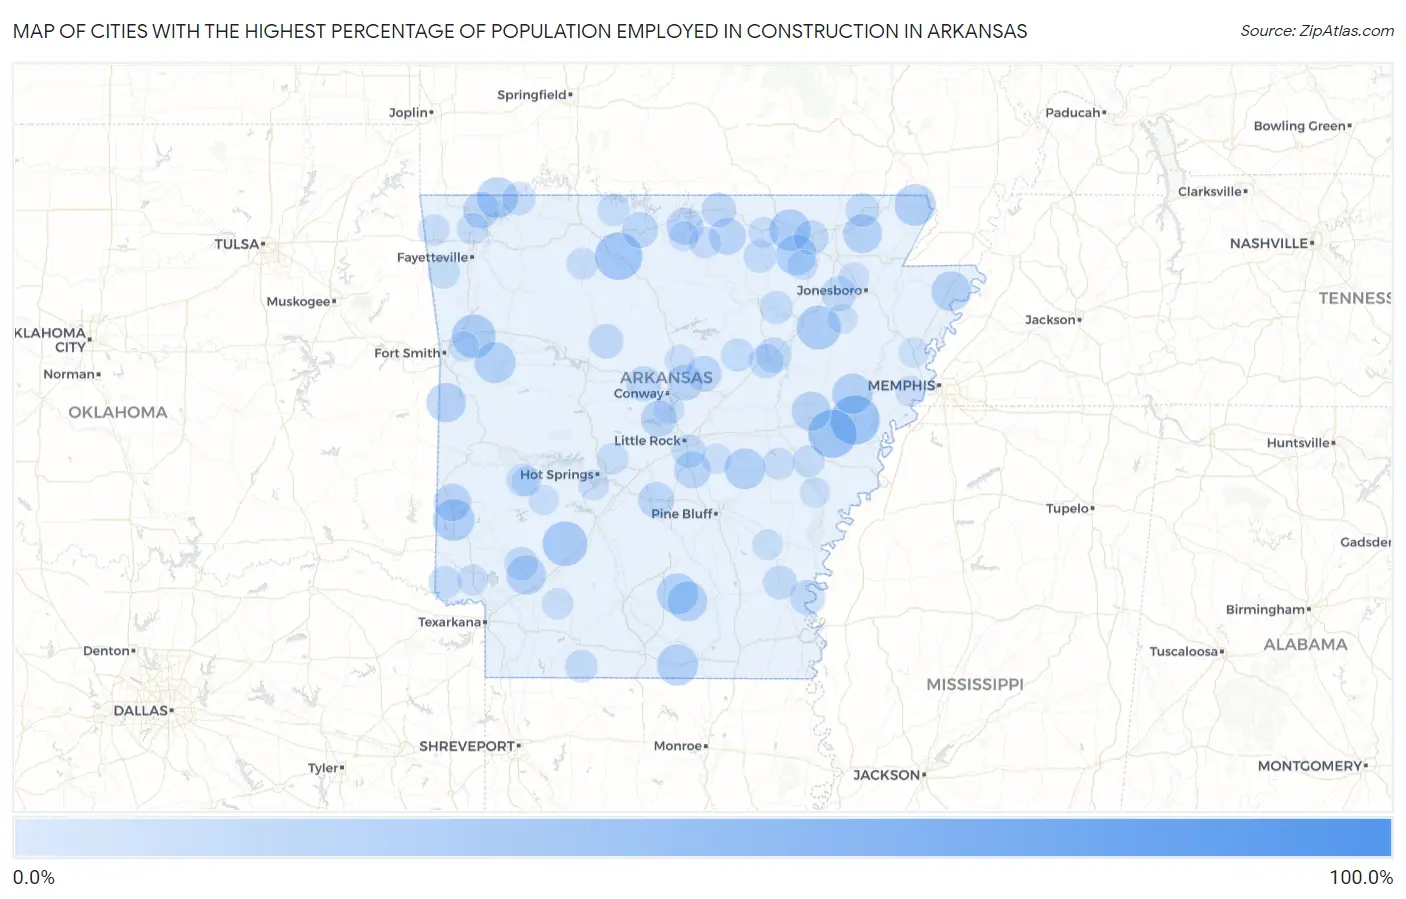
Map of Cities with the Highest Percentage of Population Employed in Construction in Arkansas
0.0%
100.0%
Cities with the Highest Percentage of Population Employed in Construction in Arkansas
| City | % Employed | vs State | vs National | |
| 1. | Uniontown | 100.0% | 7.1%(+92.9)#1 | 6.9%(+93.1)#15 |
| 2. | Gregory | 100.0% | 7.1%(+92.9)#2 | 6.9%(+93.1)#36 |
| 3. | Goodwin | 64.3% | 7.1%(+57.1)#3 | 6.9%(+57.4)#109 |
| 4. | Batavia | 63.9% | 7.1%(+56.8)#4 | 6.9%(+57.0)#111 |
| 5. | Urbana | 50.0% | 7.1%(+42.9)#5 | 6.9%(+43.1)#211 |
| 6. | Alpine | 50.0% | 7.1%(+42.9)#6 | 6.9%(+43.1)#216 |
| 7. | Pearcy | 46.9% | 7.1%(+39.8)#7 | 6.9%(+40.0)#246 |
| 8. | Collins | 42.7% | 7.1%(+35.6)#8 | 6.9%(+35.8)#309 |
| 9. | Haynes | 41.7% | 7.1%(+34.5)#9 | 6.9%(+34.8)#327 |
| 10. | Acorn | 40.4% | 7.1%(+33.3)#10 | 6.9%(+33.6)#343 |
| 11. | Moro | 40.0% | 7.1%(+32.9)#11 | 6.9%(+33.1)#356 |
| 12. | Pindall | 38.6% | 7.1%(+31.5)#12 | 6.9%(+31.7)#393 |
| 13. | El Paso | 37.6% | 7.1%(+30.5)#13 | 6.9%(+30.8)#421 |
| 14. | Okolona | 34.6% | 7.1%(+27.4)#14 | 6.9%(+27.7)#530 |
| 15. | Mount Judea | 34.5% | 7.1%(+27.3)#15 | 6.9%(+27.6)#533 |
| 16. | Ponca | 34.3% | 7.1%(+27.2)#16 | 6.9%(+27.4)#538 |
| 17. | Amagon | 33.3% | 7.1%(+26.2)#17 | 6.9%(+26.5)#574 |
| 18. | Dyer | 32.8% | 7.1%(+25.6)#18 | 6.9%(+25.9)#613 |
| 19. | Gillham | 29.9% | 7.1%(+22.7)#19 | 6.9%(+23.0)#752 |
| 20. | Pollard | 29.5% | 7.1%(+22.4)#20 | 6.9%(+22.7)#769 |
| 21. | Williford | 29.2% | 7.1%(+22.0)#21 | 6.9%(+22.3)#796 |
| 22. | Strong | 29.1% | 7.1%(+22.0)#22 | 6.9%(+22.2)#801 |
| 23. | Branch | 28.9% | 7.1%(+21.8)#23 | 6.9%(+22.1)#807 |
| 24. | Gateway | 28.6% | 7.1%(+21.4)#24 | 6.9%(+21.7)#824 |
| 25. | Tinsman | 28.6% | 7.1%(+21.4)#25 | 6.9%(+21.7)#840 |
| 26. | Humnoke | 28.3% | 7.1%(+21.2)#26 | 6.9%(+21.4)#858 |
| 27. | Smithville | 28.2% | 7.1%(+21.1)#27 | 6.9%(+21.3)#869 |
| 28. | Wayton | 28.1% | 7.1%(+21.0)#28 | 6.9%(+21.2)#875 |
| 29. | Caldwell | 27.9% | 7.1%(+20.7)#29 | 6.9%(+21.0)#896 |
| 30. | Salado | 27.3% | 7.1%(+20.1)#30 | 6.9%(+20.4)#937 |
| 31. | Aplin | 27.0% | 7.1%(+19.9)#31 | 6.9%(+20.2)#972 |
| 32. | Burdette | 26.9% | 7.1%(+19.7)#32 | 6.9%(+20.0)#984 |
| 33. | Banks | 26.8% | 7.1%(+19.6)#33 | 6.9%(+19.9)#991 |
| 34. | Wesley | 26.6% | 7.1%(+19.4)#34 | 6.9%(+19.7)#1,006 |
| 35. | Hartford | 26.3% | 7.1%(+19.2)#35 | 6.9%(+19.5)#1,018 |
| 36. | Washington | 26.3% | 7.1%(+19.2)#36 | 6.9%(+19.4)#1,022 |
| 37. | Fargo | 26.1% | 7.1%(+18.9)#37 | 6.9%(+19.2)#1,041 |
| 38. | Delaplaine | 25.6% | 7.1%(+18.5)#38 | 6.9%(+18.8)#1,074 |
| 39. | Wickes | 23.3% | 7.1%(+16.2)#39 | 6.9%(+16.5)#1,337 |
| 40. | Briarcliff | 22.9% | 7.1%(+15.8)#40 | 6.9%(+16.0)#1,400 |
| 41. | Oxford | 22.8% | 7.1%(+15.7)#41 | 6.9%(+15.9)#1,414 |
| 42. | Woodson | 22.2% | 7.1%(+15.1)#42 | 6.9%(+15.3)#1,504 |
| 43. | Avoca | 21.7% | 7.1%(+14.5)#43 | 6.9%(+14.8)#1,601 |
| 44. | Floyd | 21.4% | 7.1%(+14.3)#44 | 6.9%(+14.5)#1,643 |
| 45. | Prattsville | 21.3% | 7.1%(+14.2)#45 | 6.9%(+14.5)#1,653 |
| 46. | Roland | 21.2% | 7.1%(+14.1)#46 | 6.9%(+14.3)#1,663 |
| 47. | Holland | 21.1% | 7.1%(+13.9)#47 | 6.9%(+14.2)#1,692 |
| 48. | Summit | 20.9% | 7.1%(+13.8)#48 | 6.9%(+14.0)#1,719 |
| 49. | Mount Vernon | 20.7% | 7.1%(+13.6)#49 | 6.9%(+13.8)#1,763 |
| 50. | Bee Branch | 20.5% | 7.1%(+13.4)#50 | 6.9%(+13.6)#1,793 |
| 51. | Plumerville | 20.3% | 7.1%(+13.2)#51 | 6.9%(+13.5)#1,827 |
| 52. | Arkansas City | 20.1% | 7.1%(+13.0)#52 | 6.9%(+13.2)#1,865 |
| 53. | Russell | 20.0% | 7.1%(+12.9)#53 | 6.9%(+13.1)#1,882 |
| 54. | Payneway | 19.4% | 7.1%(+12.3)#54 | 6.9%(+12.6)#2,027 |
| 55. | Cash | 19.4% | 7.1%(+12.2)#55 | 6.9%(+12.5)#2,050 |
| 56. | Imboden | 19.3% | 7.1%(+12.1)#56 | 6.9%(+12.4)#2,073 |
| 57. | Viola | 19.1% | 7.1%(+12.0)#57 | 6.9%(+12.3)#2,100 |
| 58. | Hector | 19.0% | 7.1%(+11.9)#58 | 6.9%(+12.1)#2,135 |
| 59. | Bald Knob | 18.5% | 7.1%(+11.4)#59 | 6.9%(+11.7)#2,264 |
| 60. | Lacey | 18.3% | 7.1%(+11.2)#60 | 6.9%(+11.5)#2,312 |
| 61. | Tillar | 18.2% | 7.1%(+11.0)#61 | 6.9%(+11.3)#2,370 |
| 62. | Deer | 18.2% | 7.1%(+11.0)#62 | 6.9%(+11.3)#2,379 |
| 63. | Datto | 18.2% | 7.1%(+11.0)#63 | 6.9%(+11.3)#2,384 |
| 64. | Ozan | 17.6% | 7.1%(+10.5)#64 | 6.9%(+10.8)#2,545 |
| 65. | Sweet Home | 17.5% | 7.1%(+10.3)#65 | 6.9%(+10.6)#2,589 |
| 66. | Foreman | 17.2% | 7.1%(+10.0)#66 | 6.9%(+10.3)#2,675 |
| 67. | Holiday Island | 16.9% | 7.1%(+9.75)#67 | 6.9%(+10.0)#2,782 |
| 68. | Evening Shade | 16.8% | 7.1%(+9.69)#68 | 6.9%(+9.95)#2,805 |
| 69. | Magness | 16.7% | 7.1%(+9.53)#69 | 6.9%(+9.79)#2,892 |
| 70. | Black Springs | 16.7% | 7.1%(+9.53)#70 | 6.9%(+9.79)#2,896 |
| 71. | Letona | 16.5% | 7.1%(+9.36)#71 | 6.9%(+9.62)#2,959 |
| 72. | Emerson | 16.4% | 7.1%(+9.27)#72 | 6.9%(+9.53)#2,991 |
| 73. | South Lead Hill | 15.8% | 7.1%(+8.65)#73 | 6.9%(+8.91)#3,227 |
| 74. | Lincoln | 15.8% | 7.1%(+8.63)#74 | 6.9%(+8.89)#3,236 |
| 75. | Ulm | 15.5% | 7.1%(+8.37)#75 | 6.9%(+8.63)#3,346 |
| 76. | Holly Grove | 15.2% | 7.1%(+8.08)#76 | 6.9%(+8.34)#3,480 |
| 77. | Fountain Lake | 15.1% | 7.1%(+7.93)#77 | 6.9%(+8.19)#3,562 |
| 78. | Pineville | 15.0% | 7.1%(+7.86)#78 | 6.9%(+8.12)#3,596 |
| 79. | Lowell | 14.9% | 7.1%(+7.76)#79 | 6.9%(+8.02)#3,667 |
| 80. | Gentry | 14.7% | 7.1%(+7.59)#80 | 6.9%(+7.85)#3,782 |
| 81. | Jasper | 14.7% | 7.1%(+7.57)#81 | 6.9%(+7.83)#3,792 |
| 82. | Mayflower | 14.3% | 7.1%(+7.18)#82 | 6.9%(+7.44)#4,009 |
| 83. | Bodcaw | 14.1% | 7.1%(+6.95)#83 | 6.9%(+7.21)#4,159 |
| 84. | Wilton | 13.9% | 7.1%(+6.80)#84 | 6.9%(+7.06)#4,263 |
| 85. | Ash Flat | 13.9% | 7.1%(+6.75)#85 | 6.9%(+7.01)#4,280 |
| 86. | Lake Hamilton | 13.8% | 7.1%(+6.68)#86 | 6.9%(+6.94)#4,325 |
| 87. | Bono | 13.7% | 7.1%(+6.55)#87 | 6.9%(+6.81)#4,417 |
| 88. | Gould | 13.2% | 7.1%(+6.09)#88 | 6.9%(+6.35)#4,776 |
| 89. | Edmondson | 13.2% | 7.1%(+6.07)#89 | 6.9%(+6.33)#4,785 |
| 90. | Genoa | 13.1% | 7.1%(+5.95)#90 | 6.9%(+6.21)#4,851 |
| 91. | Turrell | 13.0% | 7.1%(+5.84)#91 | 6.9%(+6.10)#4,941 |
| 92. | Guy | 12.9% | 7.1%(+5.75)#92 | 6.9%(+6.01)#5,000 |
| 93. | Kibler | 12.9% | 7.1%(+5.73)#93 | 6.9%(+5.99)#5,016 |
| 94. | St Charles | 12.8% | 7.1%(+5.68)#94 | 6.9%(+5.94)#5,044 |
| 95. | Norman | 12.8% | 7.1%(+5.63)#95 | 6.9%(+5.89)#5,079 |
| 96. | Lynn | 12.6% | 7.1%(+5.49)#96 | 6.9%(+5.76)#5,161 |
| 97. | Keo | 12.6% | 7.1%(+5.48)#97 | 6.9%(+5.74)#5,169 |
| 98. | Norfork | 12.6% | 7.1%(+5.45)#98 | 6.9%(+5.71)#5,190 |
| 99. | Glenwood | 12.4% | 7.1%(+5.27)#99 | 6.9%(+5.53)#5,341 |
| 100. | Weiner | 12.3% | 7.1%(+5.18)#100 | 6.9%(+5.44)#5,419 |
Common Questions
What are the Top 10 Cities with the Highest Percentage of Population Employed in Construction in Arkansas?
Top 10 Cities with the Highest Percentage of Population Employed in Construction in Arkansas are:
What city has the Highest Percentage of Population Employed in Construction in Arkansas?
Haynes has the Highest Percentage of Population Employed in Construction in Arkansas with 41.7%.
What is the Percentage of Population Employed in Construction in the State of Arkansas?
Percentage of Population Employed in Construction in Arkansas is 7.1%.
What is the Percentage of Population Employed in Construction in the United States?
Percentage of Population Employed in Construction in the United States is 6.9%.