Lincoln, AR Map & Demographics
Lincoln Map
Lincoln Overview
$24,677
PER CAPITA INCOME
$54,886
AVG FAMILY INCOME
$50,625
AVG HOUSEHOLD INCOME
26.6%
WAGE / INCOME GAP [ % ]
73.4¢/ $1
WAGE / INCOME GAP [ $ ]
0.40
INEQUALITY / GINI INDEX
2,754
TOTAL POPULATION
1,359
MALE POPULATION
1,395
FEMALE POPULATION
97.42
MALES / 100 FEMALES
102.65
FEMALES / 100 MALES
33.3
MEDIAN AGE
3.5
AVG FAMILY SIZE
2.9
AVG HOUSEHOLD SIZE
1,114
LABOR FORCE [ PEOPLE ]
51.2%
PERCENT IN LABOR FORCE
4.1%
UNEMPLOYMENT RATE
Lincoln Zip Codes
Lincoln Area Codes
Income in Lincoln
Income Overview in Lincoln
Per Capita Income in Lincoln is $24,677, while median incomes of families and households are $54,886 and $50,625 respectively.
| Characteristic | Number | Measure |
| Per Capita Income | 2,754 | $24,677 |
| Median Family Income | 685 | $54,886 |
| Mean Family Income | 685 | $79,255 |
| Median Household Income | 948 | $50,625 |
| Mean Household Income | 948 | $71,328 |
| Income Deficit | 685 | $0 |
| Wage / Income Gap (%) | 2,754 | 26.63% |
| Wage / Income Gap ($) | 2,754 | 73.37¢ per $1 |
| Gini / Inequality Index | 2,754 | 0.40 |
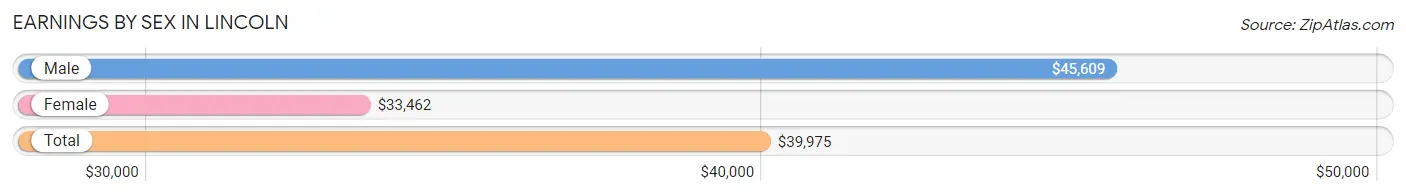
Earnings by Sex in Lincoln
Average Earnings in Lincoln are $39,975, $45,609 for men and $33,462 for women, a difference of 26.6%.
| Sex | Number | Average Earnings |
| Male | 593 (54.2%) | $45,609 |
| Female | 500 (45.8%) | $33,462 |
| Total | 1,093 (100.0%) | $39,975 |
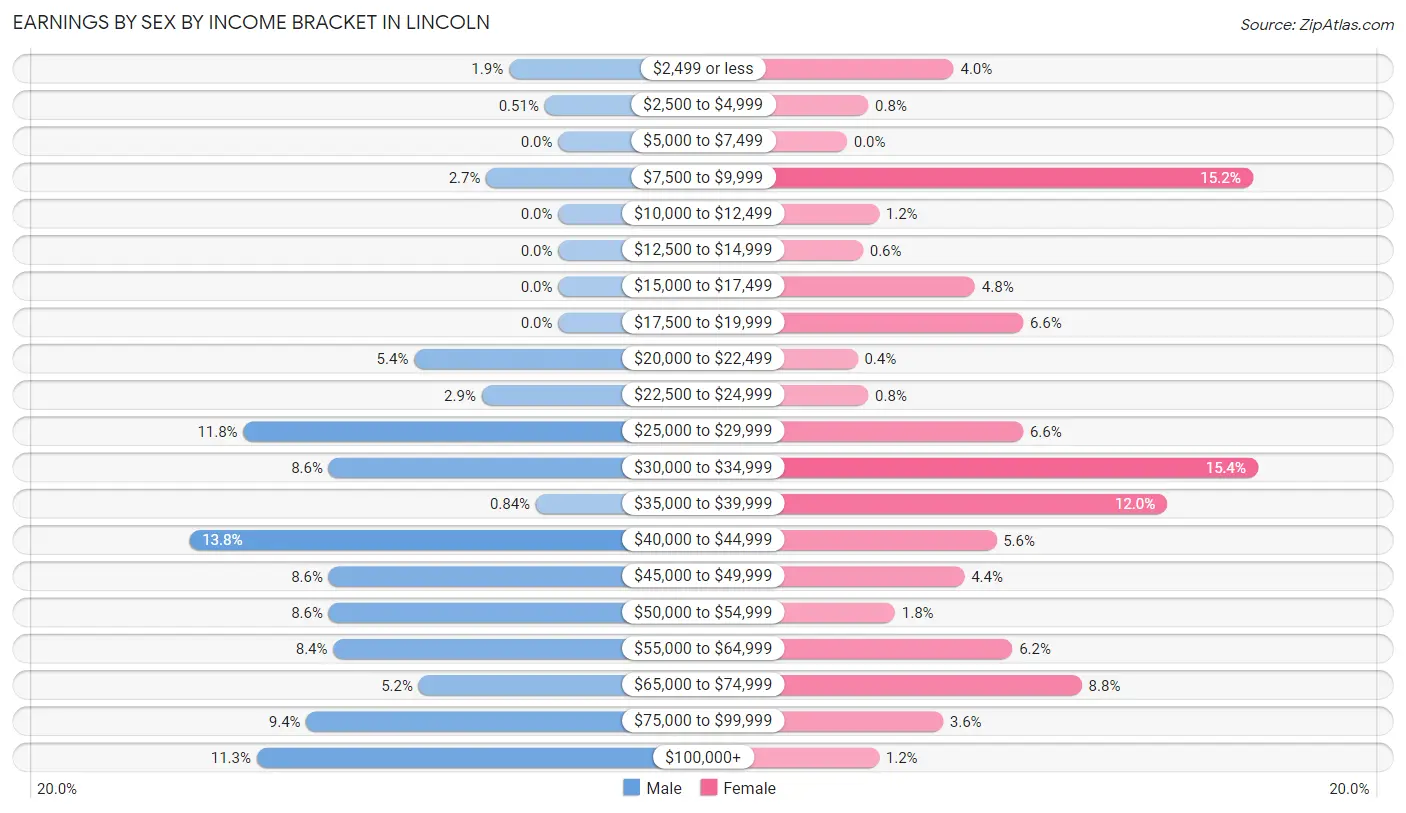
Earnings by Sex by Income Bracket in Lincoln
The most common earnings brackets in Lincoln are $40,000 to $44,999 for men (82 | 13.8%) and $30,000 to $34,999 for women (77 | 15.4%).
| Income | Male | Female |
| $2,499 or less | 11 (1.8%) | 20 (4.0%) |
| $2,500 to $4,999 | 3 (0.5%) | 4 (0.8%) |
| $5,000 to $7,499 | 0 (0.0%) | 0 (0.0%) |
| $7,500 to $9,999 | 16 (2.7%) | 76 (15.2%) |
| $10,000 to $12,499 | 0 (0.0%) | 6 (1.2%) |
| $12,500 to $14,999 | 0 (0.0%) | 3 (0.6%) |
| $15,000 to $17,499 | 0 (0.0%) | 24 (4.8%) |
| $17,500 to $19,999 | 0 (0.0%) | 33 (6.6%) |
| $20,000 to $22,499 | 32 (5.4%) | 2 (0.4%) |
| $22,500 to $24,999 | 17 (2.9%) | 4 (0.8%) |
| $25,000 to $29,999 | 70 (11.8%) | 33 (6.6%) |
| $30,000 to $34,999 | 51 (8.6%) | 77 (15.4%) |
| $35,000 to $39,999 | 5 (0.8%) | 60 (12.0%) |
| $40,000 to $44,999 | 82 (13.8%) | 28 (5.6%) |
| $45,000 to $49,999 | 51 (8.6%) | 22 (4.4%) |
| $50,000 to $54,999 | 51 (8.6%) | 9 (1.8%) |
| $55,000 to $64,999 | 50 (8.4%) | 31 (6.2%) |
| $65,000 to $74,999 | 31 (5.2%) | 44 (8.8%) |
| $75,000 to $99,999 | 56 (9.4%) | 18 (3.6%) |
| $100,000+ | 67 (11.3%) | 6 (1.2%) |
| Total | 593 (100.0%) | 500 (100.0%) |
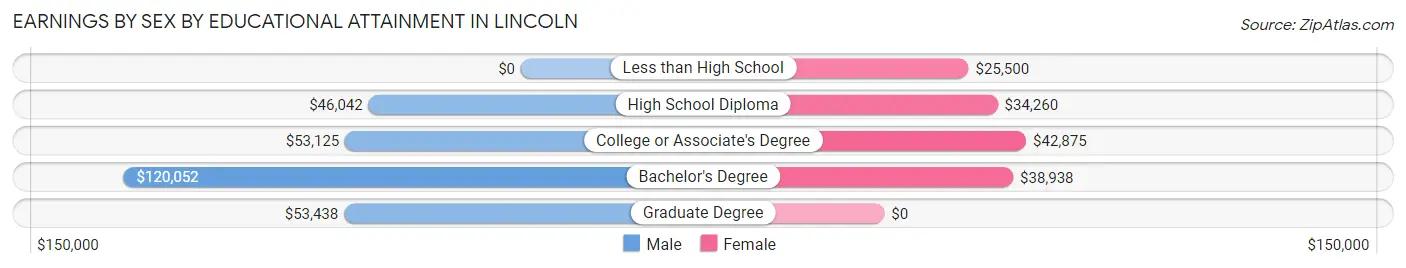
Earnings by Sex by Educational Attainment in Lincoln
Average earnings in Lincoln are $51,750 for men and $34,770 for women, a difference of 32.8%. Men with an educational attainment of bachelor's degree enjoy the highest average annual earnings of $120,052, while those with high school diploma education earn the least with $46,042. Women with an educational attainment of college or associate's degree earn the most with the average annual earnings of $42,875, while those with less than high school education have the smallest earnings of $25,500.
| Educational Attainment | Male Income | Female Income |
| Less than High School | - | - |
| High School Diploma | $46,042 | $34,260 |
| College or Associate's Degree | $53,125 | $42,875 |
| Bachelor's Degree | $120,052 | $38,938 |
| Graduate Degree | $53,438 | $0 |
| Total | $51,750 | $34,770 |
Family Income in Lincoln
Family Income Brackets in Lincoln
According to the Lincoln family income data, there are 187 families falling into the $35,000 to $49,999 income range, which is the most common income bracket and makes up 27.3% of all families.
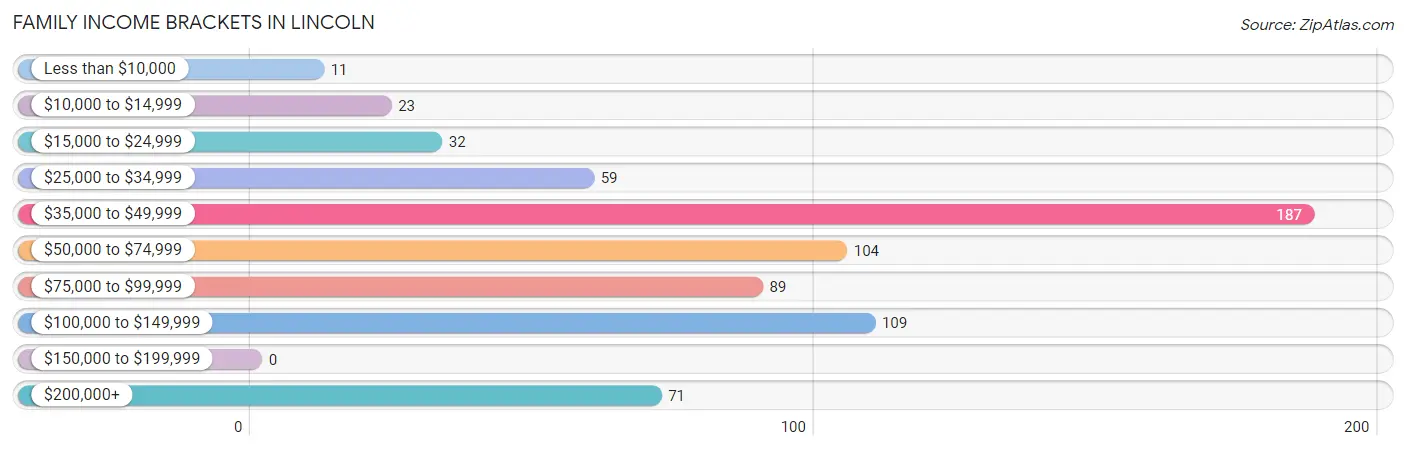
| Income Bracket | # Families | % Families |
| Less than $10,000 | 11 | 1.6% |
| $10,000 to $14,999 | 23 | 3.4% |
| $15,000 to $24,999 | 32 | 4.7% |
| $25,000 to $34,999 | 59 | 8.6% |
| $35,000 to $49,999 | 187 | 27.3% |
| $50,000 to $74,999 | 104 | 15.2% |
| $75,000 to $99,999 | 89 | 13.0% |
| $100,000 to $149,999 | 109 | 15.9% |
| $150,000 to $199,999 | 0 | 0.0% |
| $200,000+ | 71 | 10.4% |
Family Income by Famaliy Size in Lincoln
4-person families (200 | 29.2%) account for the highest median family income in Lincoln with $92,105 per family, while 2-person families (174 | 25.4%) have the highest median income of $24,628 per family member.
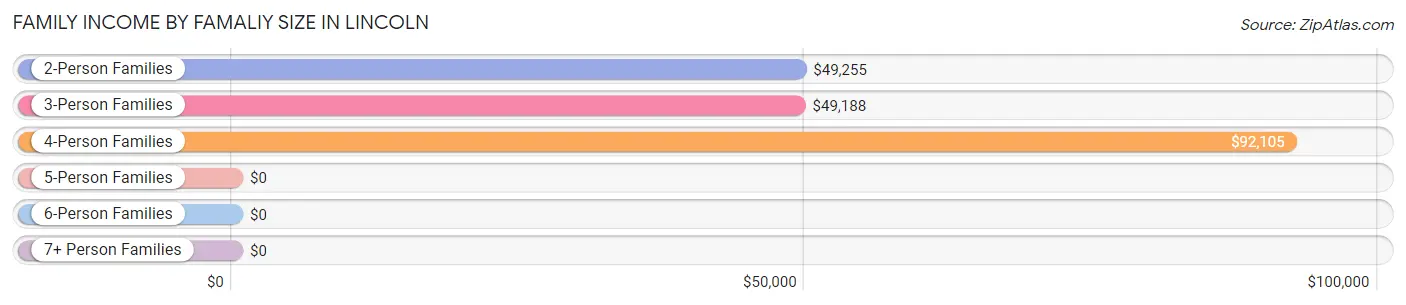
| Income Bracket | # Families | Median Income |
| 2-Person Families | 174 (25.4%) | $49,255 |
| 3-Person Families | 229 (33.4%) | $49,188 |
| 4-Person Families | 200 (29.2%) | $92,105 |
| 5-Person Families | 39 (5.7%) | $0 |
| 6-Person Families | 20 (2.9%) | $0 |
| 7+ Person Families | 23 (3.4%) | $0 |
| Total | 685 (100.0%) | $54,886 |
Family Income by Number of Earners in Lincoln
The median family income in Lincoln is $54,886, with families comprising 3+ earners (60) having the highest median family income of $117,667, while families with no earners (109) have the lowest median family income of $31,528, accounting for 8.8% and 15.9% of families, respectively.
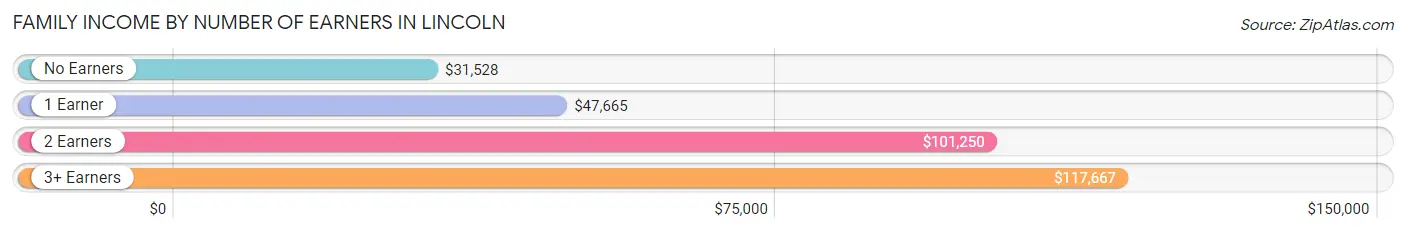
| Number of Earners | # Families | Median Income |
| No Earners | 109 (15.9%) | $31,528 |
| 1 Earner | 301 (43.9%) | $47,665 |
| 2 Earners | 215 (31.4%) | $101,250 |
| 3+ Earners | 60 (8.8%) | $117,667 |
| Total | 685 (100.0%) | $54,886 |
Household Income in Lincoln
Household Income Brackets in Lincoln
With 241 households falling in the category, the $35,000 to $49,999 income range is the most frequent in Lincoln, accounting for 25.4% of all households.
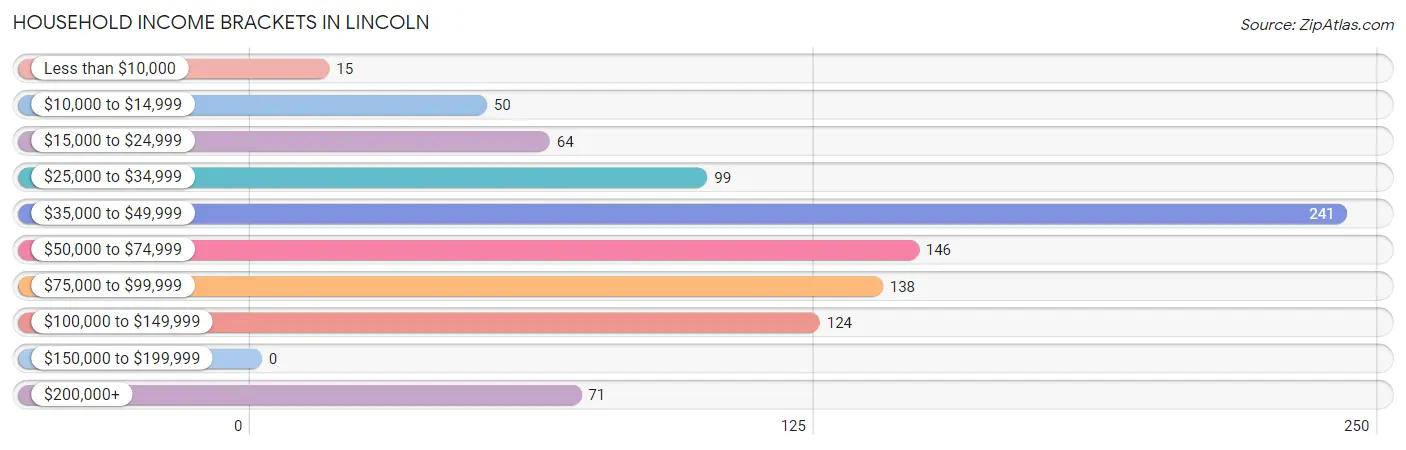
| Income Bracket | # Households | % Households |
| Less than $10,000 | 15 | 1.6% |
| $10,000 to $14,999 | 50 | 5.3% |
| $15,000 to $24,999 | 64 | 6.8% |
| $25,000 to $34,999 | 99 | 10.4% |
| $35,000 to $49,999 | 241 | 25.4% |
| $50,000 to $74,999 | 146 | 15.4% |
| $75,000 to $99,999 | 138 | 14.6% |
| $100,000 to $149,999 | 124 | 13.1% |
| $150,000 to $199,999 | 0 | 0.0% |
| $200,000+ | 71 | 7.5% |
Household Income by Householder Age in Lincoln
The median household income in Lincoln is $50,625, with the highest median household income of $82,794 found in the 45 to 64 years age bracket for the primary householder. A total of 252 households (26.6%) fall into this category. Meanwhile, the 15 to 24 years age bracket for the primary householder has the lowest median household income of $41,818, with 48 households (5.1%) in this group.
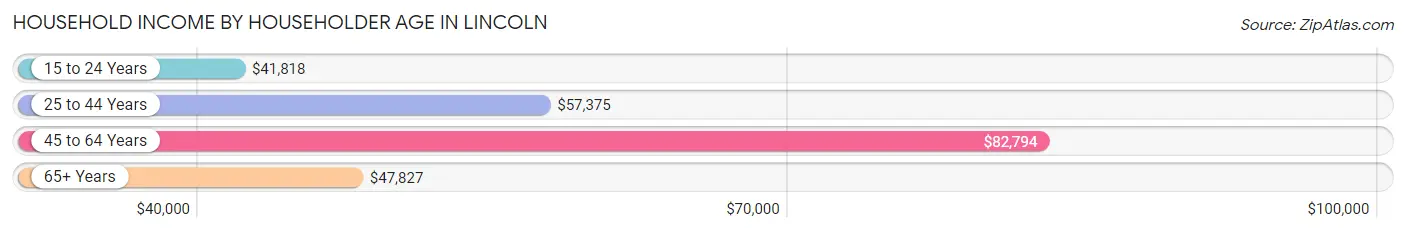
| Income Bracket | # Households | Median Income |
| 15 to 24 Years | 48 (5.1%) | $41,818 |
| 25 to 44 Years | 339 (35.8%) | $57,375 |
| 45 to 64 Years | 252 (26.6%) | $82,794 |
| 65+ Years | 309 (32.6%) | $47,827 |
| Total | 948 (100.0%) | $50,625 |
Poverty in Lincoln
Income Below Poverty by Sex and Age in Lincoln
With 14.6% poverty level for males and 21.0% for females among the residents of Lincoln, 6 to 11 year old males and 16 and 17 year old females are the most vulnerable to poverty, with 69 males (39.7%) and 19 females (29.7%) in their respective age groups living below the poverty level.
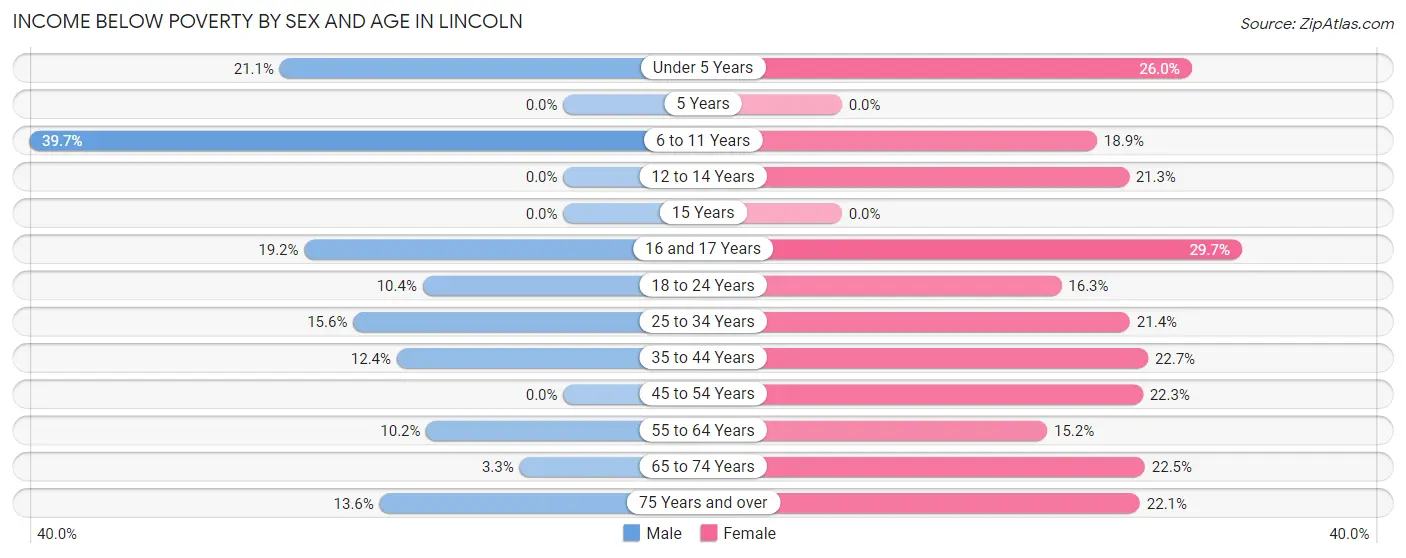
| Age Bracket | Male | Female |
| Under 5 Years | 8 (21.0%) | 27 (26.0%) |
| 5 Years | 0 (0.0%) | 0 (0.0%) |
| 6 to 11 Years | 69 (39.7%) | 25 (18.9%) |
| 12 to 14 Years | 0 (0.0%) | 23 (21.3%) |
| 15 Years | 0 (0.0%) | 0 (0.0%) |
| 16 and 17 Years | 15 (19.2%) | 19 (29.7%) |
| 18 to 24 Years | 26 (10.4%) | 15 (16.3%) |
| 25 to 34 Years | 39 (15.6%) | 37 (21.4%) |
| 35 to 44 Years | 22 (12.4%) | 40 (22.7%) |
| 45 to 54 Years | 0 (0.0%) | 21 (22.3%) |
| 55 to 64 Years | 6 (10.2%) | 32 (15.2%) |
| 65 to 74 Years | 4 (3.3%) | 27 (22.5%) |
| 75 Years and over | 9 (13.6%) | 27 (22.1%) |
| Total | 198 (14.6%) | 293 (21.0%) |
Income Above Poverty by Sex and Age in Lincoln
According to the poverty statistics in Lincoln, males aged 12 to 14 years and females aged 55 to 64 years are the age groups that are most secure financially, with 100.0% of males and 84.8% of females in these age groups living above the poverty line.
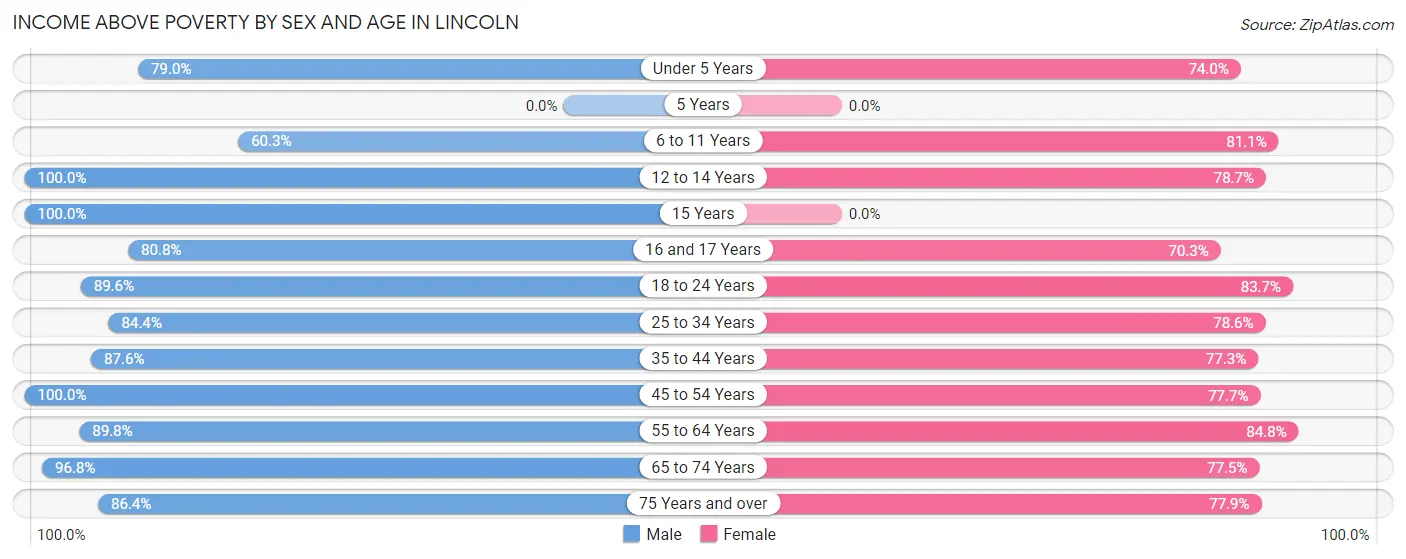
| Age Bracket | Male | Female |
| Under 5 Years | 30 (78.9%) | 77 (74.0%) |
| 5 Years | 0 (0.0%) | 0 (0.0%) |
| 6 to 11 Years | 105 (60.3%) | 107 (81.1%) |
| 12 to 14 Years | 18 (100.0%) | 85 (78.7%) |
| 15 Years | 5 (100.0%) | 0 (0.0%) |
| 16 and 17 Years | 63 (80.8%) | 45 (70.3%) |
| 18 to 24 Years | 223 (89.6%) | 77 (83.7%) |
| 25 to 34 Years | 211 (84.4%) | 136 (78.6%) |
| 35 to 44 Years | 156 (87.6%) | 136 (77.3%) |
| 45 to 54 Years | 121 (100.0%) | 73 (77.7%) |
| 55 to 64 Years | 53 (89.8%) | 178 (84.8%) |
| 65 to 74 Years | 119 (96.8%) | 93 (77.5%) |
| 75 Years and over | 57 (86.4%) | 95 (77.9%) |
| Total | 1,161 (85.4%) | 1,102 (79.0%) |
Income Below Poverty Among Married-Couple Families in Lincoln
The poverty statistics for married-couple families in Lincoln show that 13.2% or 60 of the total 456 families live below the poverty line. Families with 5 or more children have the highest poverty rate of 100.0%, comprising of 9 families. On the other hand, families with 1 or 2 children have the lowest poverty rate of 6.9%, which includes 15 families.
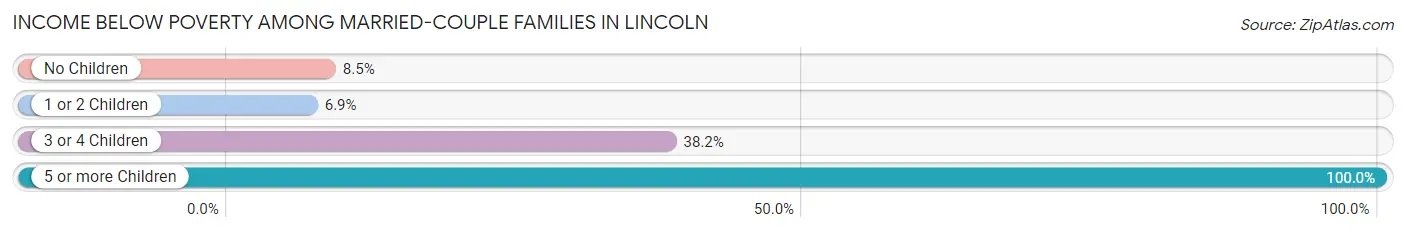
| Children | Above Poverty | Below Poverty |
| No Children | 161 (91.5%) | 15 (8.5%) |
| 1 or 2 Children | 201 (93.1%) | 15 (6.9%) |
| 3 or 4 Children | 34 (61.8%) | 21 (38.2%) |
| 5 or more Children | 0 (0.0%) | 9 (100.0%) |
| Total | 396 (86.8%) | 60 (13.2%) |
Income Below Poverty Among Single-Parent Households in Lincoln
According to the poverty data in Lincoln, 17.9% or 7 single-father households and 15.3% or 29 single-mother households are living below the poverty line. Among single-father households, those with 1 or 2 children have the highest poverty rate, with 7 households (43.8%) experiencing poverty. Likewise, among single-mother households, those with 1 or 2 children have the highest poverty rate, with 29 households (37.7%) falling below the poverty line.
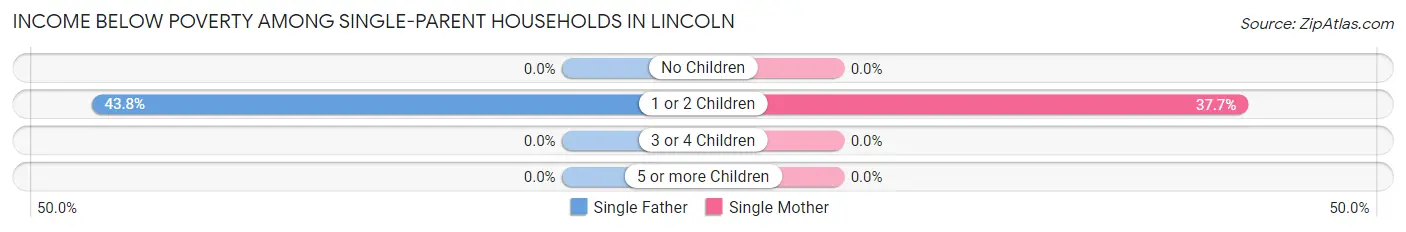
| Children | Single Father | Single Mother |
| No Children | 0 (0.0%) | 0 (0.0%) |
| 1 or 2 Children | 7 (43.8%) | 29 (37.7%) |
| 3 or 4 Children | 0 (0.0%) | 0 (0.0%) |
| 5 or more Children | 0 (0.0%) | 0 (0.0%) |
| Total | 7 (17.9%) | 29 (15.3%) |
Income Below Poverty Among Married-Couple vs Single-Parent Households in Lincoln
The poverty data for Lincoln shows that 60 of the married-couple family households (13.2%) and 36 of the single-parent households (15.7%) are living below the poverty level. Within the married-couple family households, those with 5 or more children have the highest poverty rate, with 9 households (100.0%) falling below the poverty line. Among the single-parent households, those with 1 or 2 children have the highest poverty rate, with 36 household (38.7%) living below poverty.
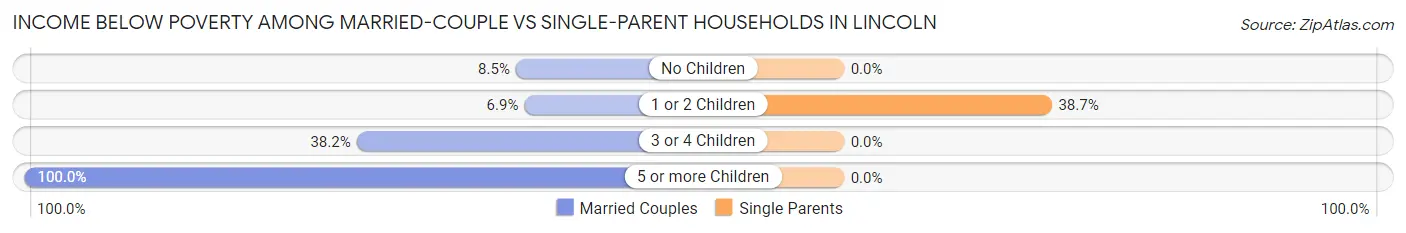
| Children | Married-Couple Families | Single-Parent Households |
| No Children | 15 (8.5%) | 0 (0.0%) |
| 1 or 2 Children | 15 (6.9%) | 36 (38.7%) |
| 3 or 4 Children | 21 (38.2%) | 0 (0.0%) |
| 5 or more Children | 9 (100.0%) | 0 (0.0%) |
| Total | 60 (13.2%) | 36 (15.7%) |
Race in Lincoln
The most populous races in Lincoln are White / Caucasian (1,952 | 70.9%), Two or more Races (613 | 22.3%), and Hispanic or Latino (278 | 10.1%).
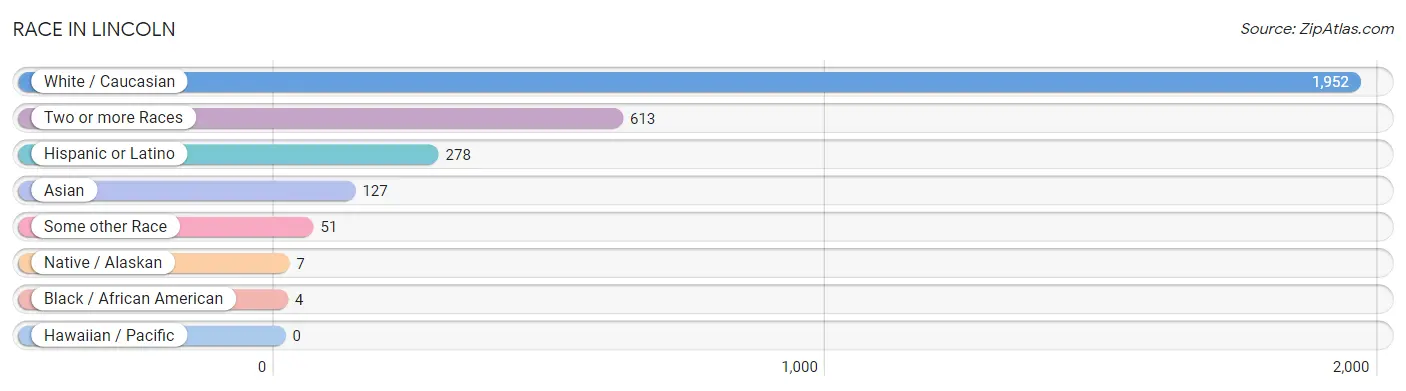
| Race | # Population | % Population |
| Asian | 127 | 4.6% |
| Black / African American | 4 | 0.2% |
| Hawaiian / Pacific | 0 | 0.0% |
| Hispanic or Latino | 278 | 10.1% |
| Native / Alaskan | 7 | 0.3% |
| White / Caucasian | 1,952 | 70.9% |
| Two or more Races | 613 | 22.3% |
| Some other Race | 51 | 1.8% |
| Total | 2,754 | 100.0% |
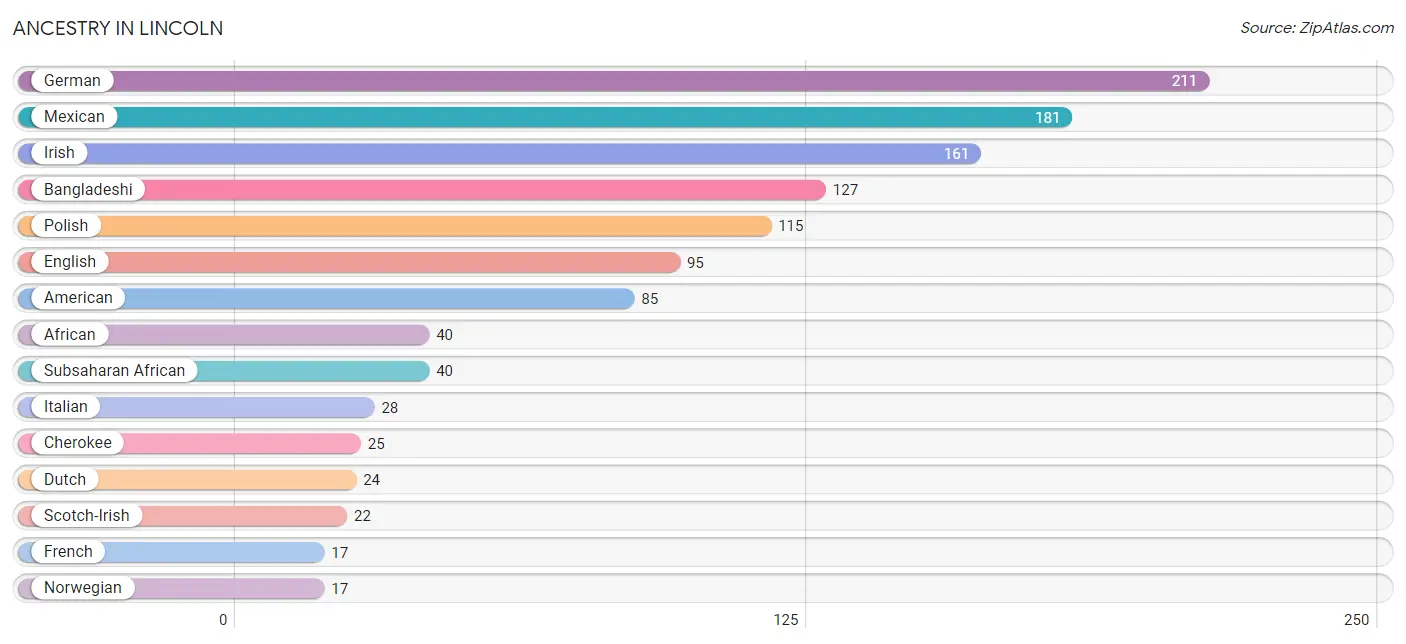
Ancestry in Lincoln
The most populous ancestries reported in Lincoln are German (211 | 7.7%), Mexican (181 | 6.6%), Irish (161 | 5.9%), Bangladeshi (127 | 4.6%), and Polish (115 | 4.2%), together accounting for 28.9% of all Lincoln residents.
| Ancestry | # Population | % Population |
| African | 40 | 1.5% |
| American | 85 | 3.1% |
| Arab | 15 | 0.5% |
| Bangladeshi | 127 | 4.6% |
| Cajun | 4 | 0.2% |
| Celtic | 5 | 0.2% |
| Central American | 5 | 0.2% |
| Cherokee | 25 | 0.9% |
| Dutch | 24 | 0.9% |
| English | 95 | 3.5% |
| European | 9 | 0.3% |
| French | 17 | 0.6% |
| German | 211 | 7.7% |
| Guatemalan | 5 | 0.2% |
| Irish | 161 | 5.9% |
| Italian | 28 | 1.0% |
| Lebanese | 15 | 0.5% |
| Mexican | 181 | 6.6% |
| Norwegian | 17 | 0.6% |
| Polish | 115 | 4.2% |
| Scandinavian | 17 | 0.6% |
| Scotch-Irish | 22 | 0.8% |
| Scottish | 10 | 0.4% |
| Spaniard | 4 | 0.2% |
| Subsaharan African | 40 | 1.5% |
| Swedish | 7 | 0.3% |
| Welsh | 4 | 0.2% | View All 27 Rows |
Immigrants in Lincoln
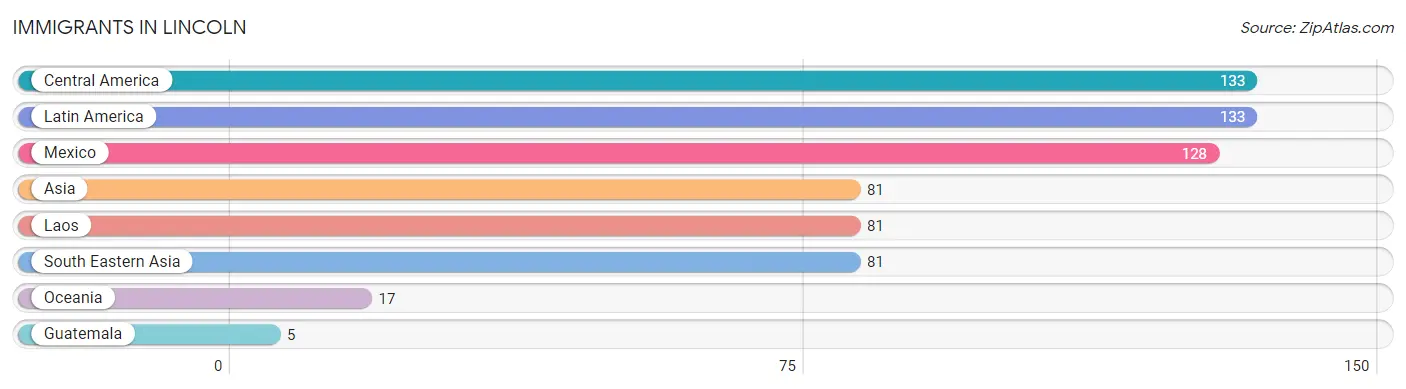
The most numerous immigrant groups reported in Lincoln came from Central America (133 | 4.8%), Latin America (133 | 4.8%), Mexico (128 | 4.6%), Asia (81 | 2.9%), and Laos (81 | 2.9%), together accounting for 20.2% of all Lincoln residents.
| Immigration Origin | # Population | % Population |
| Asia | 81 | 2.9% |
| Central America | 133 | 4.8% |
| Guatemala | 5 | 0.2% |
| Laos | 81 | 2.9% |
| Latin America | 133 | 4.8% |
| Mexico | 128 | 4.6% |
| Oceania | 17 | 0.6% |
| South Eastern Asia | 81 | 2.9% | View All 8 Rows |
Sex and Age in Lincoln
Sex and Age in Lincoln
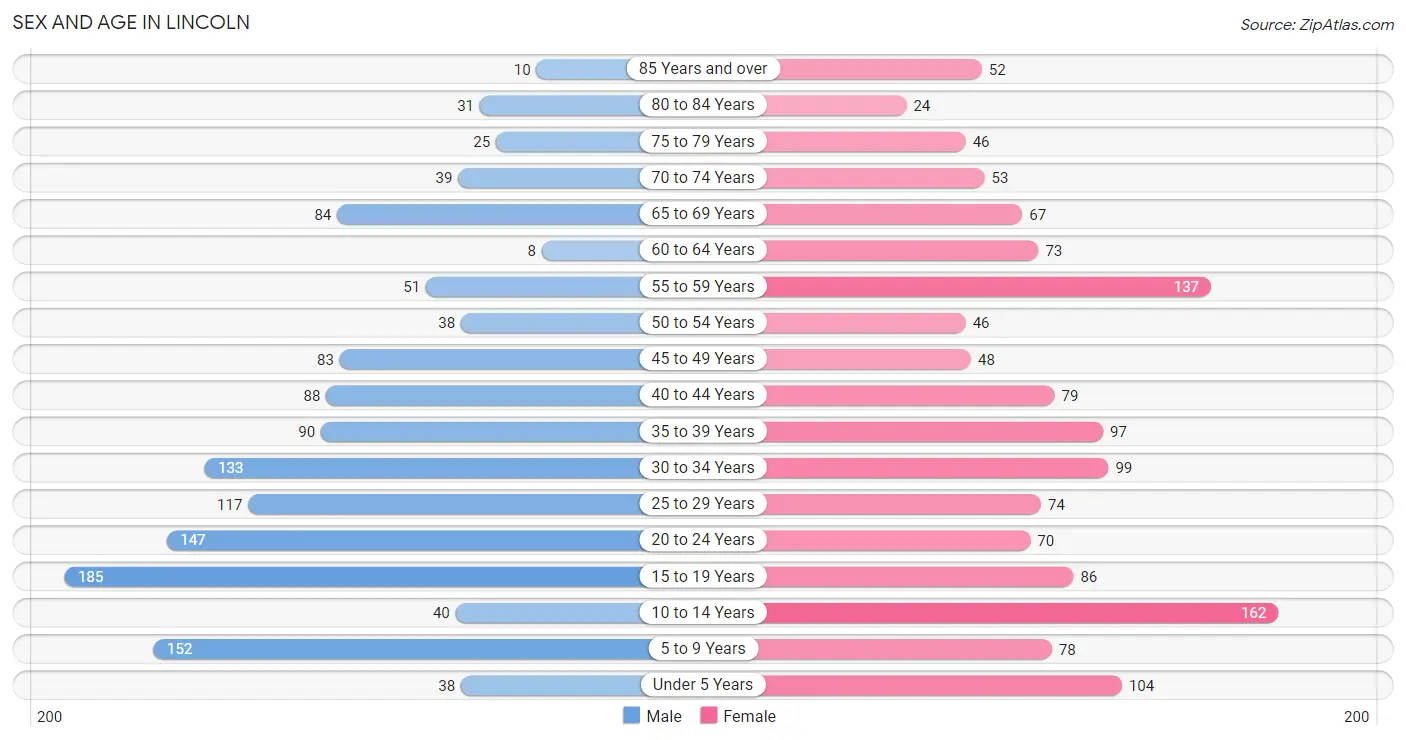
The most populous age groups in Lincoln are 15 to 19 Years (185 | 13.6%) for men and 10 to 14 Years (162 | 11.6%) for women.
| Age Bracket | Male | Female |
| Under 5 Years | 38 (2.8%) | 104 (7.5%) |
| 5 to 9 Years | 152 (11.2%) | 78 (5.6%) |
| 10 to 14 Years | 40 (2.9%) | 162 (11.6%) |
| 15 to 19 Years | 185 (13.6%) | 86 (6.2%) |
| 20 to 24 Years | 147 (10.8%) | 70 (5.0%) |
| 25 to 29 Years | 117 (8.6%) | 74 (5.3%) |
| 30 to 34 Years | 133 (9.8%) | 99 (7.1%) |
| 35 to 39 Years | 90 (6.6%) | 97 (7.0%) |
| 40 to 44 Years | 88 (6.5%) | 79 (5.7%) |
| 45 to 49 Years | 83 (6.1%) | 48 (3.4%) |
| 50 to 54 Years | 38 (2.8%) | 46 (3.3%) |
| 55 to 59 Years | 51 (3.7%) | 137 (9.8%) |
| 60 to 64 Years | 8 (0.6%) | 73 (5.2%) |
| 65 to 69 Years | 84 (6.2%) | 67 (4.8%) |
| 70 to 74 Years | 39 (2.9%) | 53 (3.8%) |
| 75 to 79 Years | 25 (1.8%) | 46 (3.3%) |
| 80 to 84 Years | 31 (2.3%) | 24 (1.7%) |
| 85 Years and over | 10 (0.7%) | 52 (3.7%) |
| Total | 1,359 (100.0%) | 1,395 (100.0%) |
Families and Households in Lincoln
Median Family Size in Lincoln
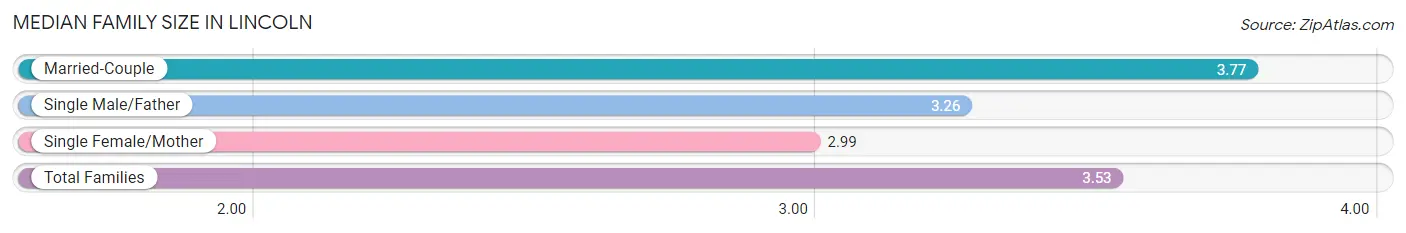
The median family size in Lincoln is 3.53 persons per family, with married-couple families (456 | 66.6%) accounting for the largest median family size of 3.77 persons per family. On the other hand, single female/mother families (190 | 27.7%) represent the smallest median family size with 2.99 persons per family.
| Family Type | # Families | Family Size |
| Married-Couple | 456 (66.6%) | 3.77 |
| Single Male/Father | 39 (5.7%) | 3.26 |
| Single Female/Mother | 190 (27.7%) | 2.99 |
| Total Families | 685 (100.0%) | 3.53 |
Median Household Size in Lincoln
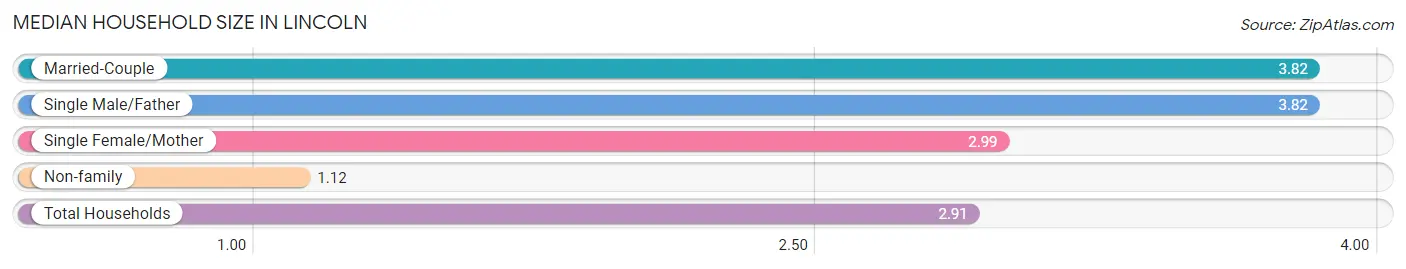
The median household size in Lincoln is 2.91 persons per household, with married-couple households (456 | 48.1%) accounting for the largest median household size of 3.82 persons per household. non-family households (263 | 27.7%) represent the smallest median household size with 1.12 persons per household.
| Household Type | # Households | Household Size |
| Married-Couple | 456 (48.1%) | 3.82 |
| Single Male/Father | 39 (4.1%) | 3.82 |
| Single Female/Mother | 190 (20.0%) | 2.99 |
| Non-family | 263 (27.7%) | 1.12 |
| Total Households | 948 (100.0%) | 2.91 |
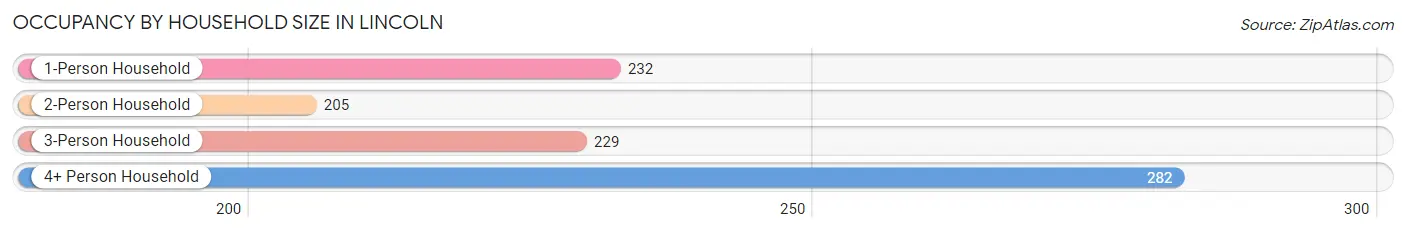
Household Size by Marriage Status in Lincoln
Out of a total of 948 households in Lincoln, 685 (72.3%) are family households, while 263 (27.7%) are nonfamily households. The most numerous type of family households are 3-person households, comprising 229, and the most common type of nonfamily households are 1-person households, comprising 232.
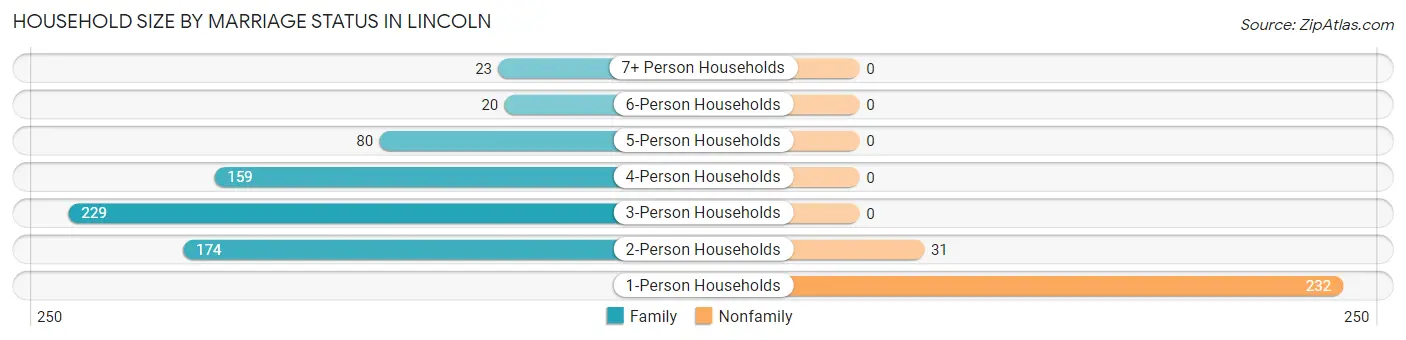
| Household Size | Family Households | Nonfamily Households |
| 1-Person Households | - | 232 (24.5%) |
| 2-Person Households | 174 (18.3%) | 31 (3.3%) |
| 3-Person Households | 229 (24.2%) | 0 (0.0%) |
| 4-Person Households | 159 (16.8%) | 0 (0.0%) |
| 5-Person Households | 80 (8.4%) | 0 (0.0%) |
| 6-Person Households | 20 (2.1%) | 0 (0.0%) |
| 7+ Person Households | 23 (2.4%) | 0 (0.0%) |
| Total | 685 (72.3%) | 263 (27.7%) |
Female Fertility in Lincoln
Fertility by Age in Lincoln
Average fertility rate in Lincoln is 75.0 births per 1,000 women. Women in the age bracket of 20 to 34 years have the highest fertility rate with 173.0 births per 1,000 women. Women in the age bracket of 20 to 34 years acount for 100.0% of all women with births.
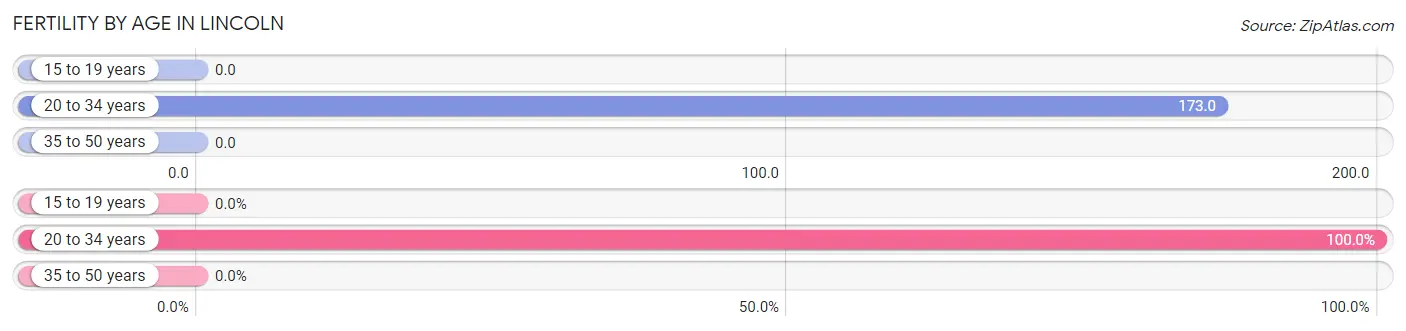
| Age Bracket | Women with Births | Births / 1,000 Women |
| 15 to 19 years | 0 (0.0%) | 0.0 |
| 20 to 34 years | 42 (100.0%) | 173.0 |
| 35 to 50 years | 0 (0.0%) | 0.0 |
| Total | 42 (100.0%) | 75.0 |
Fertility by Age by Marriage Status in Lincoln
81.0% of women with births (42) in Lincoln are married. The highest percentage of unmarried women with births falls into 20 to 34 years age bracket with 19.1% of them unmarried at the time of birth, while the lowest percentage of unmarried women with births belong to 20 to 34 years age bracket with 19.1% of them unmarried.
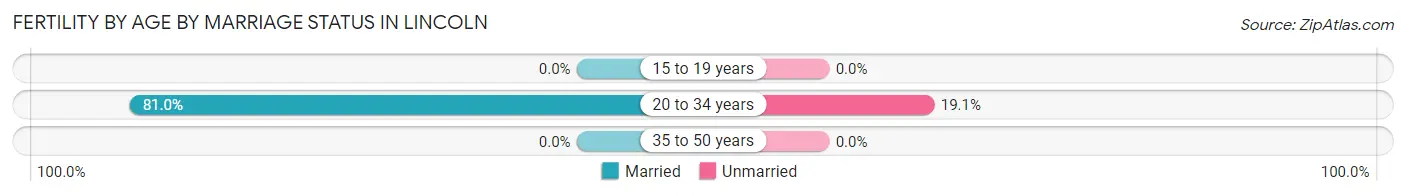
| Age Bracket | Married | Unmarried |
| 15 to 19 years | 0 (0.0%) | 0 (0.0%) |
| 20 to 34 years | 34 (80.9%) | 8 (19.1%) |
| 35 to 50 years | 0 (0.0%) | 0 (0.0%) |
| Total | 34 (80.9%) | 8 (19.1%) |
Fertility by Education in Lincoln
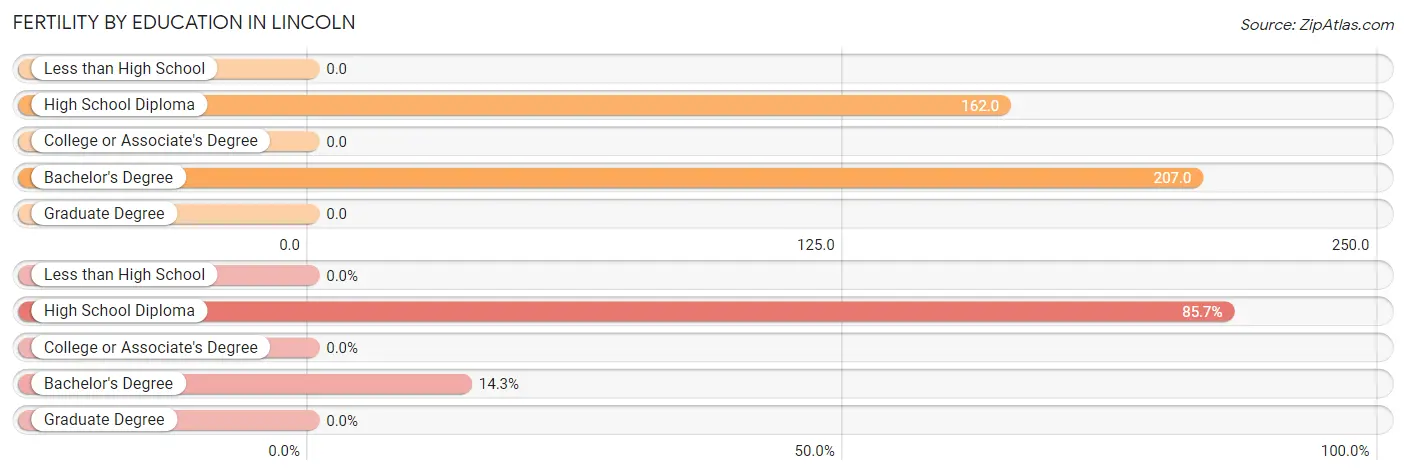
| Educational Attainment | Women with Births | Births / 1,000 Women |
| Less than High School | 0 (0.0%) | 0.0 |
| High School Diploma | 36 (85.7%) | 162.0 |
| College or Associate's Degree | 0 (0.0%) | 0.0 |
| Bachelor's Degree | 6 (14.3%) | 207.0 |
| Graduate Degree | 0 (0.0%) | 0.0 |
| Total | 42 (100.0%) | 75.0 |
Fertility by Education by Marriage Status in Lincoln
19.1% of women with births in Lincoln are unmarried. Women with the educational attainment of bachelor's degree are most likely to be married with 100.0% of them married at childbirth, while women with the educational attainment of high school diploma are least likely to be married with 22.2% of them unmarried at childbirth.
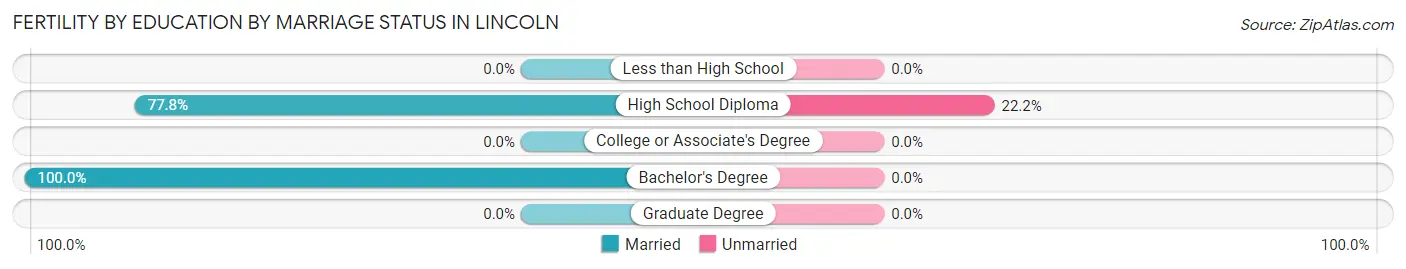
| Educational Attainment | Married | Unmarried |
| Less than High School | 0 (0.0%) | 0 (0.0%) |
| High School Diploma | 28 (77.8%) | 8 (22.2%) |
| College or Associate's Degree | 0 (0.0%) | 0 (0.0%) |
| Bachelor's Degree | 6 (100.0%) | 0 (0.0%) |
| Graduate Degree | 0 (0.0%) | 0 (0.0%) |
| Total | 34 (80.9%) | 8 (19.1%) |
Employment Characteristics in Lincoln
Employment by Class of Employer in Lincoln
Among the 1,069 employed individuals in Lincoln, private company employees (649 | 60.7%), local government employees (136 | 12.7%), and self-employed (not incorporated) (92 | 8.6%) make up the most common classes of employment.
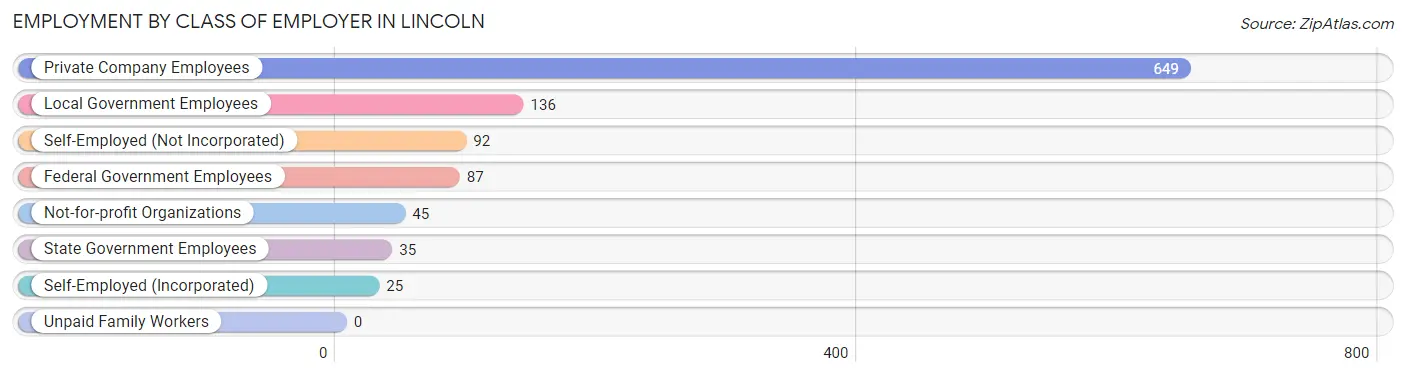
| Employer Class | # Employees | % Employees |
| Private Company Employees | 649 | 60.7% |
| Self-Employed (Incorporated) | 25 | 2.3% |
| Self-Employed (Not Incorporated) | 92 | 8.6% |
| Not-for-profit Organizations | 45 | 4.2% |
| Local Government Employees | 136 | 12.7% |
| State Government Employees | 35 | 3.3% |
| Federal Government Employees | 87 | 8.1% |
| Unpaid Family Workers | 0 | 0.0% |
| Total | 1,069 | 100.0% |
Employment Status by Age in Lincoln
According to the labor force statistics for Lincoln, out of the total population over 16 years of age (2,175), 51.2% or 1,114 individuals are in the labor force, with 4.1% or 46 of them unemployed. The age group with the highest labor force participation rate is 25 to 29 years, with 89.0% or 170 individuals in the labor force. Within the labor force, the 55 to 59 years age range has the highest percentage of unemployed individuals, with 22.9% or 19 of them being unemployed.
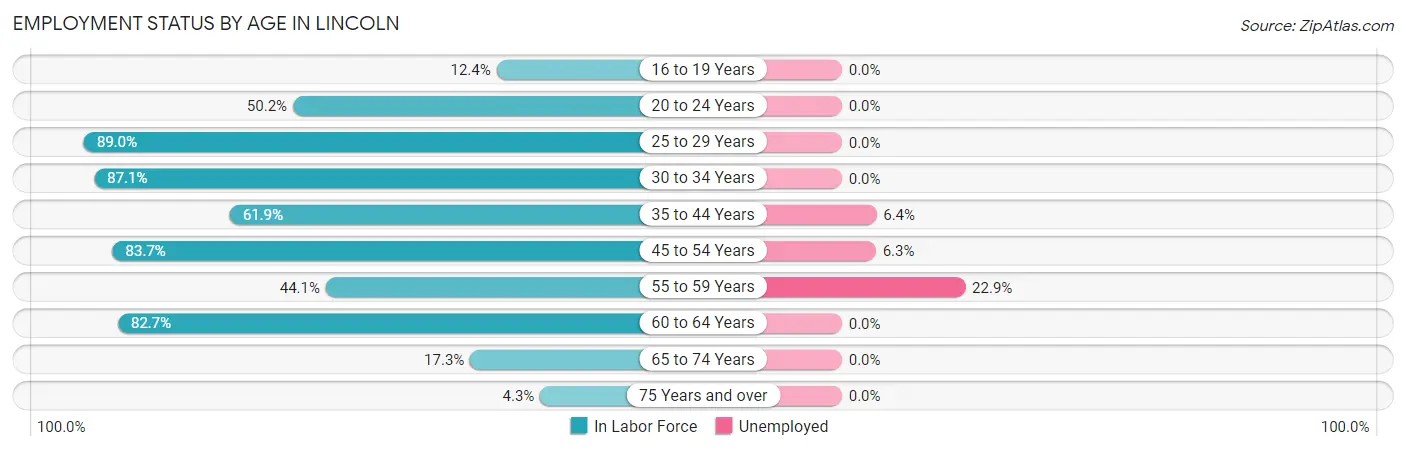
| Age Bracket | In Labor Force | Unemployed |
| 16 to 19 Years | 33 (12.4%) | 0 (0.0%) |
| 20 to 24 Years | 109 (50.2%) | 0 (0.0%) |
| 25 to 29 Years | 170 (89.0%) | 0 (0.0%) |
| 30 to 34 Years | 202 (87.1%) | 0 (0.0%) |
| 35 to 44 Years | 219 (61.9%) | 14 (6.4%) |
| 45 to 54 Years | 180 (83.7%) | 11 (6.3%) |
| 55 to 59 Years | 83 (44.1%) | 19 (22.9%) |
| 60 to 64 Years | 67 (82.7%) | 0 (0.0%) |
| 65 to 74 Years | 42 (17.3%) | 0 (0.0%) |
| 75 Years and over | 8 (4.3%) | 0 (0.0%) |
| Total | 1,114 (51.2%) | 46 (4.1%) |
Employment Status by Educational Attainment in Lincoln
According to labor force statistics for Lincoln, 73.0% of individuals (921) out of the total population between 25 and 64 years of age (1,261) are in the labor force, with 4.9% or 45 of them being unemployed. The group with the highest labor force participation rate are those with the educational attainment of bachelor's degree or higher, with 94.5% or 103 individuals in the labor force. Within the labor force, individuals with less than high school education have the highest percentage of unemployment, with 17.0% or 25 of them being unemployed.
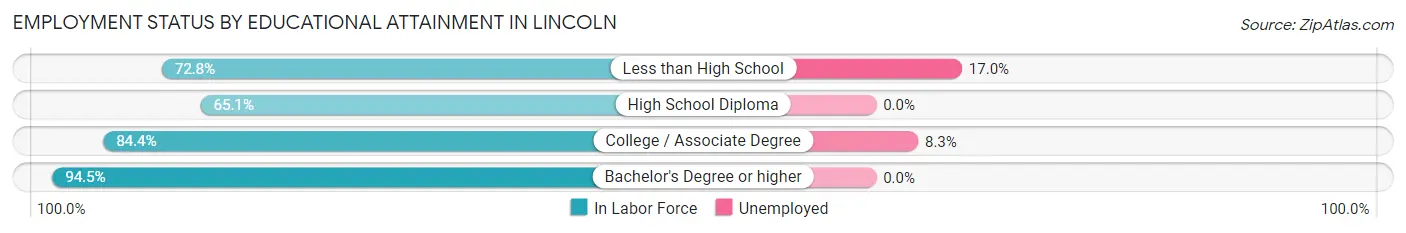
| Educational Attainment | In Labor Force | Unemployed |
| Less than High School | 147 (72.8%) | 34 (17.0%) |
| High School Diploma | 443 (65.1%) | 0 (0.0%) |
| College / Associate Degree | 228 (84.4%) | 22 (8.3%) |
| Bachelor's Degree or higher | 103 (94.5%) | 0 (0.0%) |
| Total | 921 (73.0%) | 62 (4.9%) |
Employment Occupations by Sex in Lincoln
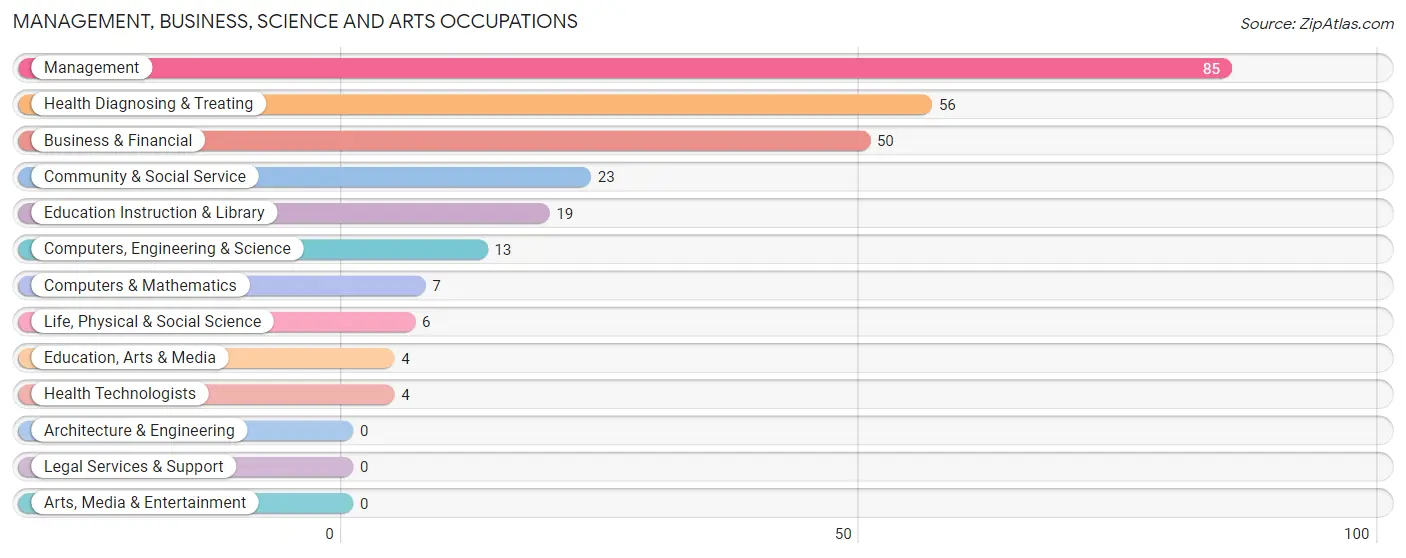
Management, Business, Science and Arts Occupations
The most common Management, Business, Science and Arts occupations in Lincoln are Management (85 | 8.2%), Health Diagnosing & Treating (56 | 5.4%), Business & Financial (50 | 4.8%), Community & Social Service (23 | 2.2%), and Education Instruction & Library (19 | 1.8%).
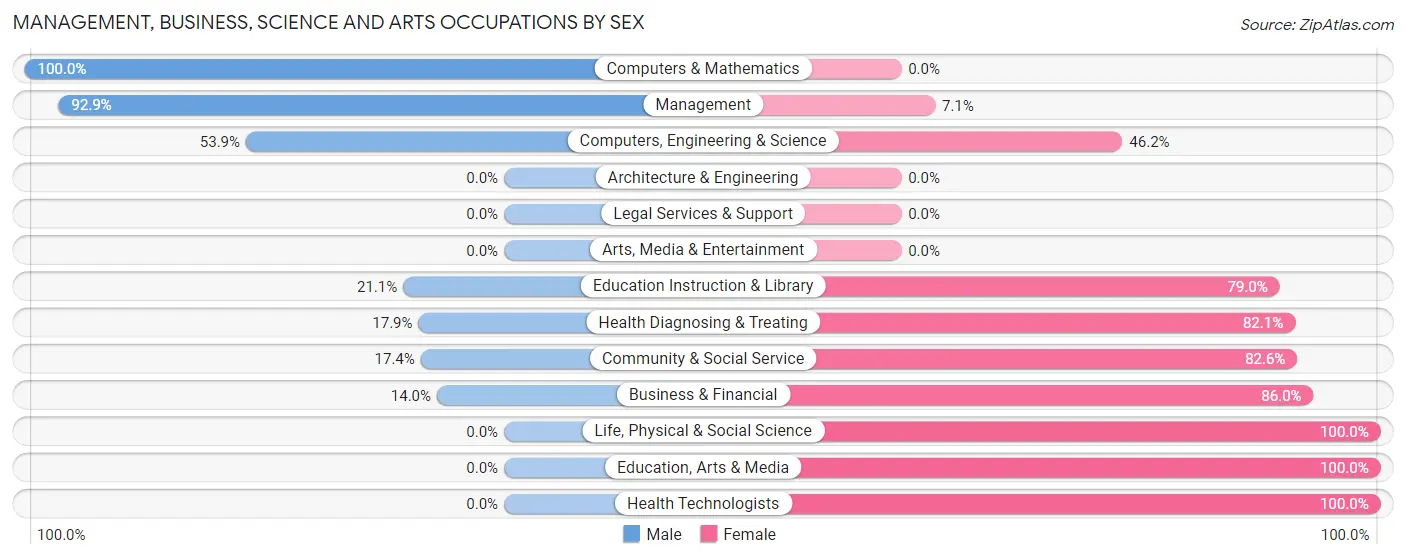
Management, Business, Science and Arts Occupations by Sex
Within the Management, Business, Science and Arts occupations in Lincoln, the most male-oriented occupations are Computers & Mathematics (100.0%), Management (92.9%), and Computers, Engineering & Science (53.8%), while the most female-oriented occupations are Life, Physical & Social Science (100.0%), Education, Arts & Media (100.0%), and Health Technologists (100.0%).
| Occupation | Male | Female |
| Management | 79 (92.9%) | 6 (7.1%) |
| Business & Financial | 7 (14.0%) | 43 (86.0%) |
| Computers, Engineering & Science | 7 (53.8%) | 6 (46.2%) |
| Computers & Mathematics | 7 (100.0%) | 0 (0.0%) |
| Architecture & Engineering | 0 (0.0%) | 0 (0.0%) |
| Life, Physical & Social Science | 0 (0.0%) | 6 (100.0%) |
| Community & Social Service | 4 (17.4%) | 19 (82.6%) |
| Education, Arts & Media | 0 (0.0%) | 4 (100.0%) |
| Legal Services & Support | 0 (0.0%) | 0 (0.0%) |
| Education Instruction & Library | 4 (21.0%) | 15 (78.9%) |
| Arts, Media & Entertainment | 0 (0.0%) | 0 (0.0%) |
| Health Diagnosing & Treating | 10 (17.9%) | 46 (82.1%) |
| Health Technologists | 0 (0.0%) | 4 (100.0%) |
| Total (Category) | 107 (47.1%) | 120 (52.9%) |
| Total (Overall) | 550 (52.9%) | 490 (47.1%) |
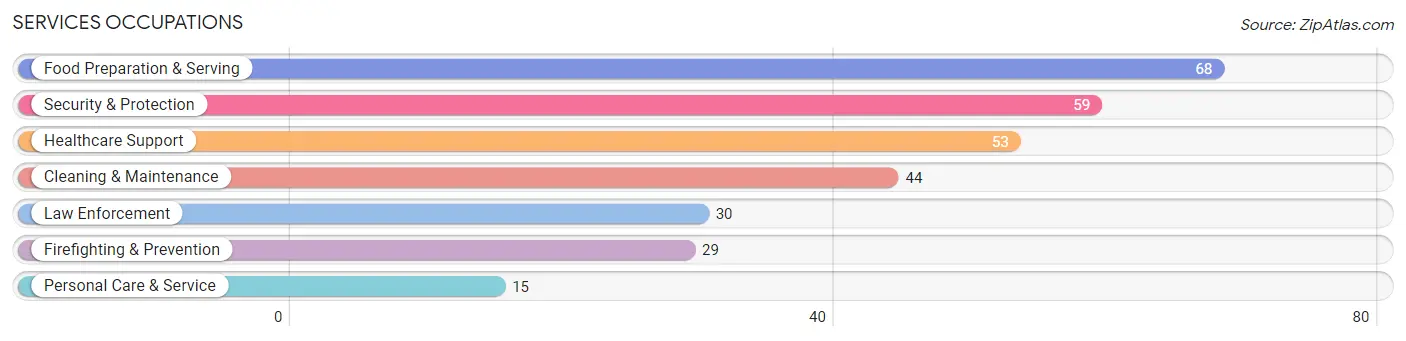
Services Occupations
The most common Services occupations in Lincoln are Food Preparation & Serving (68 | 6.5%), Security & Protection (59 | 5.7%), Healthcare Support (53 | 5.1%), Cleaning & Maintenance (44 | 4.2%), and Law Enforcement (30 | 2.9%).
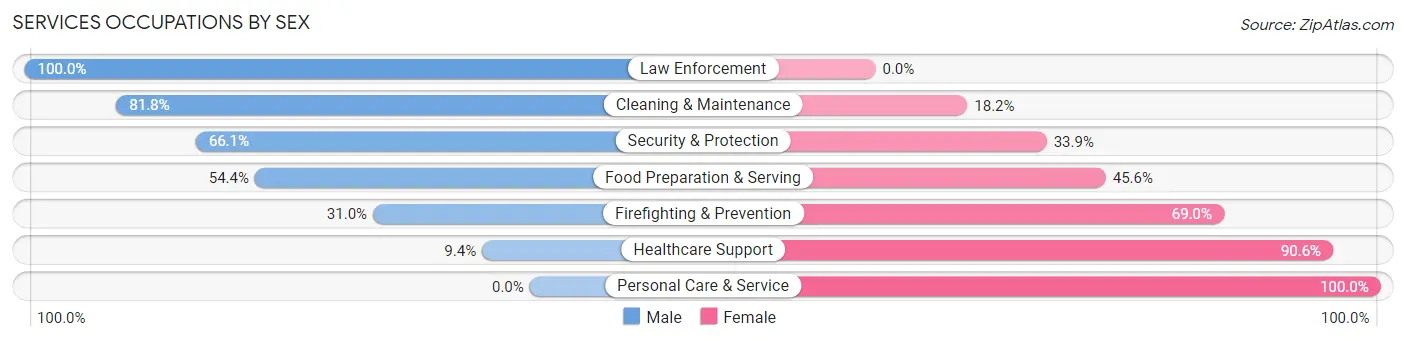
Services Occupations by Sex
Within the Services occupations in Lincoln, the most male-oriented occupations are Law Enforcement (100.0%), Cleaning & Maintenance (81.8%), and Security & Protection (66.1%), while the most female-oriented occupations are Personal Care & Service (100.0%), Healthcare Support (90.6%), and Firefighting & Prevention (69.0%).
| Occupation | Male | Female |
| Healthcare Support | 5 (9.4%) | 48 (90.6%) |
| Security & Protection | 39 (66.1%) | 20 (33.9%) |
| Firefighting & Prevention | 9 (31.0%) | 20 (69.0%) |
| Law Enforcement | 30 (100.0%) | 0 (0.0%) |
| Food Preparation & Serving | 37 (54.4%) | 31 (45.6%) |
| Cleaning & Maintenance | 36 (81.8%) | 8 (18.2%) |
| Personal Care & Service | 0 (0.0%) | 15 (100.0%) |
| Total (Category) | 117 (48.9%) | 122 (51.0%) |
| Total (Overall) | 550 (52.9%) | 490 (47.1%) |
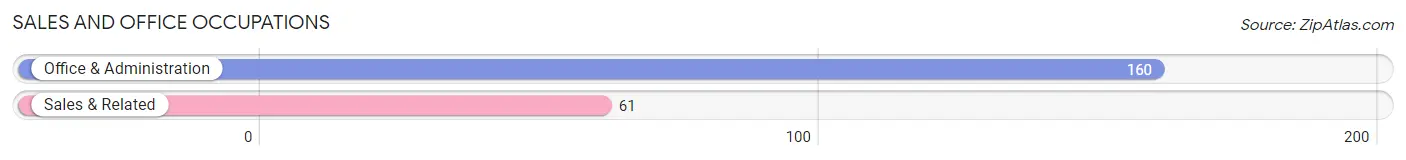
Sales and Office Occupations
The most common Sales and Office occupations in Lincoln are Office & Administration (160 | 15.4%), and Sales & Related (61 | 5.9%).
Sales and Office Occupations by Sex
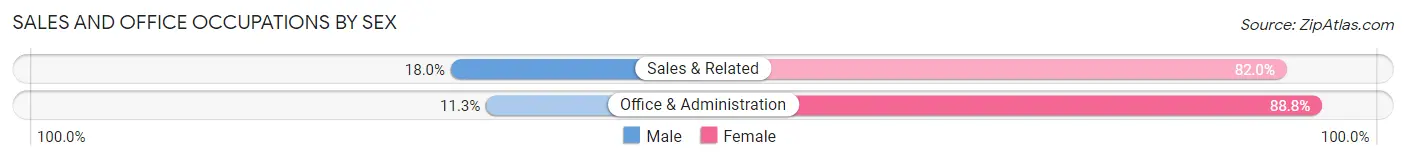
| Occupation | Male | Female |
| Sales & Related | 11 (18.0%) | 50 (82.0%) |
| Office & Administration | 18 (11.3%) | 142 (88.7%) |
| Total (Category) | 29 (13.1%) | 192 (86.9%) |
| Total (Overall) | 550 (52.9%) | 490 (47.1%) |
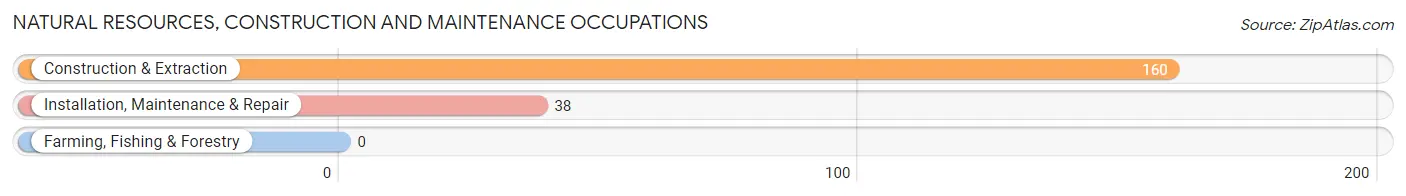
Natural Resources, Construction and Maintenance Occupations
The most common Natural Resources, Construction and Maintenance occupations in Lincoln are Construction & Extraction (160 | 15.4%), and Installation, Maintenance & Repair (38 | 3.6%).
Natural Resources, Construction and Maintenance Occupations by Sex
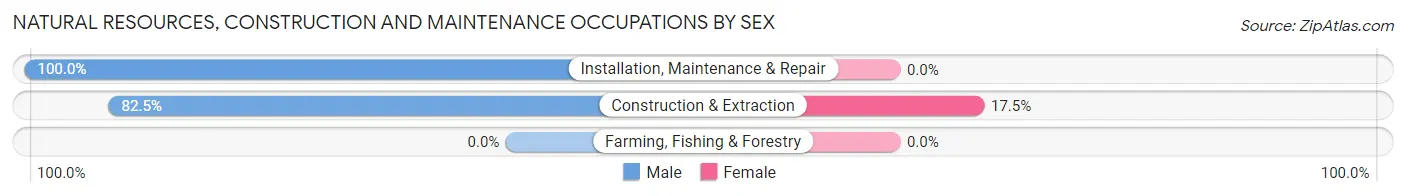
| Occupation | Male | Female |
| Farming, Fishing & Forestry | 0 (0.0%) | 0 (0.0%) |
| Construction & Extraction | 132 (82.5%) | 28 (17.5%) |
| Installation, Maintenance & Repair | 38 (100.0%) | 0 (0.0%) |
| Total (Category) | 170 (85.9%) | 28 (14.1%) |
| Total (Overall) | 550 (52.9%) | 490 (47.1%) |
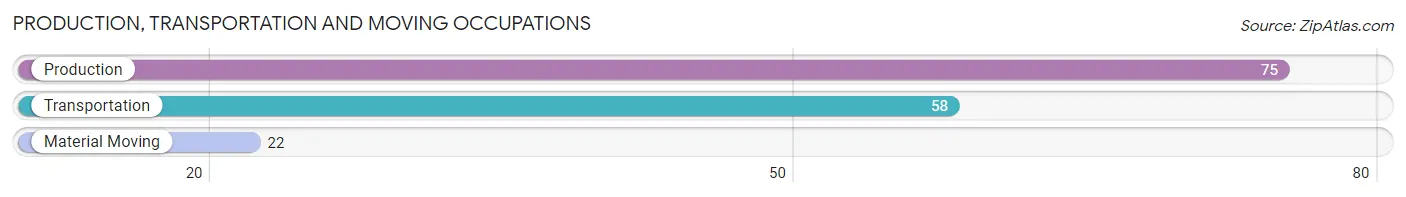
Production, Transportation and Moving Occupations
The most common Production, Transportation and Moving occupations in Lincoln are Production (75 | 7.2%), Transportation (58 | 5.6%), and Material Moving (22 | 2.1%).
Production, Transportation and Moving Occupations by Sex
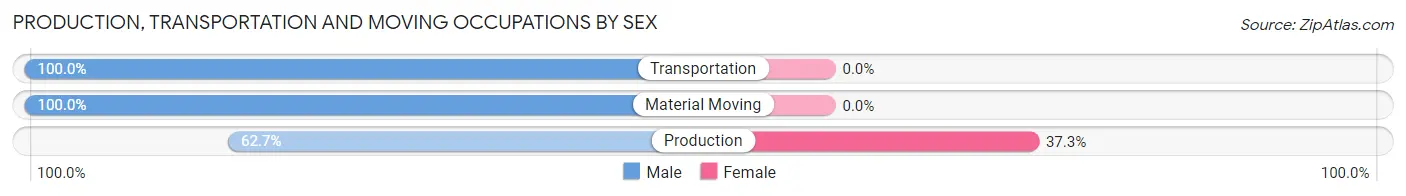
| Occupation | Male | Female |
| Production | 47 (62.7%) | 28 (37.3%) |
| Transportation | 58 (100.0%) | 0 (0.0%) |
| Material Moving | 22 (100.0%) | 0 (0.0%) |
| Total (Category) | 127 (81.9%) | 28 (18.1%) |
| Total (Overall) | 550 (52.9%) | 490 (47.1%) |
Employment Industries by Sex in Lincoln
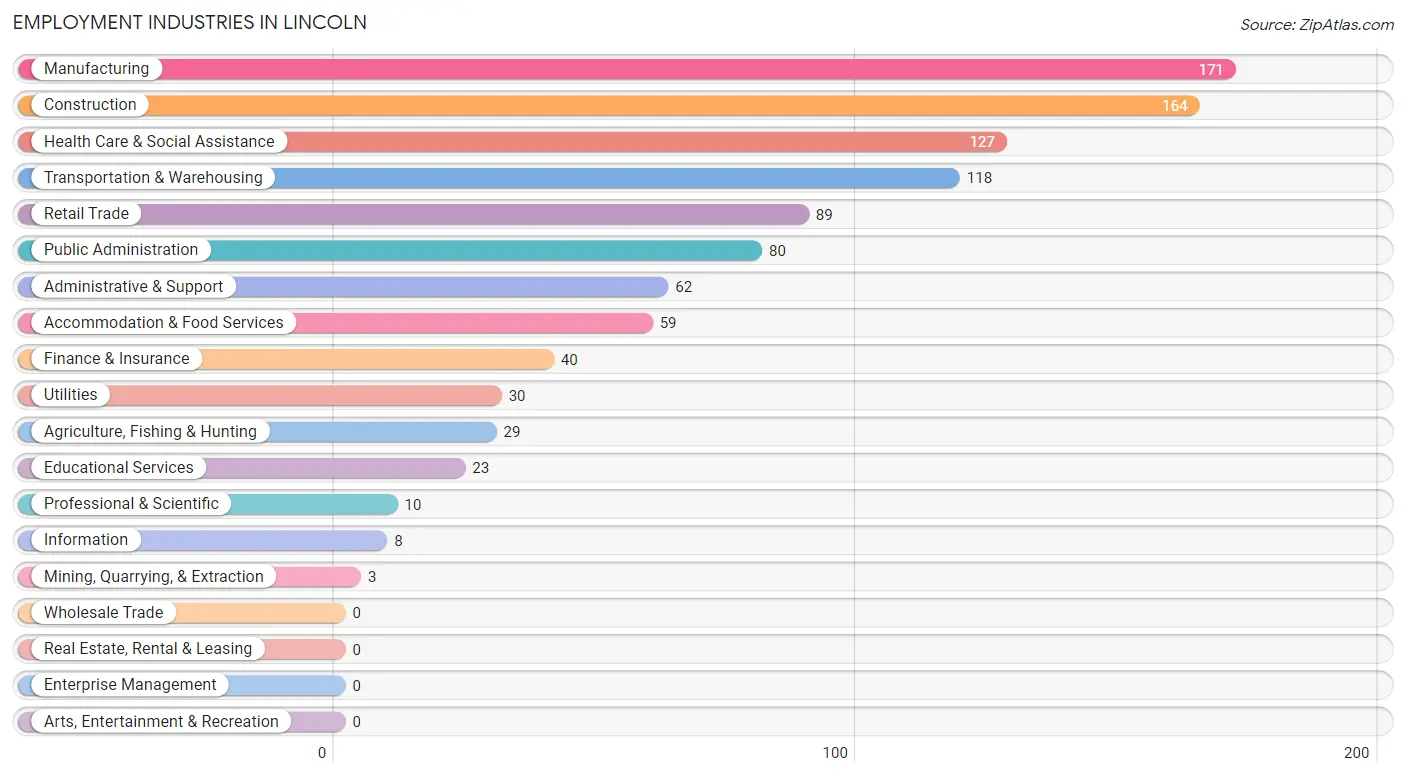
Employment Industries in Lincoln
The major employment industries in Lincoln include Manufacturing (171 | 16.4%), Construction (164 | 15.8%), Health Care & Social Assistance (127 | 12.2%), Transportation & Warehousing (118 | 11.4%), and Retail Trade (89 | 8.6%).
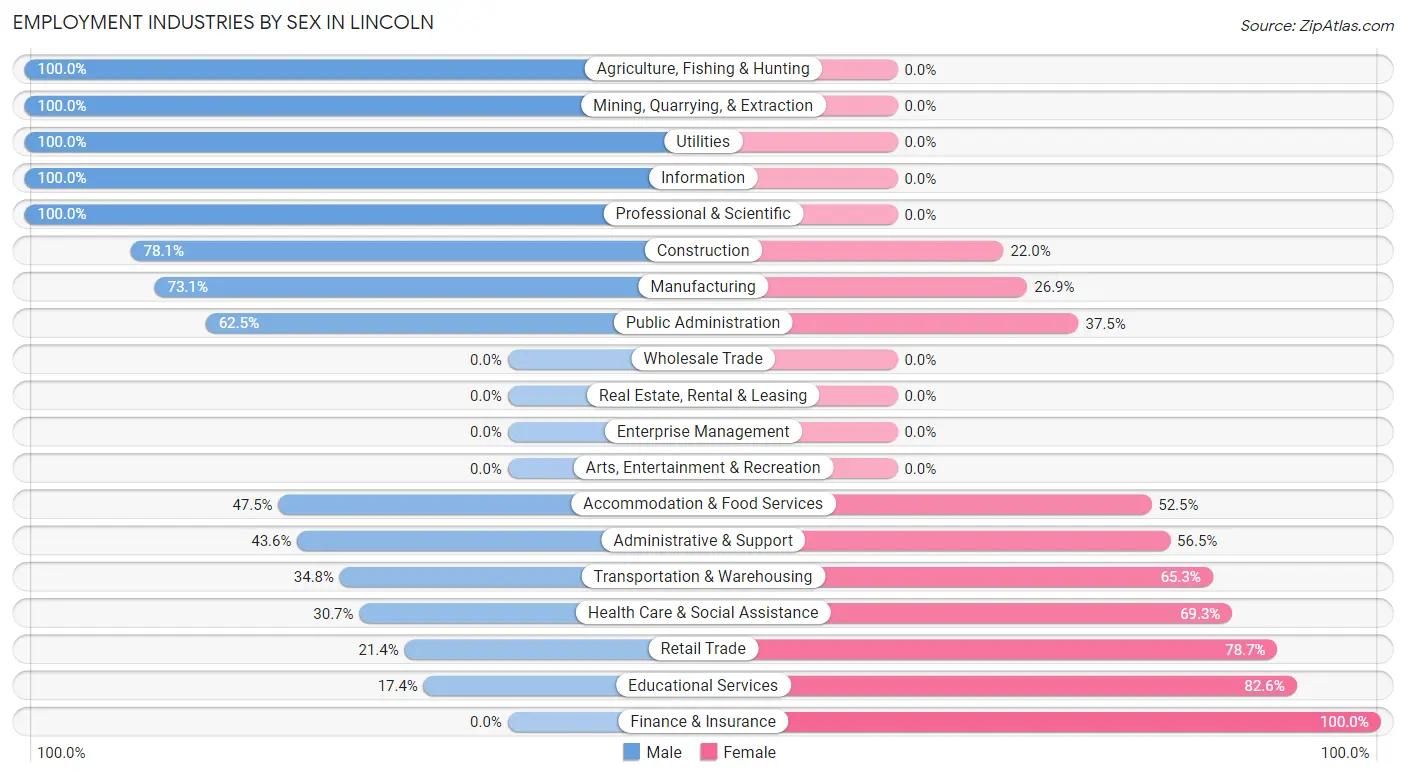
Employment Industries by Sex in Lincoln
The Lincoln industries that see more men than women are Agriculture, Fishing & Hunting (100.0%), Mining, Quarrying, & Extraction (100.0%), and Utilities (100.0%), whereas the industries that tend to have a higher number of women are Finance & Insurance (100.0%), Educational Services (82.6%), and Retail Trade (78.6%).
| Industry | Male | Female |
| Agriculture, Fishing & Hunting | 29 (100.0%) | 0 (0.0%) |
| Mining, Quarrying, & Extraction | 3 (100.0%) | 0 (0.0%) |
| Construction | 128 (78.0%) | 36 (22.0%) |
| Manufacturing | 125 (73.1%) | 46 (26.9%) |
| Wholesale Trade | 0 (0.0%) | 0 (0.0%) |
| Retail Trade | 19 (21.3%) | 70 (78.6%) |
| Transportation & Warehousing | 41 (34.7%) | 77 (65.2%) |
| Utilities | 30 (100.0%) | 0 (0.0%) |
| Information | 8 (100.0%) | 0 (0.0%) |
| Finance & Insurance | 0 (0.0%) | 40 (100.0%) |
| Real Estate, Rental & Leasing | 0 (0.0%) | 0 (0.0%) |
| Professional & Scientific | 10 (100.0%) | 0 (0.0%) |
| Enterprise Management | 0 (0.0%) | 0 (0.0%) |
| Administrative & Support | 27 (43.5%) | 35 (56.5%) |
| Educational Services | 4 (17.4%) | 19 (82.6%) |
| Health Care & Social Assistance | 39 (30.7%) | 88 (69.3%) |
| Arts, Entertainment & Recreation | 0 (0.0%) | 0 (0.0%) |
| Accommodation & Food Services | 28 (47.5%) | 31 (52.5%) |
| Public Administration | 50 (62.5%) | 30 (37.5%) |
| Total | 550 (52.9%) | 490 (47.1%) |
Education in Lincoln
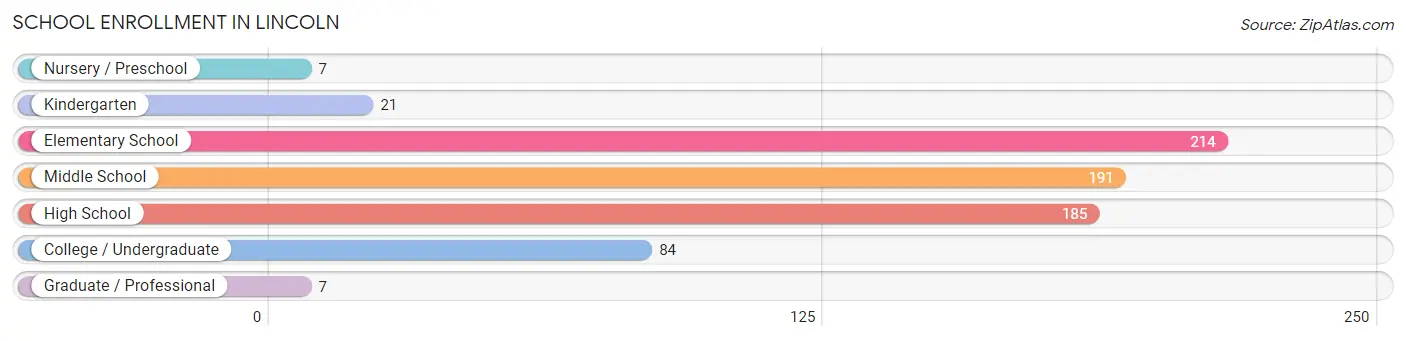
School Enrollment in Lincoln
The most common levels of schooling among the 709 students in Lincoln are elementary school (214 | 30.2%), middle school (191 | 26.9%), and high school (185 | 26.1%).
| School Level | # Students | % Students |
| Nursery / Preschool | 7 | 1.0% |
| Kindergarten | 21 | 3.0% |
| Elementary School | 214 | 30.2% |
| Middle School | 191 | 26.9% |
| High School | 185 | 26.1% |
| College / Undergraduate | 84 | 11.8% |
| Graduate / Professional | 7 | 1.0% |
| Total | 709 | 100.0% |
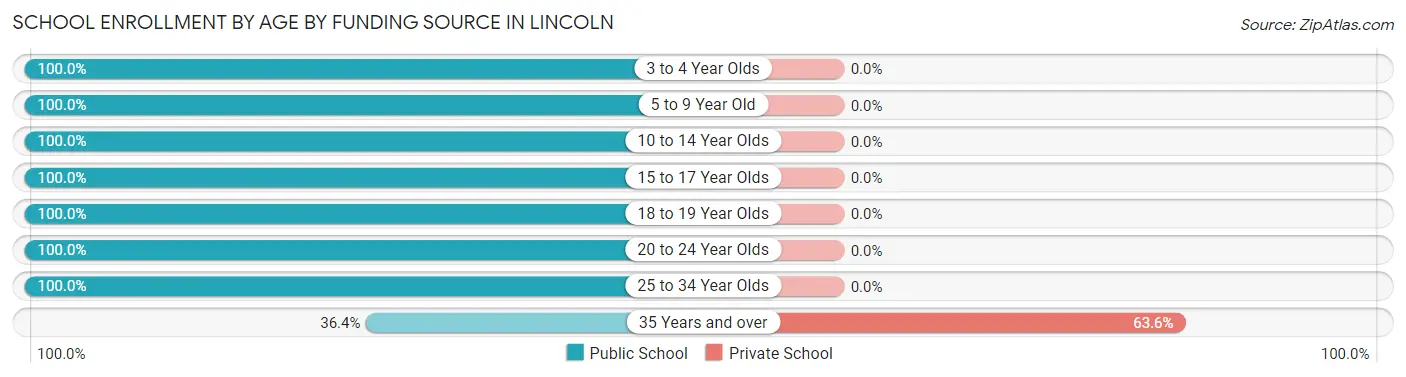
School Enrollment by Age by Funding Source in Lincoln
Out of a total of 709 students who are enrolled in schools in Lincoln, 7 (1.0%) attend a private institution, while the remaining 702 (99.0%) are enrolled in public schools. The age group of 35 years and over has the highest likelihood of being enrolled in private schools, with 7 (63.6% in the age bracket) enrolled. Conversely, the age group of 3 to 4 year olds has the lowest likelihood of being enrolled in a private school, with 7 (100.0% in the age bracket) attending a public institution.
| Age Bracket | Public School | Private School |
| 3 to 4 Year Olds | 7 (100.0%) | 0 (0.0%) |
| 5 to 9 Year Old | 224 (100.0%) | 0 (0.0%) |
| 10 to 14 Year Olds | 202 (100.0%) | 0 (0.0%) |
| 15 to 17 Year Olds | 147 (100.0%) | 0 (0.0%) |
| 18 to 19 Year Olds | 102 (100.0%) | 0 (0.0%) |
| 20 to 24 Year Olds | 8 (100.0%) | 0 (0.0%) |
| 25 to 34 Year Olds | 8 (100.0%) | 0 (0.0%) |
| 35 Years and over | 4 (36.4%) | 7 (63.6%) |
| Total | 702 (99.0%) | 7 (1.0%) |
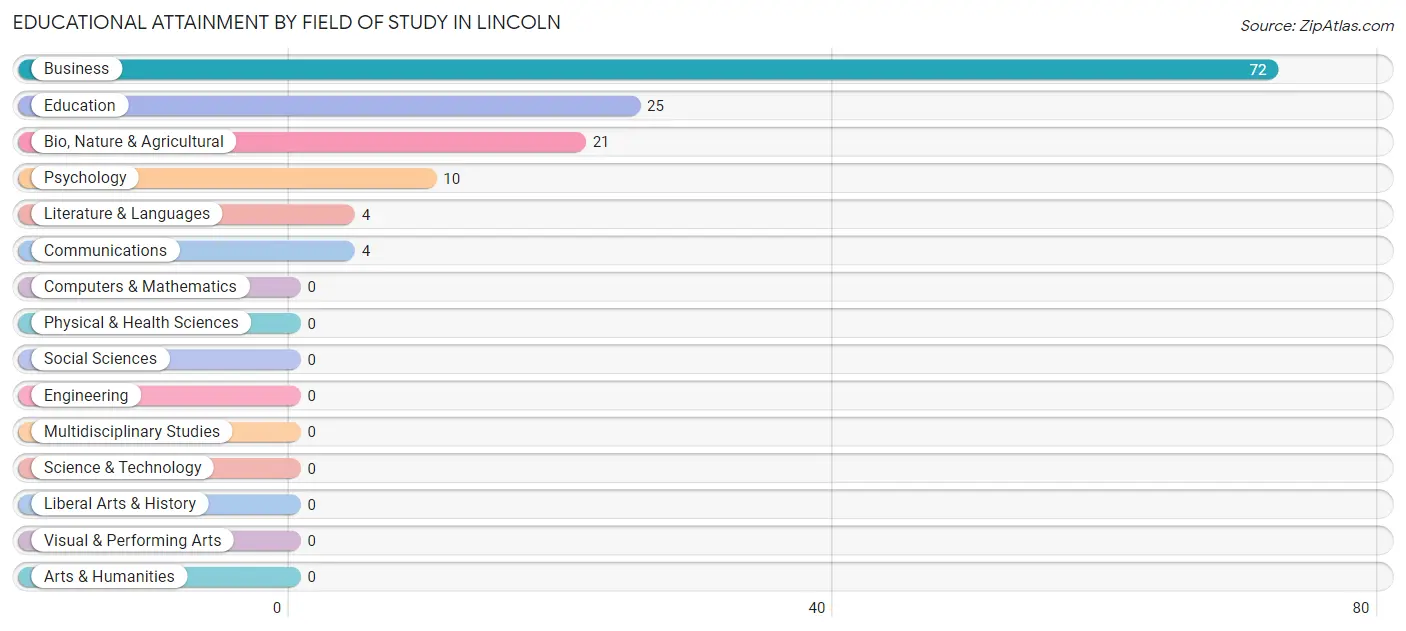
Educational Attainment by Field of Study in Lincoln
Business (72 | 52.9%), education (25 | 18.4%), bio, nature & agricultural (21 | 15.4%), psychology (10 | 7.3%), and literature & languages (4 | 2.9%) are the most common fields of study among 136 individuals in Lincoln who have obtained a bachelor's degree or higher.
| Field of Study | # Graduates | % Graduates |
| Computers & Mathematics | 0 | 0.0% |
| Bio, Nature & Agricultural | 21 | 15.4% |
| Physical & Health Sciences | 0 | 0.0% |
| Psychology | 10 | 7.3% |
| Social Sciences | 0 | 0.0% |
| Engineering | 0 | 0.0% |
| Multidisciplinary Studies | 0 | 0.0% |
| Science & Technology | 0 | 0.0% |
| Business | 72 | 52.9% |
| Education | 25 | 18.4% |
| Literature & Languages | 4 | 2.9% |
| Liberal Arts & History | 0 | 0.0% |
| Visual & Performing Arts | 0 | 0.0% |
| Communications | 4 | 2.9% |
| Arts & Humanities | 0 | 0.0% |
| Total | 136 | 100.0% |
Transportation & Commute in Lincoln
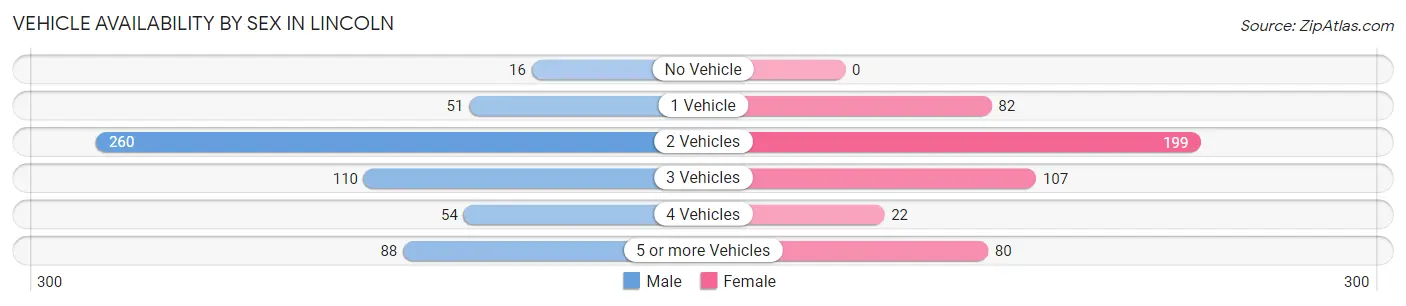
Vehicle Availability by Sex in Lincoln
The most prevalent vehicle ownership categories in Lincoln are males with 2 vehicles (260, accounting for 44.9%) and females with 2 vehicles (199, making up 53.1%).
| Vehicles Available | Male | Female |
| No Vehicle | 16 (2.8%) | 0 (0.0%) |
| 1 Vehicle | 51 (8.8%) | 82 (16.7%) |
| 2 Vehicles | 260 (44.9%) | 199 (40.6%) |
| 3 Vehicles | 110 (19.0%) | 107 (21.8%) |
| 4 Vehicles | 54 (9.3%) | 22 (4.5%) |
| 5 or more Vehicles | 88 (15.2%) | 80 (16.3%) |
| Total | 579 (100.0%) | 490 (100.0%) |
Commute Time in Lincoln
The most frequently occuring commute durations in Lincoln are 30 to 34 minutes (179 commuters, 17.5%), 20 to 24 minutes (154 commuters, 15.1%), and 10 to 14 minutes (140 commuters, 13.7%).
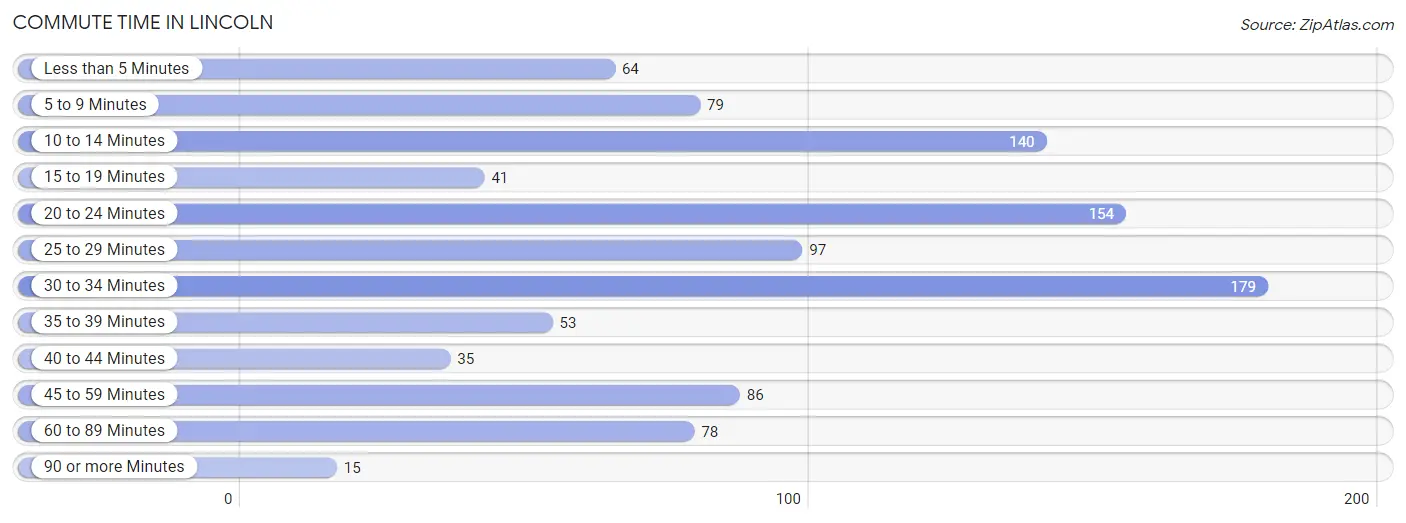
| Commute Time | # Commuters | % Commuters |
| Less than 5 Minutes | 64 | 6.3% |
| 5 to 9 Minutes | 79 | 7.7% |
| 10 to 14 Minutes | 140 | 13.7% |
| 15 to 19 Minutes | 41 | 4.0% |
| 20 to 24 Minutes | 154 | 15.1% |
| 25 to 29 Minutes | 97 | 9.5% |
| 30 to 34 Minutes | 179 | 17.5% |
| 35 to 39 Minutes | 53 | 5.2% |
| 40 to 44 Minutes | 35 | 3.4% |
| 45 to 59 Minutes | 86 | 8.4% |
| 60 to 89 Minutes | 78 | 7.6% |
| 90 or more Minutes | 15 | 1.5% |
Commute Time by Sex in Lincoln
The most common commute times in Lincoln are 30 to 34 minutes (129 commuters, 23.2%) for males and 20 to 24 minutes (88 commuters, 19.0%) for females.
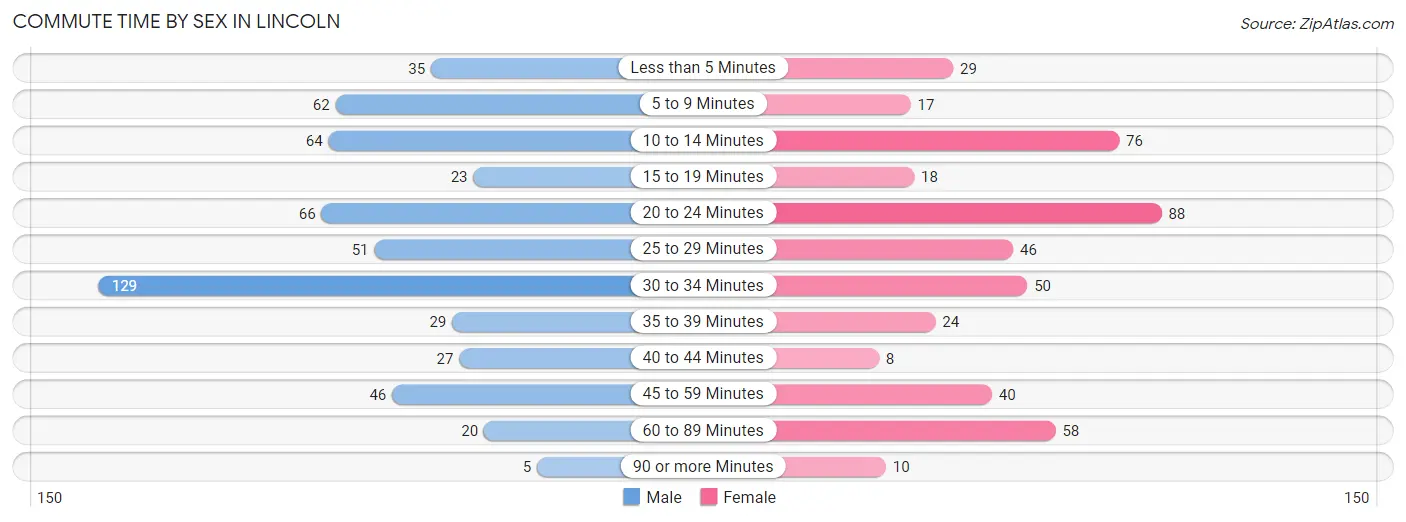
| Commute Time | Male | Female |
| Less than 5 Minutes | 35 (6.3%) | 29 (6.2%) |
| 5 to 9 Minutes | 62 (11.1%) | 17 (3.7%) |
| 10 to 14 Minutes | 64 (11.5%) | 76 (16.4%) |
| 15 to 19 Minutes | 23 (4.1%) | 18 (3.9%) |
| 20 to 24 Minutes | 66 (11.8%) | 88 (19.0%) |
| 25 to 29 Minutes | 51 (9.2%) | 46 (9.9%) |
| 30 to 34 Minutes | 129 (23.2%) | 50 (10.8%) |
| 35 to 39 Minutes | 29 (5.2%) | 24 (5.2%) |
| 40 to 44 Minutes | 27 (4.9%) | 8 (1.7%) |
| 45 to 59 Minutes | 46 (8.3%) | 40 (8.6%) |
| 60 to 89 Minutes | 20 (3.6%) | 58 (12.5%) |
| 90 or more Minutes | 5 (0.9%) | 10 (2.2%) |
Time of Departure to Work by Sex in Lincoln
The most frequent times of departure to work in Lincoln are 7:00 AM to 7:29 AM (110, 19.8%) for males and 7:00 AM to 7:29 AM (118, 25.4%) for females.
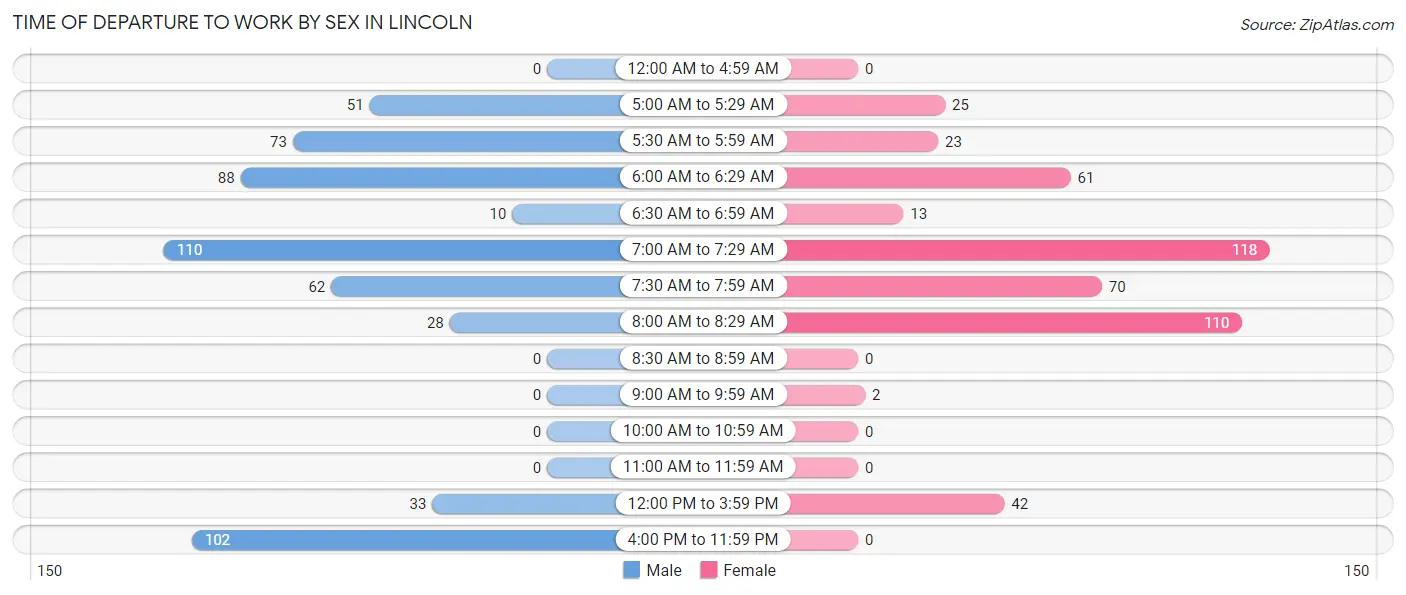
| Time of Departure | Male | Female |
| 12:00 AM to 4:59 AM | 0 (0.0%) | 0 (0.0%) |
| 5:00 AM to 5:29 AM | 51 (9.2%) | 25 (5.4%) |
| 5:30 AM to 5:59 AM | 73 (13.1%) | 23 (5.0%) |
| 6:00 AM to 6:29 AM | 88 (15.8%) | 61 (13.2%) |
| 6:30 AM to 6:59 AM | 10 (1.8%) | 13 (2.8%) |
| 7:00 AM to 7:29 AM | 110 (19.8%) | 118 (25.4%) |
| 7:30 AM to 7:59 AM | 62 (11.1%) | 70 (15.1%) |
| 8:00 AM to 8:29 AM | 28 (5.0%) | 110 (23.7%) |
| 8:30 AM to 8:59 AM | 0 (0.0%) | 0 (0.0%) |
| 9:00 AM to 9:59 AM | 0 (0.0%) | 2 (0.4%) |
| 10:00 AM to 10:59 AM | 0 (0.0%) | 0 (0.0%) |
| 11:00 AM to 11:59 AM | 0 (0.0%) | 0 (0.0%) |
| 12:00 PM to 3:59 PM | 33 (5.9%) | 42 (9.0%) |
| 4:00 PM to 11:59 PM | 102 (18.3%) | 0 (0.0%) |
| Total | 557 (100.0%) | 464 (100.0%) |
Housing Occupancy in Lincoln
Occupancy by Ownership in Lincoln
Of the total 948 dwellings in Lincoln, owner-occupied units account for 560 (59.1%), while renter-occupied units make up 388 (40.9%).
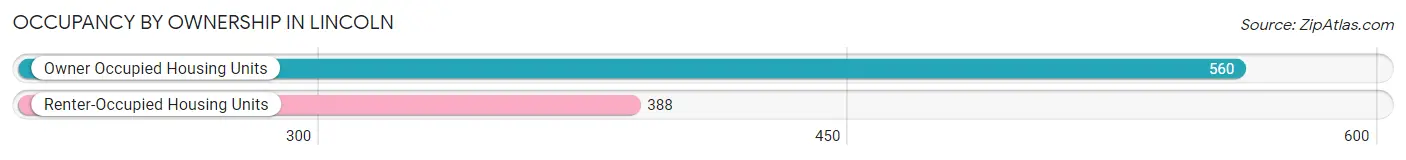
| Occupancy | # Housing Units | % Housing Units |
| Owner Occupied Housing Units | 560 | 59.1% |
| Renter-Occupied Housing Units | 388 | 40.9% |
| Total Occupied Housing Units | 948 | 100.0% |
Occupancy by Household Size in Lincoln
| Household Size | # Housing Units | % Housing Units |
| 1-Person Household | 232 | 24.5% |
| 2-Person Household | 205 | 21.6% |
| 3-Person Household | 229 | 24.2% |
| 4+ Person Household | 282 | 29.7% |
| Total Housing Units | 948 | 100.0% |
Occupancy by Ownership by Household Size in Lincoln
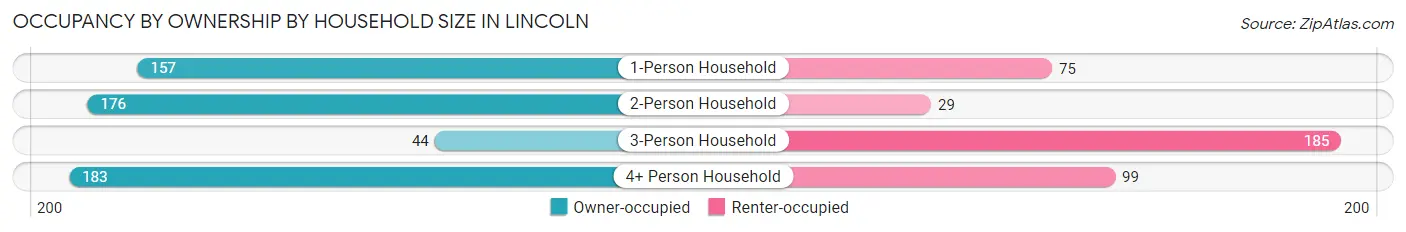
| Household Size | Owner-occupied | Renter-occupied |
| 1-Person Household | 157 (67.7%) | 75 (32.3%) |
| 2-Person Household | 176 (85.9%) | 29 (14.1%) |
| 3-Person Household | 44 (19.2%) | 185 (80.8%) |
| 4+ Person Household | 183 (64.9%) | 99 (35.1%) |
| Total Housing Units | 560 (59.1%) | 388 (40.9%) |
Occupancy by Educational Attainment in Lincoln
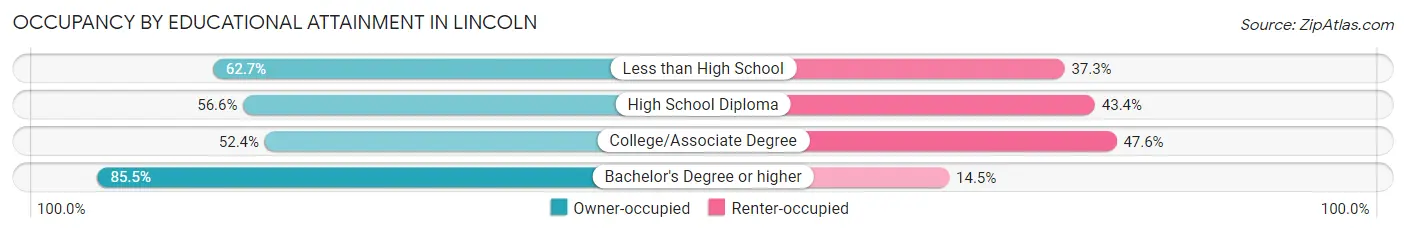
| Household Size | Owner-occupied | Renter-occupied |
| Less than High School | 94 (62.7%) | 56 (37.3%) |
| High School Diploma | 273 (56.6%) | 209 (43.4%) |
| College/Associate Degree | 122 (52.4%) | 111 (47.6%) |
| Bachelor's Degree or higher | 71 (85.5%) | 12 (14.5%) |
Occupancy by Age of Householder in Lincoln
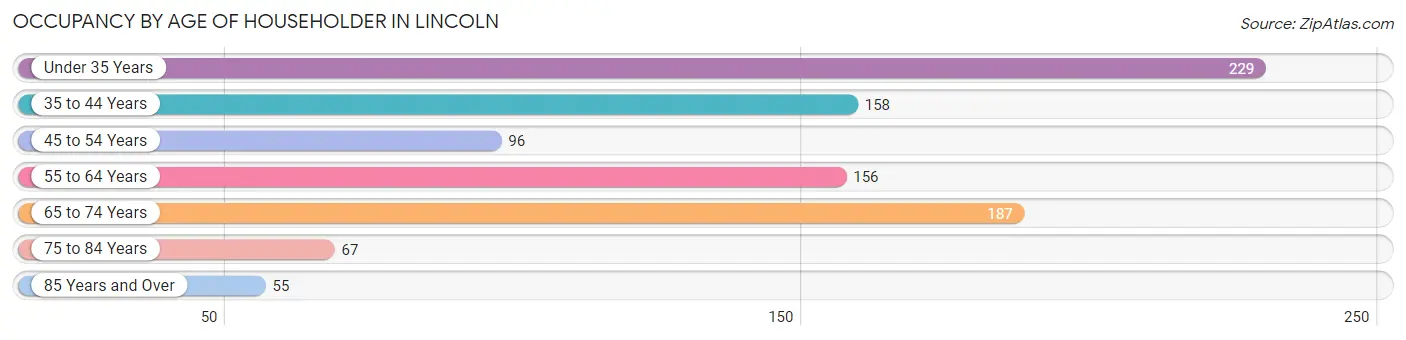
| Age Bracket | # Households | % Households |
| Under 35 Years | 229 | 24.2% |
| 35 to 44 Years | 158 | 16.7% |
| 45 to 54 Years | 96 | 10.1% |
| 55 to 64 Years | 156 | 16.5% |
| 65 to 74 Years | 187 | 19.7% |
| 75 to 84 Years | 67 | 7.1% |
| 85 Years and Over | 55 | 5.8% |
| Total | 948 | 100.0% |
Housing Finances in Lincoln
Median Income by Occupancy in Lincoln
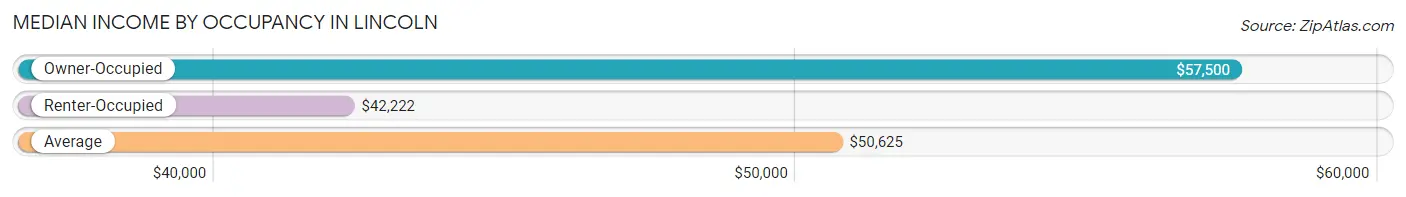
| Occupancy Type | # Households | Median Income |
| Owner-Occupied | 560 (59.1%) | $57,500 |
| Renter-Occupied | 388 (40.9%) | $42,222 |
| Average | 948 (100.0%) | $50,625 |
Occupancy by Householder Income Bracket in Lincoln
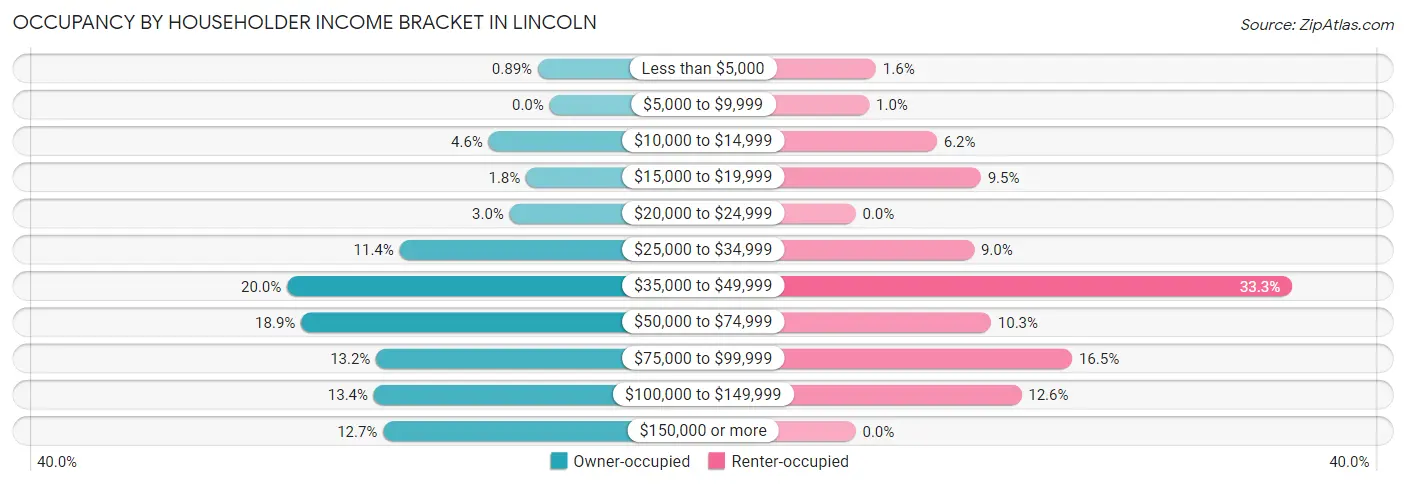
| Income Bracket | Owner-occupied | Renter-occupied |
| Less than $5,000 | 5 (0.9%) | 6 (1.5%) |
| $5,000 to $9,999 | 0 (0.0%) | 4 (1.0%) |
| $10,000 to $14,999 | 26 (4.6%) | 24 (6.2%) |
| $15,000 to $19,999 | 10 (1.8%) | 37 (9.5%) |
| $20,000 to $24,999 | 17 (3.0%) | 0 (0.0%) |
| $25,000 to $34,999 | 64 (11.4%) | 35 (9.0%) |
| $35,000 to $49,999 | 112 (20.0%) | 129 (33.3%) |
| $50,000 to $74,999 | 106 (18.9%) | 40 (10.3%) |
| $75,000 to $99,999 | 74 (13.2%) | 64 (16.5%) |
| $100,000 to $149,999 | 75 (13.4%) | 49 (12.6%) |
| $150,000 or more | 71 (12.7%) | 0 (0.0%) |
| Total | 560 (100.0%) | 388 (100.0%) |
Monthly Housing Cost Tiers in Lincoln
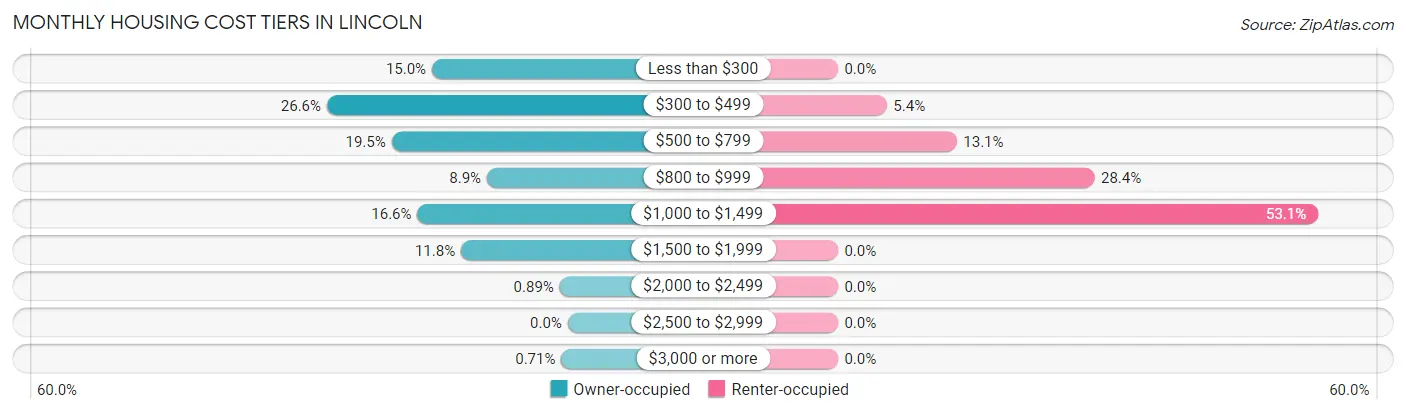
| Monthly Cost | Owner-occupied | Renter-occupied |
| Less than $300 | 84 (15.0%) | 0 (0.0%) |
| $300 to $499 | 149 (26.6%) | 21 (5.4%) |
| $500 to $799 | 109 (19.5%) | 51 (13.1%) |
| $800 to $999 | 50 (8.9%) | 110 (28.3%) |
| $1,000 to $1,499 | 93 (16.6%) | 206 (53.1%) |
| $1,500 to $1,999 | 66 (11.8%) | 0 (0.0%) |
| $2,000 to $2,499 | 5 (0.9%) | 0 (0.0%) |
| $2,500 to $2,999 | 0 (0.0%) | 0 (0.0%) |
| $3,000 or more | 4 (0.7%) | 0 (0.0%) |
| Total | 560 (100.0%) | 388 (100.0%) |
Physical Housing Characteristics in Lincoln
Housing Structures in Lincoln
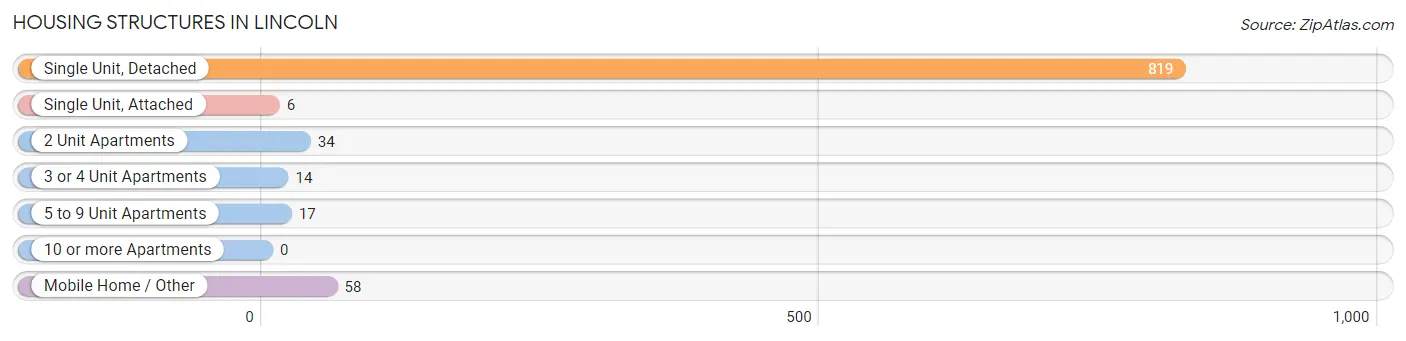
| Structure Type | # Housing Units | % Housing Units |
| Single Unit, Detached | 819 | 86.4% |
| Single Unit, Attached | 6 | 0.6% |
| 2 Unit Apartments | 34 | 3.6% |
| 3 or 4 Unit Apartments | 14 | 1.5% |
| 5 to 9 Unit Apartments | 17 | 1.8% |
| 10 or more Apartments | 0 | 0.0% |
| Mobile Home / Other | 58 | 6.1% |
| Total | 948 | 100.0% |
Housing Structures by Occupancy in Lincoln
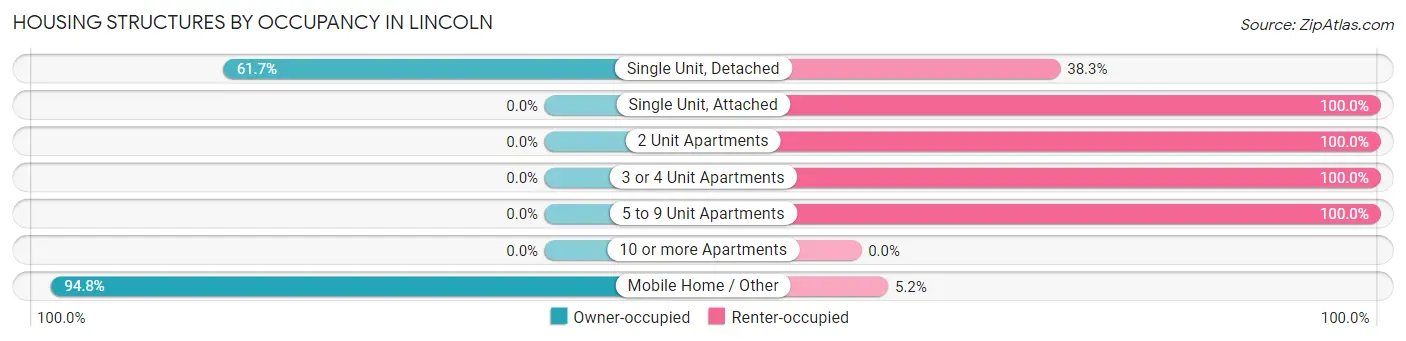
| Structure Type | Owner-occupied | Renter-occupied |
| Single Unit, Detached | 505 (61.7%) | 314 (38.3%) |
| Single Unit, Attached | 0 (0.0%) | 6 (100.0%) |
| 2 Unit Apartments | 0 (0.0%) | 34 (100.0%) |
| 3 or 4 Unit Apartments | 0 (0.0%) | 14 (100.0%) |
| 5 to 9 Unit Apartments | 0 (0.0%) | 17 (100.0%) |
| 10 or more Apartments | 0 (0.0%) | 0 (0.0%) |
| Mobile Home / Other | 55 (94.8%) | 3 (5.2%) |
| Total | 560 (59.1%) | 388 (40.9%) |
Housing Structures by Number of Rooms in Lincoln
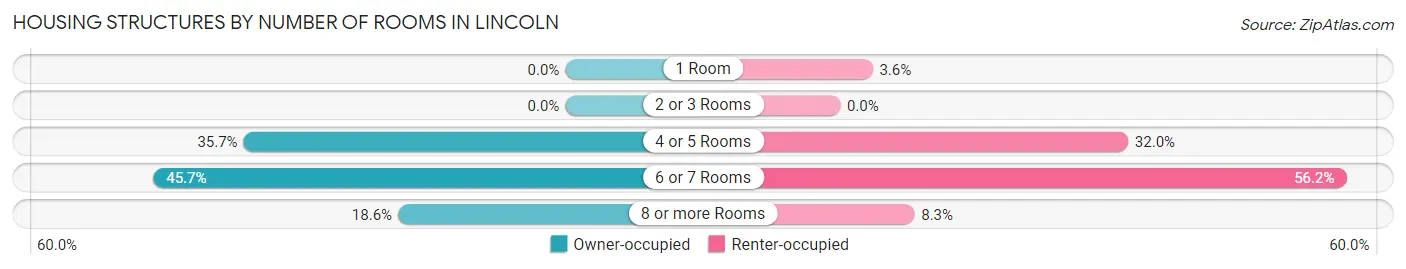
| Number of Rooms | Owner-occupied | Renter-occupied |
| 1 Room | 0 (0.0%) | 14 (3.6%) |
| 2 or 3 Rooms | 0 (0.0%) | 0 (0.0%) |
| 4 or 5 Rooms | 200 (35.7%) | 124 (32.0%) |
| 6 or 7 Rooms | 256 (45.7%) | 218 (56.2%) |
| 8 or more Rooms | 104 (18.6%) | 32 (8.3%) |
| Total | 560 (100.0%) | 388 (100.0%) |
Housing Structure by Heating Type in Lincoln
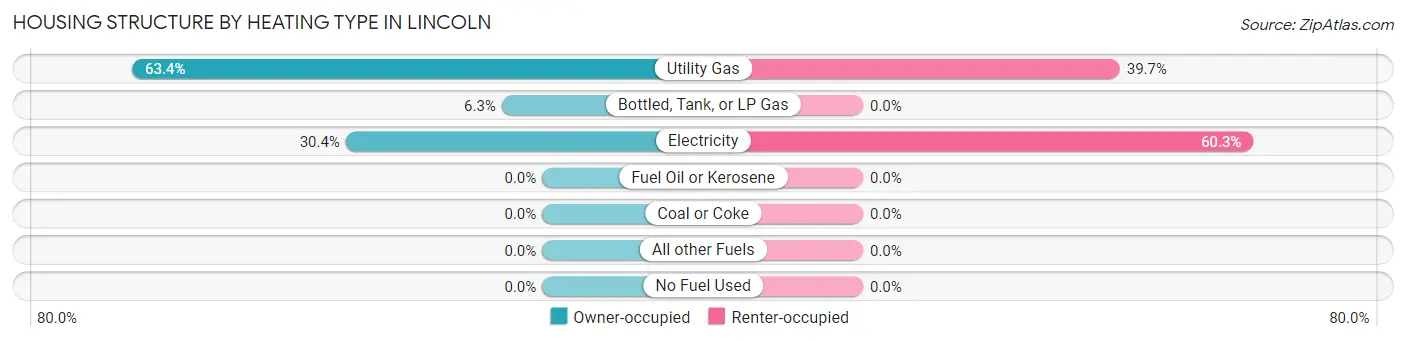
| Heating Type | Owner-occupied | Renter-occupied |
| Utility Gas | 355 (63.4%) | 154 (39.7%) |
| Bottled, Tank, or LP Gas | 35 (6.2%) | 0 (0.0%) |
| Electricity | 170 (30.4%) | 234 (60.3%) |
| Fuel Oil or Kerosene | 0 (0.0%) | 0 (0.0%) |
| Coal or Coke | 0 (0.0%) | 0 (0.0%) |
| All other Fuels | 0 (0.0%) | 0 (0.0%) |
| No Fuel Used | 0 (0.0%) | 0 (0.0%) |
| Total | 560 (100.0%) | 388 (100.0%) |
Household Vehicle Usage in Lincoln
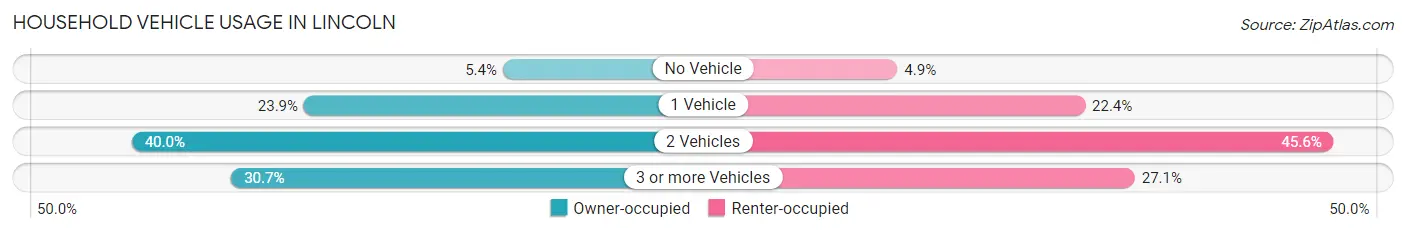
| Vehicles per Household | Owner-occupied | Renter-occupied |
| No Vehicle | 30 (5.4%) | 19 (4.9%) |
| 1 Vehicle | 134 (23.9%) | 87 (22.4%) |
| 2 Vehicles | 224 (40.0%) | 177 (45.6%) |
| 3 or more Vehicles | 172 (30.7%) | 105 (27.1%) |
| Total | 560 (100.0%) | 388 (100.0%) |
Real Estate & Mortgages in Lincoln
Real Estate and Mortgage Overview in Lincoln
| Characteristic | Without Mortgage | With Mortgage |
| Housing Units | 324 | 236 |
| Median Property Value | $127,400 | $151,600 |
| Median Household Income | $54,355 | $59 |
| Monthly Housing Costs | $395 | $0 |
| Real Estate Taxes | $559 | $22 |
Property Value by Mortgage Status in Lincoln
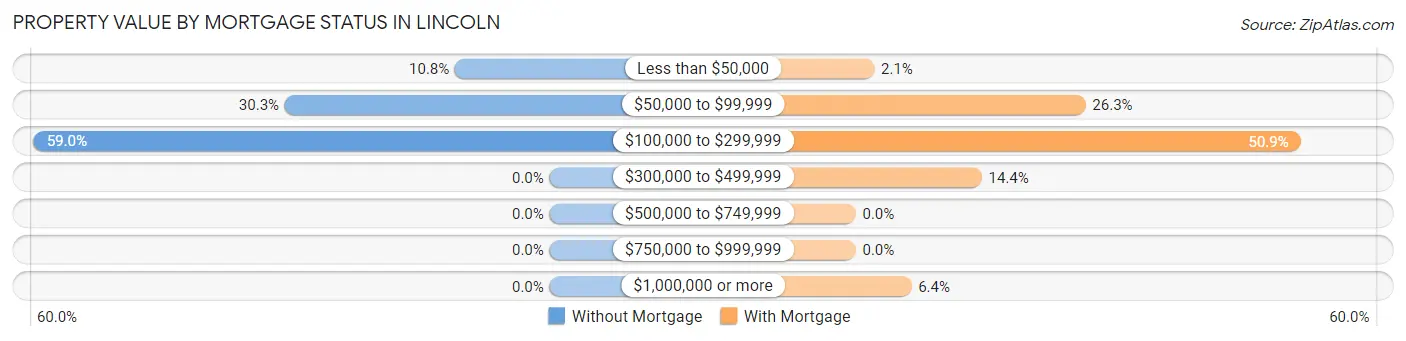
| Property Value | Without Mortgage | With Mortgage |
| Less than $50,000 | 35 (10.8%) | 5 (2.1%) |
| $50,000 to $99,999 | 98 (30.2%) | 62 (26.3%) |
| $100,000 to $299,999 | 191 (59.0%) | 120 (50.8%) |
| $300,000 to $499,999 | 0 (0.0%) | 34 (14.4%) |
| $500,000 to $749,999 | 0 (0.0%) | 0 (0.0%) |
| $750,000 to $999,999 | 0 (0.0%) | 0 (0.0%) |
| $1,000,000 or more | 0 (0.0%) | 15 (6.4%) |
| Total | 324 (100.0%) | 236 (100.0%) |
Household Income by Mortgage Status in Lincoln
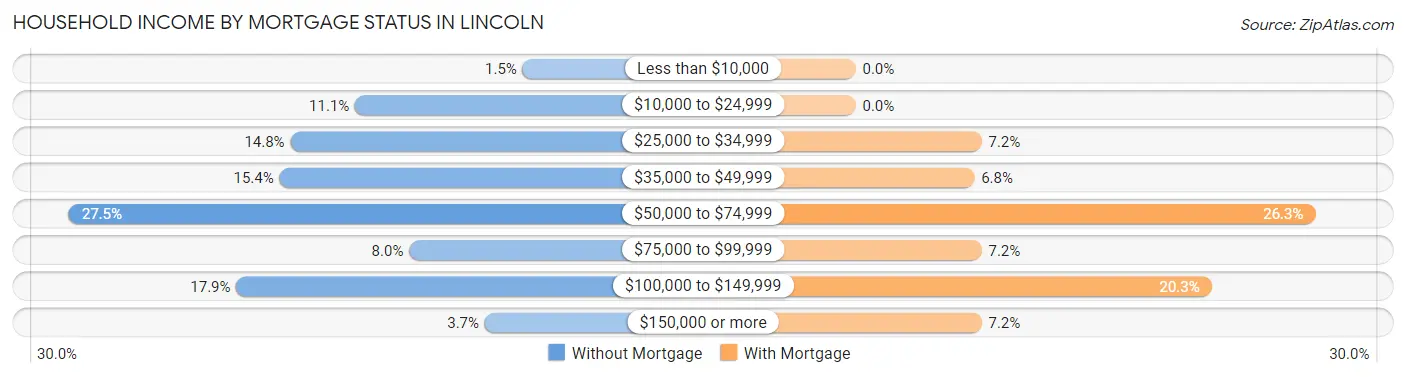
| Household Income | Without Mortgage | With Mortgage |
| Less than $10,000 | 5 (1.5%) | 0 (0.0%) |
| $10,000 to $24,999 | 36 (11.1%) | 0 (0.0%) |
| $25,000 to $34,999 | 48 (14.8%) | 17 (7.2%) |
| $35,000 to $49,999 | 50 (15.4%) | 16 (6.8%) |
| $50,000 to $74,999 | 89 (27.5%) | 62 (26.3%) |
| $75,000 to $99,999 | 26 (8.0%) | 17 (7.2%) |
| $100,000 to $149,999 | 58 (17.9%) | 48 (20.3%) |
| $150,000 or more | 12 (3.7%) | 17 (7.2%) |
| Total | 324 (100.0%) | 236 (100.0%) |
Property Value to Household Income Ratio in Lincoln
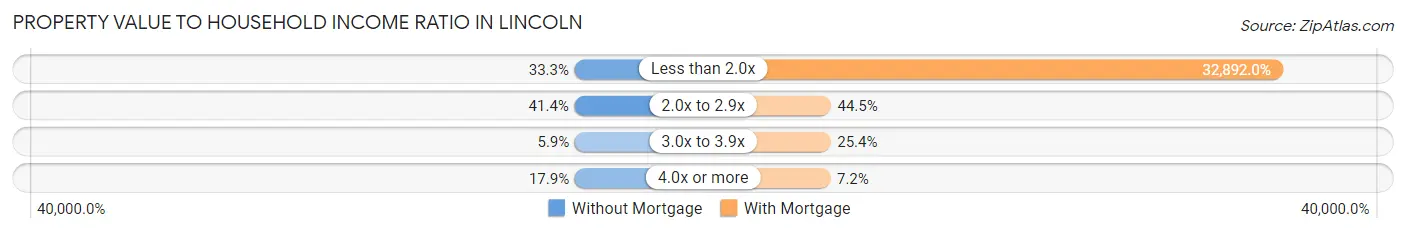
| Value-to-Income Ratio | Without Mortgage | With Mortgage |
| Less than 2.0x | 108 (33.3%) | 77,625 (32,892.0%) |
| 2.0x to 2.9x | 134 (41.4%) | 105 (44.5%) |
| 3.0x to 3.9x | 19 (5.9%) | 60 (25.4%) |
| 4.0x or more | 58 (17.9%) | 17 (7.2%) |
| Total | 324 (100.0%) | 236 (100.0%) |
Real Estate Taxes by Mortgage Status in Lincoln
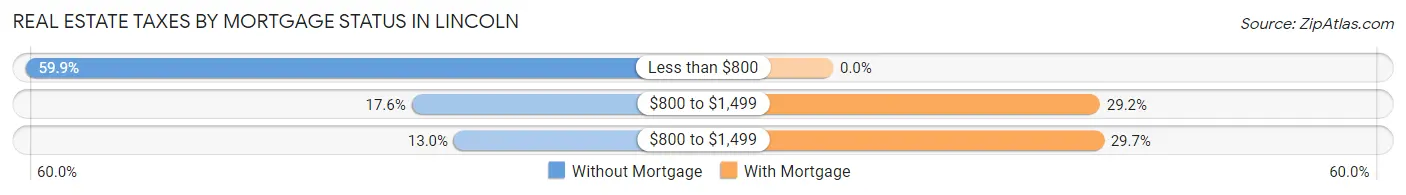
| Property Taxes | Without Mortgage | With Mortgage |
| Less than $800 | 194 (59.9%) | 0 (0.0%) |
| $800 to $1,499 | 57 (17.6%) | 69 (29.2%) |
| $800 to $1,499 | 42 (13.0%) | 70 (29.7%) |
| Total | 324 (100.0%) | 236 (100.0%) |
Health & Disability in Lincoln
Health Insurance Coverage by Age in Lincoln
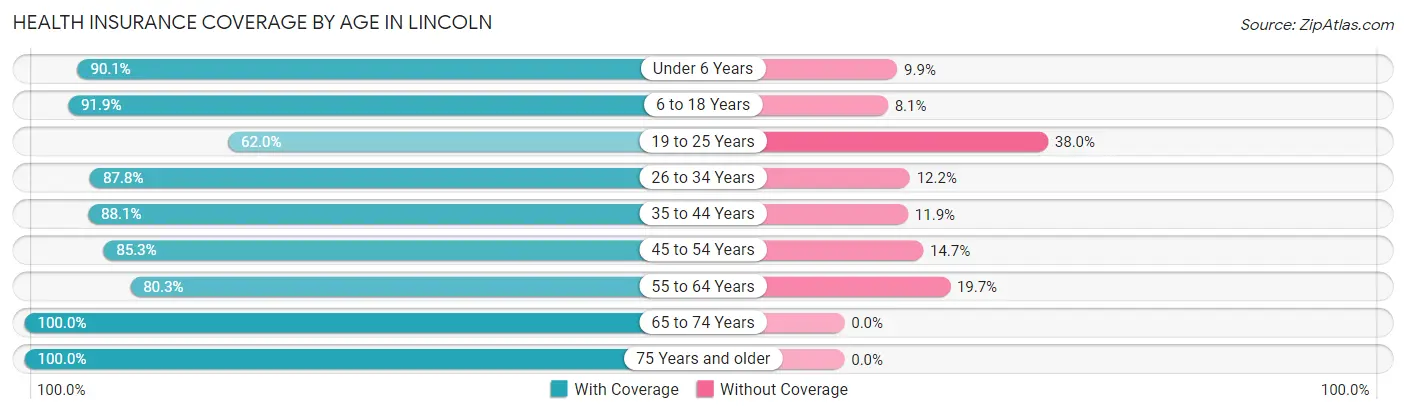
| Age Bracket | With Coverage | Without Coverage |
| Under 6 Years | 128 (90.1%) | 14 (9.9%) |
| 6 to 18 Years | 613 (91.9%) | 54 (8.1%) |
| 19 to 25 Years | 170 (62.0%) | 104 (38.0%) |
| 26 to 34 Years | 331 (87.8%) | 46 (12.2%) |
| 35 to 44 Years | 312 (88.1%) | 42 (11.9%) |
| 45 to 54 Years | 180 (85.3%) | 31 (14.7%) |
| 55 to 64 Years | 216 (80.3%) | 53 (19.7%) |
| 65 to 74 Years | 243 (100.0%) | 0 (0.0%) |
| 75 Years and older | 188 (100.0%) | 0 (0.0%) |
| Total | 2,381 (87.4%) | 344 (12.6%) |
Health Insurance Coverage by Citizenship Status in Lincoln
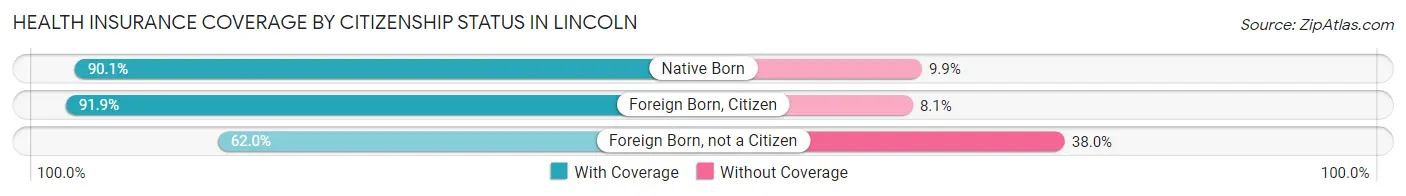
| Citizenship Status | With Coverage | Without Coverage |
| Native Born | 128 (90.1%) | 14 (9.9%) |
| Foreign Born, Citizen | 613 (91.9%) | 54 (8.1%) |
| Foreign Born, not a Citizen | 170 (62.0%) | 104 (38.0%) |
Health Insurance Coverage by Household Income in Lincoln
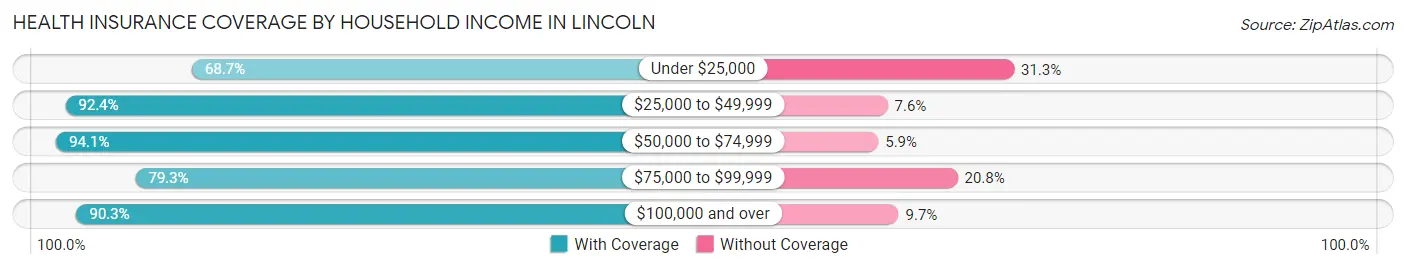
| Household Income | With Coverage | Without Coverage |
| Under $25,000 | 195 (68.7%) | 89 (31.3%) |
| $25,000 to $49,999 | 762 (92.4%) | 63 (7.6%) |
| $50,000 to $74,999 | 367 (94.1%) | 23 (5.9%) |
| $75,000 to $99,999 | 359 (79.2%) | 94 (20.7%) |
| $100,000 and over | 698 (90.3%) | 75 (9.7%) |
Public vs Private Health Insurance Coverage by Age in Lincoln
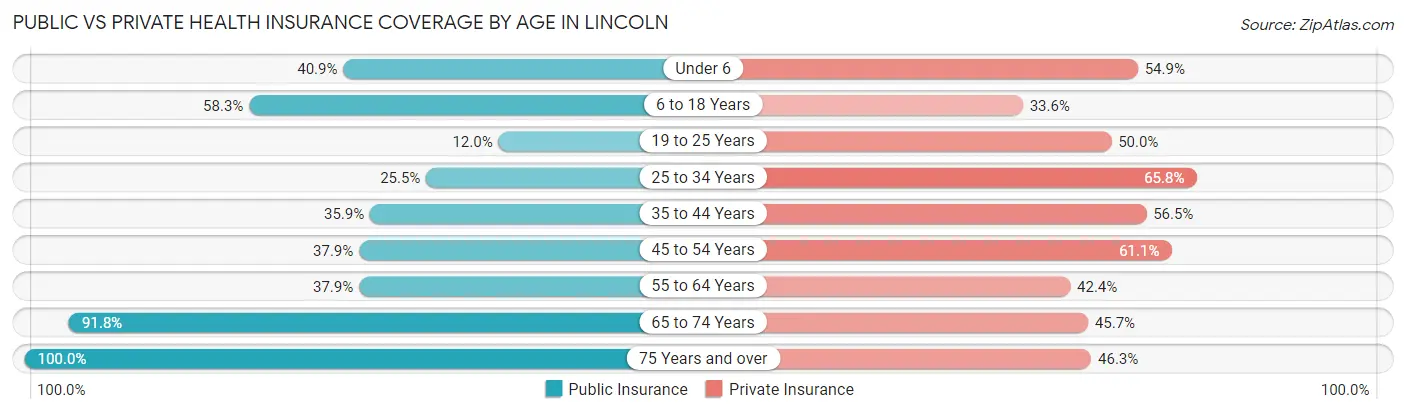
| Age Bracket | Public Insurance | Private Insurance |
| Under 6 | 58 (40.8%) | 78 (54.9%) |
| 6 to 18 Years | 389 (58.3%) | 224 (33.6%) |
| 19 to 25 Years | 33 (12.0%) | 137 (50.0%) |
| 25 to 34 Years | 96 (25.5%) | 248 (65.8%) |
| 35 to 44 Years | 127 (35.9%) | 200 (56.5%) |
| 45 to 54 Years | 80 (37.9%) | 129 (61.1%) |
| 55 to 64 Years | 102 (37.9%) | 114 (42.4%) |
| 65 to 74 Years | 223 (91.8%) | 111 (45.7%) |
| 75 Years and over | 188 (100.0%) | 87 (46.3%) |
| Total | 1,296 (47.6%) | 1,328 (48.7%) |
Disability Status by Sex by Age in Lincoln
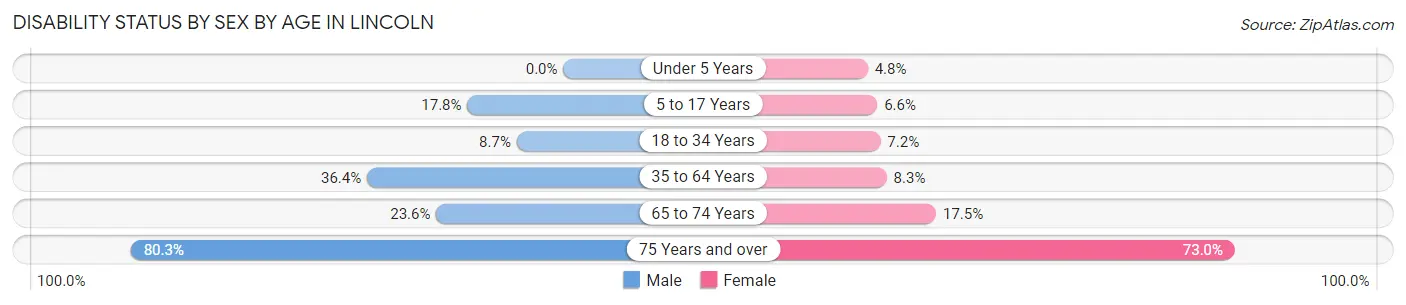
| Age Bracket | Male | Female |
| Under 5 Years | 0 (0.0%) | 5 (4.8%) |
| 5 to 17 Years | 49 (17.8%) | 20 (6.6%) |
| 18 to 34 Years | 41 (8.6%) | 19 (7.2%) |
| 35 to 64 Years | 129 (36.4%) | 40 (8.3%) |
| 65 to 74 Years | 29 (23.6%) | 21 (17.5%) |
| 75 Years and over | 53 (80.3%) | 89 (73.0%) |
Disability Class by Sex by Age in Lincoln
Disability Class: Hearing Difficulty
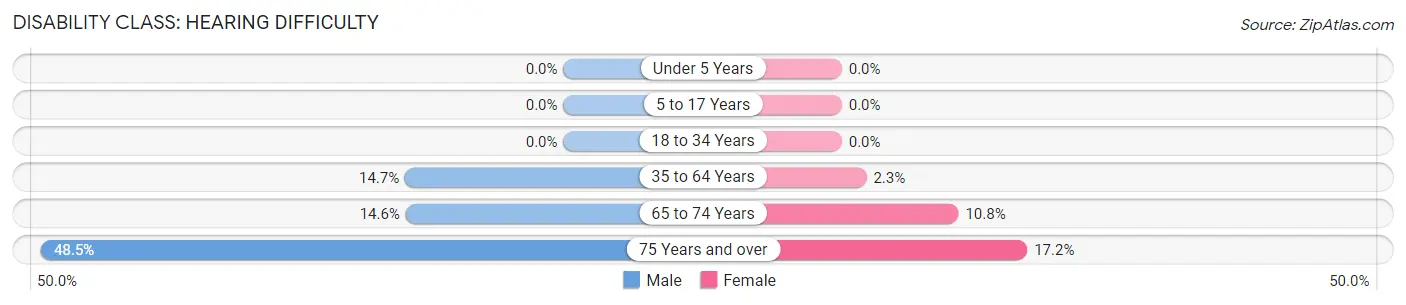
| Age Bracket | Male | Female |
| Under 5 Years | 0 (0.0%) | 0 (0.0%) |
| 5 to 17 Years | 0 (0.0%) | 0 (0.0%) |
| 18 to 34 Years | 0 (0.0%) | 0 (0.0%) |
| 35 to 64 Years | 52 (14.7%) | 11 (2.3%) |
| 65 to 74 Years | 18 (14.6%) | 13 (10.8%) |
| 75 Years and over | 32 (48.5%) | 21 (17.2%) |
Disability Class: Vision Difficulty
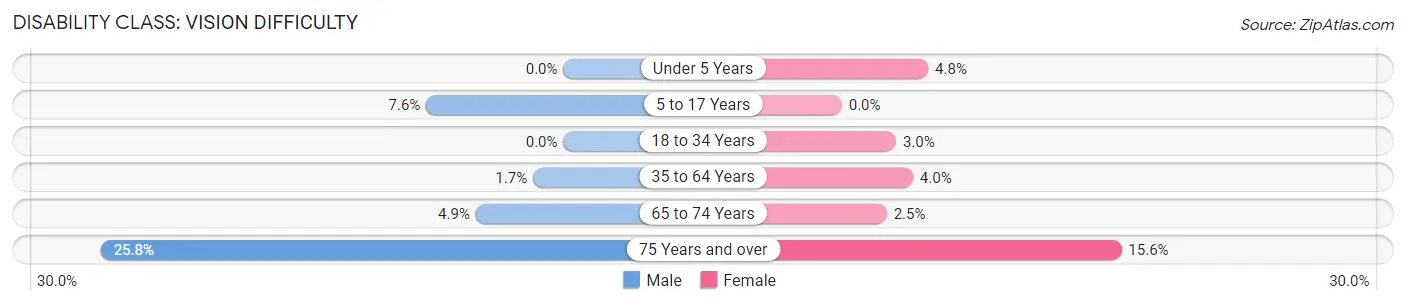
| Age Bracket | Male | Female |
| Under 5 Years | 0 (0.0%) | 5 (4.8%) |
| 5 to 17 Years | 21 (7.6%) | 0 (0.0%) |
| 18 to 34 Years | 0 (0.0%) | 8 (3.0%) |
| 35 to 64 Years | 6 (1.7%) | 19 (4.0%) |
| 65 to 74 Years | 6 (4.9%) | 3 (2.5%) |
| 75 Years and over | 17 (25.8%) | 19 (15.6%) |
Disability Class: Cognitive Difficulty
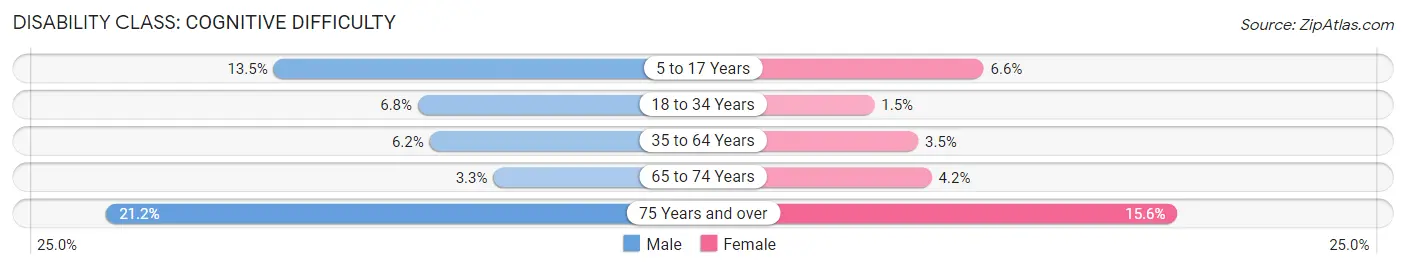
| Age Bracket | Male | Female |
| 5 to 17 Years | 37 (13.5%) | 20 (6.6%) |
| 18 to 34 Years | 32 (6.8%) | 4 (1.5%) |
| 35 to 64 Years | 22 (6.2%) | 17 (3.5%) |
| 65 to 74 Years | 4 (3.3%) | 5 (4.2%) |
| 75 Years and over | 14 (21.2%) | 19 (15.6%) |
Disability Class: Ambulatory Difficulty
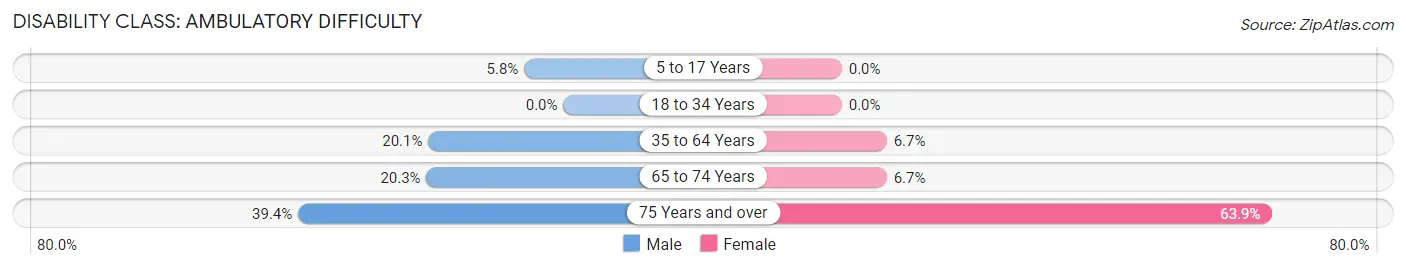
| Age Bracket | Male | Female |
| 5 to 17 Years | 16 (5.8%) | 0 (0.0%) |
| 18 to 34 Years | 0 (0.0%) | 0 (0.0%) |
| 35 to 64 Years | 71 (20.1%) | 32 (6.7%) |
| 65 to 74 Years | 25 (20.3%) | 8 (6.7%) |
| 75 Years and over | 26 (39.4%) | 78 (63.9%) |
Disability Class: Self-Care Difficulty
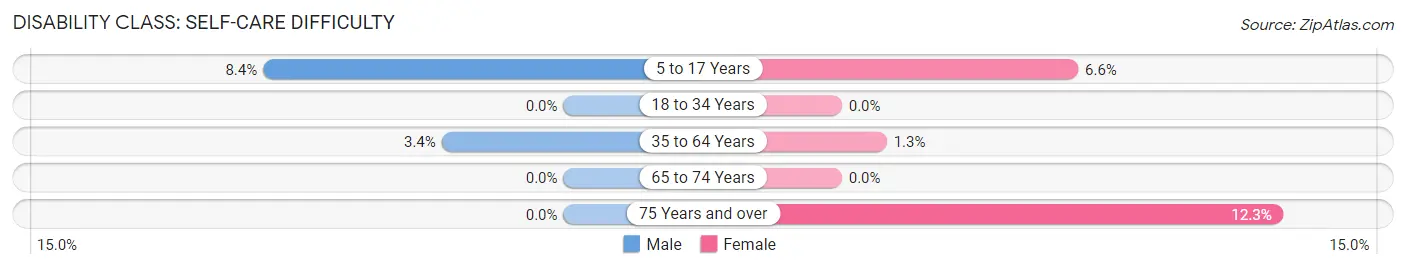
| Age Bracket | Male | Female |
| 5 to 17 Years | 23 (8.4%) | 20 (6.6%) |
| 18 to 34 Years | 0 (0.0%) | 0 (0.0%) |
| 35 to 64 Years | 12 (3.4%) | 6 (1.3%) |
| 65 to 74 Years | 0 (0.0%) | 0 (0.0%) |
| 75 Years and over | 0 (0.0%) | 15 (12.3%) |
Technology Access in Lincoln
Computing Device Access in Lincoln
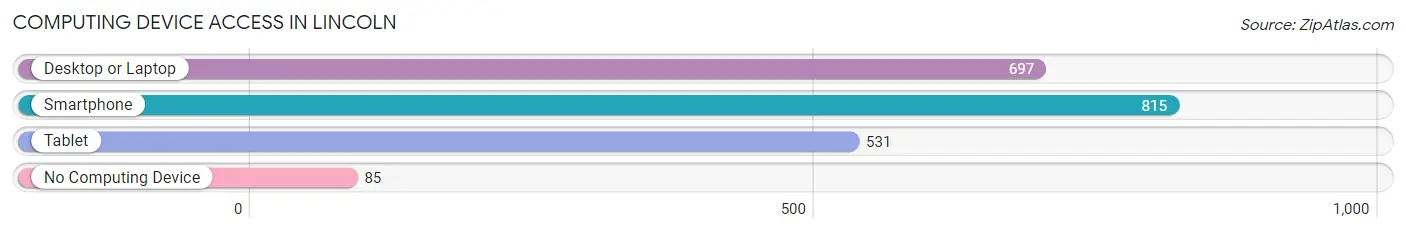
| Device Type | # Households | % Households |
| Desktop or Laptop | 697 | 73.5% |
| Smartphone | 815 | 86.0% |
| Tablet | 531 | 56.0% |
| No Computing Device | 85 | 9.0% |
| Total | 948 | 100.0% |
Internet Access in Lincoln
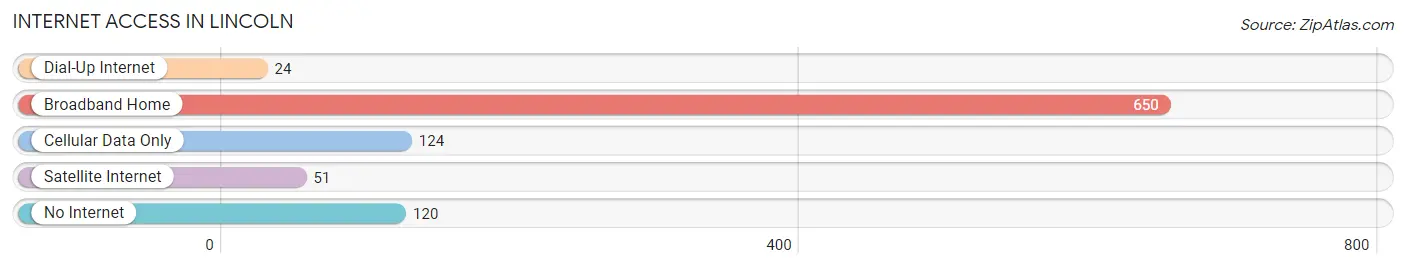
| Internet Type | # Households | % Households |
| Dial-Up Internet | 24 | 2.5% |
| Broadband Home | 650 | 68.6% |
| Cellular Data Only | 124 | 13.1% |
| Satellite Internet | 51 | 5.4% |
| No Internet | 120 | 12.7% |
| Total | 948 | 100.0% |
Lincoln Summary
Lincoln, Arkansas is a small town located in the northwest corner of the state, in Washington County. It is situated on the banks of the White River, and is surrounded by the Ozark Mountains. The town was founded in 1871, and was named after President Abraham Lincoln. The population of Lincoln in 2000 was 1,845.
Geography
Lincoln is located in the northwest corner of Arkansas, in Washington County. It is situated on the banks of the White River, and is surrounded by the Ozark Mountains. The town is located at an elevation of 845 feet above sea level. The climate in Lincoln is humid subtropical, with hot summers and mild winters. The average annual temperature is around 64 degrees Fahrenheit.
Economy
Lincoln’s economy is largely based on agriculture and tourism. The town is home to several farms, which produce a variety of crops, including corn, soybeans, wheat, and hay. The town is also home to several small businesses, including restaurants, retail stores, and service providers. Tourism is also an important part of the local economy, as the town is located near several popular attractions, including the Ozark National Forest, the Buffalo National River, and the White River.
Demographics
As of the 2000 census, the population of Lincoln was 1,845. The racial makeup of the town was 97.2% White, 0.7% African American, 0.3% Native American, 0.2% Asian, 0.1% Pacific Islander, 0.5% from other races, and 0.9% from two or more races. Hispanic or Latino of any race were 1.2% of the population. The median household income was $25,938, and the median family income was $31,250.
History
Lincoln was founded in 1871, and was named after President Abraham Lincoln. The town was originally a small farming community, and the economy was largely based on agriculture. In the early 1900s, the town began to grow, and several businesses were established. In the 1950s, the town began to experience a population boom, as many people moved to the area to take advantage of the booming economy. The town continued to grow throughout the 20th century, and today it is a thriving community with a strong economy and a vibrant culture.
Common Questions
What is Per Capita Income in Lincoln?
Per Capita income in Lincoln is $24,677.
What is the Median Family Income in Lincoln?
Median Family Income in Lincoln is $54,886.
What is the Median Household income in Lincoln?
Median Household Income in Lincoln is $50,625.
What is Income or Wage Gap in Lincoln?
Income or Wage Gap in Lincoln is 26.6%.
Women in Lincoln earn 73.4 cents for every dollar earned by a man.
What is Inequality or Gini Index in Lincoln?
Inequality or Gini Index in Lincoln is 0.40.
What is the Total Population of Lincoln?
Total Population of Lincoln is 2,754.
What is the Total Male Population of Lincoln?
Total Male Population of Lincoln is 1,359.
What is the Total Female Population of Lincoln?
Total Female Population of Lincoln is 1,395.
What is the Ratio of Males per 100 Females in Lincoln?
There are 97.42 Males per 100 Females in Lincoln.
What is the Ratio of Females per 100 Males in Lincoln?
There are 102.65 Females per 100 Males in Lincoln.
What is the Median Population Age in Lincoln?
Median Population Age in Lincoln is 33.3 Years.
What is the Average Family Size in Lincoln
Average Family Size in Lincoln is 3.5 People.
What is the Average Household Size in Lincoln
Average Household Size in Lincoln is 2.9 People.
How Large is the Labor Force in Lincoln?
There are 1,114 People in the Labor Forcein in Lincoln.
What is the Percentage of People in the Labor Force in Lincoln?
51.2% of People are in the Labor Force in Lincoln.
What is the Unemployment Rate in Lincoln?
Unemployment Rate in Lincoln is 4.1%.