Strong, AR Map & Demographics
Strong Map
Strong Overview
$20,569
PER CAPITA INCOME
$26,635
AVG HOUSEHOLD INCOME
$10,114
FAMILY INCOME DEFICIT
0.47
INEQUALITY / GINI INDEX
374
TOTAL POPULATION
245
MALE POPULATION
129
FEMALE POPULATION
189.92
MALES / 100 FEMALES
52.65
FEMALES / 100 MALES
63.2
MEDIAN AGE
2.0
AVG FAMILY SIZE
1.6
AVG HOUSEHOLD SIZE
110
LABOR FORCE [ PEOPLE ]
31.4%
PERCENT IN LABOR FORCE
Strong Zip Codes
Strong Area Codes
Income in Strong
Income Overview in Strong
| Characteristic | Number | Measure |
| Per Capita Income | 374 | $20,569 |
| Median Family Income | 134 | $0 |
| Mean Family Income | 134 | $60,422 |
| Median Household Income | 239 | $26,635 |
| Mean Household Income | 239 | $41,097 |
| Income Deficit | 134 | $10,114 |
| Wage / Income Gap (%) | 374 | 0.00% |
| Wage / Income Gap ($) | 374 | 100.00¢ per $1 |
| Gini / Inequality Index | 374 | 0.47 |
Earnings by Sex in Strong
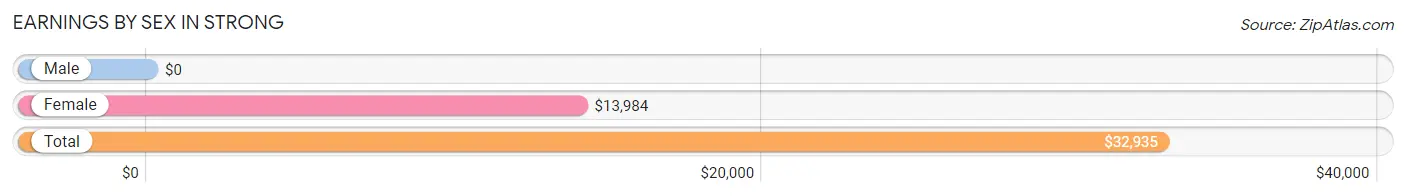
| Sex | Number | Average Earnings |
| Male | 69 (62.7%) | $0 |
| Female | 41 (37.3%) | $13,984 |
| Total | 110 (100.0%) | $32,935 |
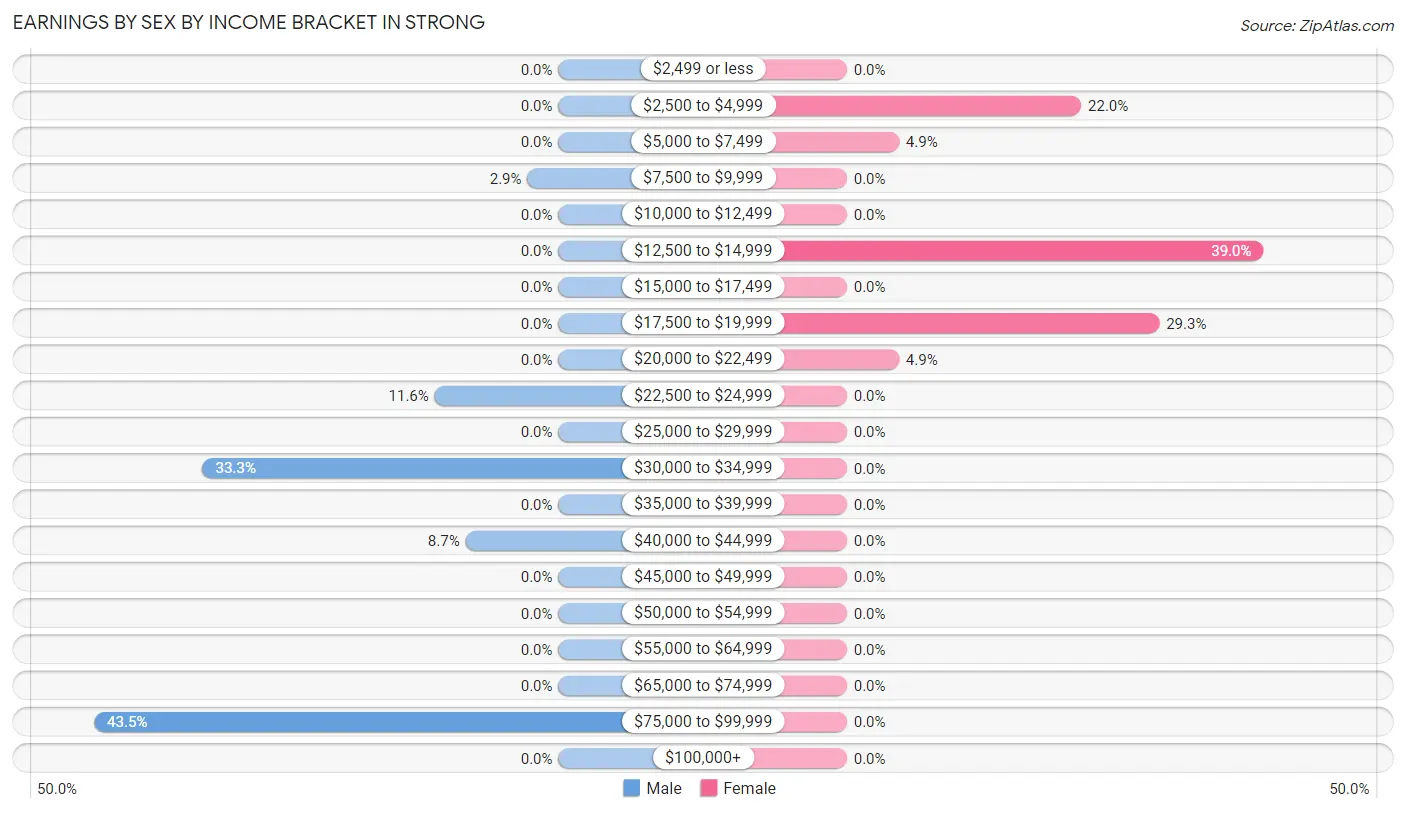
Earnings by Sex by Income Bracket in Strong
The most common earnings brackets in Strong are $75,000 to $99,999 for men (30 | 43.5%) and $12,500 to $14,999 for women (16 | 39.0%).
| Income | Male | Female |
| $2,499 or less | 0 (0.0%) | 0 (0.0%) |
| $2,500 to $4,999 | 0 (0.0%) | 9 (22.0%) |
| $5,000 to $7,499 | 0 (0.0%) | 2 (4.9%) |
| $7,500 to $9,999 | 2 (2.9%) | 0 (0.0%) |
| $10,000 to $12,499 | 0 (0.0%) | 0 (0.0%) |
| $12,500 to $14,999 | 0 (0.0%) | 16 (39.0%) |
| $15,000 to $17,499 | 0 (0.0%) | 0 (0.0%) |
| $17,500 to $19,999 | 0 (0.0%) | 12 (29.3%) |
| $20,000 to $22,499 | 0 (0.0%) | 2 (4.9%) |
| $22,500 to $24,999 | 8 (11.6%) | 0 (0.0%) |
| $25,000 to $29,999 | 0 (0.0%) | 0 (0.0%) |
| $30,000 to $34,999 | 23 (33.3%) | 0 (0.0%) |
| $35,000 to $39,999 | 0 (0.0%) | 0 (0.0%) |
| $40,000 to $44,999 | 6 (8.7%) | 0 (0.0%) |
| $45,000 to $49,999 | 0 (0.0%) | 0 (0.0%) |
| $50,000 to $54,999 | 0 (0.0%) | 0 (0.0%) |
| $55,000 to $64,999 | 0 (0.0%) | 0 (0.0%) |
| $65,000 to $74,999 | 0 (0.0%) | 0 (0.0%) |
| $75,000 to $99,999 | 30 (43.5%) | 0 (0.0%) |
| $100,000+ | 0 (0.0%) | 0 (0.0%) |
| Total | 69 (100.0%) | 41 (100.0%) |
Earnings by Sex by Educational Attainment in Strong
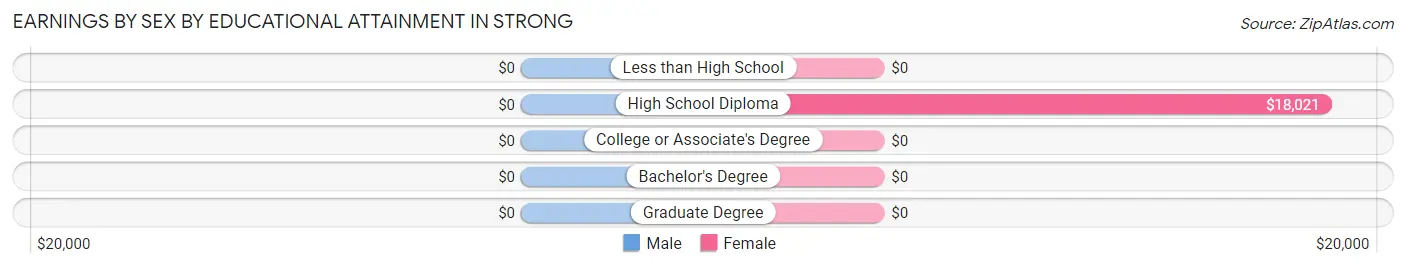
| Educational Attainment | Male Income | Female Income |
| Less than High School | - | - |
| High School Diploma | - | - |
| College or Associate's Degree | - | - |
| Bachelor's Degree | - | - |
| Graduate Degree | - | - |
| Total | - | - |
Family Income in Strong
Family Income Brackets in Strong
According to the Strong family income data, there are 62 families falling into the $75,000 to $99,999 income range, which is the most common income bracket and makes up 46.3% of all families.
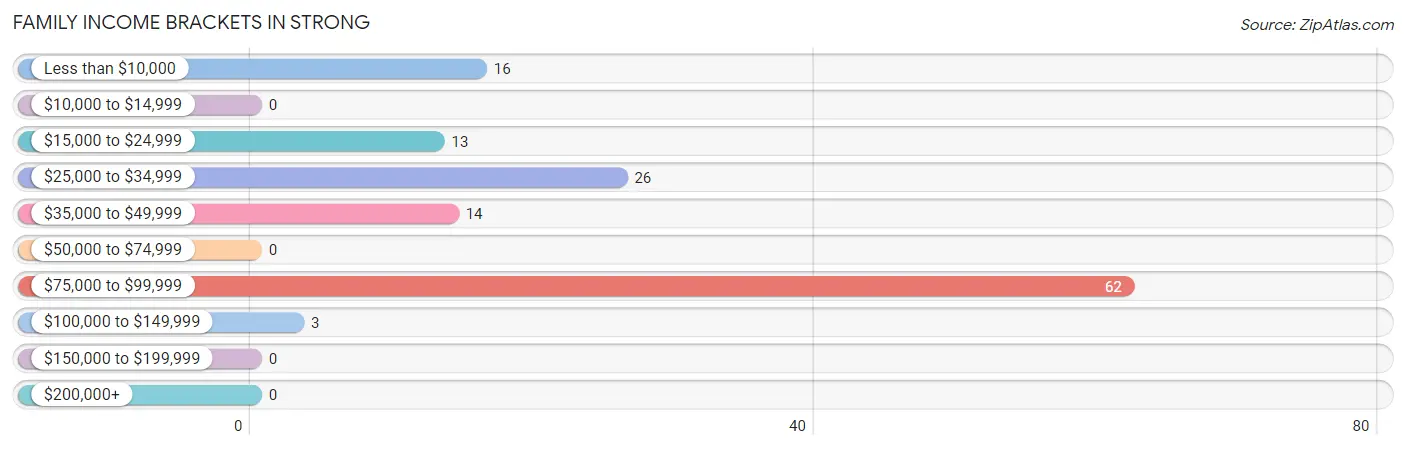
| Income Bracket | # Families | % Families |
| Less than $10,000 | 16 | 11.9% |
| $10,000 to $14,999 | 0 | 0.0% |
| $15,000 to $24,999 | 13 | 9.7% |
| $25,000 to $34,999 | 26 | 19.4% |
| $35,000 to $49,999 | 14 | 10.4% |
| $50,000 to $74,999 | 0 | 0.0% |
| $75,000 to $99,999 | 62 | 46.3% |
| $100,000 to $149,999 | 3 | 2.2% |
| $150,000 to $199,999 | 0 | 0.0% |
| $200,000+ | 0 | 0.0% |
Family Income by Famaliy Size in Strong
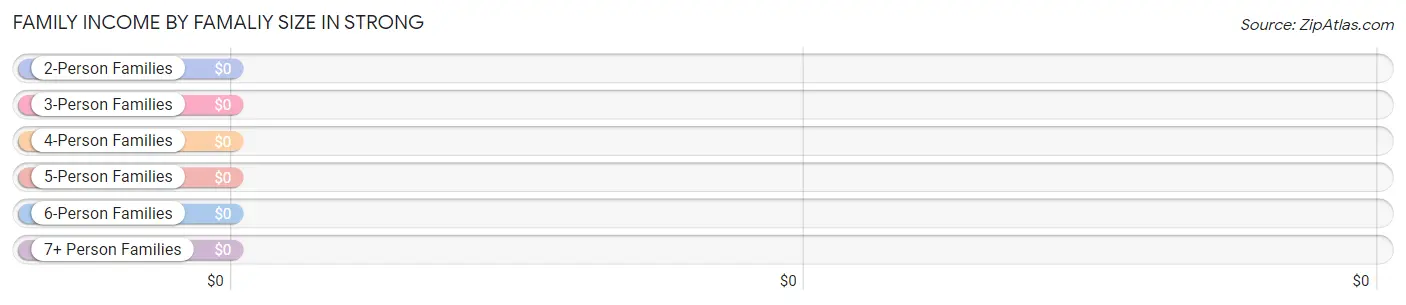
| Income Bracket | # Families | Median Income |
| 2-Person Families | 125 (93.3%) | $0 |
| 3-Person Families | 2 (1.5%) | $0 |
| 4-Person Families | 7 (5.2%) | $0 |
| 5-Person Families | 0 (0.0%) | $0 |
| 6-Person Families | 0 (0.0%) | $0 |
| 7+ Person Families | 0 (0.0%) | $0 |
| Total | 134 (100.0%) | $0 |
Family Income by Number of Earners in Strong
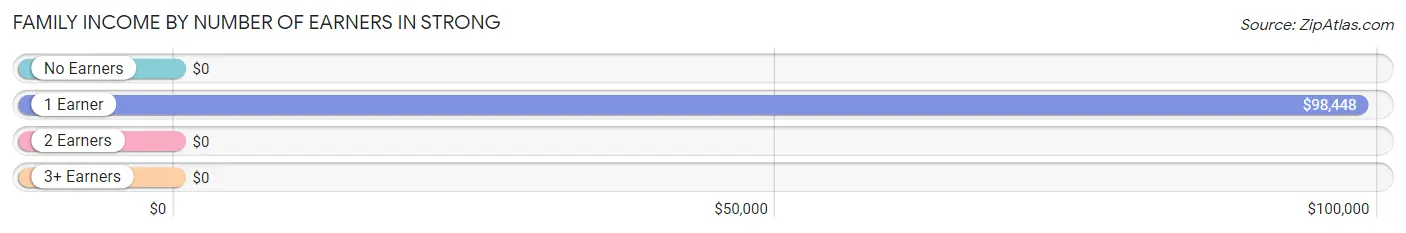
| Number of Earners | # Families | Median Income |
| No Earners | 49 (36.6%) | $0 |
| 1 Earner | 77 (57.5%) | $98,448 |
| 2 Earners | 8 (6.0%) | $0 |
| 3+ Earners | 0 (0.0%) | $0 |
| Total | 134 (100.0%) | $0 |
Household Income in Strong
Household Income Brackets in Strong
With 62 households falling in the category, the $75,000 to $99,999 income range is the most frequent in Strong, accounting for 25.9% of all households.
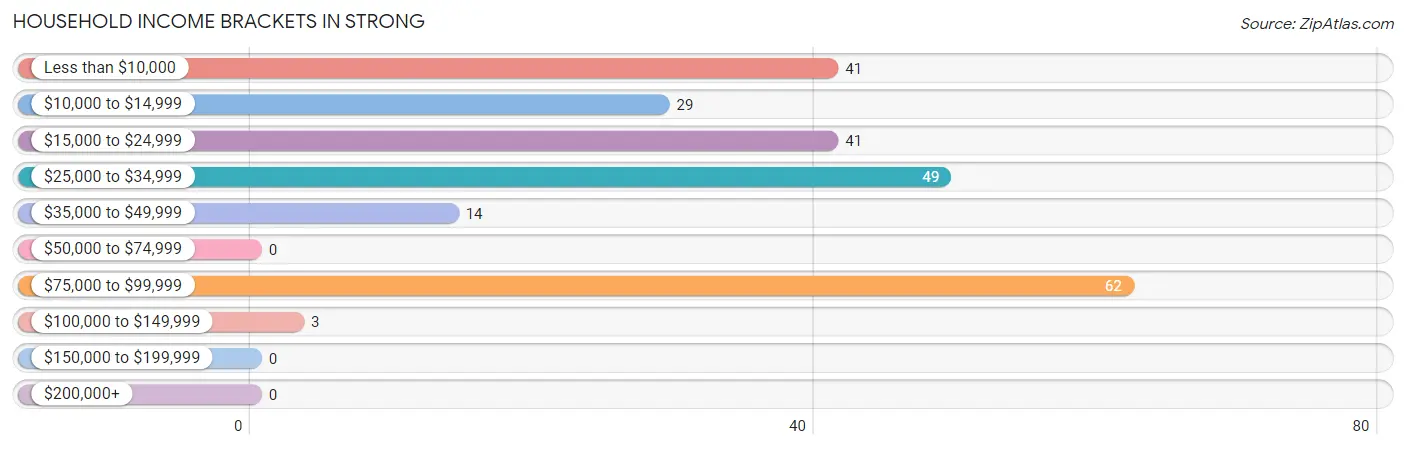
| Income Bracket | # Households | % Households |
| Less than $10,000 | 41 | 17.2% |
| $10,000 to $14,999 | 29 | 12.1% |
| $15,000 to $24,999 | 41 | 17.2% |
| $25,000 to $34,999 | 49 | 20.5% |
| $35,000 to $49,999 | 14 | 5.9% |
| $50,000 to $74,999 | 0 | 0.0% |
| $75,000 to $99,999 | 62 | 25.9% |
| $100,000 to $149,999 | 3 | 1.3% |
| $150,000 to $199,999 | 0 | 0.0% |
| $200,000+ | 0 | 0.0% |
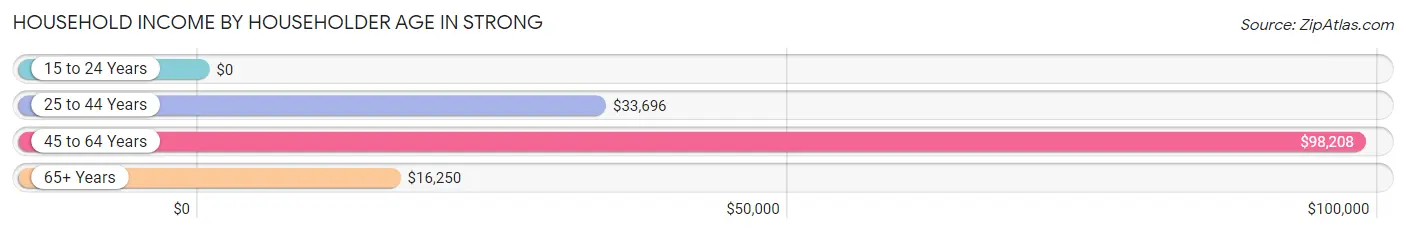
Household Income by Householder Age in Strong
The median household income in Strong is $26,635, with the highest median household income of $98,208 found in the 45 to 64 years age bracket for the primary householder. A total of 86 households (36.0%) fall into this category.
| Income Bracket | # Households | Median Income |
| 15 to 24 Years | 0 (0.0%) | $0 |
| 25 to 44 Years | 52 (21.8%) | $33,696 |
| 45 to 64 Years | 86 (36.0%) | $98,208 |
| 65+ Years | 101 (42.3%) | $16,250 |
| Total | 239 (100.0%) | $26,635 |
Poverty in Strong
Income Below Poverty by Sex and Age in Strong
With 28.2% poverty level for males and 47.3% for females among the residents of Strong, 45 to 54 year old males and 25 to 34 year old females are the most vulnerable to poverty, with 8 males (100.0%) and 23 females (79.3%) in their respective age groups living below the poverty level.
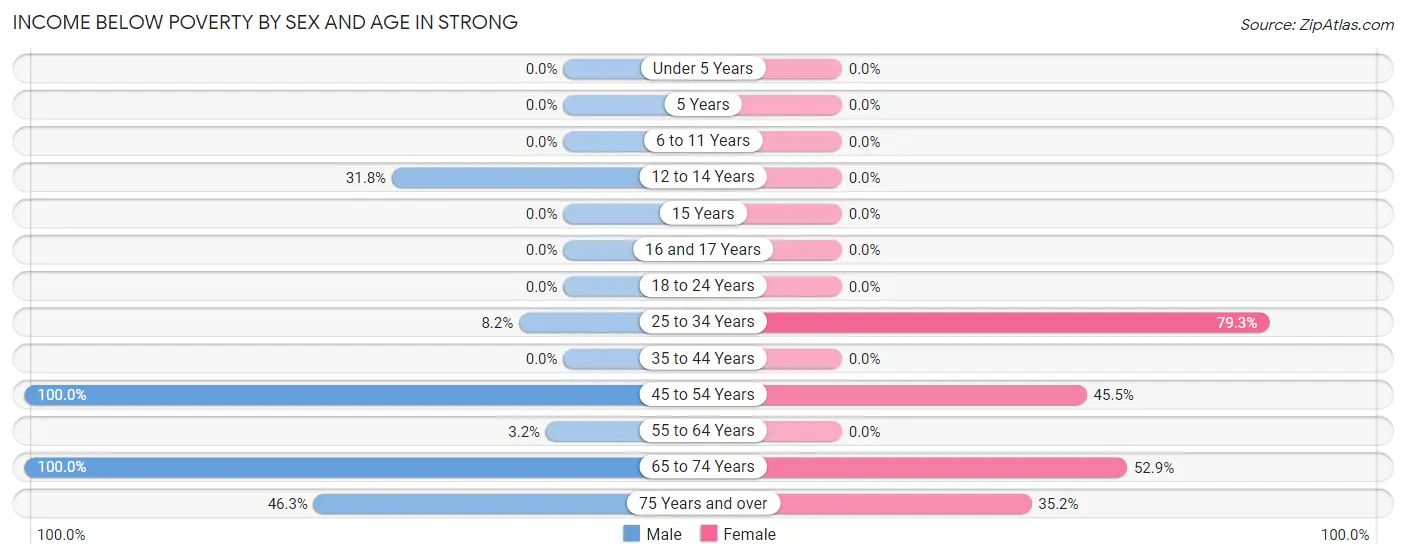
| Age Bracket | Male | Female |
| Under 5 Years | 0 (0.0%) | 0 (0.0%) |
| 5 Years | 0 (0.0%) | 0 (0.0%) |
| 6 to 11 Years | 0 (0.0%) | 0 (0.0%) |
| 12 to 14 Years | 7 (31.8%) | 0 (0.0%) |
| 15 Years | 0 (0.0%) | 0 (0.0%) |
| 16 and 17 Years | 0 (0.0%) | 0 (0.0%) |
| 18 to 24 Years | 0 (0.0%) | 0 (0.0%) |
| 25 to 34 Years | 6 (8.2%) | 23 (79.3%) |
| 35 to 44 Years | 0 (0.0%) | 0 (0.0%) |
| 45 to 54 Years | 8 (100.0%) | 10 (45.5%) |
| 55 to 64 Years | 2 (3.2%) | 0 (0.0%) |
| 65 to 74 Years | 27 (100.0%) | 9 (52.9%) |
| 75 Years and over | 19 (46.3%) | 19 (35.2%) |
| Total | 69 (28.2%) | 61 (47.3%) |
Income Above Poverty by Sex and Age in Strong
According to the poverty statistics in Strong, males aged 6 to 11 years and females aged 55 to 64 years are the age groups that are most secure financially, with 100.0% of males and 100.0% of females in these age groups living above the poverty line.
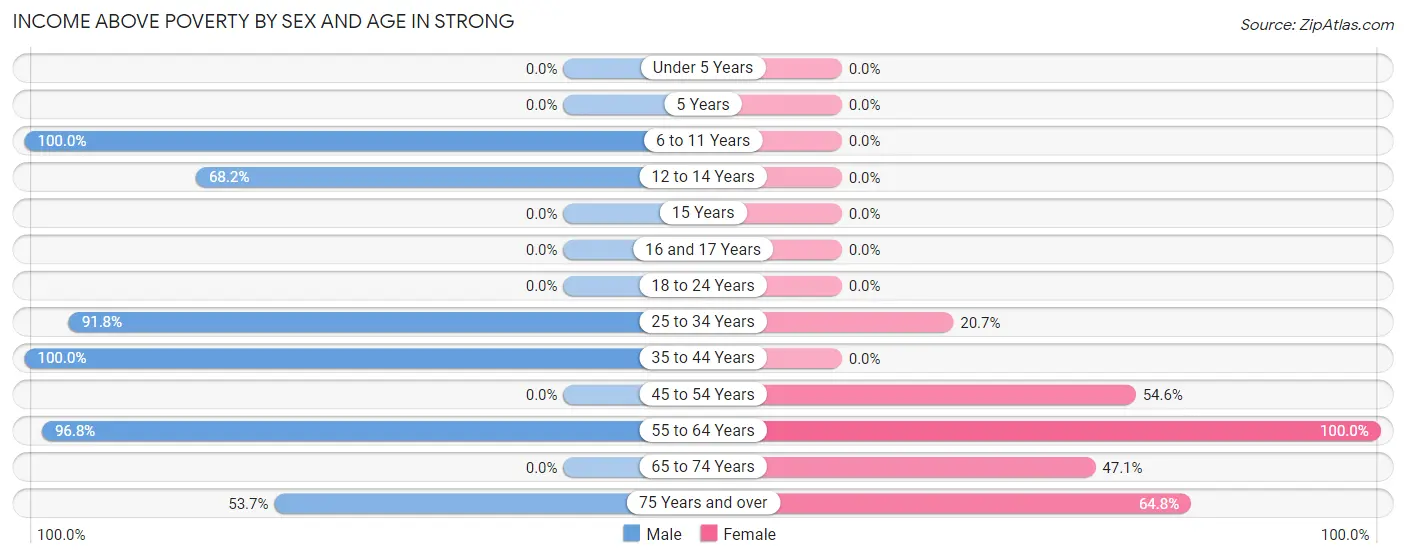
| Age Bracket | Male | Female |
| Under 5 Years | 0 (0.0%) | 0 (0.0%) |
| 5 Years | 0 (0.0%) | 0 (0.0%) |
| 6 to 11 Years | 2 (100.0%) | 0 (0.0%) |
| 12 to 14 Years | 15 (68.2%) | 0 (0.0%) |
| 15 Years | 0 (0.0%) | 0 (0.0%) |
| 16 and 17 Years | 0 (0.0%) | 0 (0.0%) |
| 18 to 24 Years | 0 (0.0%) | 0 (0.0%) |
| 25 to 34 Years | 67 (91.8%) | 6 (20.7%) |
| 35 to 44 Years | 10 (100.0%) | 0 (0.0%) |
| 45 to 54 Years | 0 (0.0%) | 12 (54.5%) |
| 55 to 64 Years | 60 (96.8%) | 7 (100.0%) |
| 65 to 74 Years | 0 (0.0%) | 8 (47.1%) |
| 75 Years and over | 22 (53.7%) | 35 (64.8%) |
| Total | 176 (71.8%) | 68 (52.7%) |
Income Below Poverty Among Married-Couple Families in Strong
The poverty statistics for married-couple families in Strong show that 63.0% or 29 of the total 46 families live below the poverty line. Families with 1 or 2 children have the highest poverty rate of 77.8%, comprising of 7 families. On the other hand, families with no children have the lowest poverty rate of 59.5%, which includes 22 families.
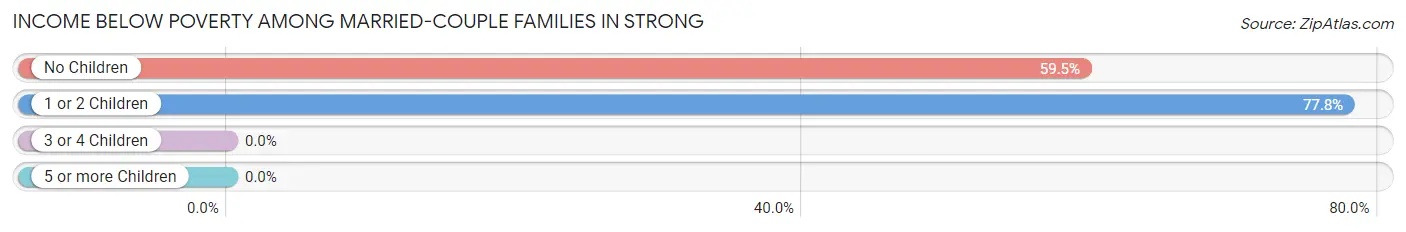
| Children | Above Poverty | Below Poverty |
| No Children | 15 (40.5%) | 22 (59.5%) |
| 1 or 2 Children | 2 (22.2%) | 7 (77.8%) |
| 3 or 4 Children | 0 (0.0%) | 0 (0.0%) |
| 5 or more Children | 0 (0.0%) | 0 (0.0%) |
| Total | 17 (37.0%) | 29 (63.0%) |
Income Below Poverty Among Single-Parent Households in Strong
| Children | Single Father | Single Mother |
| No Children | 0 (0.0%) | 0 (0.0%) |
| 1 or 2 Children | 0 (0.0%) | 0 (0.0%) |
| 3 or 4 Children | 0 (0.0%) | 0 (0.0%) |
| 5 or more Children | 0 (0.0%) | 0 (0.0%) |
| Total | 0 (0.0%) | 0 (0.0%) |
Income Below Poverty Among Married-Couple vs Single-Parent Households in Strong
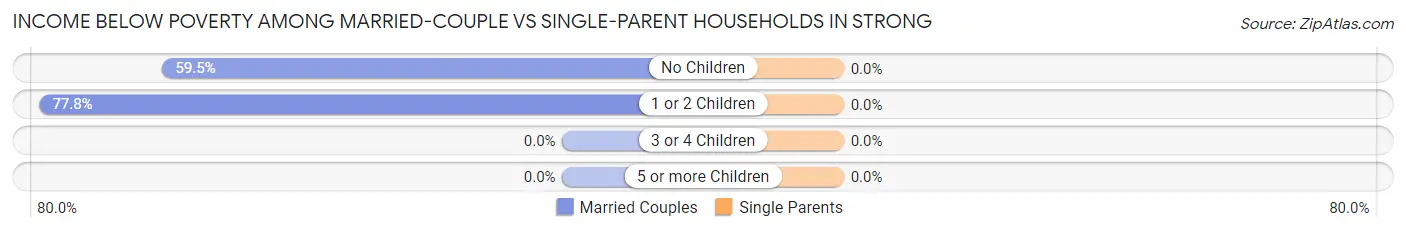
| Children | Married-Couple Families | Single-Parent Households |
| No Children | 22 (59.5%) | 0 (0.0%) |
| 1 or 2 Children | 7 (77.8%) | 0 (0.0%) |
| 3 or 4 Children | 0 (0.0%) | 0 (0.0%) |
| 5 or more Children | 0 (0.0%) | 0 (0.0%) |
| Total | 29 (63.0%) | 0 (0.0%) |
Race in Strong
The most populous races in Strong are White / Caucasian (250 | 66.8%), Black / African American (122 | 32.6%), and Hispanic or Latino (15 | 4.0%).
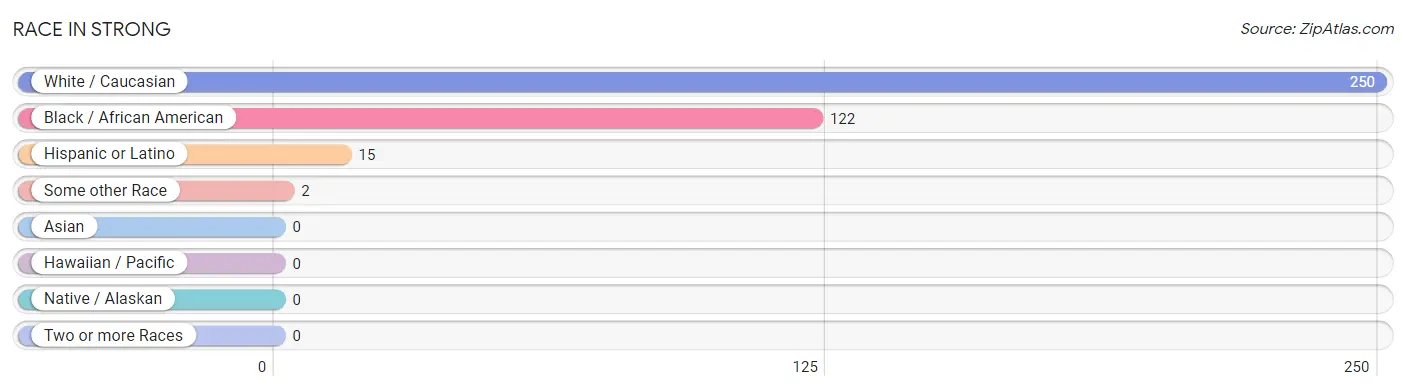
| Race | # Population | % Population |
| Asian | 0 | 0.0% |
| Black / African American | 122 | 32.6% |
| Hawaiian / Pacific | 0 | 0.0% |
| Hispanic or Latino | 15 | 4.0% |
| Native / Alaskan | 0 | 0.0% |
| White / Caucasian | 250 | 66.8% |
| Two or more Races | 0 | 0.0% |
| Some other Race | 2 | 0.5% |
| Total | 374 | 100.0% |
Ancestry in Strong
The most populous ancestries reported in Strong are English (97 | 25.9%), American (45 | 12.0%), African (23 | 6.1%), Subsaharan African (23 | 6.1%), and Mexican (15 | 4.0%), together accounting for 54.3% of all Strong residents.
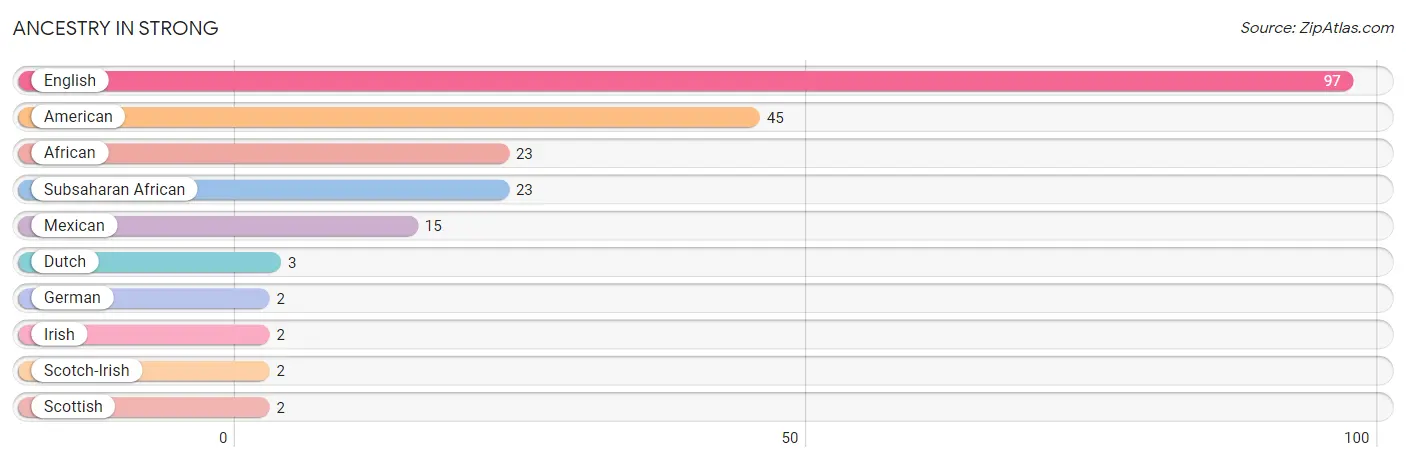
| Ancestry | # Population | % Population |
| African | 23 | 6.1% |
| American | 45 | 12.0% |
| Dutch | 3 | 0.8% |
| English | 97 | 25.9% |
| German | 2 | 0.5% |
| Irish | 2 | 0.5% |
| Mexican | 15 | 4.0% |
| Scotch-Irish | 2 | 0.5% |
| Scottish | 2 | 0.5% |
| Subsaharan African | 23 | 6.1% | View All 10 Rows |
Immigrants in Strong
The most numerous immigrant groups reported in Strong came from Central America (3 | 0.8%), Latin America (3 | 0.8%), and Mexico (3 | 0.8%), together accounting for 2.4% of all Strong residents.
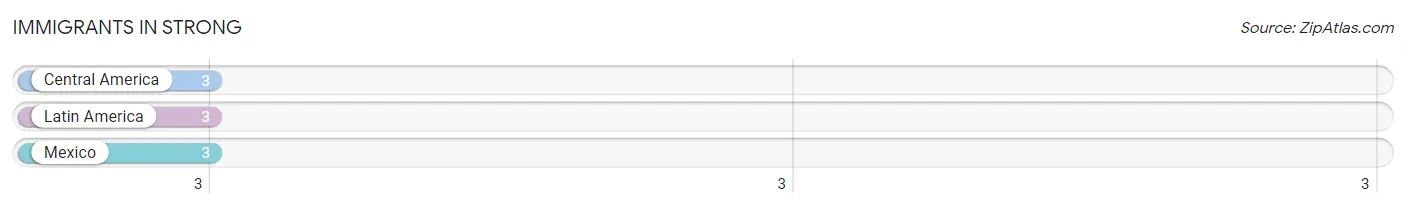
| Immigration Origin | # Population | % Population |
| Central America | 3 | 0.8% |
| Latin America | 3 | 0.8% |
| Mexico | 3 | 0.8% | View All 3 Rows |
Sex and Age in Strong
Sex and Age in Strong
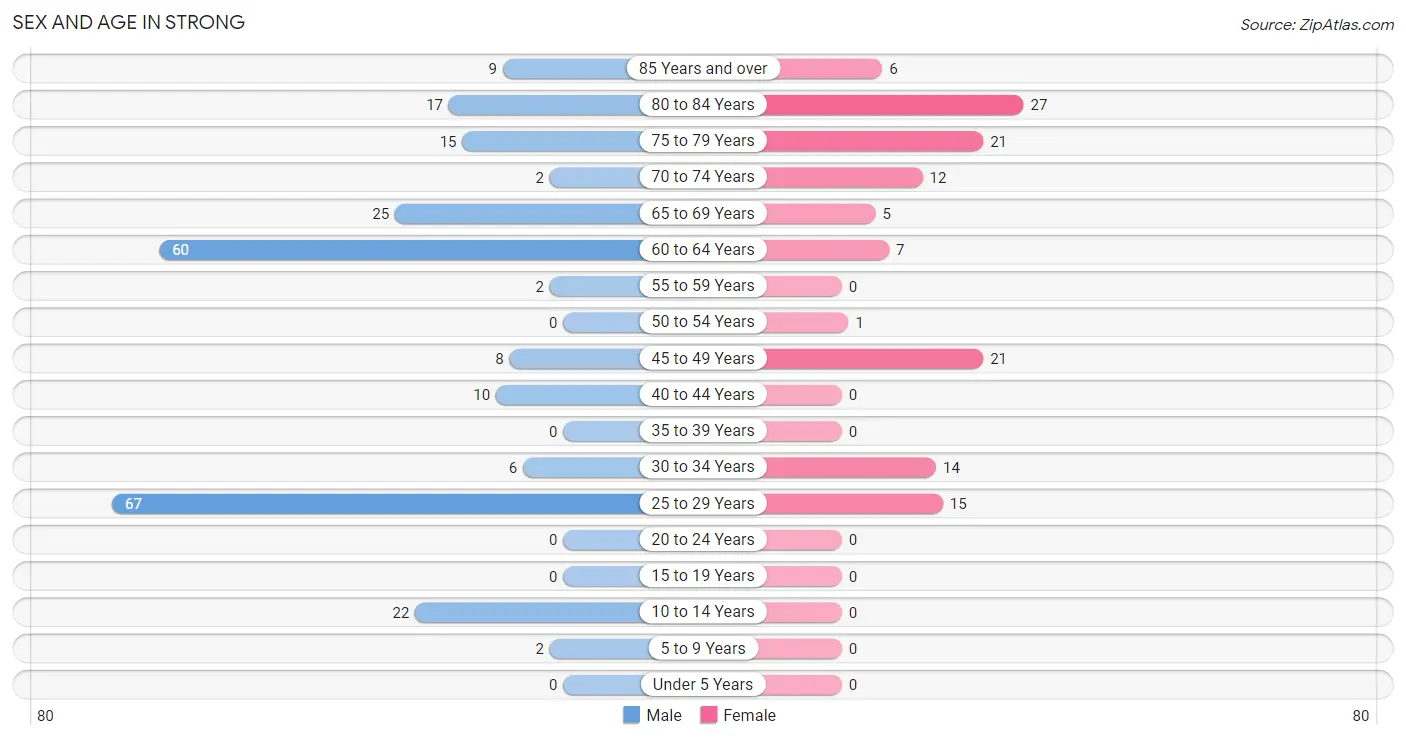
The most populous age groups in Strong are 25 to 29 Years (67 | 27.4%) for men and 80 to 84 Years (27 | 20.9%) for women.
| Age Bracket | Male | Female |
| Under 5 Years | 0 (0.0%) | 0 (0.0%) |
| 5 to 9 Years | 2 (0.8%) | 0 (0.0%) |
| 10 to 14 Years | 22 (9.0%) | 0 (0.0%) |
| 15 to 19 Years | 0 (0.0%) | 0 (0.0%) |
| 20 to 24 Years | 0 (0.0%) | 0 (0.0%) |
| 25 to 29 Years | 67 (27.4%) | 15 (11.6%) |
| 30 to 34 Years | 6 (2.5%) | 14 (10.8%) |
| 35 to 39 Years | 0 (0.0%) | 0 (0.0%) |
| 40 to 44 Years | 10 (4.1%) | 0 (0.0%) |
| 45 to 49 Years | 8 (3.3%) | 21 (16.3%) |
| 50 to 54 Years | 0 (0.0%) | 1 (0.8%) |
| 55 to 59 Years | 2 (0.8%) | 0 (0.0%) |
| 60 to 64 Years | 60 (24.5%) | 7 (5.4%) |
| 65 to 69 Years | 25 (10.2%) | 5 (3.9%) |
| 70 to 74 Years | 2 (0.8%) | 12 (9.3%) |
| 75 to 79 Years | 15 (6.1%) | 21 (16.3%) |
| 80 to 84 Years | 17 (6.9%) | 27 (20.9%) |
| 85 Years and over | 9 (3.7%) | 6 (4.6%) |
| Total | 245 (100.0%) | 129 (100.0%) |
Families and Households in Strong
Median Family Size in Strong
The median family size in Strong is 2.01 persons per family, with married-couple families (46 | 34.3%) accounting for the largest median family size of 2.48 persons per family. On the other hand, single male/father families (68 | 50.7%) represent the smallest median family size with 1.62 persons per family.
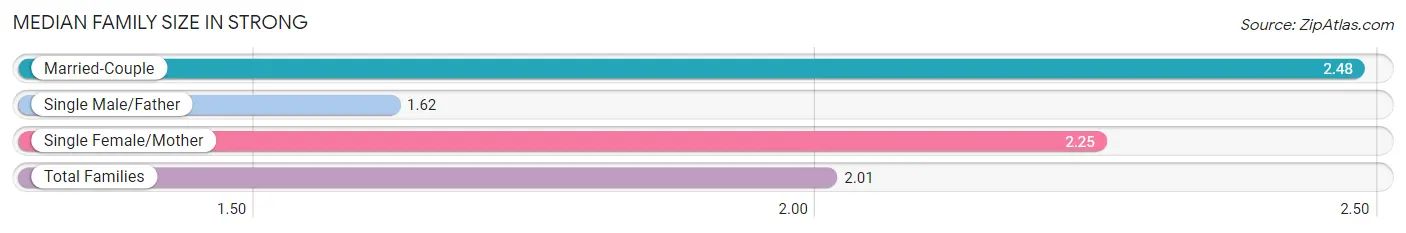
| Family Type | # Families | Family Size |
| Married-Couple | 46 (34.3%) | 2.48 |
| Single Male/Father | 68 (50.7%) | 1.62 |
| Single Female/Mother | 20 (14.9%) | 2.25 |
| Total Families | 134 (100.0%) | 2.01 |
Median Household Size in Strong
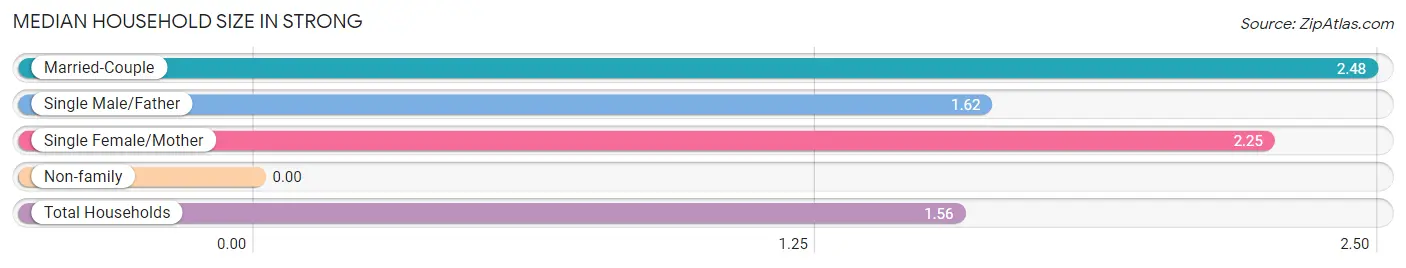
| Household Type | # Households | Household Size |
| Married-Couple | 46 (19.3%) | 2.48 |
| Single Male/Father | 68 (28.4%) | 1.62 |
| Single Female/Mother | 20 (8.4%) | 2.25 |
| Non-family | 105 (43.9%) | - |
| Total Households | 239 (100.0%) | 1.56 |
Household Size by Marriage Status in Strong
Out of a total of 239 households in Strong, 134 (56.1%) are family households, while 105 (43.9%) are nonfamily households. The most numerous type of family households are 2-person households, comprising 125, and the most common type of nonfamily households are 1-person households, comprising 105.
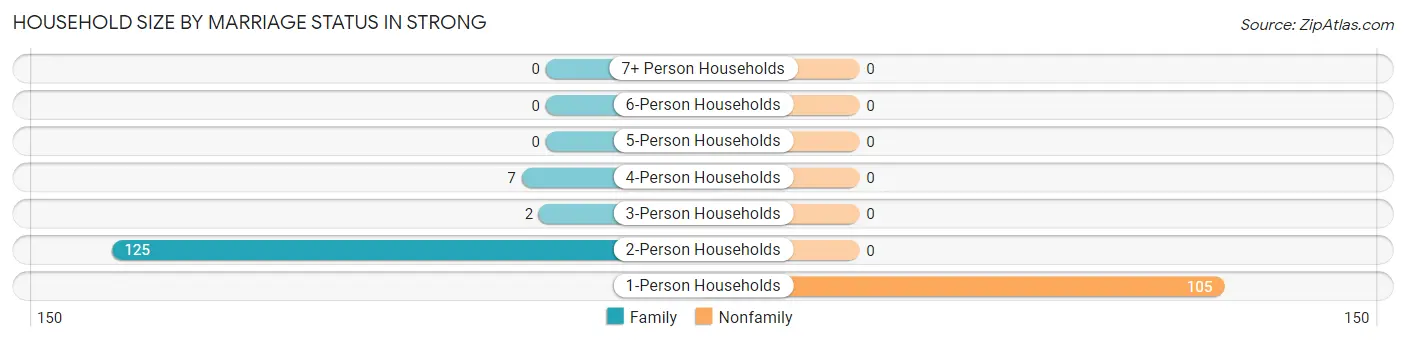
| Household Size | Family Households | Nonfamily Households |
| 1-Person Households | - | 105 (43.9%) |
| 2-Person Households | 125 (52.3%) | 0 (0.0%) |
| 3-Person Households | 2 (0.8%) | 0 (0.0%) |
| 4-Person Households | 7 (2.9%) | 0 (0.0%) |
| 5-Person Households | 0 (0.0%) | 0 (0.0%) |
| 6-Person Households | 0 (0.0%) | 0 (0.0%) |
| 7+ Person Households | 0 (0.0%) | 0 (0.0%) |
| Total | 134 (56.1%) | 105 (43.9%) |
Female Fertility in Strong
Fertility by Age in Strong
| Age Bracket | Women with Births | Births / 1,000 Women |
| 15 to 19 years | 0 (0.0%) | 0.0 |
| 20 to 34 years | 0 (0.0%) | 0.0 |
| 35 to 50 years | 0 (0.0%) | 0.0 |
| Total | 0 (0.0%) | 0.0 |
Fertility by Age by Marriage Status in Strong
| Age Bracket | Married | Unmarried |
| 15 to 19 years | 0 (0.0%) | 0 (0.0%) |
| 20 to 34 years | 0 (0.0%) | 0 (0.0%) |
| 35 to 50 years | 0 (0.0%) | 0 (0.0%) |
| Total | 0 (0.0%) | 0 (0.0%) |
Fertility by Education in Strong
| Educational Attainment | Women with Births | Births / 1,000 Women |
| Less than High School | 0 (0.0%) | 0.0 |
| High School Diploma | 0 (0.0%) | 0.0 |
| College or Associate's Degree | 0 (0.0%) | 0.0 |
| Bachelor's Degree | 0 (0.0%) | 0.0 |
| Graduate Degree | 0 (0.0%) | 0.0 |
| Total | 0 (0.0%) | 0.0 |
Fertility by Education by Marriage Status in Strong
| Educational Attainment | Married | Unmarried |
| Less than High School | 0 (0.0%) | 0 (0.0%) |
| High School Diploma | 0 (0.0%) | 0 (0.0%) |
| College or Associate's Degree | 0 (0.0%) | 0 (0.0%) |
| Bachelor's Degree | 0 (0.0%) | 0 (0.0%) |
| Graduate Degree | 0 (0.0%) | 0 (0.0%) |
| Total | 0 (0.0%) | 0 (0.0%) |
Employment Characteristics in Strong
Employment by Class of Employer in Strong
Among the 110 employed individuals in Strong, private company employees (74 | 67.3%), state government employees (32 | 29.1%), and self-employed (not incorporated) (2 | 1.8%) make up the most common classes of employment.
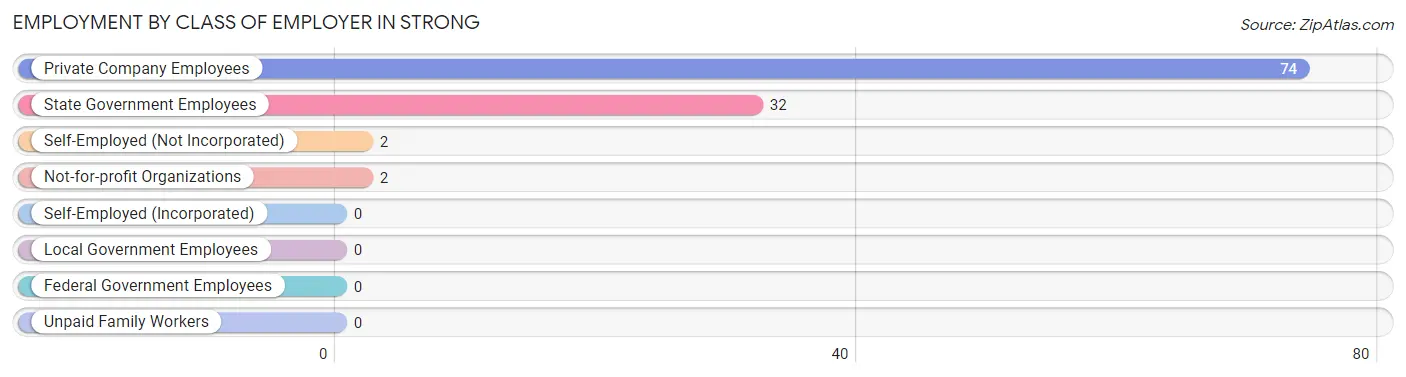
| Employer Class | # Employees | % Employees |
| Private Company Employees | 74 | 67.3% |
| Self-Employed (Incorporated) | 0 | 0.0% |
| Self-Employed (Not Incorporated) | 2 | 1.8% |
| Not-for-profit Organizations | 2 | 1.8% |
| Local Government Employees | 0 | 0.0% |
| State Government Employees | 32 | 29.1% |
| Federal Government Employees | 0 | 0.0% |
| Unpaid Family Workers | 0 | 0.0% |
| Total | 110 | 100.0% |
Employment Status by Age in Strong
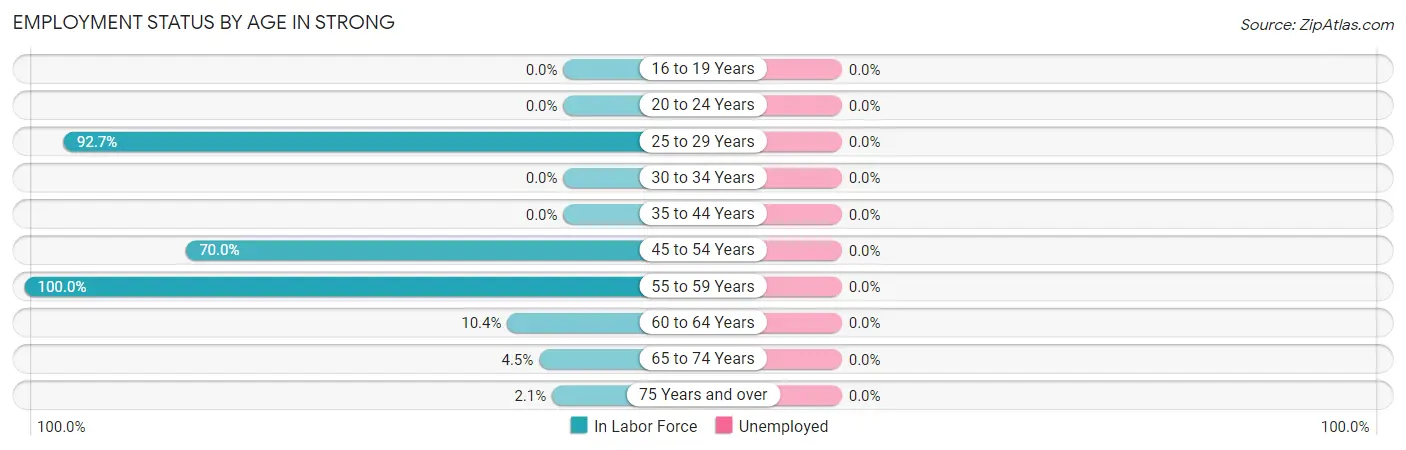
| Age Bracket | In Labor Force | Unemployed |
| 16 to 19 Years | 0 (0.0%) | 0 (0.0%) |
| 20 to 24 Years | 0 (0.0%) | 0 (0.0%) |
| 25 to 29 Years | 76 (92.7%) | 0 (0.0%) |
| 30 to 34 Years | 0 (0.0%) | 0 (0.0%) |
| 35 to 44 Years | 0 (0.0%) | 0 (0.0%) |
| 45 to 54 Years | 21 (70.0%) | 0 (0.0%) |
| 55 to 59 Years | 2 (100.0%) | 0 (0.0%) |
| 60 to 64 Years | 7 (10.4%) | 0 (0.0%) |
| 65 to 74 Years | 2 (4.5%) | 0 (0.0%) |
| 75 Years and over | 2 (2.1%) | 0 (0.0%) |
| Total | 110 (31.4%) | 0 (0.0%) |
Employment Status by Educational Attainment in Strong
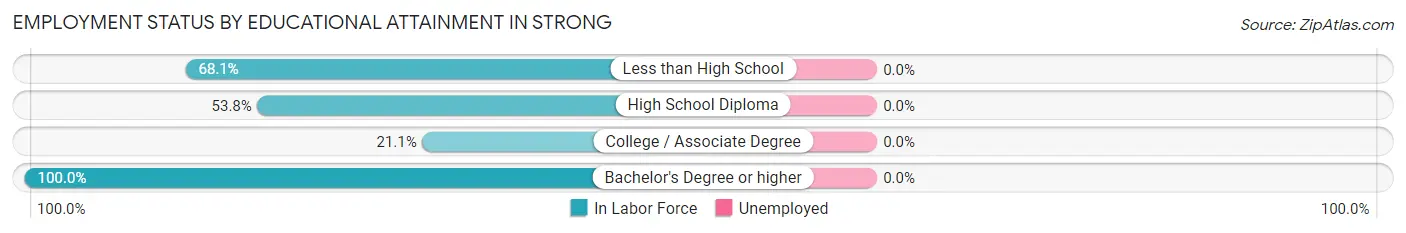
| Educational Attainment | In Labor Force | Unemployed |
| Less than High School | 32 (68.1%) | 0 (0.0%) |
| High School Diploma | 35 (53.8%) | 0 (0.0%) |
| College / Associate Degree | 16 (21.1%) | 0 (0.0%) |
| Bachelor's Degree or higher | 23 (100.0%) | 0 (0.0%) |
| Total | 106 (50.2%) | 0 (0.0%) |
Employment Occupations by Sex in Strong
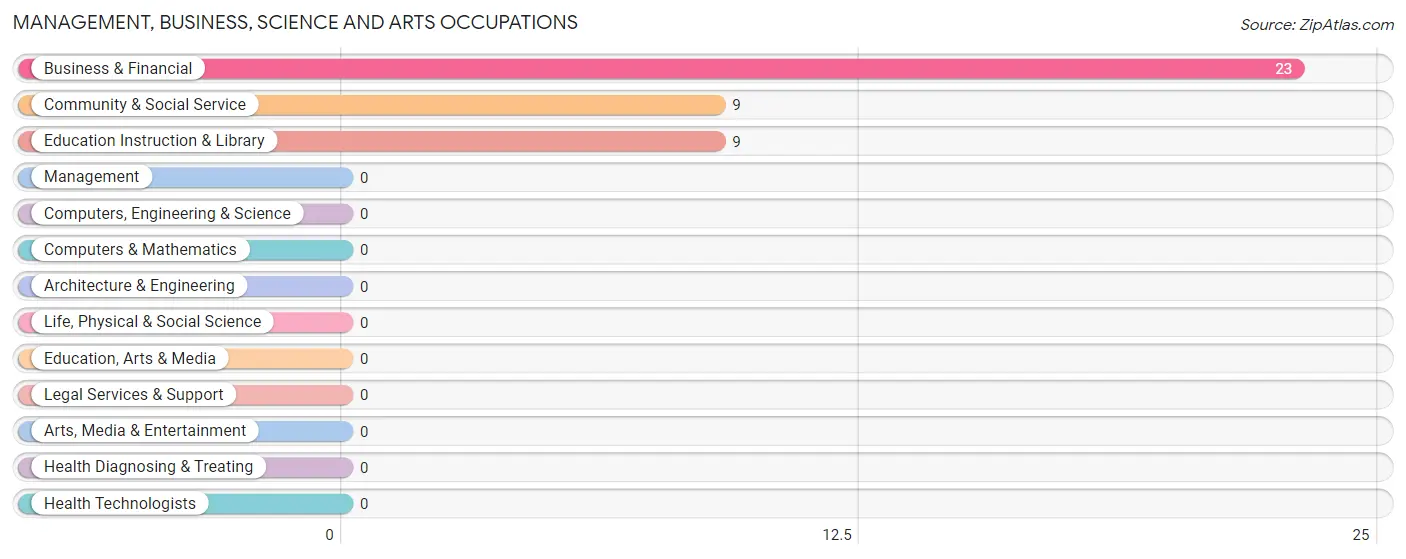
Management, Business, Science and Arts Occupations
The most common Management, Business, Science and Arts occupations in Strong are Business & Financial (23 | 20.9%), Community & Social Service (9 | 8.2%), and Education Instruction & Library (9 | 8.2%).
Management, Business, Science and Arts Occupations by Sex
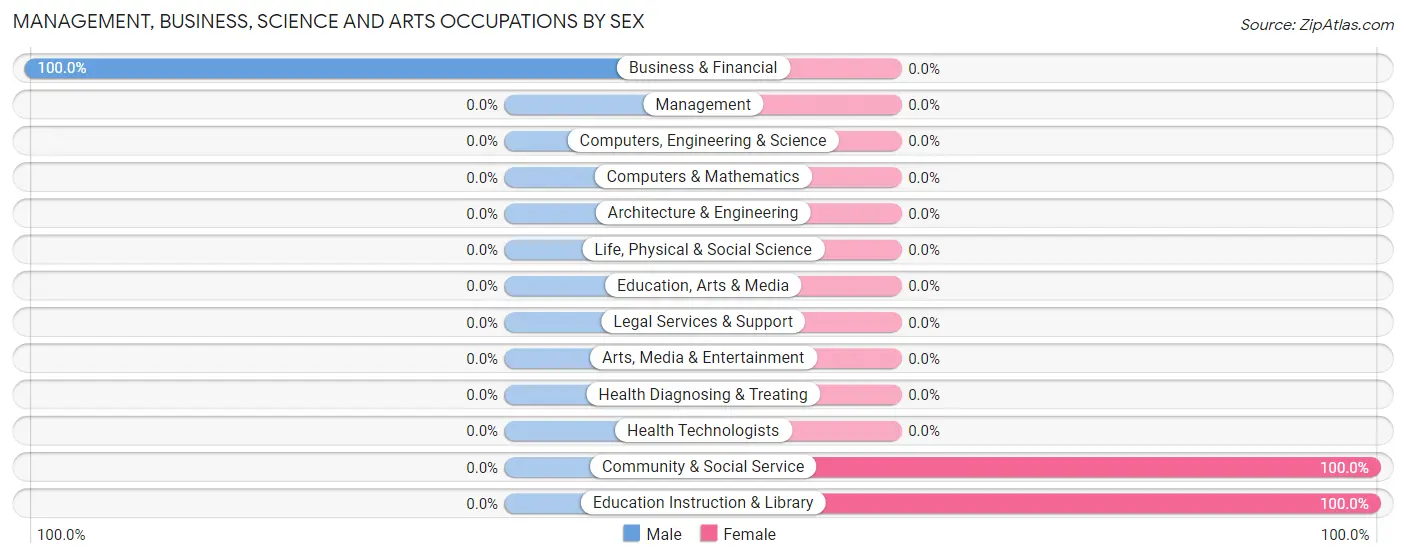
| Occupation | Male | Female |
| Management | 0 (0.0%) | 0 (0.0%) |
| Business & Financial | 23 (100.0%) | 0 (0.0%) |
| Computers, Engineering & Science | 0 (0.0%) | 0 (0.0%) |
| Computers & Mathematics | 0 (0.0%) | 0 (0.0%) |
| Architecture & Engineering | 0 (0.0%) | 0 (0.0%) |
| Life, Physical & Social Science | 0 (0.0%) | 0 (0.0%) |
| Community & Social Service | 0 (0.0%) | 9 (100.0%) |
| Education, Arts & Media | 0 (0.0%) | 0 (0.0%) |
| Legal Services & Support | 0 (0.0%) | 0 (0.0%) |
| Education Instruction & Library | 0 (0.0%) | 9 (100.0%) |
| Arts, Media & Entertainment | 0 (0.0%) | 0 (0.0%) |
| Health Diagnosing & Treating | 0 (0.0%) | 0 (0.0%) |
| Health Technologists | 0 (0.0%) | 0 (0.0%) |
| Total (Category) | 23 (71.9%) | 9 (28.1%) |
| Total (Overall) | 69 (62.7%) | 41 (37.3%) |
Services Occupations
Services Occupations by Sex
| Occupation | Male | Female |
| Healthcare Support | 0 (0.0%) | 0 (0.0%) |
| Security & Protection | 0 (0.0%) | 0 (0.0%) |
| Firefighting & Prevention | 0 (0.0%) | 0 (0.0%) |
| Law Enforcement | 0 (0.0%) | 0 (0.0%) |
| Food Preparation & Serving | 0 (0.0%) | 0 (0.0%) |
| Cleaning & Maintenance | 0 (0.0%) | 0 (0.0%) |
| Personal Care & Service | 0 (0.0%) | 0 (0.0%) |
| Total (Category) | 0 (0.0%) | 0 (0.0%) |
| Total (Overall) | 69 (62.7%) | 41 (37.3%) |
Sales and Office Occupations
The most common Sales and Office occupations in Strong are Sales & Related (30 | 27.3%), and Office & Administration (2 | 1.8%).
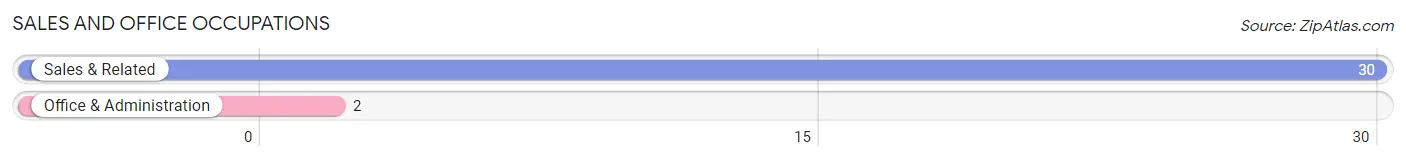
Sales and Office Occupations by Sex
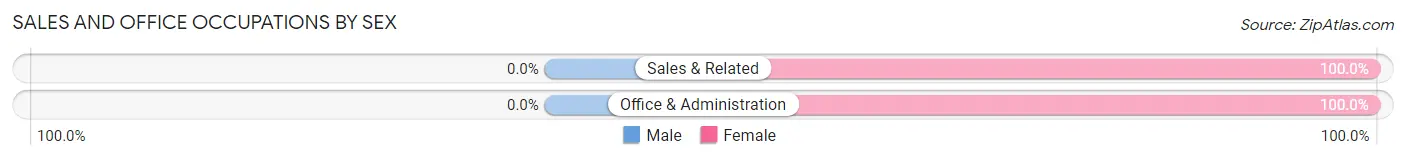
| Occupation | Male | Female |
| Sales & Related | 0 (0.0%) | 30 (100.0%) |
| Office & Administration | 0 (0.0%) | 2 (100.0%) |
| Total (Category) | 0 (0.0%) | 32 (100.0%) |
| Total (Overall) | 69 (62.7%) | 41 (37.3%) |
Natural Resources, Construction and Maintenance Occupations
The most common Natural Resources, Construction and Maintenance occupations in Strong are , and Construction & Extraction (32 | 29.1%).
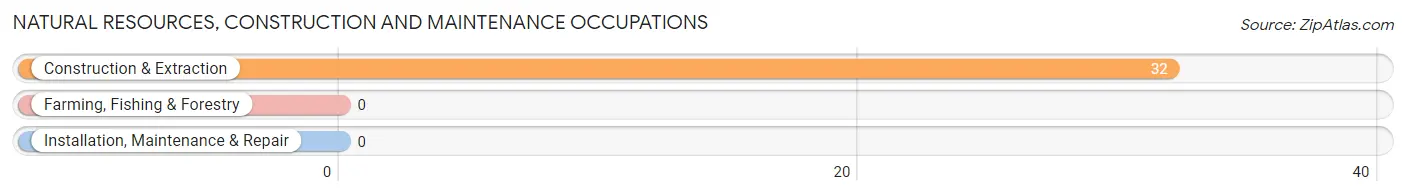
Natural Resources, Construction and Maintenance Occupations by Sex
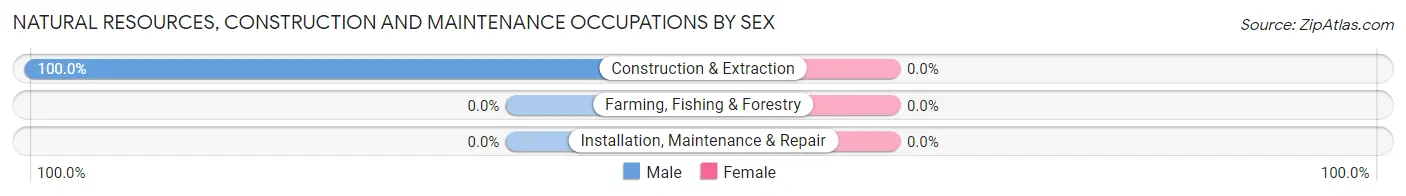
| Occupation | Male | Female |
| Farming, Fishing & Forestry | 0 (0.0%) | 0 (0.0%) |
| Construction & Extraction | 32 (100.0%) | 0 (0.0%) |
| Installation, Maintenance & Repair | 0 (0.0%) | 0 (0.0%) |
| Total (Category) | 32 (100.0%) | 0 (0.0%) |
| Total (Overall) | 69 (62.7%) | 41 (37.3%) |
Production, Transportation and Moving Occupations
The most common Production, Transportation and Moving occupations in Strong are , and Production (14 | 12.7%).
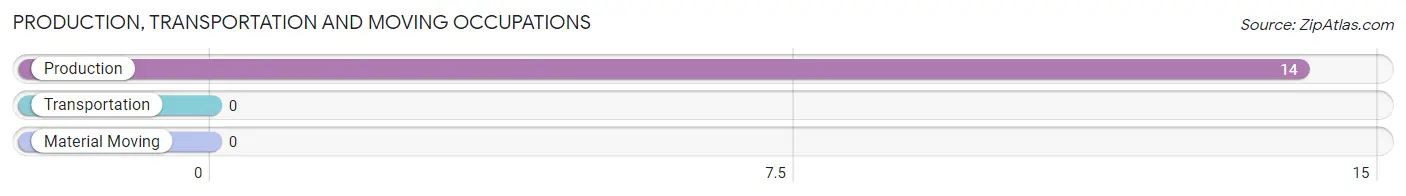
Production, Transportation and Moving Occupations by Sex
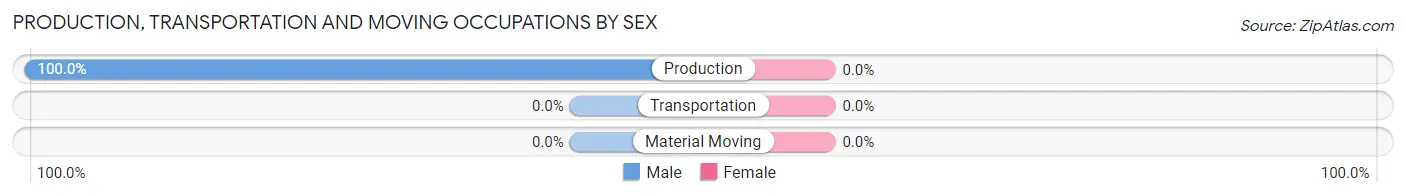
| Occupation | Male | Female |
| Production | 14 (100.0%) | 0 (0.0%) |
| Transportation | 0 (0.0%) | 0 (0.0%) |
| Material Moving | 0 (0.0%) | 0 (0.0%) |
| Total (Category) | 14 (100.0%) | 0 (0.0%) |
| Total (Overall) | 69 (62.7%) | 41 (37.3%) |
Employment Industries by Sex in Strong
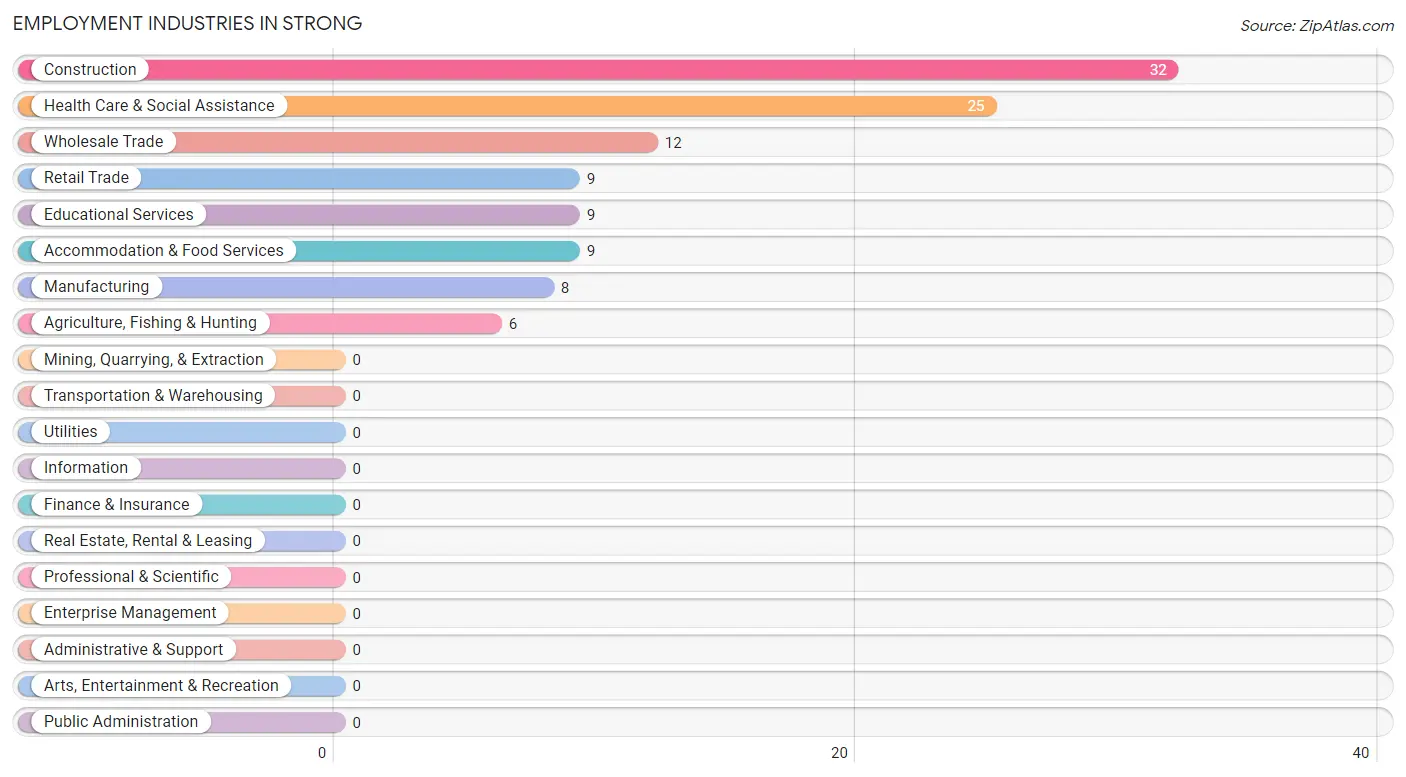
Employment Industries in Strong
The major employment industries in Strong include Construction (32 | 29.1%), Health Care & Social Assistance (25 | 22.7%), Wholesale Trade (12 | 10.9%), Retail Trade (9 | 8.2%), and Educational Services (9 | 8.2%).
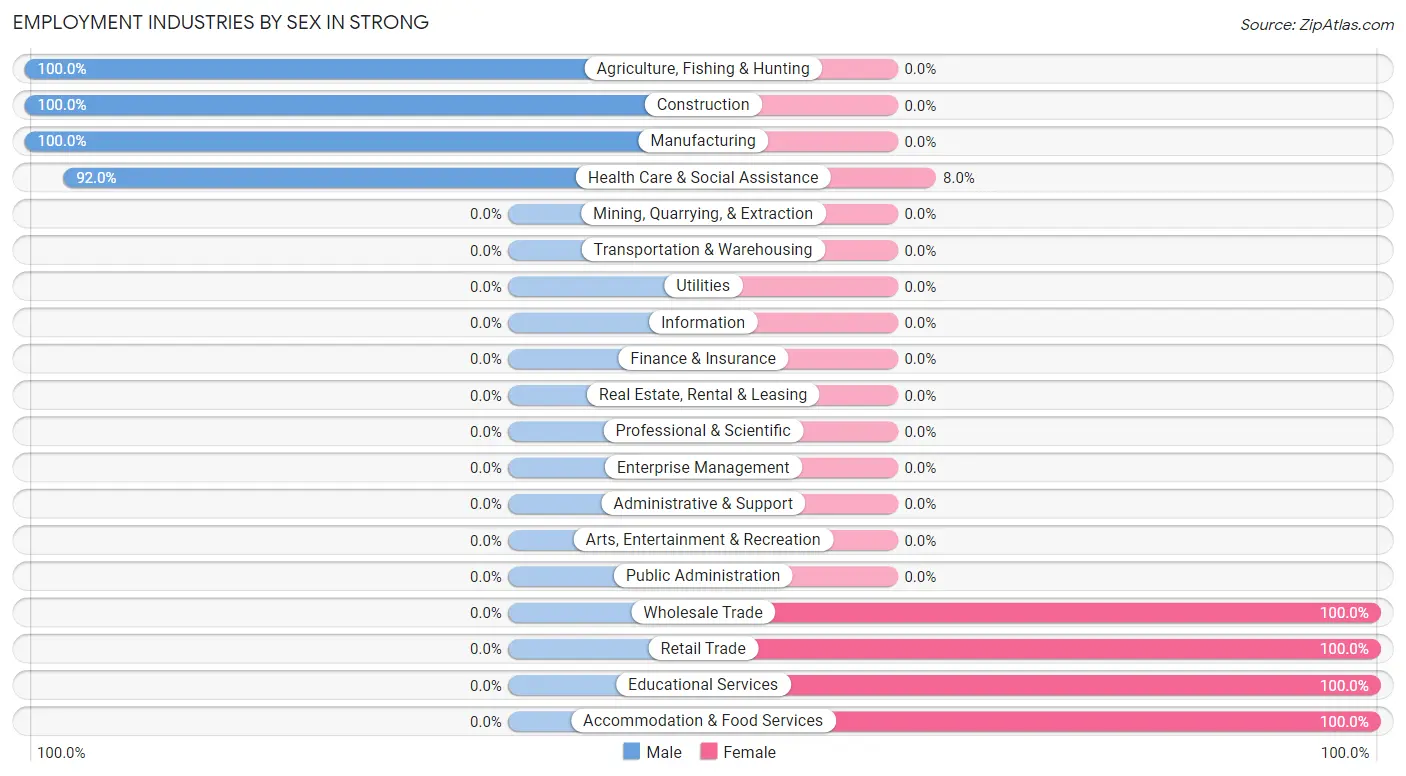
Employment Industries by Sex in Strong
The Strong industries that see more men than women are Agriculture, Fishing & Hunting (100.0%), Construction (100.0%), and Manufacturing (100.0%), whereas the industries that tend to have a higher number of women are Wholesale Trade (100.0%), Retail Trade (100.0%), and Educational Services (100.0%).
| Industry | Male | Female |
| Agriculture, Fishing & Hunting | 6 (100.0%) | 0 (0.0%) |
| Mining, Quarrying, & Extraction | 0 (0.0%) | 0 (0.0%) |
| Construction | 32 (100.0%) | 0 (0.0%) |
| Manufacturing | 8 (100.0%) | 0 (0.0%) |
| Wholesale Trade | 0 (0.0%) | 12 (100.0%) |
| Retail Trade | 0 (0.0%) | 9 (100.0%) |
| Transportation & Warehousing | 0 (0.0%) | 0 (0.0%) |
| Utilities | 0 (0.0%) | 0 (0.0%) |
| Information | 0 (0.0%) | 0 (0.0%) |
| Finance & Insurance | 0 (0.0%) | 0 (0.0%) |
| Real Estate, Rental & Leasing | 0 (0.0%) | 0 (0.0%) |
| Professional & Scientific | 0 (0.0%) | 0 (0.0%) |
| Enterprise Management | 0 (0.0%) | 0 (0.0%) |
| Administrative & Support | 0 (0.0%) | 0 (0.0%) |
| Educational Services | 0 (0.0%) | 9 (100.0%) |
| Health Care & Social Assistance | 23 (92.0%) | 2 (8.0%) |
| Arts, Entertainment & Recreation | 0 (0.0%) | 0 (0.0%) |
| Accommodation & Food Services | 0 (0.0%) | 9 (100.0%) |
| Public Administration | 0 (0.0%) | 0 (0.0%) |
| Total | 69 (62.7%) | 41 (37.3%) |
Education in Strong
School Enrollment in Strong
The most common levels of schooling among the 19 students in Strong are middle school (15 | 78.9%), kindergarten (2 | 10.5%), and graduate / professional (2 | 10.5%).
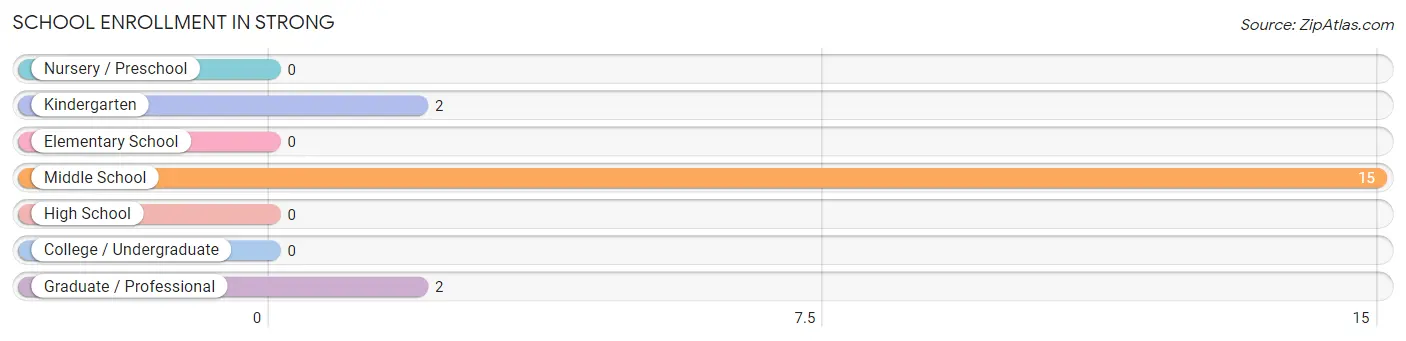
| School Level | # Students | % Students |
| Nursery / Preschool | 0 | 0.0% |
| Kindergarten | 2 | 10.5% |
| Elementary School | 0 | 0.0% |
| Middle School | 15 | 78.9% |
| High School | 0 | 0.0% |
| College / Undergraduate | 0 | 0.0% |
| Graduate / Professional | 2 | 10.5% |
| Total | 19 | 100.0% |
School Enrollment by Age by Funding Source in Strong
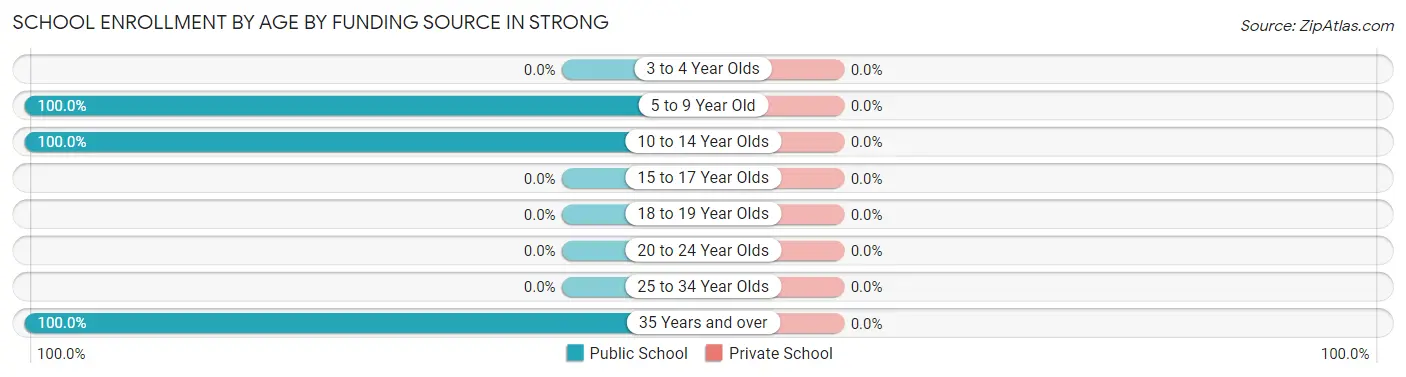
| Age Bracket | Public School | Private School |
| 3 to 4 Year Olds | 0 (0.0%) | 0 (0.0%) |
| 5 to 9 Year Old | 2 (100.0%) | 0 (0.0%) |
| 10 to 14 Year Olds | 15 (100.0%) | 0 (0.0%) |
| 15 to 17 Year Olds | 0 (0.0%) | 0 (0.0%) |
| 18 to 19 Year Olds | 0 (0.0%) | 0 (0.0%) |
| 20 to 24 Year Olds | 0 (0.0%) | 0 (0.0%) |
| 25 to 34 Year Olds | 0 (0.0%) | 0 (0.0%) |
| 35 Years and over | 2 (100.0%) | 0 (0.0%) |
| Total | 19 (100.0%) | 0 (0.0%) |
Educational Attainment by Field of Study in Strong
Business (23 | 74.2%), education (6 | 19.4%), and social sciences (2 | 6.5%) are the most common fields of study among 31 individuals in Strong who have obtained a bachelor's degree or higher.
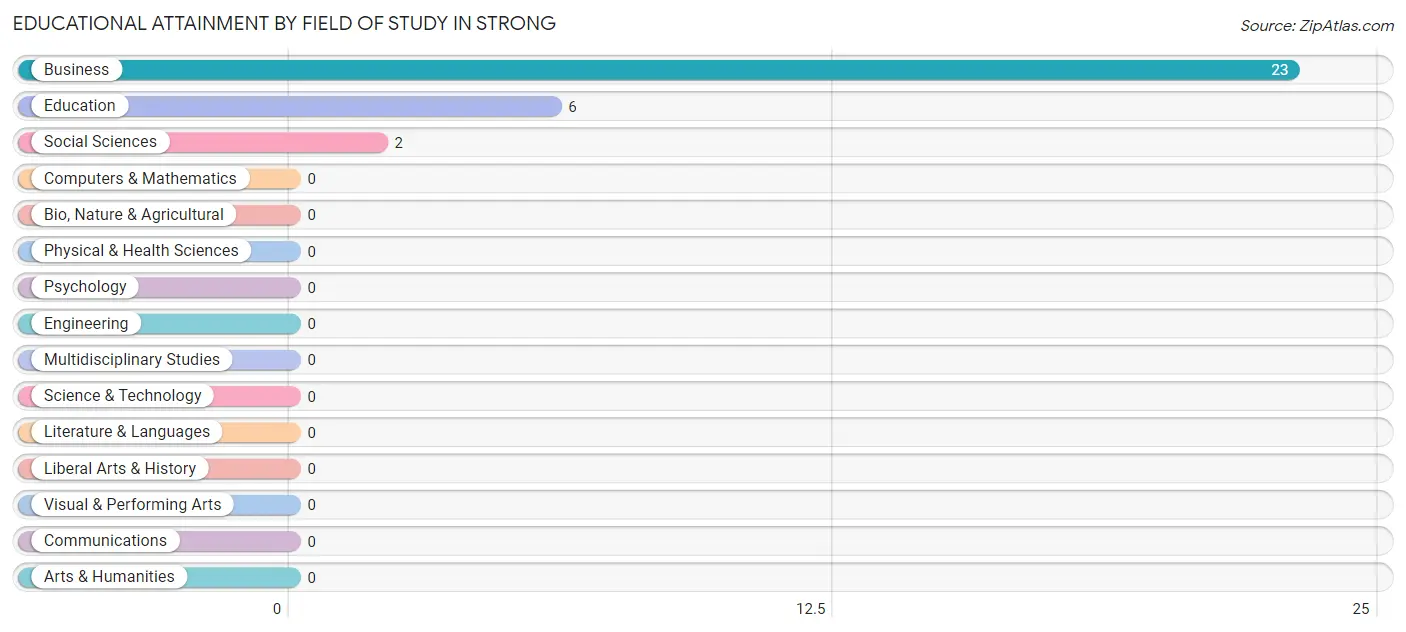
| Field of Study | # Graduates | % Graduates |
| Computers & Mathematics | 0 | 0.0% |
| Bio, Nature & Agricultural | 0 | 0.0% |
| Physical & Health Sciences | 0 | 0.0% |
| Psychology | 0 | 0.0% |
| Social Sciences | 2 | 6.5% |
| Engineering | 0 | 0.0% |
| Multidisciplinary Studies | 0 | 0.0% |
| Science & Technology | 0 | 0.0% |
| Business | 23 | 74.2% |
| Education | 6 | 19.4% |
| Literature & Languages | 0 | 0.0% |
| Liberal Arts & History | 0 | 0.0% |
| Visual & Performing Arts | 0 | 0.0% |
| Communications | 0 | 0.0% |
| Arts & Humanities | 0 | 0.0% |
| Total | 31 | 100.0% |
Transportation & Commute in Strong
Vehicle Availability by Sex in Strong
The most prevalent vehicle ownership categories in Strong are males with 3 vehicles (36, accounting for 52.2%) and females with 3 vehicles (0, making up 87.8%).
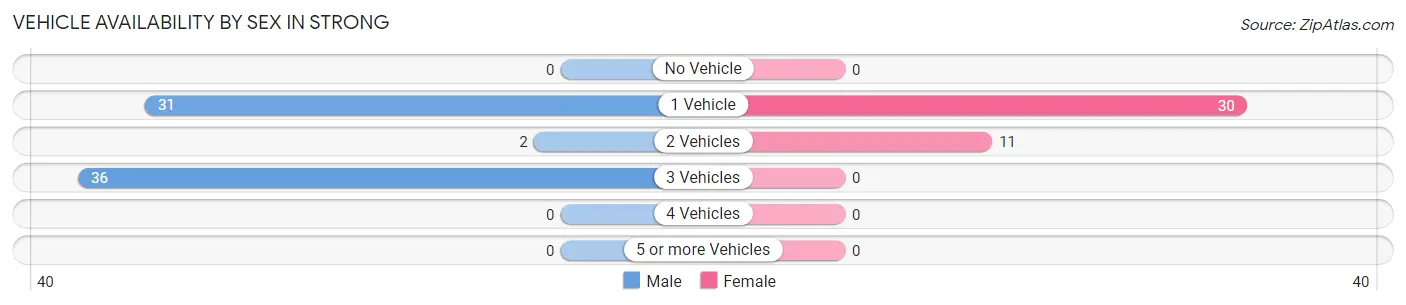
| Vehicles Available | Male | Female |
| No Vehicle | 0 (0.0%) | 0 (0.0%) |
| 1 Vehicle | 31 (44.9%) | 30 (73.2%) |
| 2 Vehicles | 2 (2.9%) | 11 (26.8%) |
| 3 Vehicles | 36 (52.2%) | 0 (0.0%) |
| 4 Vehicles | 0 (0.0%) | 0 (0.0%) |
| 5 or more Vehicles | 0 (0.0%) | 0 (0.0%) |
| Total | 69 (100.0%) | 41 (100.0%) |
Commute Time in Strong
The most frequently occuring commute durations in Strong are 60 to 89 minutes (30 commuters, 27.3%), 90 or more minutes (23 commuters, 20.9%), and 10 to 14 minutes (19 commuters, 17.3%).
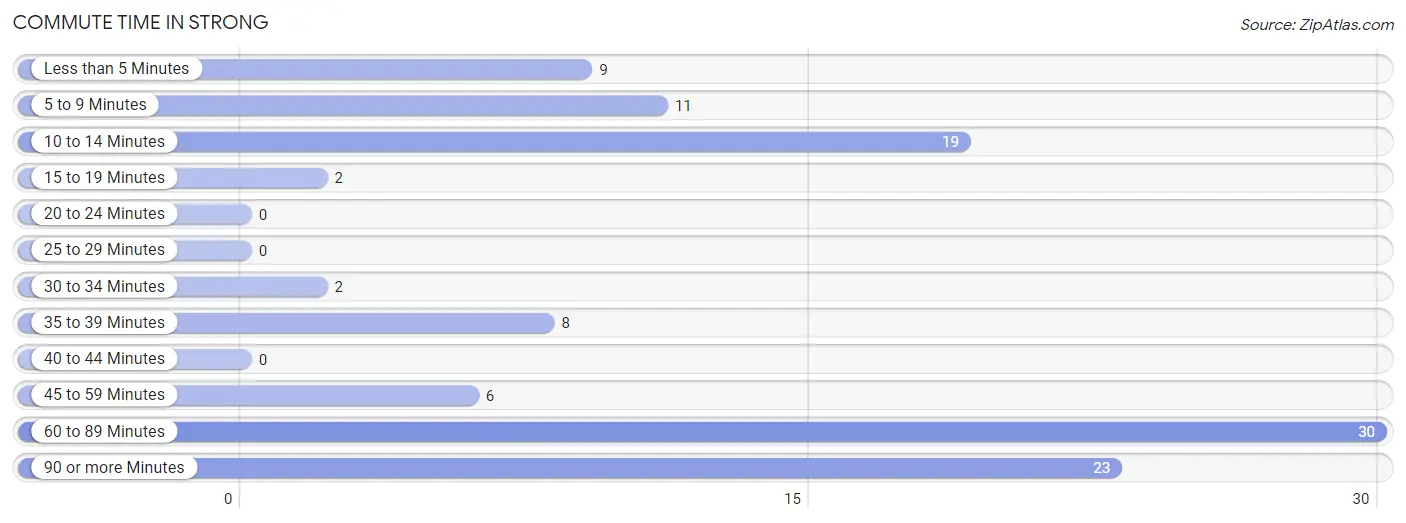
| Commute Time | # Commuters | % Commuters |
| Less than 5 Minutes | 9 | 8.2% |
| 5 to 9 Minutes | 11 | 10.0% |
| 10 to 14 Minutes | 19 | 17.3% |
| 15 to 19 Minutes | 2 | 1.8% |
| 20 to 24 Minutes | 0 | 0.0% |
| 25 to 29 Minutes | 0 | 0.0% |
| 30 to 34 Minutes | 2 | 1.8% |
| 35 to 39 Minutes | 8 | 7.3% |
| 40 to 44 Minutes | 0 | 0.0% |
| 45 to 59 Minutes | 6 | 5.4% |
| 60 to 89 Minutes | 30 | 27.3% |
| 90 or more Minutes | 23 | 20.9% |
Commute Time by Sex in Strong
The most common commute times in Strong are 60 to 89 minutes (30 commuters, 43.5%) for males and 10 to 14 minutes (19 commuters, 46.3%) for females.
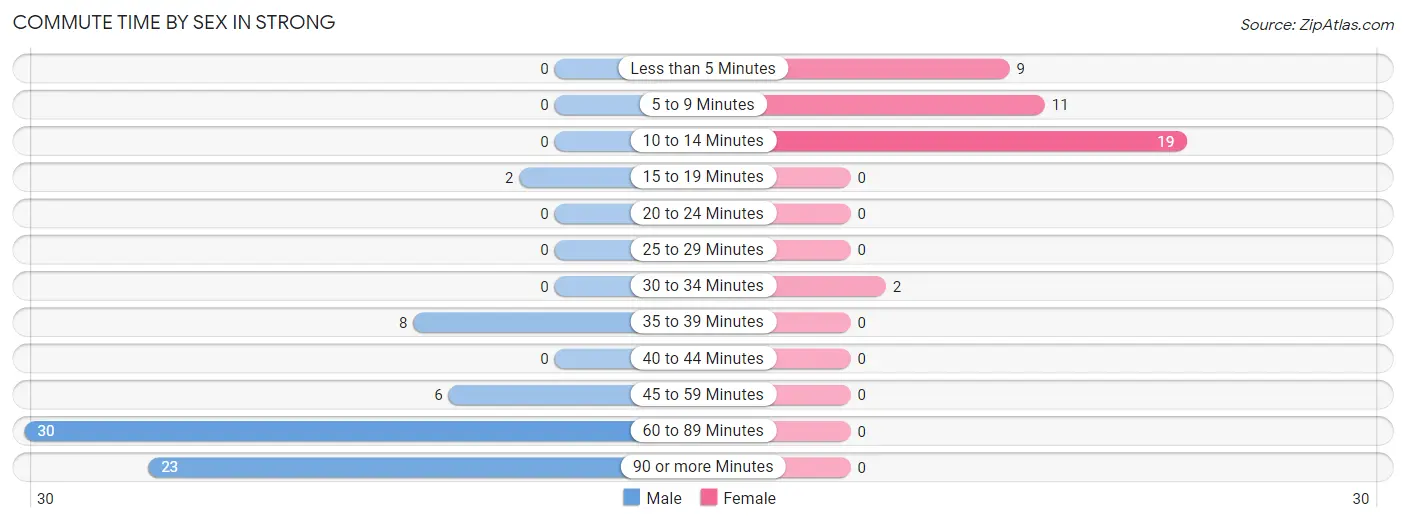
| Commute Time | Male | Female |
| Less than 5 Minutes | 0 (0.0%) | 9 (22.0%) |
| 5 to 9 Minutes | 0 (0.0%) | 11 (26.8%) |
| 10 to 14 Minutes | 0 (0.0%) | 19 (46.3%) |
| 15 to 19 Minutes | 2 (2.9%) | 0 (0.0%) |
| 20 to 24 Minutes | 0 (0.0%) | 0 (0.0%) |
| 25 to 29 Minutes | 0 (0.0%) | 0 (0.0%) |
| 30 to 34 Minutes | 0 (0.0%) | 2 (4.9%) |
| 35 to 39 Minutes | 8 (11.6%) | 0 (0.0%) |
| 40 to 44 Minutes | 0 (0.0%) | 0 (0.0%) |
| 45 to 59 Minutes | 6 (8.7%) | 0 (0.0%) |
| 60 to 89 Minutes | 30 (43.5%) | 0 (0.0%) |
| 90 or more Minutes | 23 (33.3%) | 0 (0.0%) |
Time of Departure to Work by Sex in Strong
The most frequent times of departure to work in Strong are 7:00 AM to 7:29 AM (53, 76.8%) for males and 6:30 AM to 6:59 AM (12, 29.3%) for females.
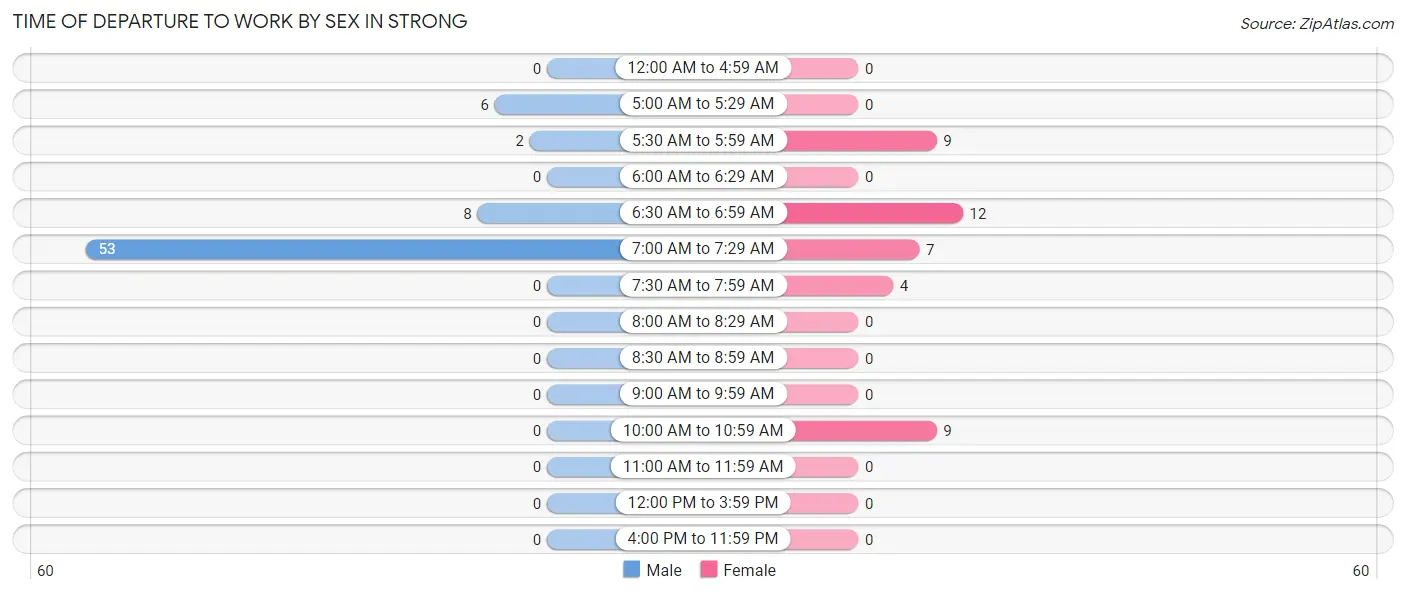
| Time of Departure | Male | Female |
| 12:00 AM to 4:59 AM | 0 (0.0%) | 0 (0.0%) |
| 5:00 AM to 5:29 AM | 6 (8.7%) | 0 (0.0%) |
| 5:30 AM to 5:59 AM | 2 (2.9%) | 9 (22.0%) |
| 6:00 AM to 6:29 AM | 0 (0.0%) | 0 (0.0%) |
| 6:30 AM to 6:59 AM | 8 (11.6%) | 12 (29.3%) |
| 7:00 AM to 7:29 AM | 53 (76.8%) | 7 (17.1%) |
| 7:30 AM to 7:59 AM | 0 (0.0%) | 4 (9.8%) |
| 8:00 AM to 8:29 AM | 0 (0.0%) | 0 (0.0%) |
| 8:30 AM to 8:59 AM | 0 (0.0%) | 0 (0.0%) |
| 9:00 AM to 9:59 AM | 0 (0.0%) | 0 (0.0%) |
| 10:00 AM to 10:59 AM | 0 (0.0%) | 9 (22.0%) |
| 11:00 AM to 11:59 AM | 0 (0.0%) | 0 (0.0%) |
| 12:00 PM to 3:59 PM | 0 (0.0%) | 0 (0.0%) |
| 4:00 PM to 11:59 PM | 0 (0.0%) | 0 (0.0%) |
| Total | 69 (100.0%) | 41 (100.0%) |
Housing Occupancy in Strong
Occupancy by Ownership in Strong
Of the total 239 dwellings in Strong, owner-occupied units account for 176 (73.6%), while renter-occupied units make up 63 (26.4%).
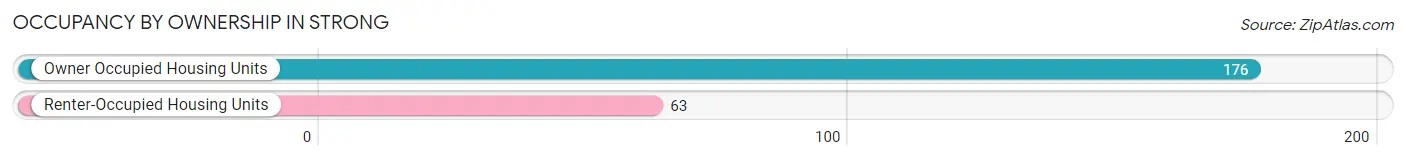
| Occupancy | # Housing Units | % Housing Units |
| Owner Occupied Housing Units | 176 | 73.6% |
| Renter-Occupied Housing Units | 63 | 26.4% |
| Total Occupied Housing Units | 239 | 100.0% |
Occupancy by Household Size in Strong
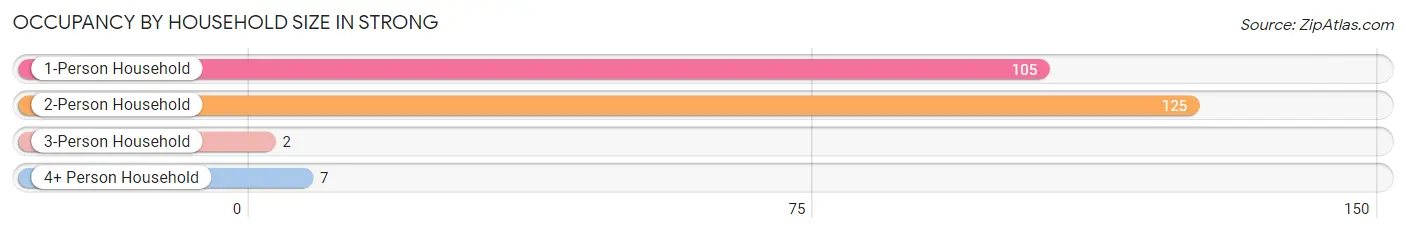
| Household Size | # Housing Units | % Housing Units |
| 1-Person Household | 105 | 43.9% |
| 2-Person Household | 125 | 52.3% |
| 3-Person Household | 2 | 0.8% |
| 4+ Person Household | 7 | 2.9% |
| Total Housing Units | 239 | 100.0% |
Occupancy by Ownership by Household Size in Strong
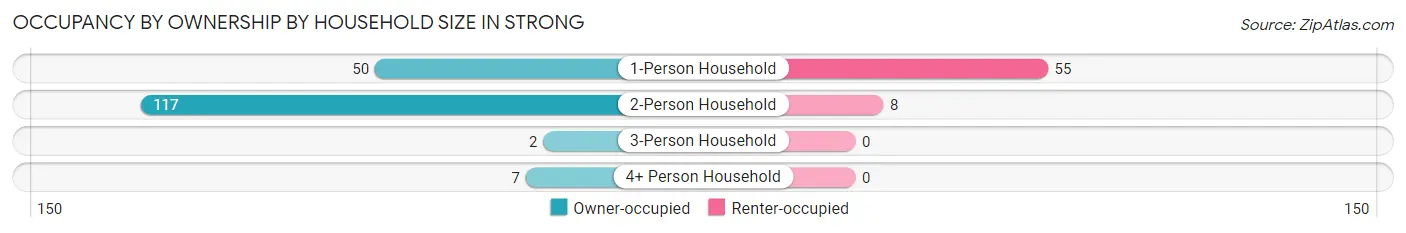
| Household Size | Owner-occupied | Renter-occupied |
| 1-Person Household | 50 (47.6%) | 55 (52.4%) |
| 2-Person Household | 117 (93.6%) | 8 (6.4%) |
| 3-Person Household | 2 (100.0%) | 0 (0.0%) |
| 4+ Person Household | 7 (100.0%) | 0 (0.0%) |
| Total Housing Units | 176 (73.6%) | 63 (26.4%) |
Occupancy by Educational Attainment in Strong
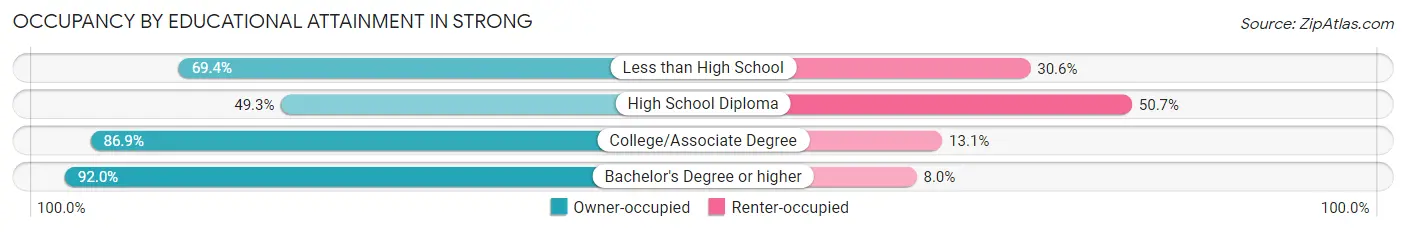
| Household Size | Owner-occupied | Renter-occupied |
| Less than High School | 25 (69.4%) | 11 (30.6%) |
| High School Diploma | 35 (49.3%) | 36 (50.7%) |
| College/Associate Degree | 93 (86.9%) | 14 (13.1%) |
| Bachelor's Degree or higher | 23 (92.0%) | 2 (8.0%) |
Occupancy by Age of Householder in Strong
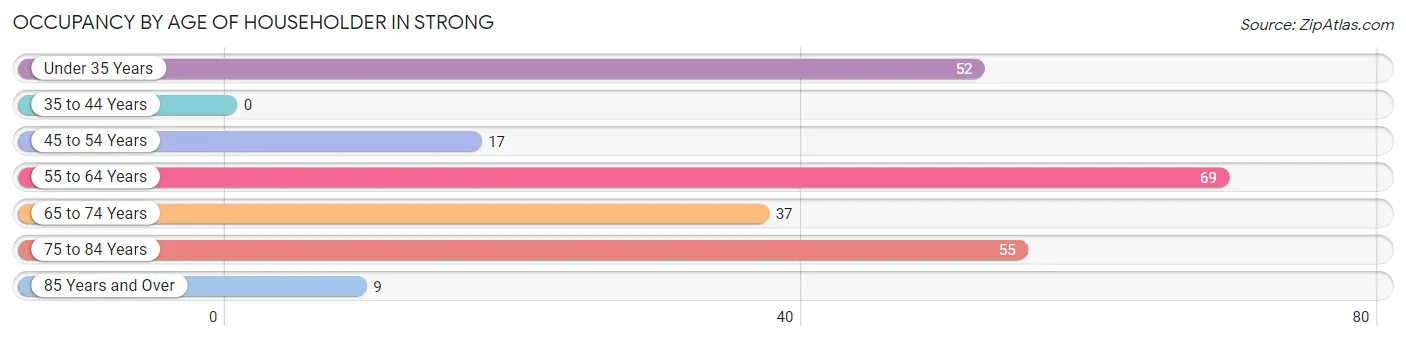
| Age Bracket | # Households | % Households |
| Under 35 Years | 52 | 21.8% |
| 35 to 44 Years | 0 | 0.0% |
| 45 to 54 Years | 17 | 7.1% |
| 55 to 64 Years | 69 | 28.9% |
| 65 to 74 Years | 37 | 15.5% |
| 75 to 84 Years | 55 | 23.0% |
| 85 Years and Over | 9 | 3.8% |
| Total | 239 | 100.0% |
Housing Finances in Strong
Median Income by Occupancy in Strong
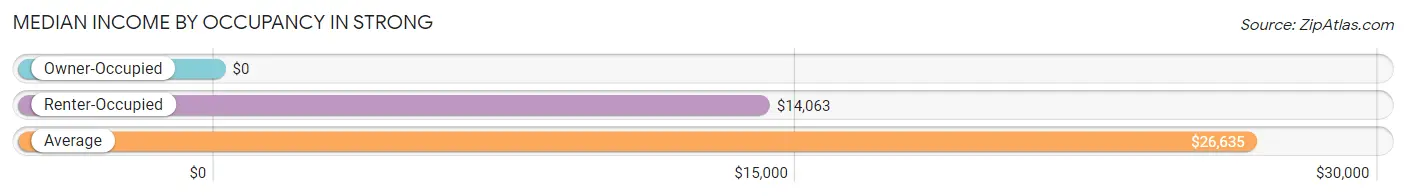
| Occupancy Type | # Households | Median Income |
| Owner-Occupied | 176 (73.6%) | $0 |
| Renter-Occupied | 63 (26.4%) | $14,063 |
| Average | 239 (100.0%) | $26,635 |
Occupancy by Householder Income Bracket in Strong
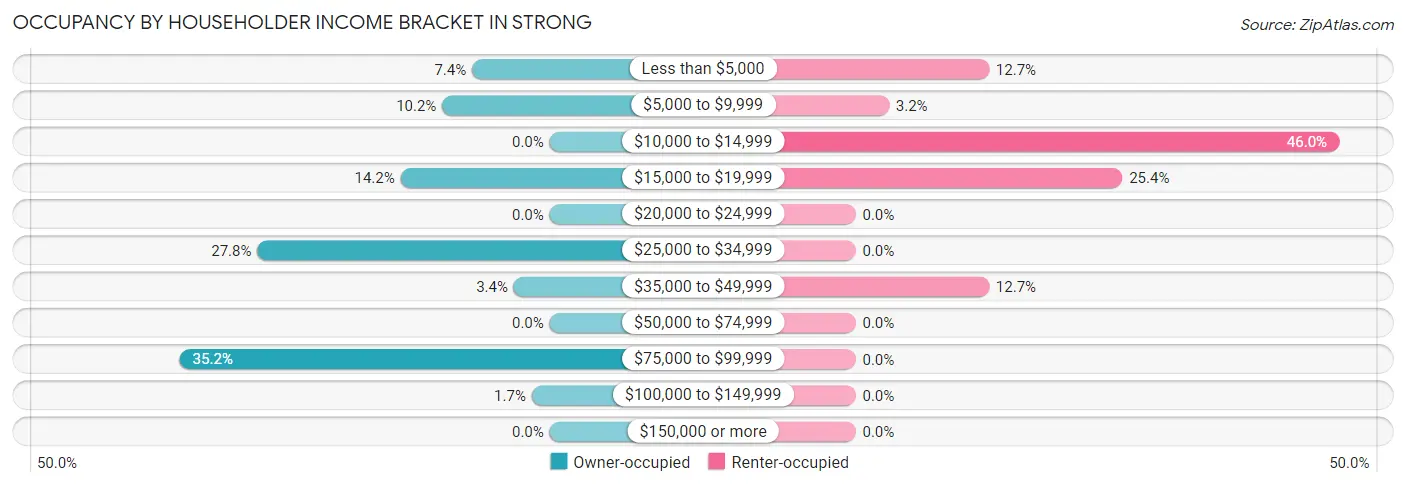
| Income Bracket | Owner-occupied | Renter-occupied |
| Less than $5,000 | 13 (7.4%) | 8 (12.7%) |
| $5,000 to $9,999 | 18 (10.2%) | 2 (3.2%) |
| $10,000 to $14,999 | 0 (0.0%) | 29 (46.0%) |
| $15,000 to $19,999 | 25 (14.2%) | 16 (25.4%) |
| $20,000 to $24,999 | 0 (0.0%) | 0 (0.0%) |
| $25,000 to $34,999 | 49 (27.8%) | 0 (0.0%) |
| $35,000 to $49,999 | 6 (3.4%) | 8 (12.7%) |
| $50,000 to $74,999 | 0 (0.0%) | 0 (0.0%) |
| $75,000 to $99,999 | 62 (35.2%) | 0 (0.0%) |
| $100,000 to $149,999 | 3 (1.7%) | 0 (0.0%) |
| $150,000 or more | 0 (0.0%) | 0 (0.0%) |
| Total | 176 (100.0%) | 63 (100.0%) |
Monthly Housing Cost Tiers in Strong
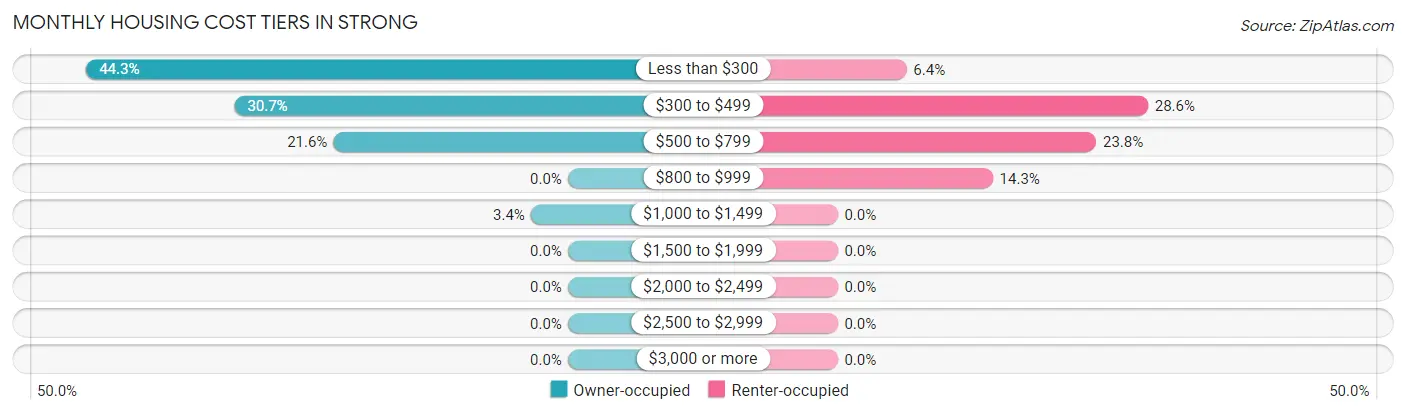
| Monthly Cost | Owner-occupied | Renter-occupied |
| Less than $300 | 78 (44.3%) | 4 (6.4%) |
| $300 to $499 | 54 (30.7%) | 18 (28.6%) |
| $500 to $799 | 38 (21.6%) | 15 (23.8%) |
| $800 to $999 | 0 (0.0%) | 9 (14.3%) |
| $1,000 to $1,499 | 6 (3.4%) | 0 (0.0%) |
| $1,500 to $1,999 | 0 (0.0%) | 0 (0.0%) |
| $2,000 to $2,499 | 0 (0.0%) | 0 (0.0%) |
| $2,500 to $2,999 | 0 (0.0%) | 0 (0.0%) |
| $3,000 or more | 0 (0.0%) | 0 (0.0%) |
| Total | 176 (100.0%) | 63 (100.0%) |
Physical Housing Characteristics in Strong
Housing Structures in Strong
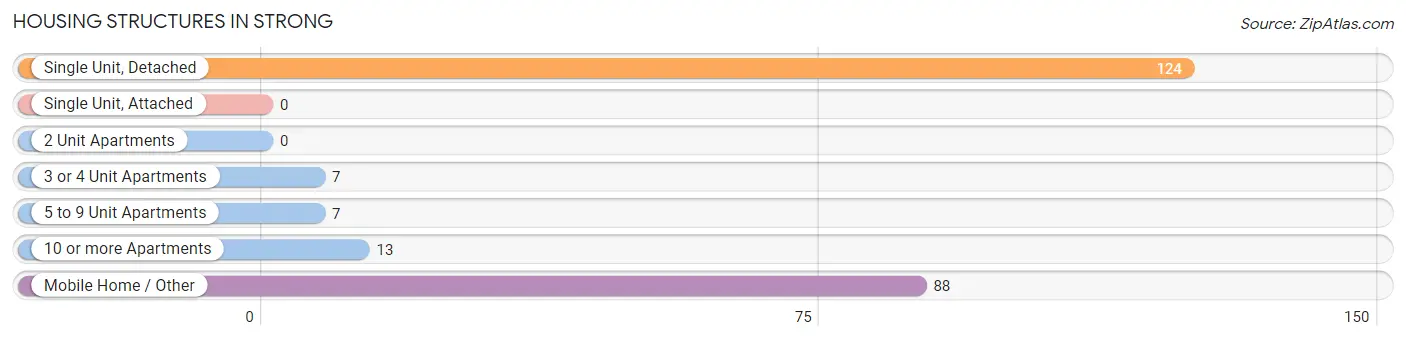
| Structure Type | # Housing Units | % Housing Units |
| Single Unit, Detached | 124 | 51.9% |
| Single Unit, Attached | 0 | 0.0% |
| 2 Unit Apartments | 0 | 0.0% |
| 3 or 4 Unit Apartments | 7 | 2.9% |
| 5 to 9 Unit Apartments | 7 | 2.9% |
| 10 or more Apartments | 13 | 5.4% |
| Mobile Home / Other | 88 | 36.8% |
| Total | 239 | 100.0% |
Housing Structures by Occupancy in Strong
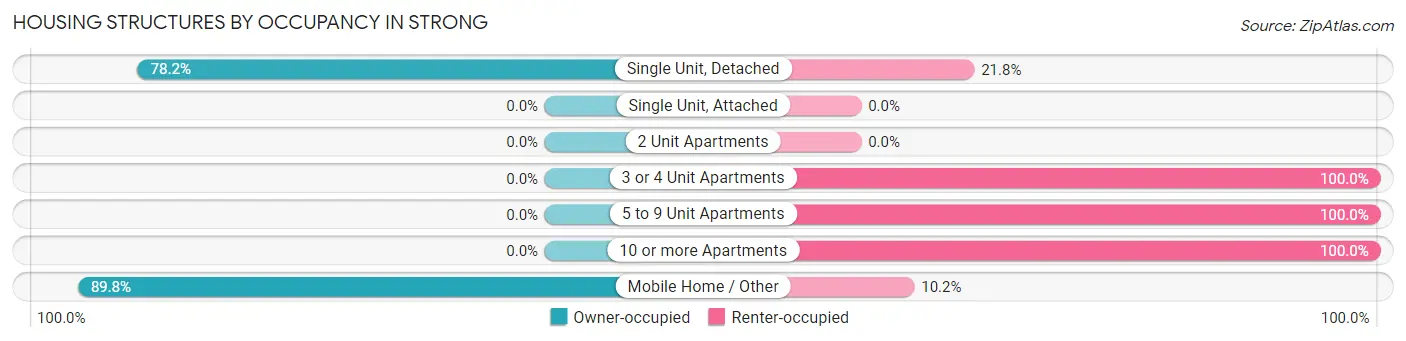
| Structure Type | Owner-occupied | Renter-occupied |
| Single Unit, Detached | 97 (78.2%) | 27 (21.8%) |
| Single Unit, Attached | 0 (0.0%) | 0 (0.0%) |
| 2 Unit Apartments | 0 (0.0%) | 0 (0.0%) |
| 3 or 4 Unit Apartments | 0 (0.0%) | 7 (100.0%) |
| 5 to 9 Unit Apartments | 0 (0.0%) | 7 (100.0%) |
| 10 or more Apartments | 0 (0.0%) | 13 (100.0%) |
| Mobile Home / Other | 79 (89.8%) | 9 (10.2%) |
| Total | 176 (73.6%) | 63 (26.4%) |
Housing Structures by Number of Rooms in Strong
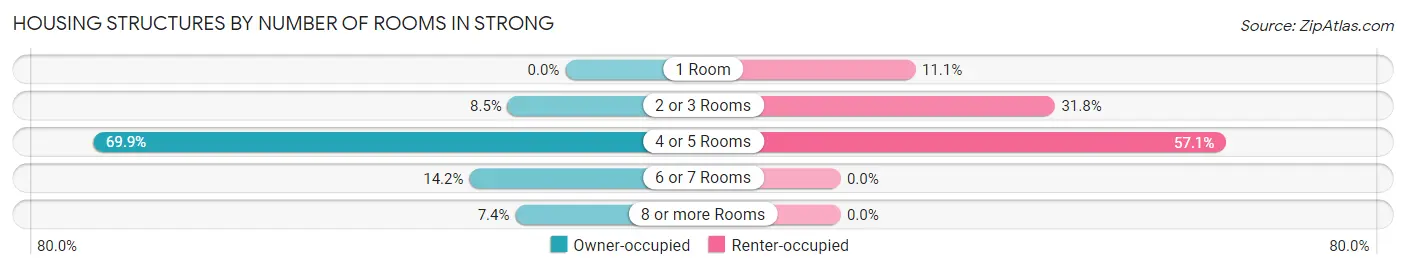
| Number of Rooms | Owner-occupied | Renter-occupied |
| 1 Room | 0 (0.0%) | 7 (11.1%) |
| 2 or 3 Rooms | 15 (8.5%) | 20 (31.8%) |
| 4 or 5 Rooms | 123 (69.9%) | 36 (57.1%) |
| 6 or 7 Rooms | 25 (14.2%) | 0 (0.0%) |
| 8 or more Rooms | 13 (7.4%) | 0 (0.0%) |
| Total | 176 (100.0%) | 63 (100.0%) |
Housing Structure by Heating Type in Strong
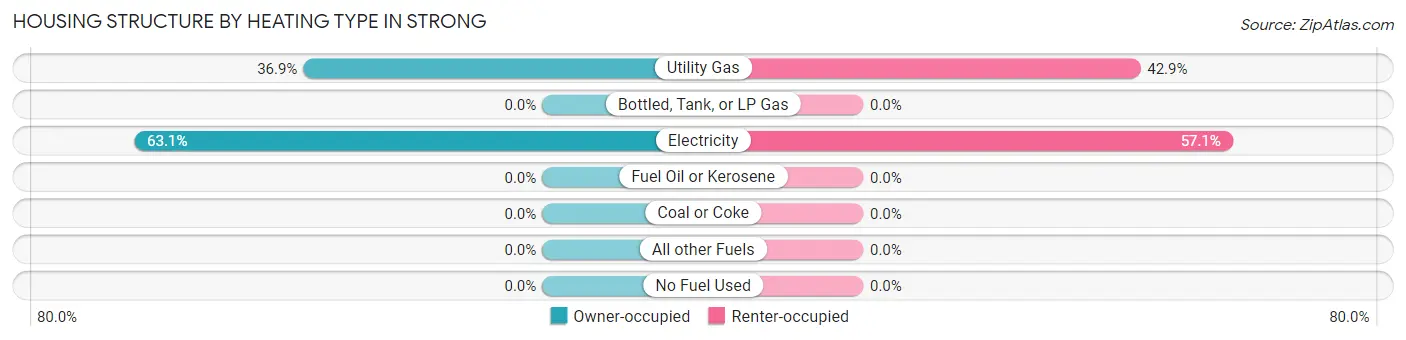
| Heating Type | Owner-occupied | Renter-occupied |
| Utility Gas | 65 (36.9%) | 27 (42.9%) |
| Bottled, Tank, or LP Gas | 0 (0.0%) | 0 (0.0%) |
| Electricity | 111 (63.1%) | 36 (57.1%) |
| Fuel Oil or Kerosene | 0 (0.0%) | 0 (0.0%) |
| Coal or Coke | 0 (0.0%) | 0 (0.0%) |
| All other Fuels | 0 (0.0%) | 0 (0.0%) |
| No Fuel Used | 0 (0.0%) | 0 (0.0%) |
| Total | 176 (100.0%) | 63 (100.0%) |
Household Vehicle Usage in Strong
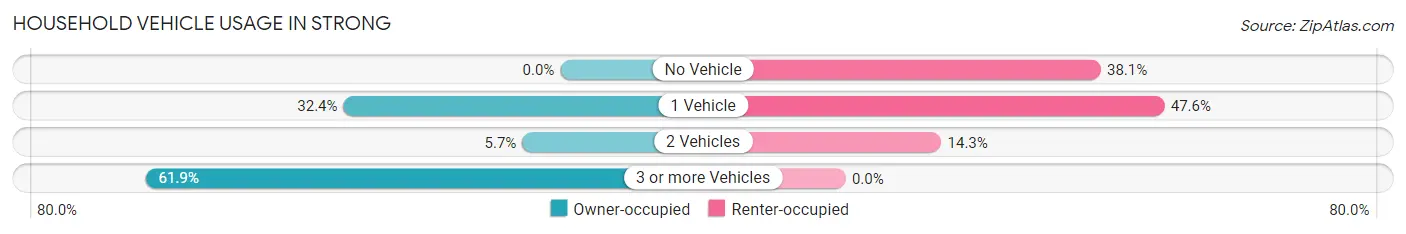
| Vehicles per Household | Owner-occupied | Renter-occupied |
| No Vehicle | 0 (0.0%) | 24 (38.1%) |
| 1 Vehicle | 57 (32.4%) | 30 (47.6%) |
| 2 Vehicles | 10 (5.7%) | 9 (14.3%) |
| 3 or more Vehicles | 109 (61.9%) | 0 (0.0%) |
| Total | 176 (100.0%) | 63 (100.0%) |
Real Estate & Mortgages in Strong
Real Estate and Mortgage Overview in Strong
| Characteristic | Without Mortgage | With Mortgage |
| Housing Units | 145 | 31 |
| Median Property Value | $53,500 | $64,700 |
| Median Household Income | - | - |
| Monthly Housing Costs | $296 | $0 |
| Real Estate Taxes | - | - |
Property Value by Mortgage Status in Strong
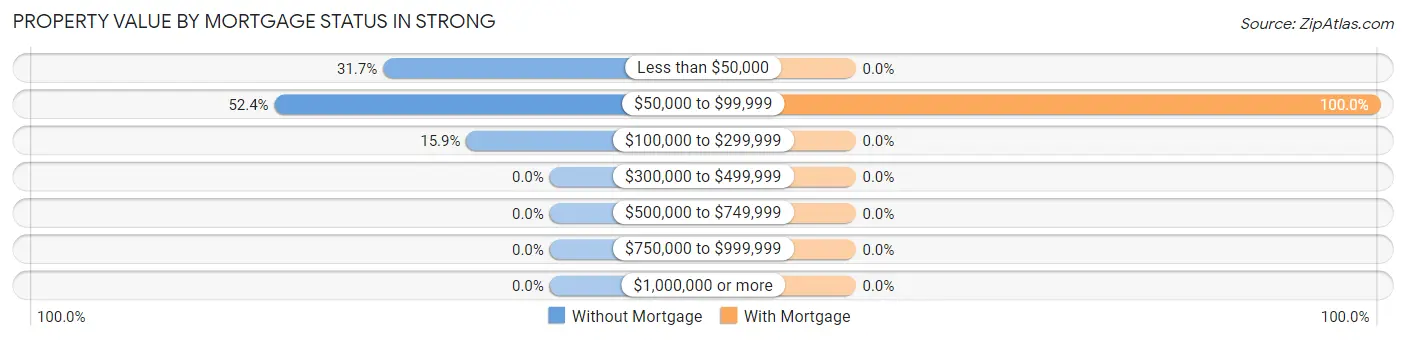
| Property Value | Without Mortgage | With Mortgage |
| Less than $50,000 | 46 (31.7%) | 0 (0.0%) |
| $50,000 to $99,999 | 76 (52.4%) | 31 (100.0%) |
| $100,000 to $299,999 | 23 (15.9%) | 0 (0.0%) |
| $300,000 to $499,999 | 0 (0.0%) | 0 (0.0%) |
| $500,000 to $749,999 | 0 (0.0%) | 0 (0.0%) |
| $750,000 to $999,999 | 0 (0.0%) | 0 (0.0%) |
| $1,000,000 or more | 0 (0.0%) | 0 (0.0%) |
| Total | 145 (100.0%) | 31 (100.0%) |
Household Income by Mortgage Status in Strong
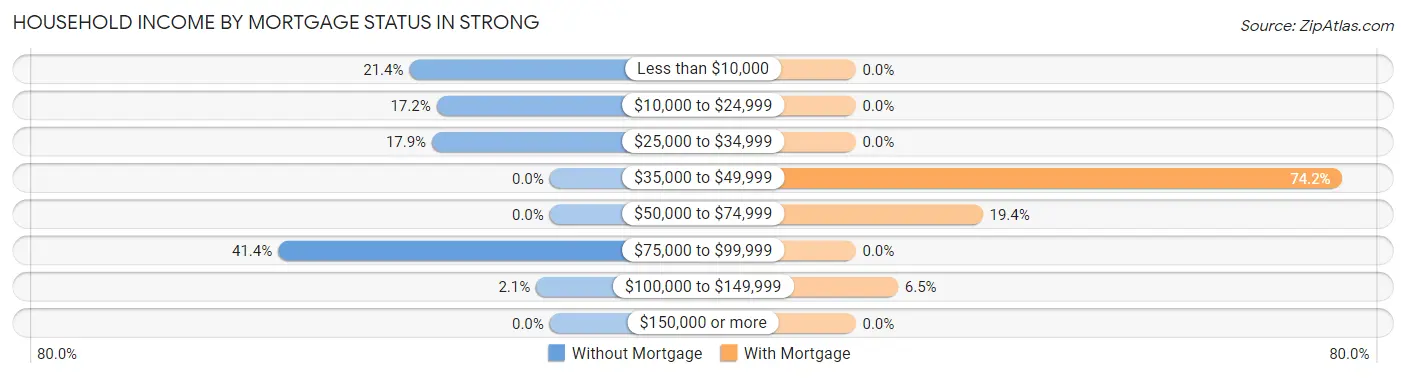
| Household Income | Without Mortgage | With Mortgage |
| Less than $10,000 | 31 (21.4%) | 0 (0.0%) |
| $10,000 to $24,999 | 25 (17.2%) | 0 (0.0%) |
| $25,000 to $34,999 | 26 (17.9%) | 0 (0.0%) |
| $35,000 to $49,999 | 0 (0.0%) | 23 (74.2%) |
| $50,000 to $74,999 | 0 (0.0%) | 6 (19.4%) |
| $75,000 to $99,999 | 60 (41.4%) | 0 (0.0%) |
| $100,000 to $149,999 | 3 (2.1%) | 2 (6.5%) |
| $150,000 or more | 0 (0.0%) | 0 (0.0%) |
| Total | 145 (100.0%) | 31 (100.0%) |
Property Value to Household Income Ratio in Strong
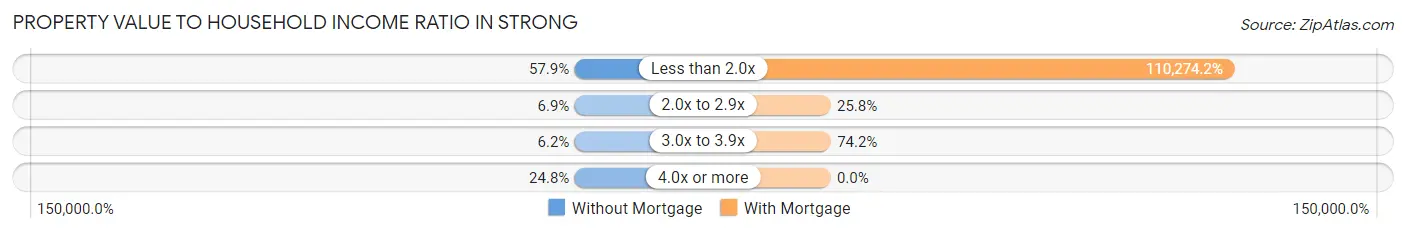
| Value-to-Income Ratio | Without Mortgage | With Mortgage |
| Less than 2.0x | 84 (57.9%) | 34,185 (110,274.2%) |
| 2.0x to 2.9x | 10 (6.9%) | 8 (25.8%) |
| 3.0x to 3.9x | 9 (6.2%) | 23 (74.2%) |
| 4.0x or more | 36 (24.8%) | 0 (0.0%) |
| Total | 145 (100.0%) | 31 (100.0%) |
Real Estate Taxes by Mortgage Status in Strong
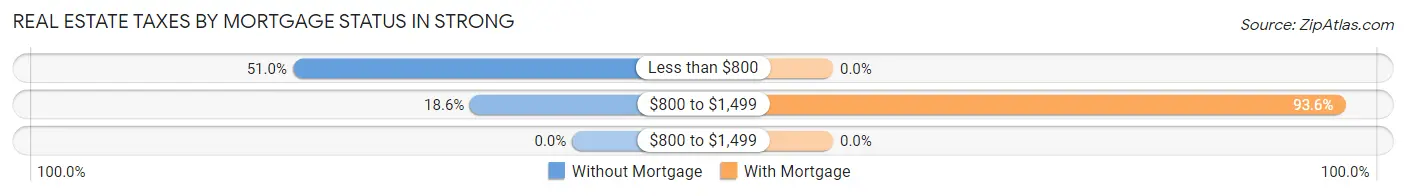
| Property Taxes | Without Mortgage | With Mortgage |
| Less than $800 | 74 (51.0%) | 0 (0.0%) |
| $800 to $1,499 | 27 (18.6%) | 29 (93.5%) |
| $800 to $1,499 | 0 (0.0%) | 0 (0.0%) |
| Total | 145 (100.0%) | 31 (100.0%) |
Health & Disability in Strong
Health Insurance Coverage by Age in Strong
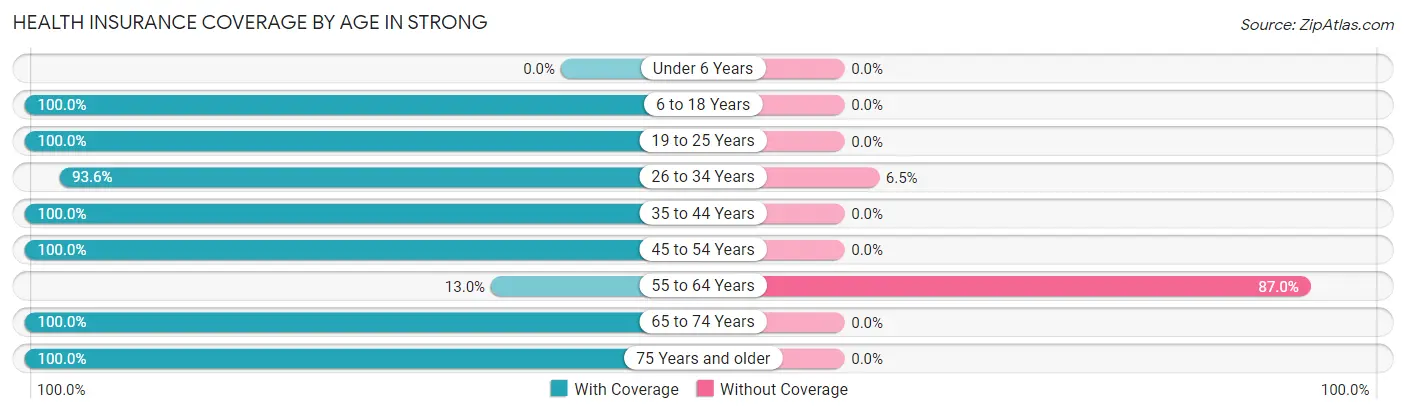
| Age Bracket | With Coverage | Without Coverage |
| Under 6 Years | 0 (0.0%) | 0 (0.0%) |
| 6 to 18 Years | 24 (100.0%) | 0 (0.0%) |
| 19 to 25 Years | 9 (100.0%) | 0 (0.0%) |
| 26 to 34 Years | 87 (93.5%) | 6 (6.5%) |
| 35 to 44 Years | 10 (100.0%) | 0 (0.0%) |
| 45 to 54 Years | 30 (100.0%) | 0 (0.0%) |
| 55 to 64 Years | 9 (13.0%) | 60 (87.0%) |
| 65 to 74 Years | 44 (100.0%) | 0 (0.0%) |
| 75 Years and older | 95 (100.0%) | 0 (0.0%) |
| Total | 308 (82.4%) | 66 (17.6%) |
Health Insurance Coverage by Citizenship Status in Strong
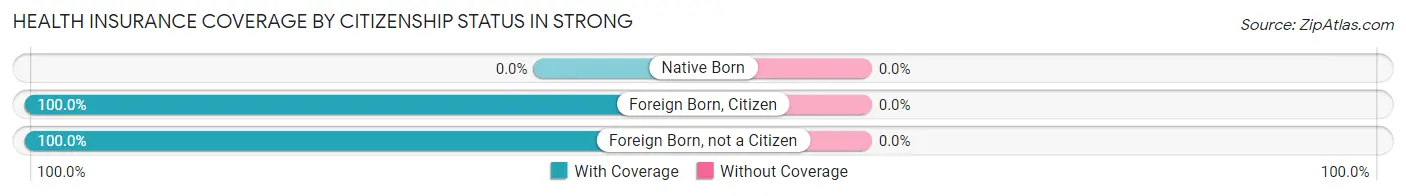
| Citizenship Status | With Coverage | Without Coverage |
| Native Born | 0 (0.0%) | 0 (0.0%) |
| Foreign Born, Citizen | 24 (100.0%) | 0 (0.0%) |
| Foreign Born, not a Citizen | 9 (100.0%) | 0 (0.0%) |
Health Insurance Coverage by Household Income in Strong
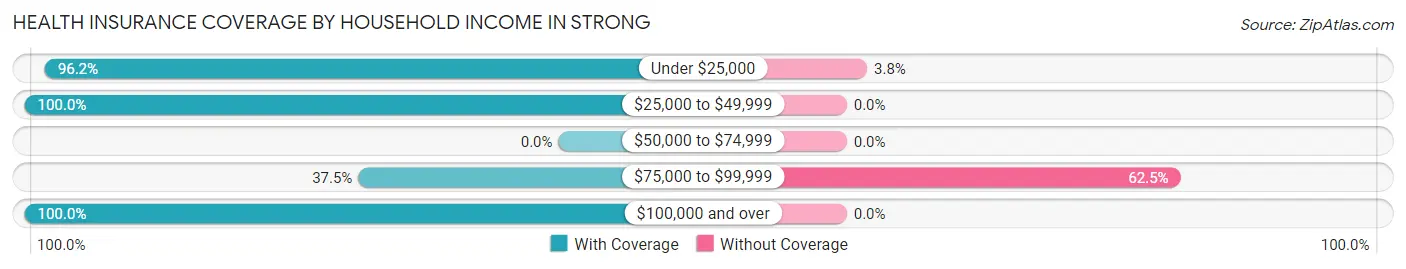
| Household Income | With Coverage | Without Coverage |
| Under $25,000 | 152 (96.2%) | 6 (3.8%) |
| $25,000 to $49,999 | 112 (100.0%) | 0 (0.0%) |
| $50,000 to $74,999 | 0 (0.0%) | 0 (0.0%) |
| $75,000 to $99,999 | 36 (37.5%) | 60 (62.5%) |
| $100,000 and over | 8 (100.0%) | 0 (0.0%) |
Public vs Private Health Insurance Coverage by Age in Strong
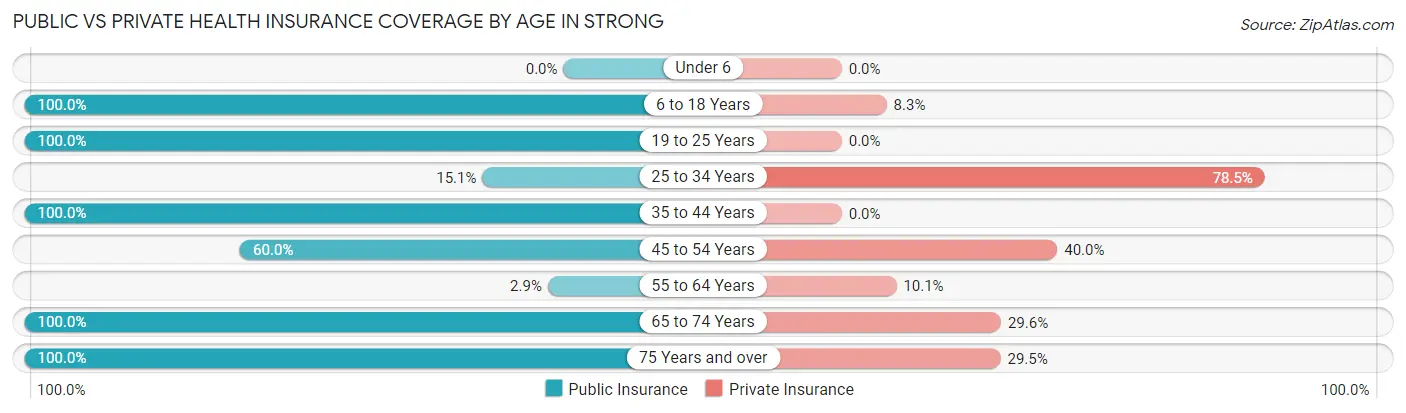
| Age Bracket | Public Insurance | Private Insurance |
| Under 6 | 0 (0.0%) | 0 (0.0%) |
| 6 to 18 Years | 24 (100.0%) | 2 (8.3%) |
| 19 to 25 Years | 9 (100.0%) | 0 (0.0%) |
| 25 to 34 Years | 14 (15.0%) | 73 (78.5%) |
| 35 to 44 Years | 10 (100.0%) | 0 (0.0%) |
| 45 to 54 Years | 18 (60.0%) | 12 (40.0%) |
| 55 to 64 Years | 2 (2.9%) | 7 (10.1%) |
| 65 to 74 Years | 44 (100.0%) | 13 (29.5%) |
| 75 Years and over | 95 (100.0%) | 28 (29.5%) |
| Total | 216 (57.8%) | 135 (36.1%) |
Disability Status by Sex by Age in Strong
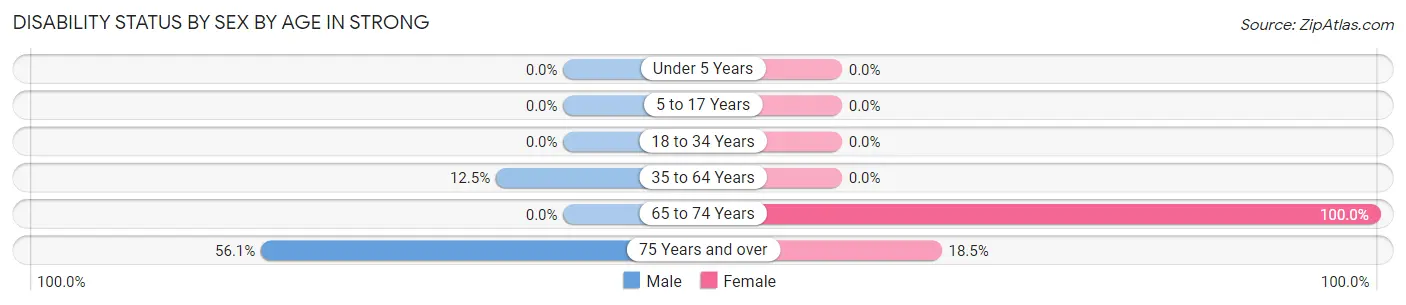
| Age Bracket | Male | Female |
| Under 5 Years | 0 (0.0%) | 0 (0.0%) |
| 5 to 17 Years | 0 (0.0%) | 0 (0.0%) |
| 18 to 34 Years | 0 (0.0%) | 0 (0.0%) |
| 35 to 64 Years | 10 (12.5%) | 0 (0.0%) |
| 65 to 74 Years | 0 (0.0%) | 17 (100.0%) |
| 75 Years and over | 23 (56.1%) | 10 (18.5%) |
Disability Class by Sex by Age in Strong
Disability Class: Hearing Difficulty
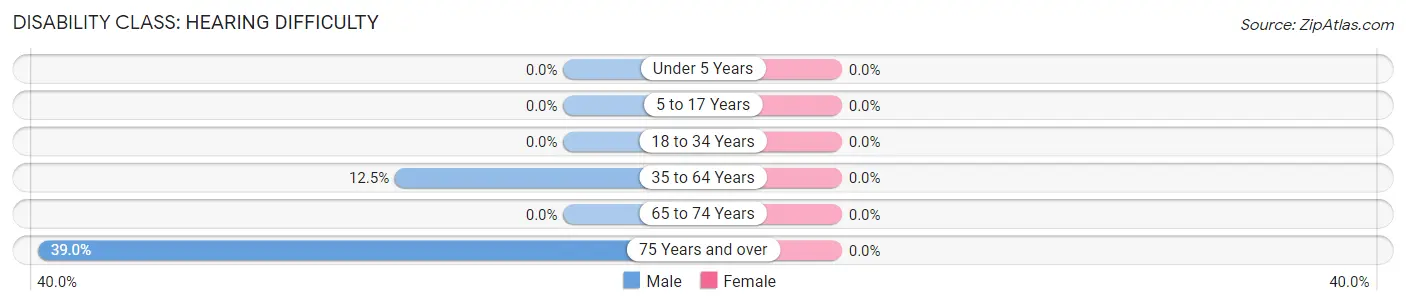
| Age Bracket | Male | Female |
| Under 5 Years | 0 (0.0%) | 0 (0.0%) |
| 5 to 17 Years | 0 (0.0%) | 0 (0.0%) |
| 18 to 34 Years | 0 (0.0%) | 0 (0.0%) |
| 35 to 64 Years | 10 (12.5%) | 0 (0.0%) |
| 65 to 74 Years | 0 (0.0%) | 0 (0.0%) |
| 75 Years and over | 16 (39.0%) | 0 (0.0%) |
Disability Class: Vision Difficulty
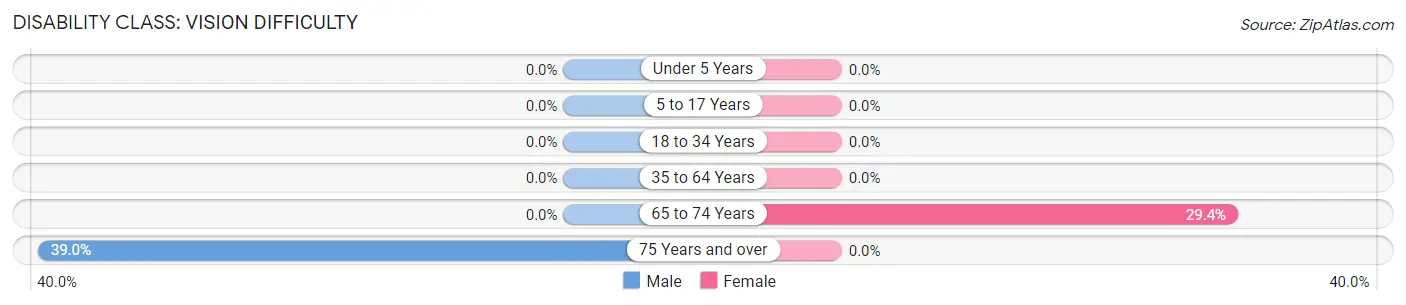
| Age Bracket | Male | Female |
| Under 5 Years | 0 (0.0%) | 0 (0.0%) |
| 5 to 17 Years | 0 (0.0%) | 0 (0.0%) |
| 18 to 34 Years | 0 (0.0%) | 0 (0.0%) |
| 35 to 64 Years | 0 (0.0%) | 0 (0.0%) |
| 65 to 74 Years | 0 (0.0%) | 5 (29.4%) |
| 75 Years and over | 16 (39.0%) | 0 (0.0%) |
Disability Class: Cognitive Difficulty
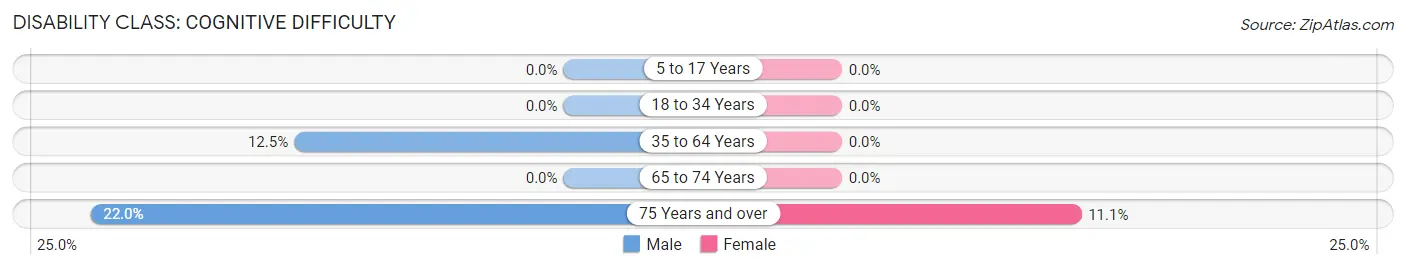
| Age Bracket | Male | Female |
| 5 to 17 Years | 0 (0.0%) | 0 (0.0%) |
| 18 to 34 Years | 0 (0.0%) | 0 (0.0%) |
| 35 to 64 Years | 10 (12.5%) | 0 (0.0%) |
| 65 to 74 Years | 0 (0.0%) | 0 (0.0%) |
| 75 Years and over | 9 (22.0%) | 6 (11.1%) |
Disability Class: Ambulatory Difficulty
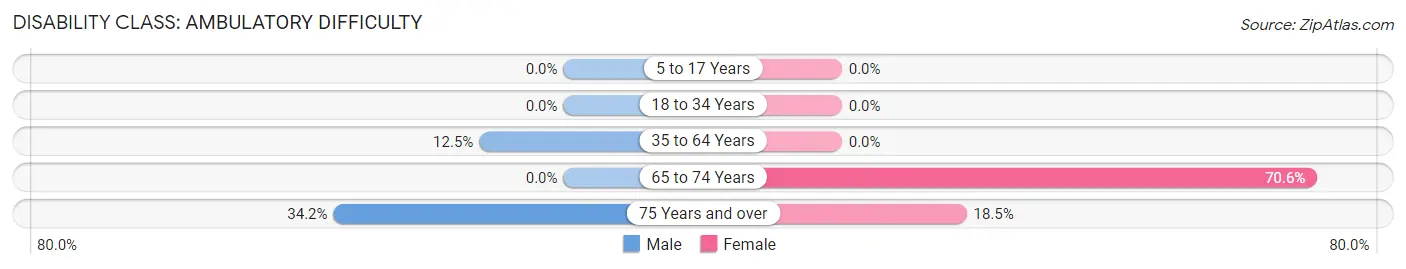
| Age Bracket | Male | Female |
| 5 to 17 Years | 0 (0.0%) | 0 (0.0%) |
| 18 to 34 Years | 0 (0.0%) | 0 (0.0%) |
| 35 to 64 Years | 10 (12.5%) | 0 (0.0%) |
| 65 to 74 Years | 0 (0.0%) | 12 (70.6%) |
| 75 Years and over | 14 (34.2%) | 10 (18.5%) |
Disability Class: Self-Care Difficulty
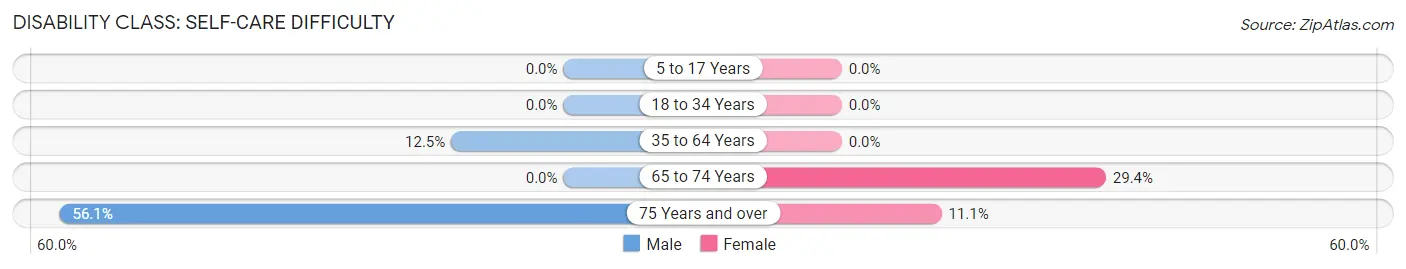
| Age Bracket | Male | Female |
| 5 to 17 Years | 0 (0.0%) | 0 (0.0%) |
| 18 to 34 Years | 0 (0.0%) | 0 (0.0%) |
| 35 to 64 Years | 10 (12.5%) | 0 (0.0%) |
| 65 to 74 Years | 0 (0.0%) | 5 (29.4%) |
| 75 Years and over | 23 (56.1%) | 6 (11.1%) |
Technology Access in Strong
Computing Device Access in Strong
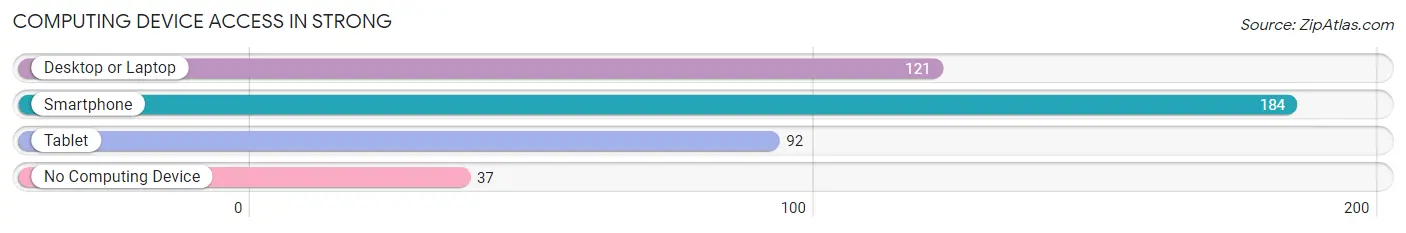
| Device Type | # Households | % Households |
| Desktop or Laptop | 121 | 50.6% |
| Smartphone | 184 | 77.0% |
| Tablet | 92 | 38.5% |
| No Computing Device | 37 | 15.5% |
| Total | 239 | 100.0% |
Internet Access in Strong
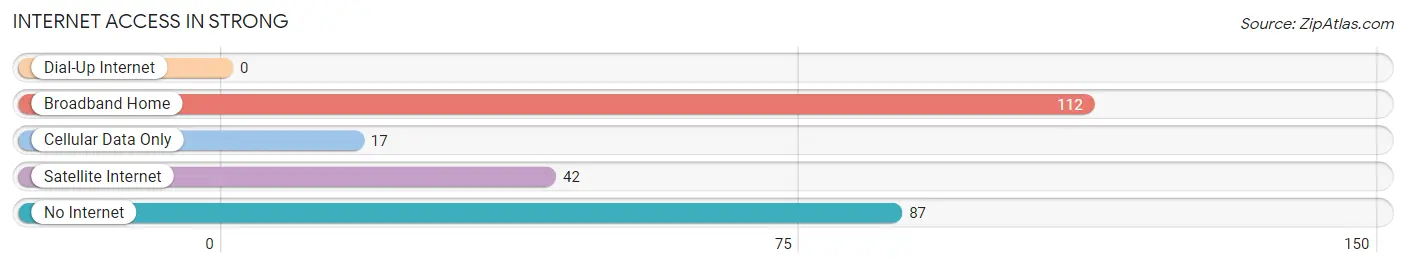
| Internet Type | # Households | % Households |
| Dial-Up Internet | 0 | 0.0% |
| Broadband Home | 112 | 46.9% |
| Cellular Data Only | 17 | 7.1% |
| Satellite Internet | 42 | 17.6% |
| No Internet | 87 | 36.4% |
| Total | 239 | 100.0% |
Strong Summary
AR History
Arkansas is a state located in the Southern United States. It is bordered by Missouri to the north, Tennessee and Mississippi to the east, Louisiana to the south, and Texas and Oklahoma to the west. Arkansas was admitted to the Union as the 25th state on June 15, 1836.
The first inhabitants of Arkansas were Native Americans, including the Caddo, Osage, Quapaw, and Cherokee. The first Europeans to explore the area were the Spanish, who arrived in the 16th century. The French also explored the area, and in 1686, the French explorer Henri de Tonti established Arkansas Post, the first European settlement in the state.
In 1803, the United States acquired Arkansas as part of the Louisiana Purchase. The state was initially part of the Missouri Territory, but in 1819, it became part of the Arkansas Territory. In 1836, Arkansas was admitted to the Union as the 25th state.
During the Civil War, Arkansas was a Confederate state. After the war, the state was readmitted to the Union in 1868.
In the late 19th century, Arkansas experienced a period of economic growth, driven by the timber and cotton industries. The state also experienced a period of political turmoil, as the Democratic Party and the Republican Party fought for control of the state government.
In the 20th century, Arkansas experienced a period of economic and population growth. The state also experienced a period of racial tension, as the civil rights movement gained momentum in the 1950s and 1960s.
Geography
Arkansas is located in the south-central United States. It is bordered by Missouri to the north, Tennessee and Mississippi to the east, Louisiana to the south, and Texas and Oklahoma to the west.
The state is divided into four distinct geographic regions: the Ozark Mountains in the northwest, the Ouachita Mountains in the west, the Arkansas Delta in the east, and the Arkansas Timberlands in the south.
The Ozark Mountains are a rugged, heavily forested region of the state. The highest point in the state is Mount Magazine, which rises to 2,753 feet (839 m).
The Ouachita Mountains are a range of low, rolling hills in the west of the state. The highest point in the Ouachita Mountains is Magazine Mountain, which rises to 2,753 feet (839 m).
The Arkansas Delta is a flat, alluvial plain in the east of the state. The Arkansas River flows through the region, and the area is known for its fertile soil.
The Arkansas Timberlands are a region of pine and hardwood forests in the south of the state. The region is home to the Ouachita National Forest, the largest national forest in the state.
Economy
The economy of Arkansas is largely based on agriculture, manufacturing, and services. The state’s major agricultural products include poultry, soybeans, cotton, rice, and hogs.
Manufacturing is an important part of the state’s economy. Major products include chemicals, paper products, food products, and fabricated metal products.
The service sector is also an important part of the state’s economy. Major industries include tourism, finance, insurance, real estate, and health care.
Demographics
As of the 2010 census, the population of Arkansas was 2,915,918. The state’s population is predominantly white (77.2%), with African Americans (15.4%), Hispanics (6.2%), and Asians (1.2%) making up the remainder.
The largest cities in the state are Little Rock (population: 193,524), Fort Smith (population: 86,209), Fayetteville (population: 73,580), Springdale (population: 69,797), and Jonesboro (population: 67,263).
The median household income in Arkansas is $41,371, and the median home value is $124,800. The state’s unemployment rate is 4.2%.
Conclusion
Arkansas is a state located in the Southern United States. It is bordered by Missouri to the north, Tennessee and Mississippi to the east, Louisiana to the south, and Texas and Oklahoma to the west. Arkansas was admitted to the Union as the 25th state on June 15, 1836. The state’s economy is largely based on agriculture, manufacturing, and services. The population of Arkansas is predominantly white (77.2%), with African Americans (15.4%), Hispanics (6.2%), and Asians (1.2%) making up the remainder. The median household income in Arkansas is $41,371, and the median home value is $124,800. The state’s unemployment rate is 4.2%.
Common Questions
What is Per Capita Income in Strong?
Per Capita income in Strong is $20,569.
What is the Median Household income in Strong?
Median Household Income in Strong is $26,635.
What is Family Income Deficit in Strong?
Family Income Deficit in Strong is $10,114.
Families that are below poverty line in Strong earn $10,114 less on average than the poverty threshold level.
What is Inequality or Gini Index in Strong?
Inequality or Gini Index in Strong is 0.47.
What is the Total Population of Strong?
Total Population of Strong is 374.
What is the Total Male Population of Strong?
Total Male Population of Strong is 245.
What is the Total Female Population of Strong?
Total Female Population of Strong is 129.
What is the Ratio of Males per 100 Females in Strong?
There are 189.92 Males per 100 Females in Strong.
What is the Ratio of Females per 100 Males in Strong?
There are 52.65 Females per 100 Males in Strong.
What is the Median Population Age in Strong?
Median Population Age in Strong is 63.2 Years.
What is the Average Family Size in Strong
Average Family Size in Strong is 2.0 People.
What is the Average Household Size in Strong
Average Household Size in Strong is 1.6 People.
How Large is the Labor Force in Strong?
There are 110 People in the Labor Forcein in Strong.
What is the Percentage of People in the Labor Force in Strong?
31.4% of People are in the Labor Force in Strong.