Edmondson, AR Map & Demographics
Edmondson Map
Edmondson Overview
$19,359
PER CAPITA INCOME
$25,625
AVG HOUSEHOLD INCOME
43.3%
WAGE / INCOME GAP [ % ]
56.7¢/ $1
WAGE / INCOME GAP [ $ ]
0.48
INEQUALITY / GINI INDEX
318
TOTAL POPULATION
115
MALE POPULATION
203
FEMALE POPULATION
56.65
MALES / 100 FEMALES
176.52
FEMALES / 100 MALES
37.0
MEDIAN AGE
3.1
AVG FAMILY SIZE
2.5
AVG HOUSEHOLD SIZE
114
LABOR FORCE [ PEOPLE ]
52.8%
PERCENT IN LABOR FORCE
7.0%
UNEMPLOYMENT RATE
Edmondson Zip Codes
Edmondson Area Codes
Income in Edmondson
Income Overview in Edmondson
| Characteristic | Number | Measure |
| Per Capita Income | 318 | $19,359 |
| Median Family Income | 86 | $0 |
| Mean Family Income | 86 | $56,433 |
| Median Household Income | 126 | $25,625 |
| Mean Household Income | 126 | $47,857 |
| Income Deficit | 86 | $0 |
| Wage / Income Gap (%) | 318 | 43.26% |
| Wage / Income Gap ($) | 318 | 56.74¢ per $1 |
| Gini / Inequality Index | 318 | 0.48 |
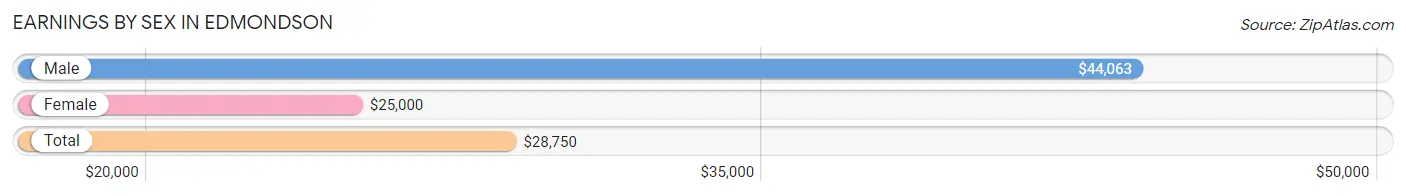
Earnings by Sex in Edmondson
Average Earnings in Edmondson are $28,750, $44,063 for men and $25,000 for women, a difference of 43.3%.
| Sex | Number | Average Earnings |
| Male | 55 (44.0%) | $44,063 |
| Female | 70 (56.0%) | $25,000 |
| Total | 125 (100.0%) | $28,750 |
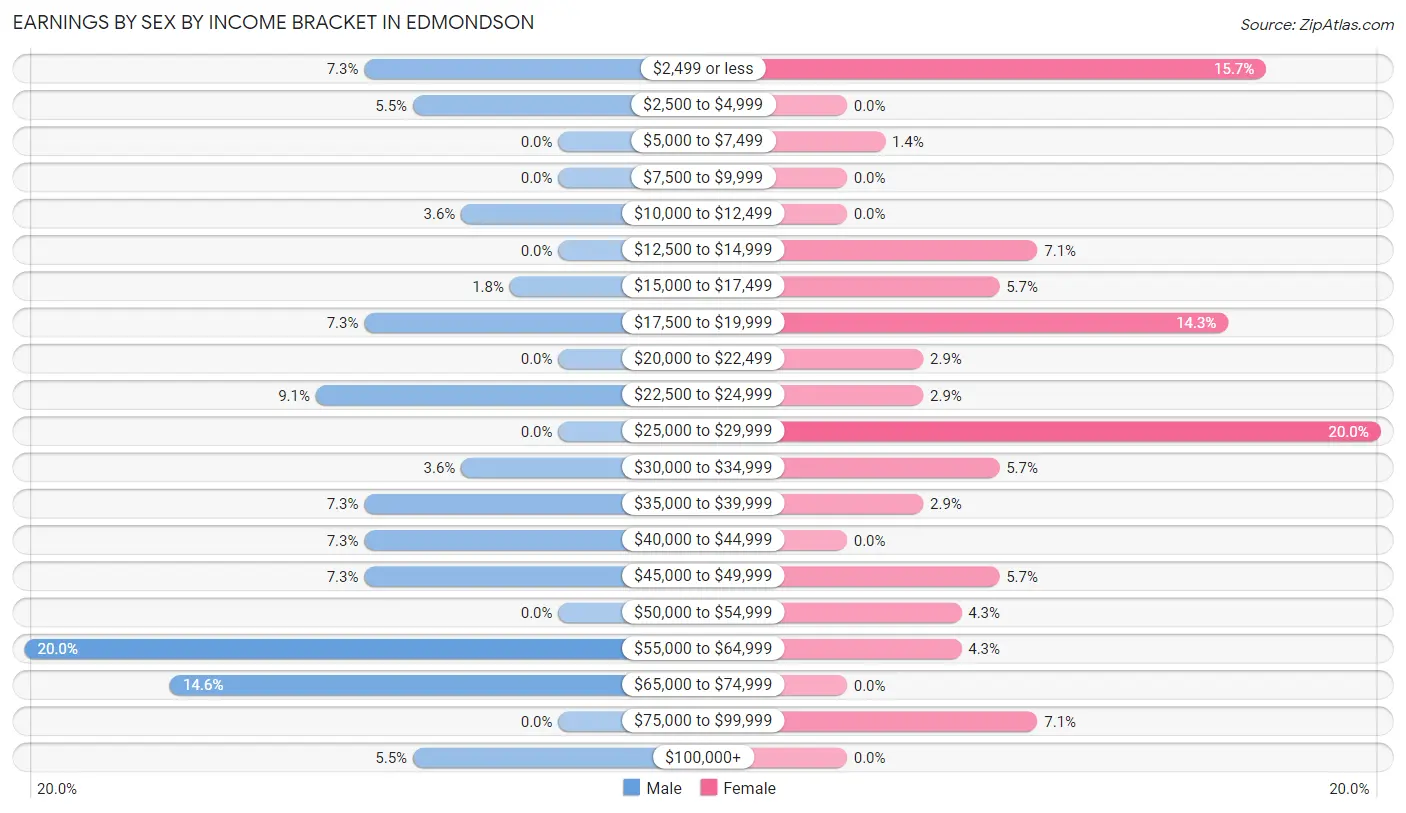
Earnings by Sex by Income Bracket in Edmondson
The most common earnings brackets in Edmondson are $55,000 to $64,999 for men (11 | 20.0%) and $25,000 to $29,999 for women (14 | 20.0%).
| Income | Male | Female |
| $2,499 or less | 4 (7.3%) | 11 (15.7%) |
| $2,500 to $4,999 | 3 (5.4%) | 0 (0.0%) |
| $5,000 to $7,499 | 0 (0.0%) | 1 (1.4%) |
| $7,500 to $9,999 | 0 (0.0%) | 0 (0.0%) |
| $10,000 to $12,499 | 2 (3.6%) | 0 (0.0%) |
| $12,500 to $14,999 | 0 (0.0%) | 5 (7.1%) |
| $15,000 to $17,499 | 1 (1.8%) | 4 (5.7%) |
| $17,500 to $19,999 | 4 (7.3%) | 10 (14.3%) |
| $20,000 to $22,499 | 0 (0.0%) | 2 (2.9%) |
| $22,500 to $24,999 | 5 (9.1%) | 2 (2.9%) |
| $25,000 to $29,999 | 0 (0.0%) | 14 (20.0%) |
| $30,000 to $34,999 | 2 (3.6%) | 4 (5.7%) |
| $35,000 to $39,999 | 4 (7.3%) | 2 (2.9%) |
| $40,000 to $44,999 | 4 (7.3%) | 0 (0.0%) |
| $45,000 to $49,999 | 4 (7.3%) | 4 (5.7%) |
| $50,000 to $54,999 | 0 (0.0%) | 3 (4.3%) |
| $55,000 to $64,999 | 11 (20.0%) | 3 (4.3%) |
| $65,000 to $74,999 | 8 (14.5%) | 0 (0.0%) |
| $75,000 to $99,999 | 0 (0.0%) | 5 (7.1%) |
| $100,000+ | 3 (5.4%) | 0 (0.0%) |
| Total | 55 (100.0%) | 70 (100.0%) |
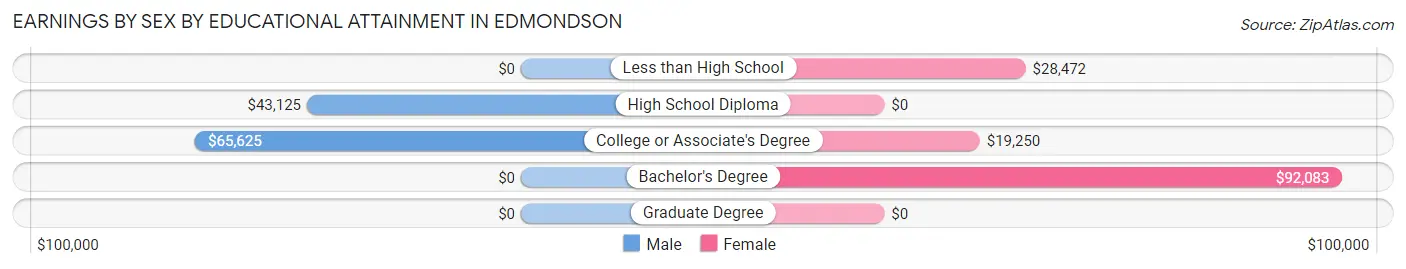
Earnings by Sex by Educational Attainment in Edmondson
Average earnings in Edmondson are $45,000 for men and $27,614 for women, a difference of 38.6%. Men with an educational attainment of college or associate's degree enjoy the highest average annual earnings of $65,625, while those with high school diploma education earn the least with $43,125. Women with an educational attainment of bachelor's degree earn the most with the average annual earnings of $92,083, while those with college or associate's degree education have the smallest earnings of $19,250.
| Educational Attainment | Male Income | Female Income |
| Less than High School | - | - |
| High School Diploma | $43,125 | $0 |
| College or Associate's Degree | $65,625 | $19,250 |
| Bachelor's Degree | - | - |
| Graduate Degree | - | - |
| Total | $45,000 | $27,614 |
Family Income in Edmondson
Family Income Brackets in Edmondson
According to the Edmondson family income data, there are 35 families falling into the $15,000 to $24,999 income range, which is the most common income bracket and makes up 40.7% of all families.
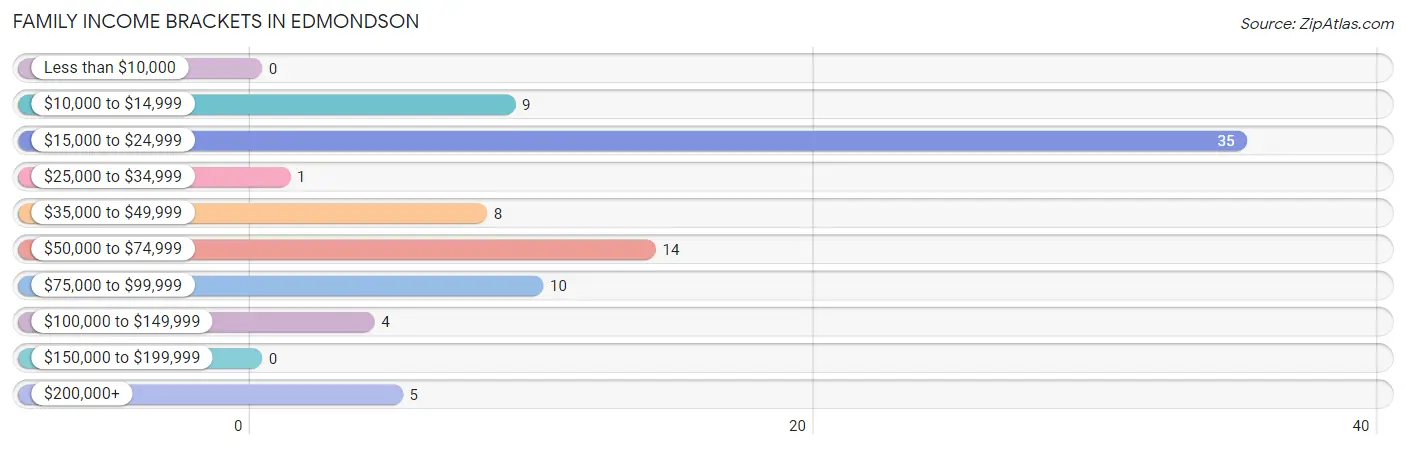
| Income Bracket | # Families | % Families |
| Less than $10,000 | 0 | 0.0% |
| $10,000 to $14,999 | 9 | 10.5% |
| $15,000 to $24,999 | 35 | 40.7% |
| $25,000 to $34,999 | 1 | 1.2% |
| $35,000 to $49,999 | 8 | 9.3% |
| $50,000 to $74,999 | 14 | 16.3% |
| $75,000 to $99,999 | 10 | 11.6% |
| $100,000 to $149,999 | 4 | 4.7% |
| $150,000 to $199,999 | 0 | 0.0% |
| $200,000+ | 5 | 5.8% |
Family Income by Famaliy Size in Edmondson
3-person families (11 | 12.8%) account for the highest median family income in Edmondson with $50,625 per family, while 3-person families (11 | 12.8%) have the highest median income of $16,875 per family member.
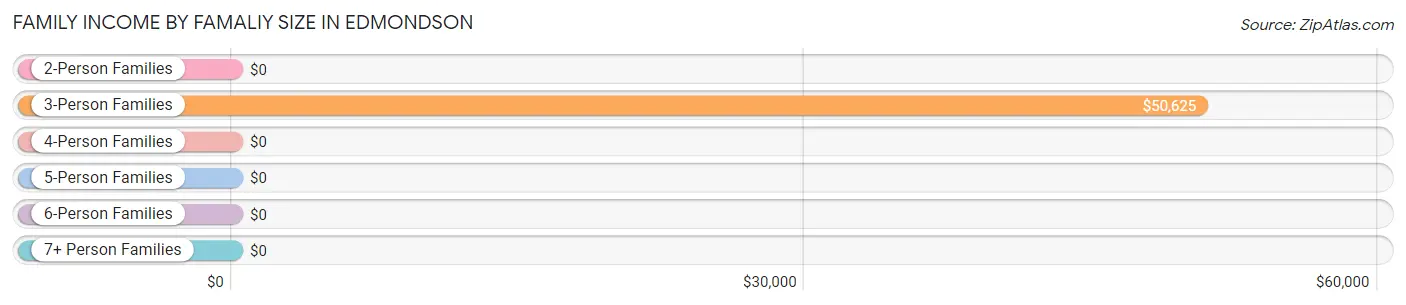
| Income Bracket | # Families | Median Income |
| 2-Person Families | 53 (61.6%) | $0 |
| 3-Person Families | 11 (12.8%) | $50,625 |
| 4-Person Families | 10 (11.6%) | $0 |
| 5-Person Families | 2 (2.3%) | $0 |
| 6-Person Families | 10 (11.6%) | $0 |
| 7+ Person Families | 0 (0.0%) | $0 |
| Total | 86 (100.0%) | $0 |
Family Income by Number of Earners in Edmondson
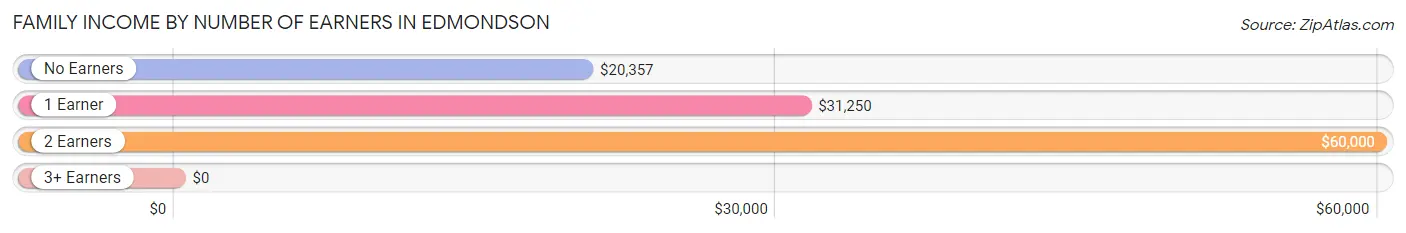
| Number of Earners | # Families | Median Income |
| No Earners | 30 (34.9%) | $20,357 |
| 1 Earner | 22 (25.6%) | $31,250 |
| 2 Earners | 30 (34.9%) | $60,000 |
| 3+ Earners | 4 (4.6%) | $0 |
| Total | 86 (100.0%) | $0 |
Household Income in Edmondson
Household Income Brackets in Edmondson
With 53 households falling in the category, the $15,000 to $24,999 income range is the most frequent in Edmondson, accounting for 42.1% of all households.
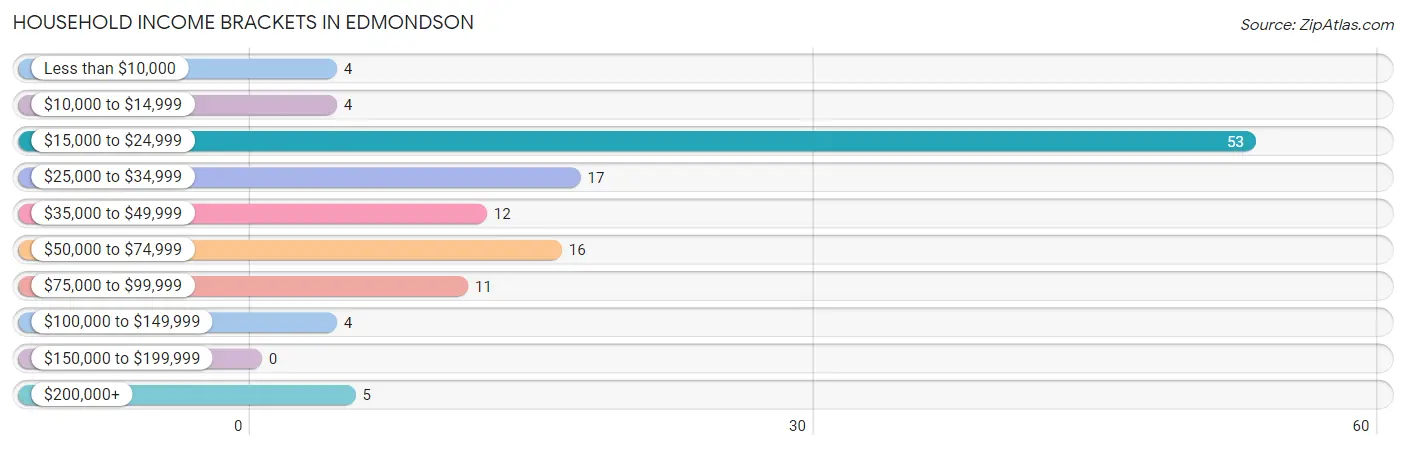
| Income Bracket | # Households | % Households |
| Less than $10,000 | 4 | 3.2% |
| $10,000 to $14,999 | 4 | 3.2% |
| $15,000 to $24,999 | 53 | 42.1% |
| $25,000 to $34,999 | 17 | 13.5% |
| $35,000 to $49,999 | 12 | 9.5% |
| $50,000 to $74,999 | 16 | 12.7% |
| $75,000 to $99,999 | 11 | 8.7% |
| $100,000 to $149,999 | 4 | 3.2% |
| $150,000 to $199,999 | 0 | 0.0% |
| $200,000+ | 5 | 4.0% |
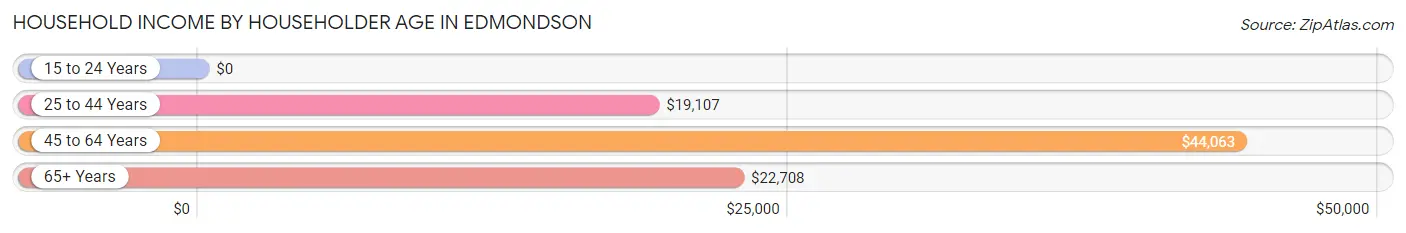
Household Income by Householder Age in Edmondson
The median household income in Edmondson is $25,625, with the highest median household income of $44,063 found in the 45 to 64 years age bracket for the primary householder. A total of 73 households (57.9%) fall into this category.
| Income Bracket | # Households | Median Income |
| 15 to 24 Years | 0 (0.0%) | $0 |
| 25 to 44 Years | 22 (17.5%) | $19,107 |
| 45 to 64 Years | 73 (57.9%) | $44,063 |
| 65+ Years | 31 (24.6%) | $22,708 |
| Total | 126 (100.0%) | $25,625 |
Poverty in Edmondson
Income Below Poverty by Sex and Age in Edmondson
With 30.4% poverty level for males and 42.9% for females among the residents of Edmondson, 12 to 14 year old males and under 5 year old females are the most vulnerable to poverty, with 12 males (92.3%) and 26 females (100.0%) in their respective age groups living below the poverty level.
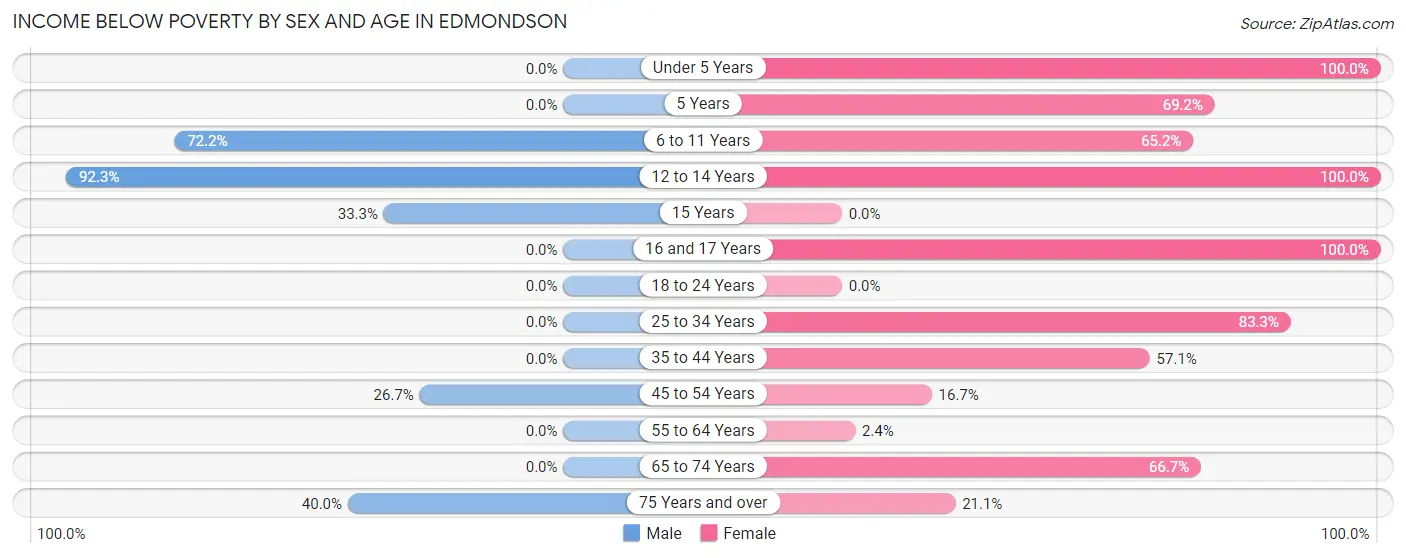
| Age Bracket | Male | Female |
| Under 5 Years | 0 (0.0%) | 26 (100.0%) |
| 5 Years | 0 (0.0%) | 9 (69.2%) |
| 6 to 11 Years | 13 (72.2%) | 15 (65.2%) |
| 12 to 14 Years | 12 (92.3%) | 3 (100.0%) |
| 15 Years | 2 (33.3%) | 0 (0.0%) |
| 16 and 17 Years | 0 (0.0%) | 4 (100.0%) |
| 18 to 24 Years | 0 (0.0%) | 0 (0.0%) |
| 25 to 34 Years | 0 (0.0%) | 10 (83.3%) |
| 35 to 44 Years | 0 (0.0%) | 8 (57.1%) |
| 45 to 54 Years | 4 (26.7%) | 5 (16.7%) |
| 55 to 64 Years | 0 (0.0%) | 1 (2.4%) |
| 65 to 74 Years | 0 (0.0%) | 2 (66.7%) |
| 75 Years and over | 4 (40.0%) | 4 (21.0%) |
| Total | 35 (30.4%) | 87 (42.9%) |
Income Above Poverty by Sex and Age in Edmondson
According to the poverty statistics in Edmondson, males aged 18 to 24 years and females aged 18 to 24 years are the age groups that are most secure financially, with 100.0% of males and 100.0% of females in these age groups living above the poverty line.
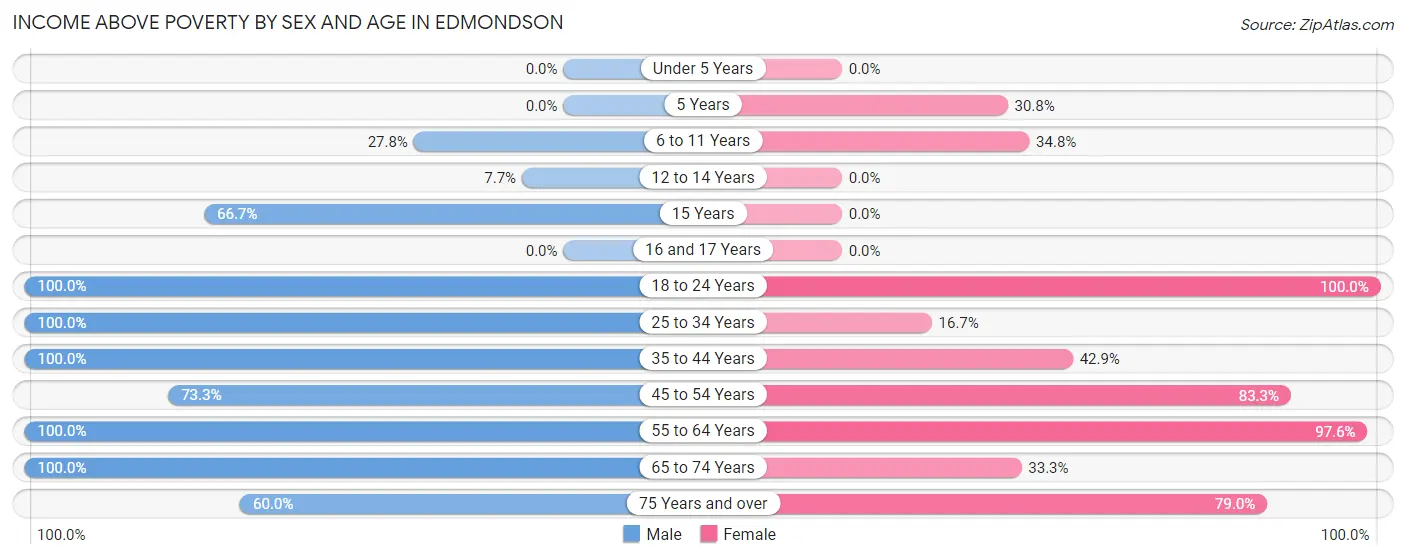
| Age Bracket | Male | Female |
| Under 5 Years | 0 (0.0%) | 0 (0.0%) |
| 5 Years | 0 (0.0%) | 4 (30.8%) |
| 6 to 11 Years | 5 (27.8%) | 8 (34.8%) |
| 12 to 14 Years | 1 (7.7%) | 0 (0.0%) |
| 15 Years | 4 (66.7%) | 0 (0.0%) |
| 16 and 17 Years | 0 (0.0%) | 0 (0.0%) |
| 18 to 24 Years | 11 (100.0%) | 15 (100.0%) |
| 25 to 34 Years | 5 (100.0%) | 2 (16.7%) |
| 35 to 44 Years | 7 (100.0%) | 6 (42.9%) |
| 45 to 54 Years | 11 (73.3%) | 25 (83.3%) |
| 55 to 64 Years | 27 (100.0%) | 40 (97.6%) |
| 65 to 74 Years | 3 (100.0%) | 1 (33.3%) |
| 75 Years and over | 6 (60.0%) | 15 (78.9%) |
| Total | 80 (69.6%) | 116 (57.1%) |
Income Below Poverty Among Married-Couple Families in Edmondson
The poverty statistics for married-couple families in Edmondson show that 10.5% or 4 of the total 38 families live below the poverty line. Families with no children have the highest poverty rate of 13.3%, comprising of 4 families. On the other hand, families with 1 or 2 children have the lowest poverty rate of 0.0%, which includes 0 families.
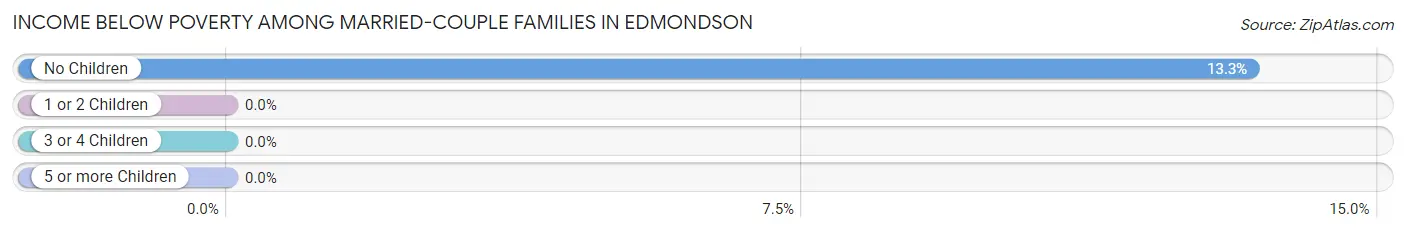
| Children | Above Poverty | Below Poverty |
| No Children | 26 (86.7%) | 4 (13.3%) |
| 1 or 2 Children | 8 (100.0%) | 0 (0.0%) |
| 3 or 4 Children | 0 (0.0%) | 0 (0.0%) |
| 5 or more Children | 0 (0.0%) | 0 (0.0%) |
| Total | 34 (89.5%) | 4 (10.5%) |
Income Below Poverty Among Single-Parent Households in Edmondson
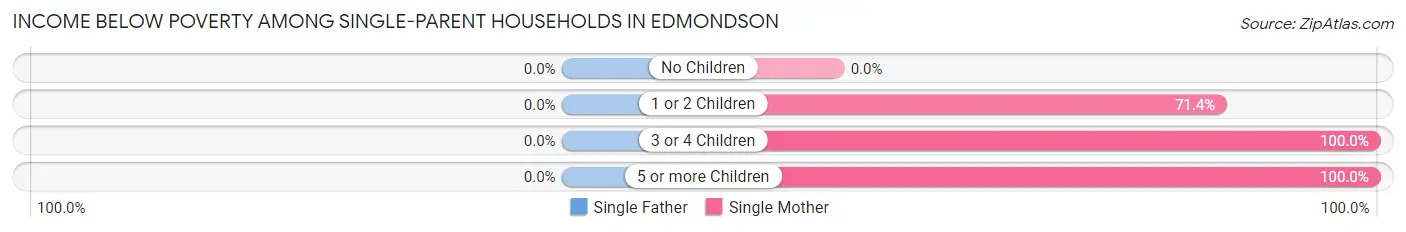
| Children | Single Father | Single Mother |
| No Children | 0 (0.0%) | 0 (0.0%) |
| 1 or 2 Children | 0 (0.0%) | 5 (71.4%) |
| 3 or 4 Children | 0 (0.0%) | 6 (100.0%) |
| 5 or more Children | 0 (0.0%) | 10 (100.0%) |
| Total | 0 (0.0%) | 21 (48.8%) |
Income Below Poverty Among Married-Couple vs Single-Parent Households in Edmondson
The poverty data for Edmondson shows that 4 of the married-couple family households (10.5%) and 21 of the single-parent households (43.8%) are living below the poverty level. Within the married-couple family households, those with no children have the highest poverty rate, with 4 households (13.3%) falling below the poverty line. Among the single-parent households, those with 3 or 4 children have the highest poverty rate, with 6 household (100.0%) living below poverty.
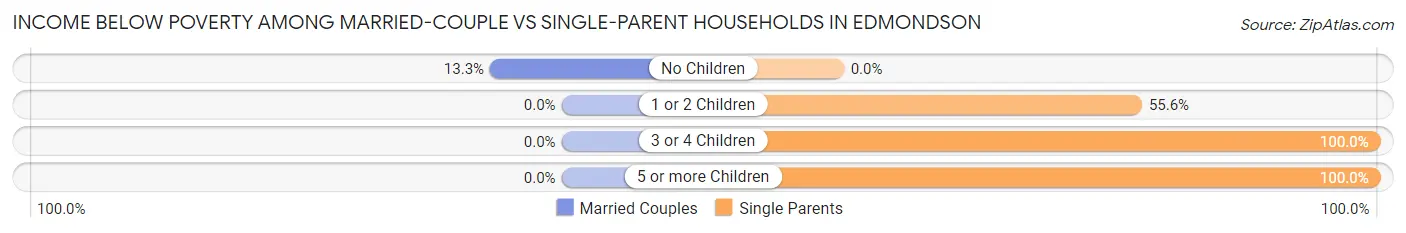
| Children | Married-Couple Families | Single-Parent Households |
| No Children | 4 (13.3%) | 0 (0.0%) |
| 1 or 2 Children | 0 (0.0%) | 5 (55.6%) |
| 3 or 4 Children | 0 (0.0%) | 6 (100.0%) |
| 5 or more Children | 0 (0.0%) | 10 (100.0%) |
| Total | 4 (10.5%) | 21 (43.8%) |
Race in Edmondson
The most populous races in Edmondson are Black / African American (213 | 67.0%), White / Caucasian (86 | 27.0%), and Two or more Races (17 | 5.3%).
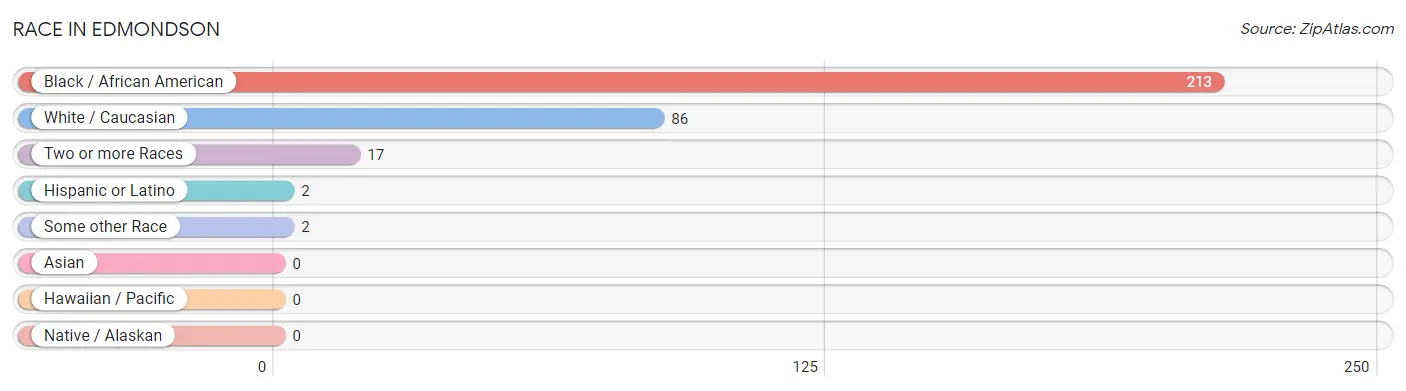
| Race | # Population | % Population |
| Asian | 0 | 0.0% |
| Black / African American | 213 | 67.0% |
| Hawaiian / Pacific | 0 | 0.0% |
| Hispanic or Latino | 2 | 0.6% |
| Native / Alaskan | 0 | 0.0% |
| White / Caucasian | 86 | 27.0% |
| Two or more Races | 17 | 5.3% |
| Some other Race | 2 | 0.6% |
| Total | 318 | 100.0% |
Ancestry in Edmondson
The most populous ancestries reported in Edmondson are Irish (28 | 8.8%), American (20 | 6.3%), English (4 | 1.3%), Italian (4 | 1.3%), and German (3 | 0.9%), together accounting for 18.6% of all Edmondson residents.
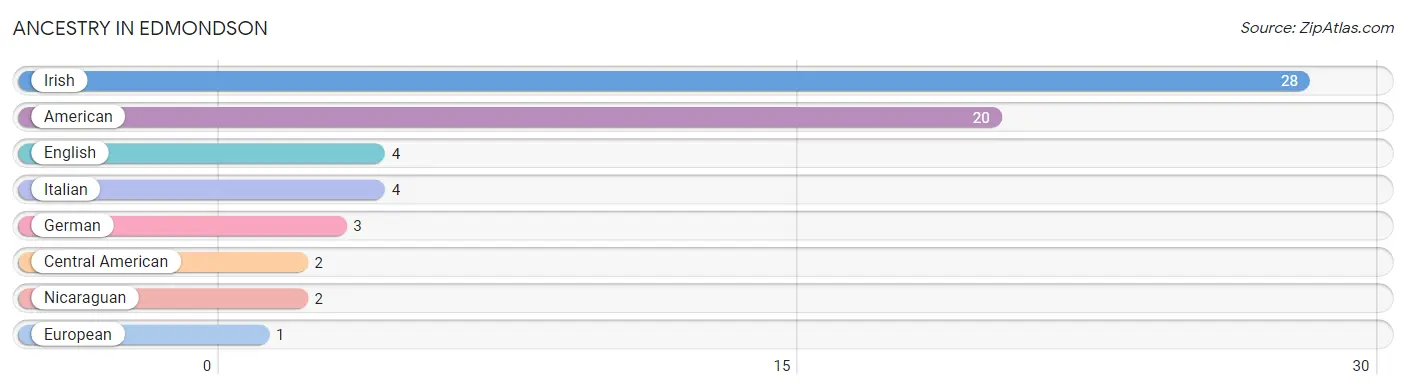
| Ancestry | # Population | % Population |
| American | 20 | 6.3% |
| Central American | 2 | 0.6% |
| English | 4 | 1.3% |
| European | 1 | 0.3% |
| German | 3 | 0.9% |
| Irish | 28 | 8.8% |
| Italian | 4 | 1.3% |
| Nicaraguan | 2 | 0.6% | View All 8 Rows |
Immigrants in Edmondson
The most numerous immigrant groups reported in Edmondson came from Central America (2 | 0.6%), Latin America (2 | 0.6%), and Nicaragua (2 | 0.6%), together accounting for 1.9% of all Edmondson residents.
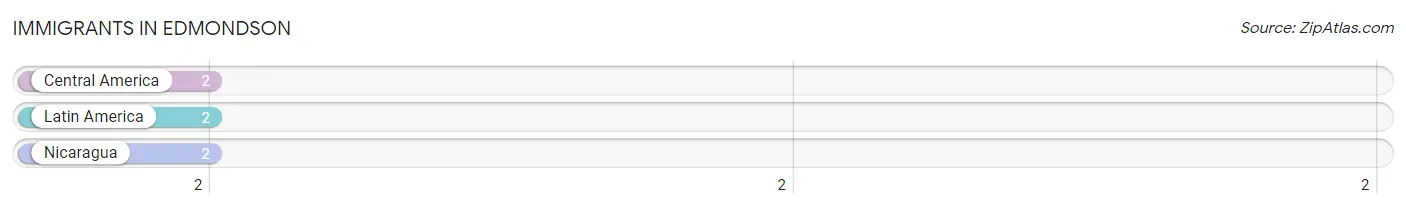
| Immigration Origin | # Population | % Population |
| Central America | 2 | 0.6% |
| Latin America | 2 | 0.6% |
| Nicaragua | 2 | 0.6% | View All 3 Rows |
Sex and Age in Edmondson
Sex and Age in Edmondson
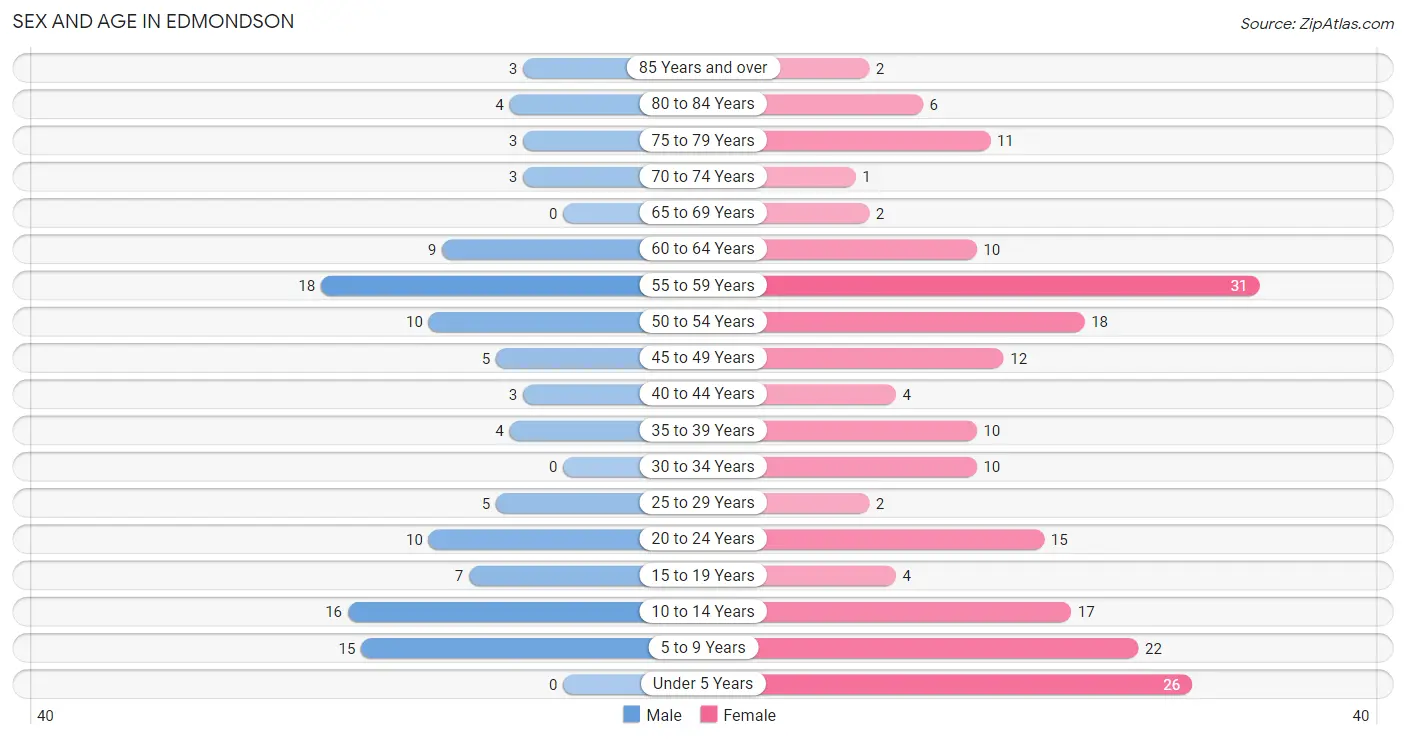
The most populous age groups in Edmondson are 55 to 59 Years (18 | 15.7%) for men and 55 to 59 Years (31 | 15.3%) for women.
| Age Bracket | Male | Female |
| Under 5 Years | 0 (0.0%) | 26 (12.8%) |
| 5 to 9 Years | 15 (13.0%) | 22 (10.8%) |
| 10 to 14 Years | 16 (13.9%) | 17 (8.4%) |
| 15 to 19 Years | 7 (6.1%) | 4 (2.0%) |
| 20 to 24 Years | 10 (8.7%) | 15 (7.4%) |
| 25 to 29 Years | 5 (4.3%) | 2 (1.0%) |
| 30 to 34 Years | 0 (0.0%) | 10 (4.9%) |
| 35 to 39 Years | 4 (3.5%) | 10 (4.9%) |
| 40 to 44 Years | 3 (2.6%) | 4 (2.0%) |
| 45 to 49 Years | 5 (4.3%) | 12 (5.9%) |
| 50 to 54 Years | 10 (8.7%) | 18 (8.9%) |
| 55 to 59 Years | 18 (15.7%) | 31 (15.3%) |
| 60 to 64 Years | 9 (7.8%) | 10 (4.9%) |
| 65 to 69 Years | 0 (0.0%) | 2 (1.0%) |
| 70 to 74 Years | 3 (2.6%) | 1 (0.5%) |
| 75 to 79 Years | 3 (2.6%) | 11 (5.4%) |
| 80 to 84 Years | 4 (3.5%) | 6 (3.0%) |
| 85 Years and over | 3 (2.6%) | 2 (1.0%) |
| Total | 115 (100.0%) | 203 (100.0%) |
Families and Households in Edmondson
Median Family Size in Edmondson
The median family size in Edmondson is 3.13 persons per family, with single female/mother families (43 | 50.0%) accounting for the largest median family size of 3.6 persons per family. On the other hand, single male/father families (5 | 5.8%) represent the smallest median family size with 2.00 persons per family.
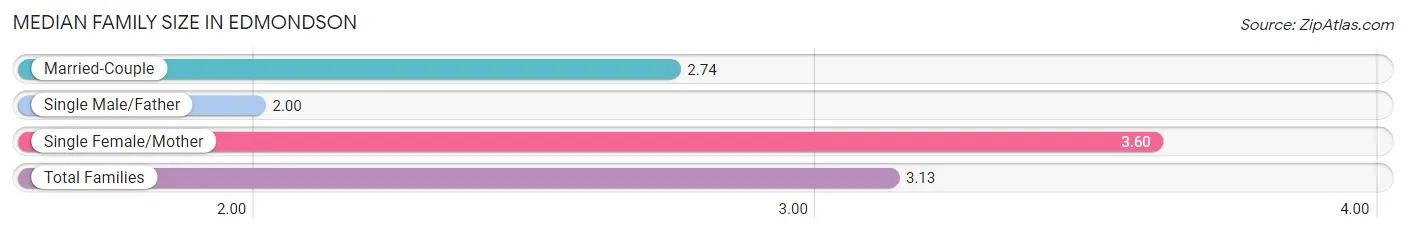
| Family Type | # Families | Family Size |
| Married-Couple | 38 (44.2%) | 2.74 |
| Single Male/Father | 5 (5.8%) | 2.00 |
| Single Female/Mother | 43 (50.0%) | 3.60 |
| Total Families | 86 (100.0%) | 3.13 |
Median Household Size in Edmondson
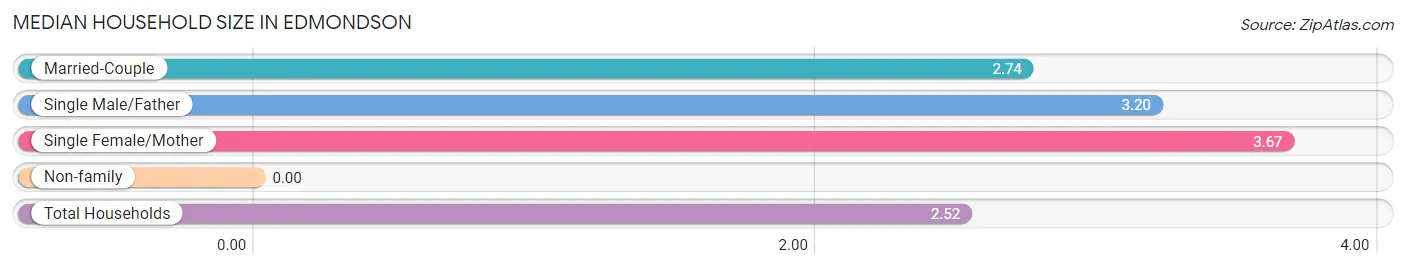
| Household Type | # Households | Household Size |
| Married-Couple | 38 (30.2%) | 2.74 |
| Single Male/Father | 5 (4.0%) | 3.20 |
| Single Female/Mother | 43 (34.1%) | 3.67 |
| Non-family | 40 (31.8%) | - |
| Total Households | 126 (100.0%) | 2.52 |
Household Size by Marriage Status in Edmondson
Out of a total of 126 households in Edmondson, 86 (68.2%) are family households, while 40 (31.8%) are nonfamily households. The most numerous type of family households are 2-person households, comprising 44, and the most common type of nonfamily households are 1-person households, comprising 40.
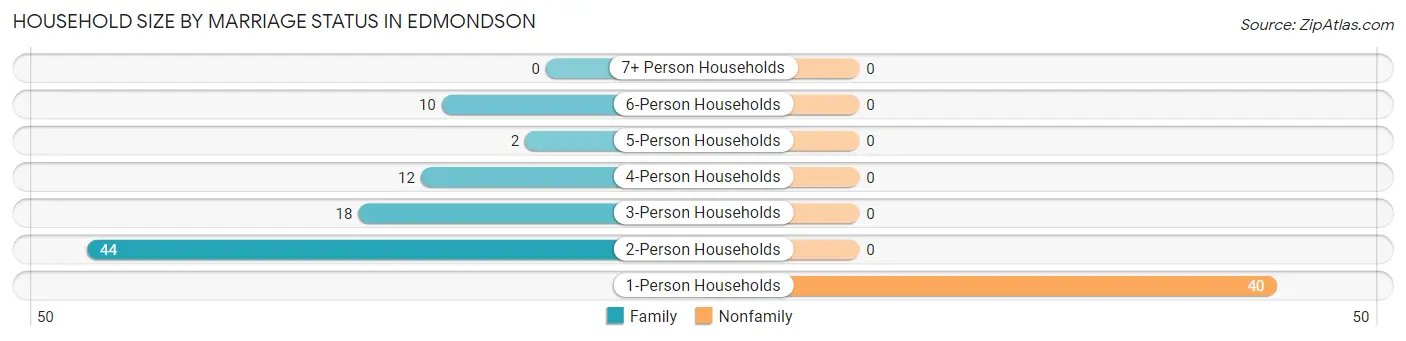
| Household Size | Family Households | Nonfamily Households |
| 1-Person Households | - | 40 (31.8%) |
| 2-Person Households | 44 (34.9%) | 0 (0.0%) |
| 3-Person Households | 18 (14.3%) | 0 (0.0%) |
| 4-Person Households | 12 (9.5%) | 0 (0.0%) |
| 5-Person Households | 2 (1.6%) | 0 (0.0%) |
| 6-Person Households | 10 (7.9%) | 0 (0.0%) |
| 7+ Person Households | 0 (0.0%) | 0 (0.0%) |
| Total | 86 (68.2%) | 40 (31.8%) |
Female Fertility in Edmondson
Fertility by Age in Edmondson
Average fertility rate in Edmondson is 175.0 births per 1,000 women. Women in the age bracket of 20 to 34 years have the highest fertility rate with 370.0 births per 1,000 women. Women in the age bracket of 20 to 34 years acount for 100.0% of all women with births.
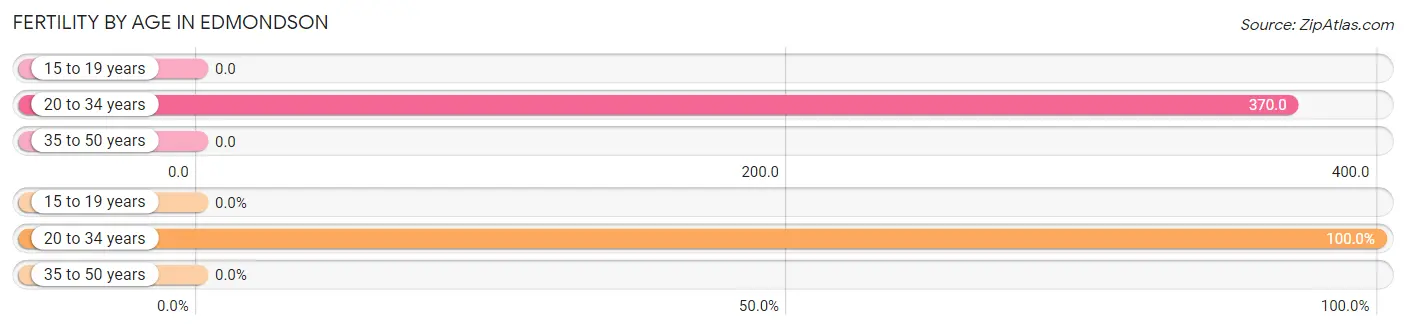
| Age Bracket | Women with Births | Births / 1,000 Women |
| 15 to 19 years | 0 (0.0%) | 0.0 |
| 20 to 34 years | 10 (100.0%) | 370.0 |
| 35 to 50 years | 0 (0.0%) | 0.0 |
| Total | 10 (100.0%) | 175.0 |
Fertility by Age by Marriage Status in Edmondson
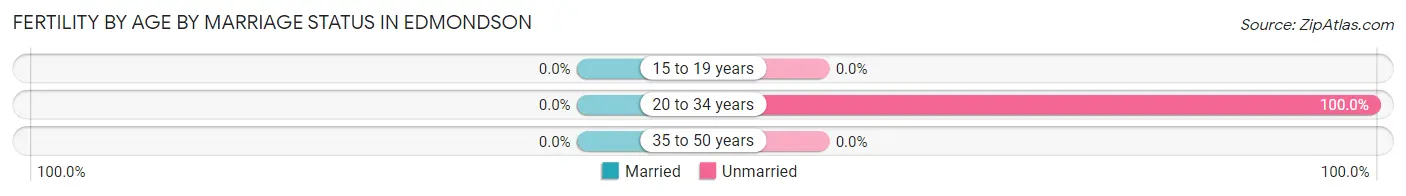
| Age Bracket | Married | Unmarried |
| 15 to 19 years | 0 (0.0%) | 0 (0.0%) |
| 20 to 34 years | 0 (0.0%) | 10 (100.0%) |
| 35 to 50 years | 0 (0.0%) | 0 (0.0%) |
| Total | 0 (0.0%) | 10 (100.0%) |
Fertility by Education in Edmondson
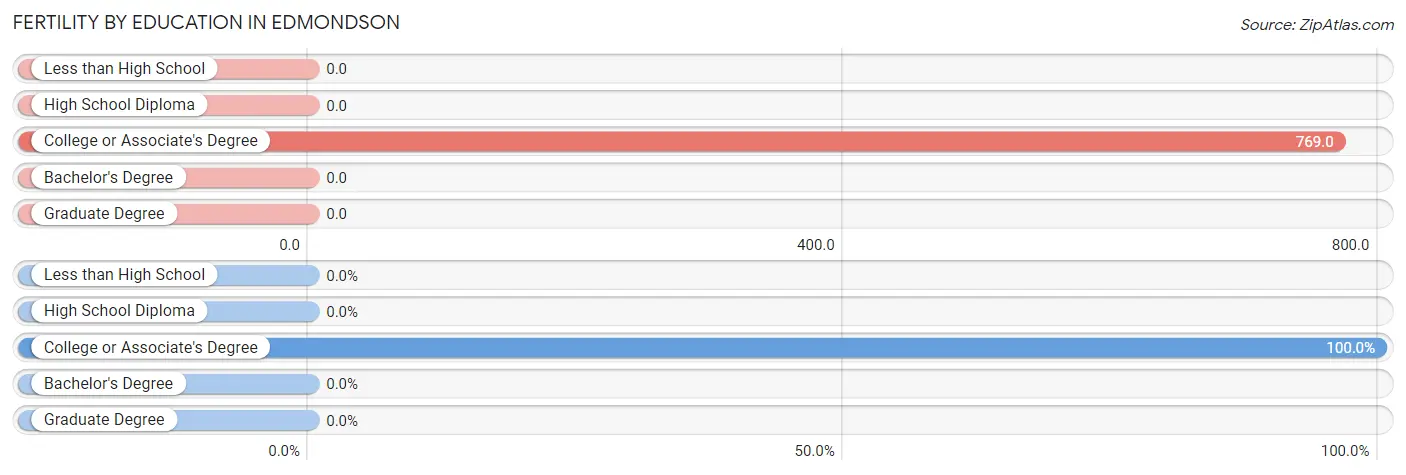
| Educational Attainment | Women with Births | Births / 1,000 Women |
| Less than High School | 0 (0.0%) | 0.0 |
| High School Diploma | 0 (0.0%) | 0.0 |
| College or Associate's Degree | 10 (100.0%) | 769.0 |
| Bachelor's Degree | 0 (0.0%) | 0.0 |
| Graduate Degree | 0 (0.0%) | 0.0 |
| Total | 10 (100.0%) | 175.0 |
Fertility by Education by Marriage Status in Edmondson
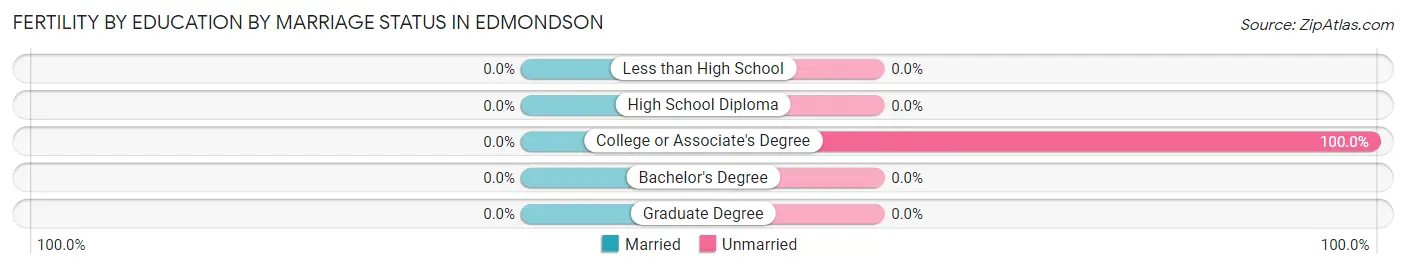
| Educational Attainment | Married | Unmarried |
| Less than High School | 0 (0.0%) | 0 (0.0%) |
| High School Diploma | 0 (0.0%) | 0 (0.0%) |
| College or Associate's Degree | 0 (0.0%) | 10 (100.0%) |
| Bachelor's Degree | 0 (0.0%) | 0 (0.0%) |
| Graduate Degree | 0 (0.0%) | 0 (0.0%) |
| Total | 0 (0.0%) | 10 (100.0%) |
Employment Characteristics in Edmondson
Employment by Class of Employer in Edmondson
Among the 101 employed individuals in Edmondson, private company employees (67 | 66.3%), self-employed (incorporated) (11 | 10.9%), and self-employed (not incorporated) (9 | 8.9%) make up the most common classes of employment.
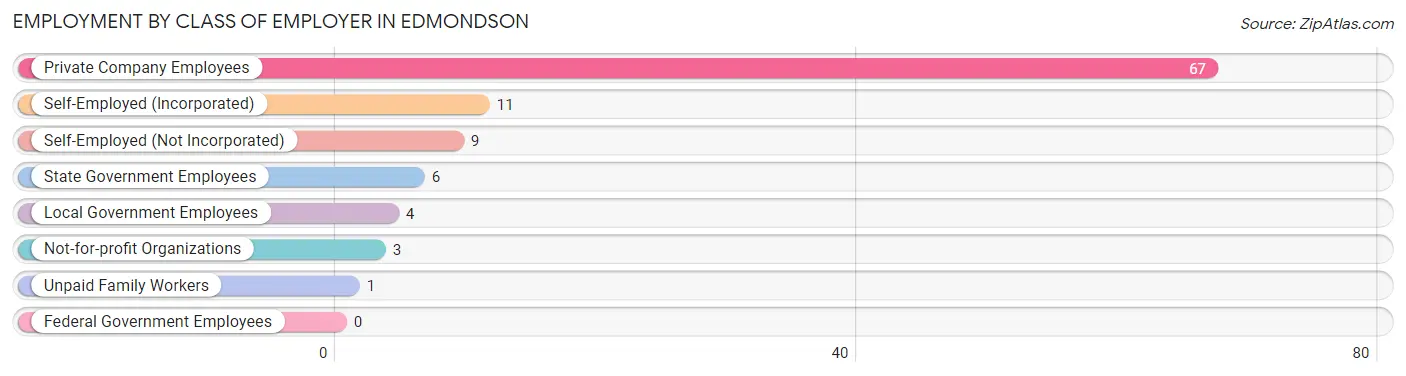
| Employer Class | # Employees | % Employees |
| Private Company Employees | 67 | 66.3% |
| Self-Employed (Incorporated) | 11 | 10.9% |
| Self-Employed (Not Incorporated) | 9 | 8.9% |
| Not-for-profit Organizations | 3 | 3.0% |
| Local Government Employees | 4 | 4.0% |
| State Government Employees | 6 | 5.9% |
| Federal Government Employees | 0 | 0.0% |
| Unpaid Family Workers | 1 | 1.0% |
| Total | 101 | 100.0% |
Employment Status by Age in Edmondson
According to the labor force statistics for Edmondson, out of the total population over 16 years of age (216), 52.8% or 114 individuals are in the labor force, with 7.0% or 8 of them unemployed. The age group with the highest labor force participation rate is 25 to 29 years, with 100.0% or 7 individuals in the labor force. Within the labor force, the 16 to 19 years age range has the highest percentage of unemployed individuals, with 100.0% or 4 of them being unemployed.
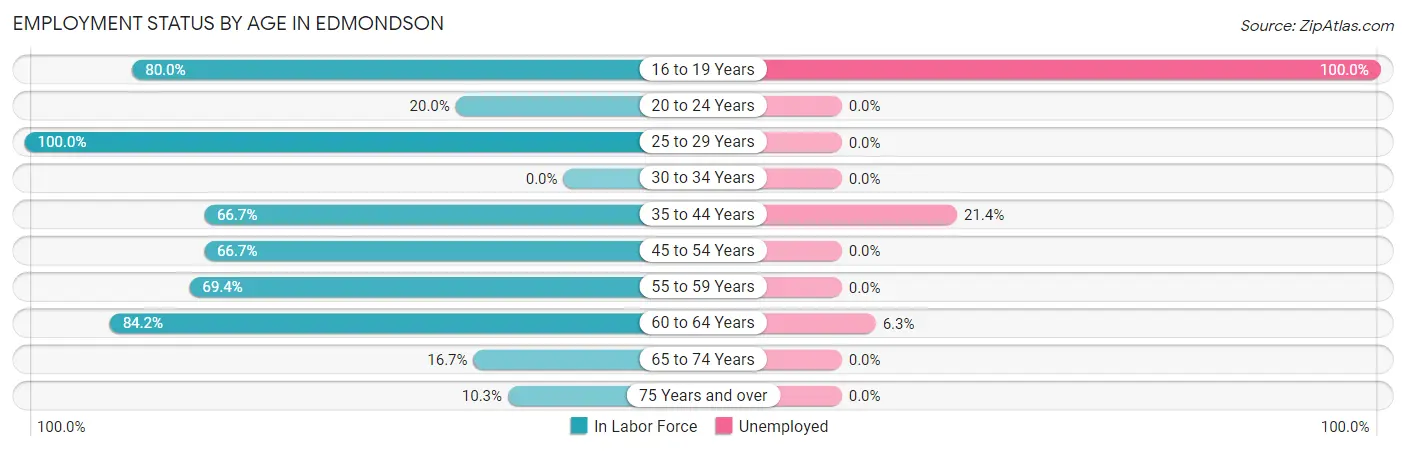
| Age Bracket | In Labor Force | Unemployed |
| 16 to 19 Years | 4 (80.0%) | 4 (100.0%) |
| 20 to 24 Years | 5 (20.0%) | 0 (0.0%) |
| 25 to 29 Years | 7 (100.0%) | 0 (0.0%) |
| 30 to 34 Years | 0 (0.0%) | 0 (0.0%) |
| 35 to 44 Years | 14 (66.7%) | 3 (21.4%) |
| 45 to 54 Years | 30 (66.7%) | 0 (0.0%) |
| 55 to 59 Years | 34 (69.4%) | 0 (0.0%) |
| 60 to 64 Years | 16 (84.2%) | 1 (6.3%) |
| 65 to 74 Years | 1 (16.7%) | 0 (0.0%) |
| 75 Years and over | 3 (10.3%) | 0 (0.0%) |
| Total | 114 (52.8%) | 8 (7.0%) |
Employment Status by Educational Attainment in Edmondson
According to labor force statistics for Edmondson, 66.9% of individuals (101) out of the total population between 25 and 64 years of age (151) are in the labor force, with 4.0% or 4 of them being unemployed. The group with the highest labor force participation rate are those with the educational attainment of bachelor's degree or higher, with 81.3% or 13 individuals in the labor force. Within the labor force, individuals with high school diploma education have the highest percentage of unemployment, with 8.5% or 4 of them being unemployed.
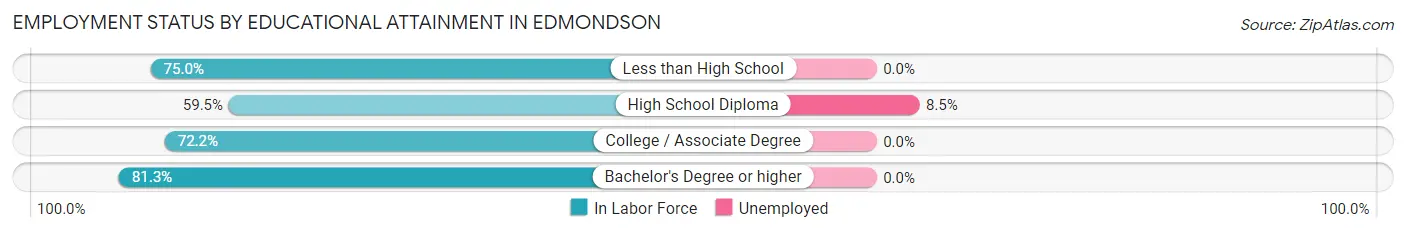
| Educational Attainment | In Labor Force | Unemployed |
| Less than High School | 15 (75.0%) | 0 (0.0%) |
| High School Diploma | 47 (59.5%) | 7 (8.5%) |
| College / Associate Degree | 26 (72.2%) | 0 (0.0%) |
| Bachelor's Degree or higher | 13 (81.3%) | 0 (0.0%) |
| Total | 101 (66.9%) | 6 (4.0%) |
Employment Occupations by Sex in Edmondson
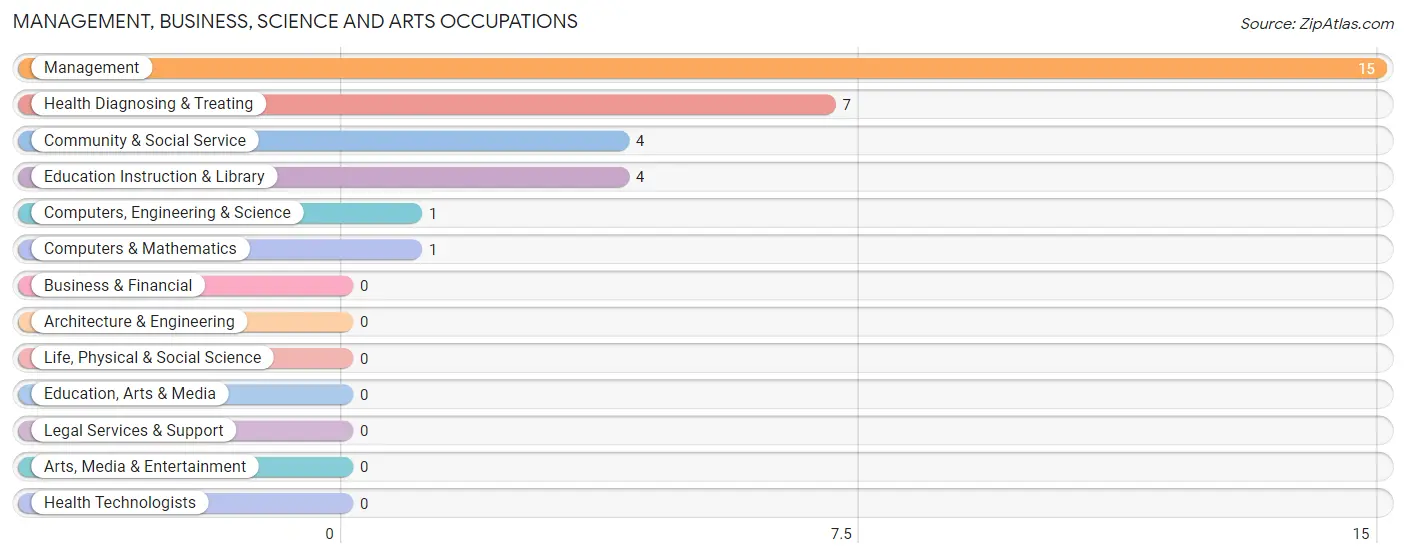
Management, Business, Science and Arts Occupations
The most common Management, Business, Science and Arts occupations in Edmondson are Management (15 | 14.1%), Health Diagnosing & Treating (7 | 6.6%), Community & Social Service (4 | 3.8%), Education Instruction & Library (4 | 3.8%), and Computers, Engineering & Science (1 | 0.9%).
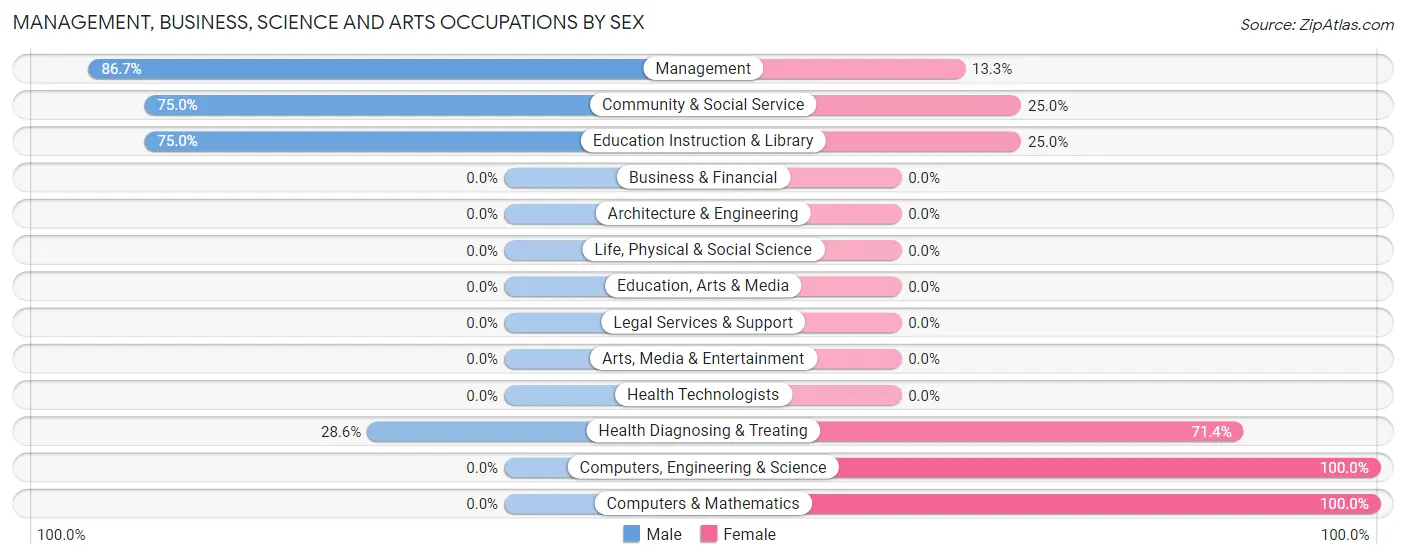
Management, Business, Science and Arts Occupations by Sex
Within the Management, Business, Science and Arts occupations in Edmondson, the most male-oriented occupations are Management (86.7%), Community & Social Service (75.0%), and Education Instruction & Library (75.0%), while the most female-oriented occupations are Computers, Engineering & Science (100.0%), Computers & Mathematics (100.0%), and Health Diagnosing & Treating (71.4%).
| Occupation | Male | Female |
| Management | 13 (86.7%) | 2 (13.3%) |
| Business & Financial | 0 (0.0%) | 0 (0.0%) |
| Computers, Engineering & Science | 0 (0.0%) | 1 (100.0%) |
| Computers & Mathematics | 0 (0.0%) | 1 (100.0%) |
| Architecture & Engineering | 0 (0.0%) | 0 (0.0%) |
| Life, Physical & Social Science | 0 (0.0%) | 0 (0.0%) |
| Community & Social Service | 3 (75.0%) | 1 (25.0%) |
| Education, Arts & Media | 0 (0.0%) | 0 (0.0%) |
| Legal Services & Support | 0 (0.0%) | 0 (0.0%) |
| Education Instruction & Library | 3 (75.0%) | 1 (25.0%) |
| Arts, Media & Entertainment | 0 (0.0%) | 0 (0.0%) |
| Health Diagnosing & Treating | 2 (28.6%) | 5 (71.4%) |
| Health Technologists | 0 (0.0%) | 0 (0.0%) |
| Total (Category) | 18 (66.7%) | 9 (33.3%) |
| Total (Overall) | 51 (48.1%) | 55 (51.9%) |
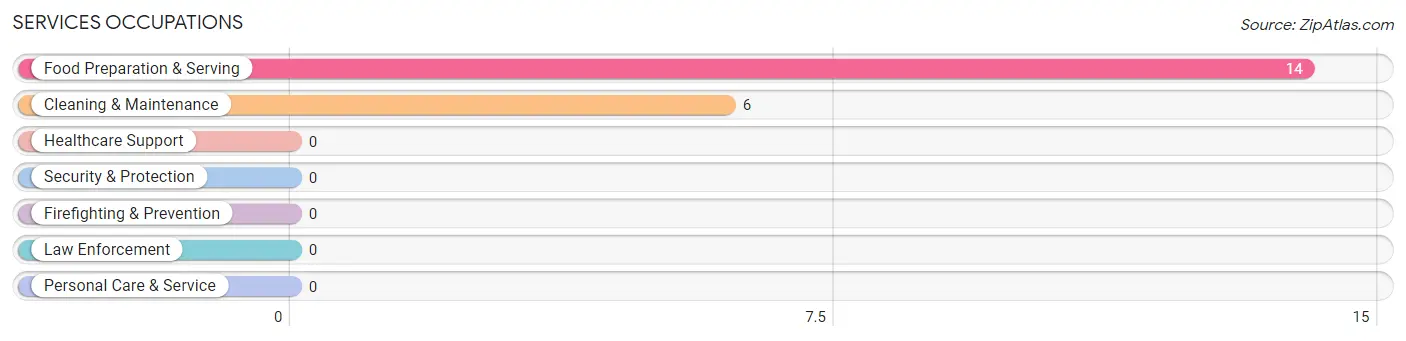
Services Occupations
The most common Services occupations in Edmondson are Food Preparation & Serving (14 | 13.2%), and Cleaning & Maintenance (6 | 5.7%).
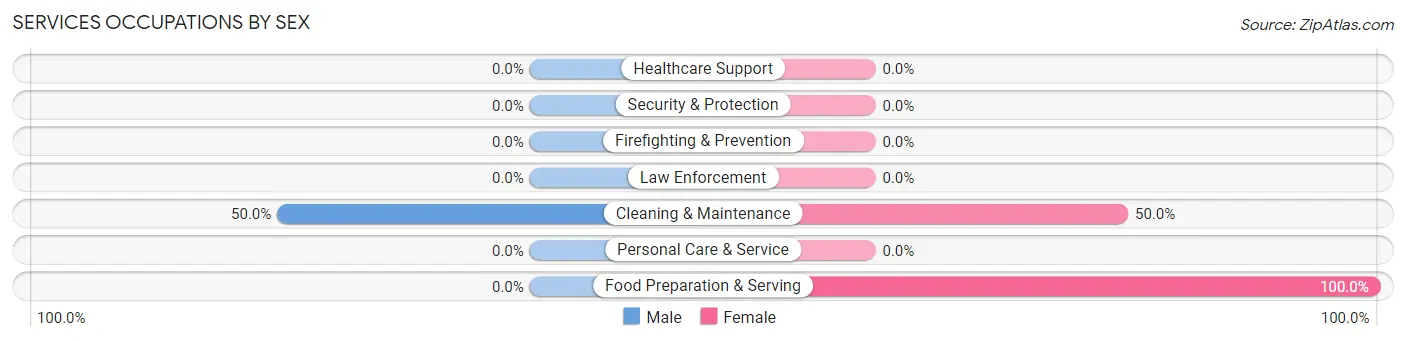
Services Occupations by Sex
| Occupation | Male | Female |
| Healthcare Support | 0 (0.0%) | 0 (0.0%) |
| Security & Protection | 0 (0.0%) | 0 (0.0%) |
| Firefighting & Prevention | 0 (0.0%) | 0 (0.0%) |
| Law Enforcement | 0 (0.0%) | 0 (0.0%) |
| Food Preparation & Serving | 0 (0.0%) | 14 (100.0%) |
| Cleaning & Maintenance | 3 (50.0%) | 3 (50.0%) |
| Personal Care & Service | 0 (0.0%) | 0 (0.0%) |
| Total (Category) | 3 (15.0%) | 17 (85.0%) |
| Total (Overall) | 51 (48.1%) | 55 (51.9%) |
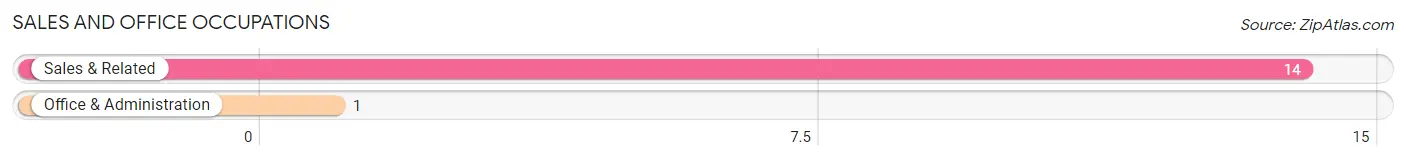
Sales and Office Occupations
The most common Sales and Office occupations in Edmondson are Sales & Related (14 | 13.2%), and Office & Administration (1 | 0.9%).
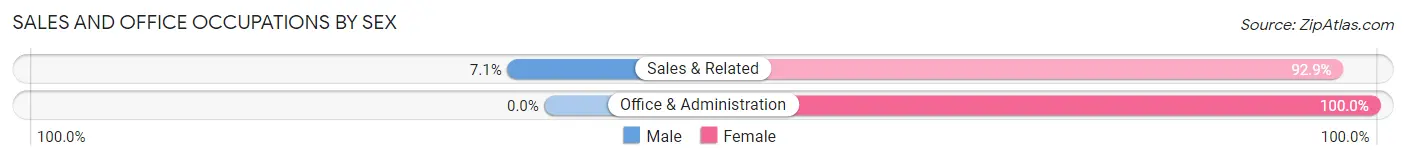
Sales and Office Occupations by Sex
| Occupation | Male | Female |
| Sales & Related | 1 (7.1%) | 13 (92.9%) |
| Office & Administration | 0 (0.0%) | 1 (100.0%) |
| Total (Category) | 1 (6.7%) | 14 (93.3%) |
| Total (Overall) | 51 (48.1%) | 55 (51.9%) |
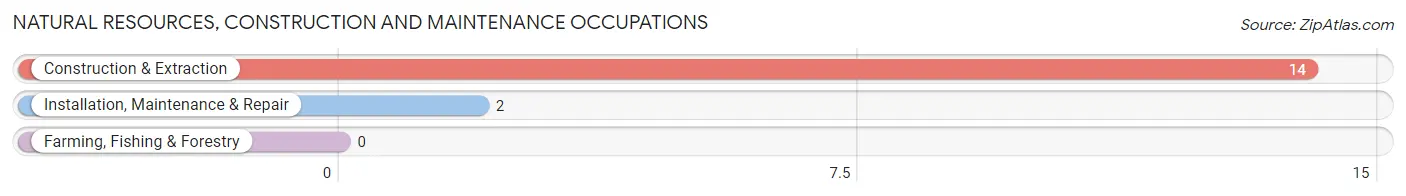
Natural Resources, Construction and Maintenance Occupations
The most common Natural Resources, Construction and Maintenance occupations in Edmondson are Construction & Extraction (14 | 13.2%), and Installation, Maintenance & Repair (2 | 1.9%).
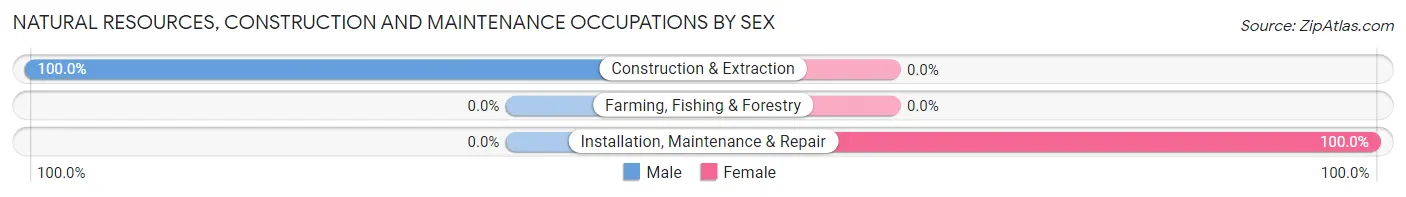
Natural Resources, Construction and Maintenance Occupations by Sex
| Occupation | Male | Female |
| Farming, Fishing & Forestry | 0 (0.0%) | 0 (0.0%) |
| Construction & Extraction | 14 (100.0%) | 0 (0.0%) |
| Installation, Maintenance & Repair | 0 (0.0%) | 2 (100.0%) |
| Total (Category) | 14 (87.5%) | 2 (12.5%) |
| Total (Overall) | 51 (48.1%) | 55 (51.9%) |
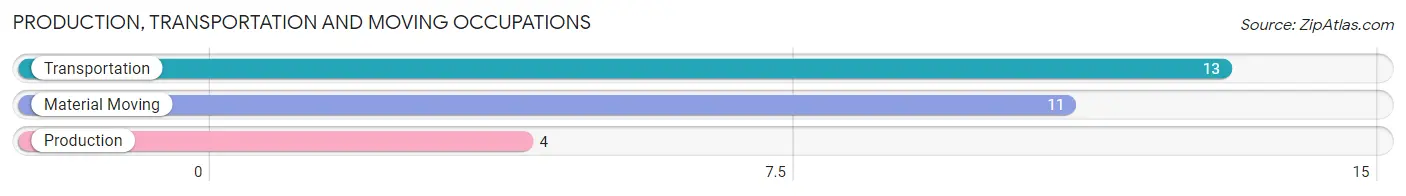
Production, Transportation and Moving Occupations
The most common Production, Transportation and Moving occupations in Edmondson are Transportation (13 | 12.3%), Material Moving (11 | 10.4%), and Production (4 | 3.8%).
Production, Transportation and Moving Occupations by Sex
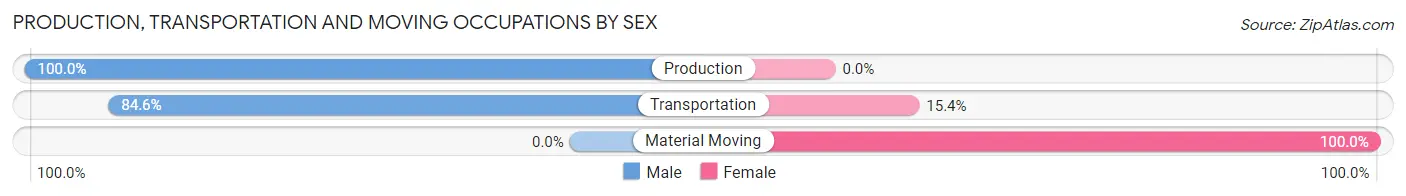
| Occupation | Male | Female |
| Production | 4 (100.0%) | 0 (0.0%) |
| Transportation | 11 (84.6%) | 2 (15.4%) |
| Material Moving | 0 (0.0%) | 11 (100.0%) |
| Total (Category) | 15 (53.6%) | 13 (46.4%) |
| Total (Overall) | 51 (48.1%) | 55 (51.9%) |
Employment Industries by Sex in Edmondson
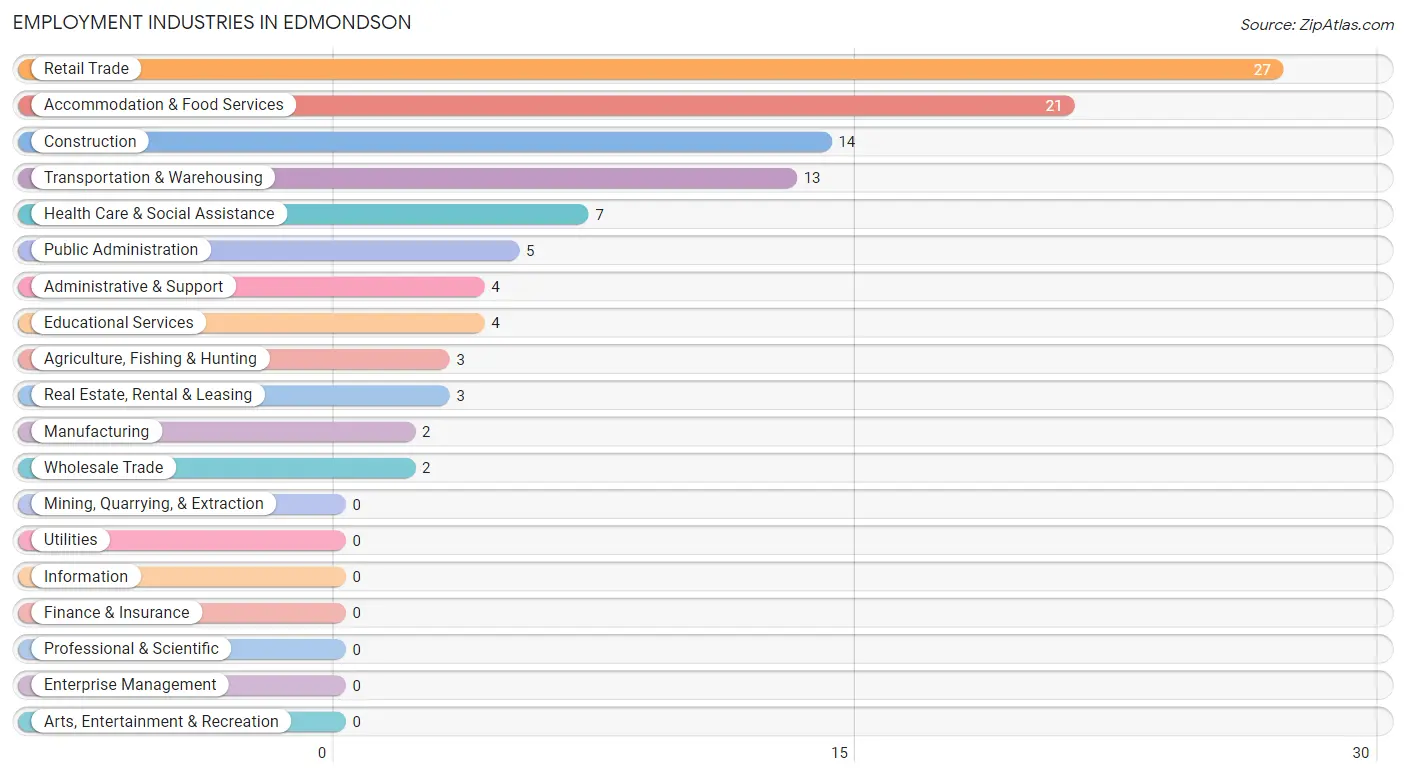
Employment Industries in Edmondson
The major employment industries in Edmondson include Retail Trade (27 | 25.5%), Accommodation & Food Services (21 | 19.8%), Construction (14 | 13.2%), Transportation & Warehousing (13 | 12.3%), and Health Care & Social Assistance (7 | 6.6%).
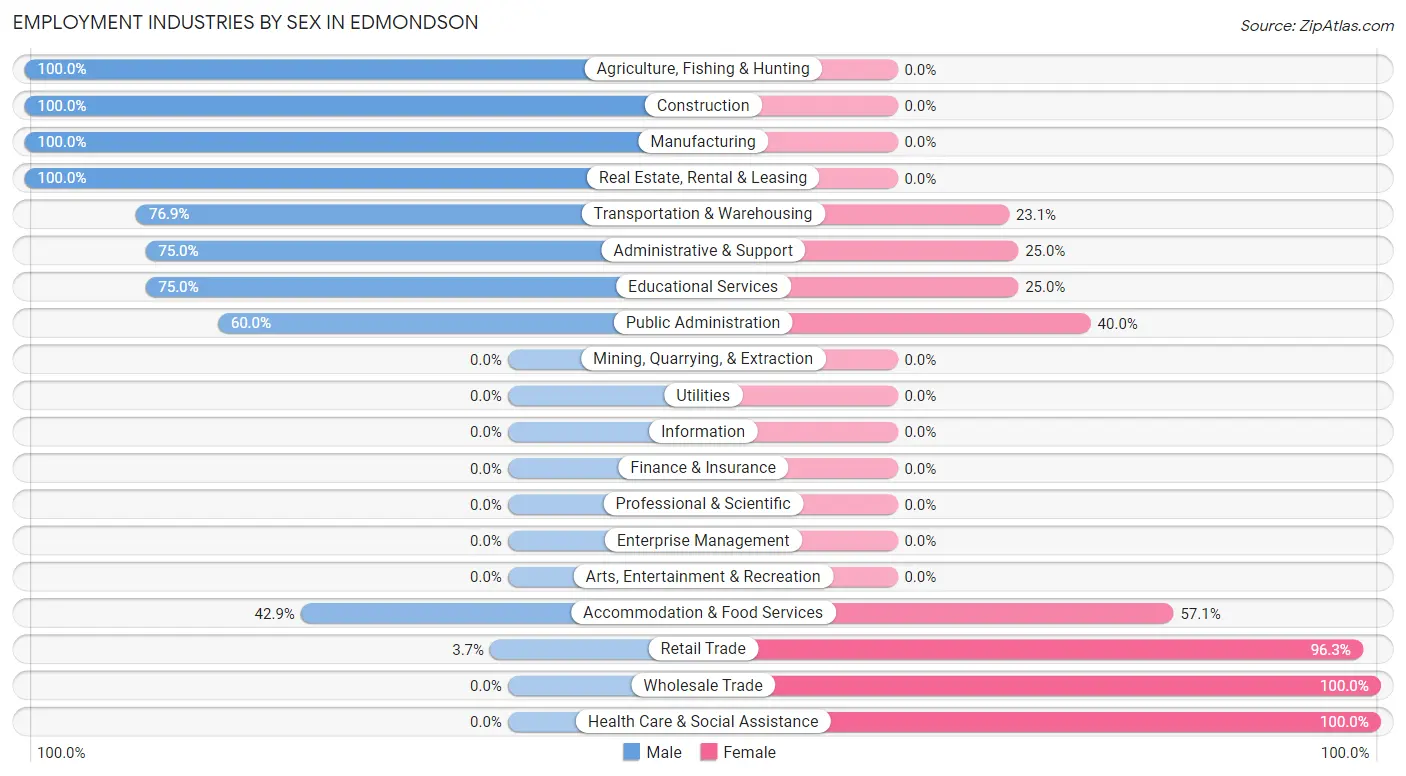
Employment Industries by Sex in Edmondson
The Edmondson industries that see more men than women are Agriculture, Fishing & Hunting (100.0%), Construction (100.0%), and Manufacturing (100.0%), whereas the industries that tend to have a higher number of women are Wholesale Trade (100.0%), Health Care & Social Assistance (100.0%), and Retail Trade (96.3%).
| Industry | Male | Female |
| Agriculture, Fishing & Hunting | 3 (100.0%) | 0 (0.0%) |
| Mining, Quarrying, & Extraction | 0 (0.0%) | 0 (0.0%) |
| Construction | 14 (100.0%) | 0 (0.0%) |
| Manufacturing | 2 (100.0%) | 0 (0.0%) |
| Wholesale Trade | 0 (0.0%) | 2 (100.0%) |
| Retail Trade | 1 (3.7%) | 26 (96.3%) |
| Transportation & Warehousing | 10 (76.9%) | 3 (23.1%) |
| Utilities | 0 (0.0%) | 0 (0.0%) |
| Information | 0 (0.0%) | 0 (0.0%) |
| Finance & Insurance | 0 (0.0%) | 0 (0.0%) |
| Real Estate, Rental & Leasing | 3 (100.0%) | 0 (0.0%) |
| Professional & Scientific | 0 (0.0%) | 0 (0.0%) |
| Enterprise Management | 0 (0.0%) | 0 (0.0%) |
| Administrative & Support | 3 (75.0%) | 1 (25.0%) |
| Educational Services | 3 (75.0%) | 1 (25.0%) |
| Health Care & Social Assistance | 0 (0.0%) | 7 (100.0%) |
| Arts, Entertainment & Recreation | 0 (0.0%) | 0 (0.0%) |
| Accommodation & Food Services | 9 (42.9%) | 12 (57.1%) |
| Public Administration | 3 (60.0%) | 2 (40.0%) |
| Total | 51 (48.1%) | 55 (51.9%) |
Education in Edmondson
School Enrollment in Edmondson
The most common levels of schooling among the 72 students in Edmondson are middle school (33 | 45.8%), elementary school (15 | 20.8%), and kindergarten (9 | 12.5%).
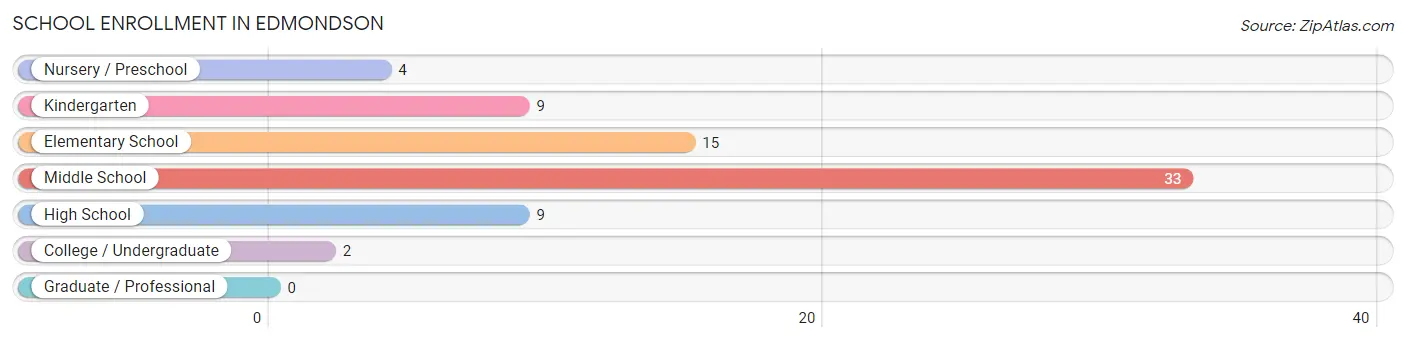
| School Level | # Students | % Students |
| Nursery / Preschool | 4 | 5.6% |
| Kindergarten | 9 | 12.5% |
| Elementary School | 15 | 20.8% |
| Middle School | 33 | 45.8% |
| High School | 9 | 12.5% |
| College / Undergraduate | 2 | 2.8% |
| Graduate / Professional | 0 | 0.0% |
| Total | 72 | 100.0% |
School Enrollment by Age by Funding Source in Edmondson
Out of a total of 72 students who are enrolled in schools in Edmondson, 4 (5.6%) attend a private institution, while the remaining 68 (94.4%) are enrolled in public schools. The age group of 5 to 9 year old has the highest likelihood of being enrolled in private schools, with 4 (14.8% in the age bracket) enrolled. Conversely, the age group of 10 to 14 year olds has the lowest likelihood of being enrolled in a private school, with 33 (100.0% in the age bracket) attending a public institution.
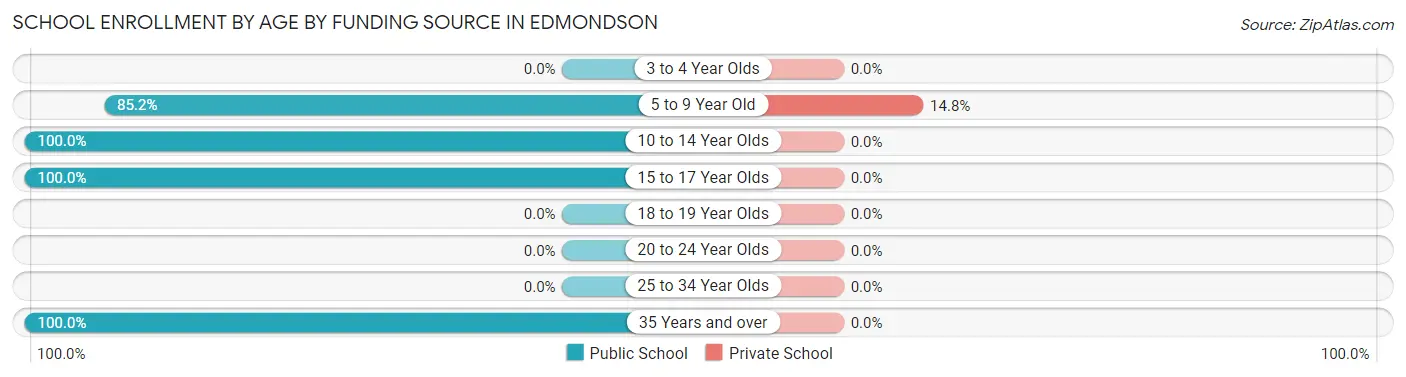
| Age Bracket | Public School | Private School |
| 3 to 4 Year Olds | 0 (0.0%) | 0 (0.0%) |
| 5 to 9 Year Old | 23 (85.2%) | 4 (14.8%) |
| 10 to 14 Year Olds | 33 (100.0%) | 0 (0.0%) |
| 15 to 17 Year Olds | 10 (100.0%) | 0 (0.0%) |
| 18 to 19 Year Olds | 0 (0.0%) | 0 (0.0%) |
| 20 to 24 Year Olds | 0 (0.0%) | 0 (0.0%) |
| 25 to 34 Year Olds | 0 (0.0%) | 0 (0.0%) |
| 35 Years and over | 2 (100.0%) | 0 (0.0%) |
| Total | 68 (94.4%) | 4 (5.6%) |
Educational Attainment by Field of Study in Edmondson
Business (6 | 37.5%), education (6 | 37.5%), social sciences (2 | 12.5%), and science & technology (2 | 12.5%) are the most common fields of study among 16 individuals in Edmondson who have obtained a bachelor's degree or higher.
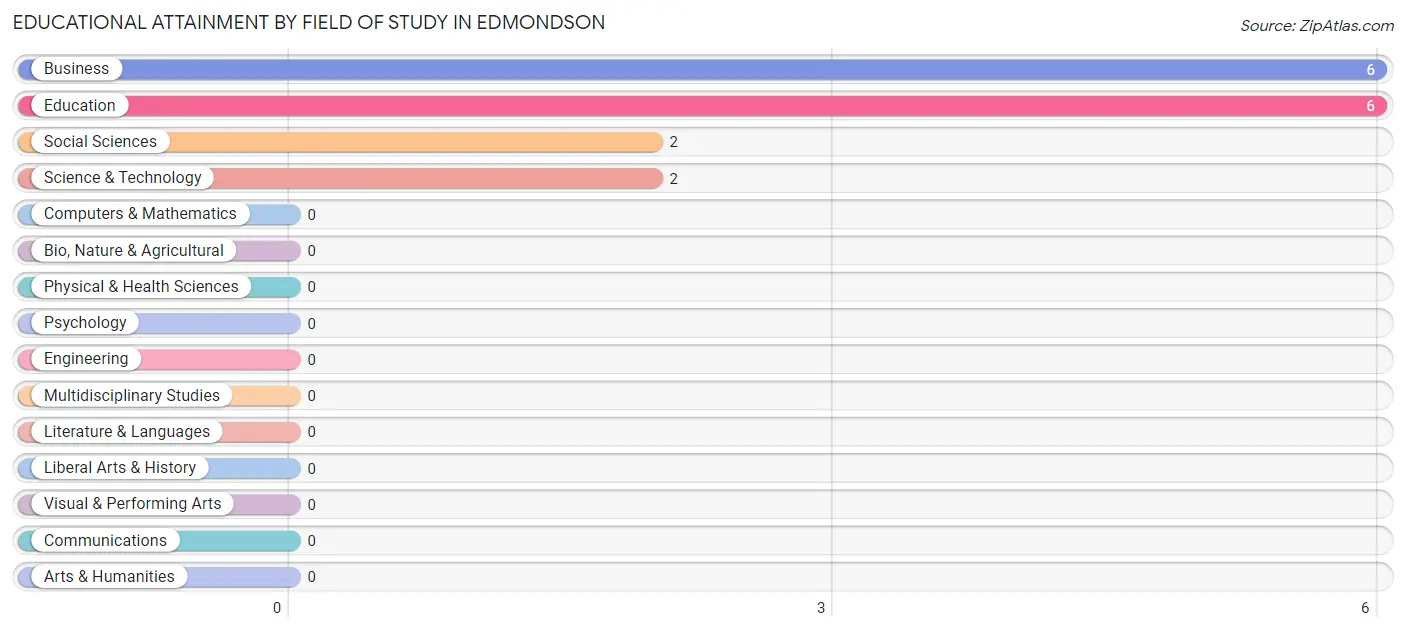
| Field of Study | # Graduates | % Graduates |
| Computers & Mathematics | 0 | 0.0% |
| Bio, Nature & Agricultural | 0 | 0.0% |
| Physical & Health Sciences | 0 | 0.0% |
| Psychology | 0 | 0.0% |
| Social Sciences | 2 | 12.5% |
| Engineering | 0 | 0.0% |
| Multidisciplinary Studies | 0 | 0.0% |
| Science & Technology | 2 | 12.5% |
| Business | 6 | 37.5% |
| Education | 6 | 37.5% |
| Literature & Languages | 0 | 0.0% |
| Liberal Arts & History | 0 | 0.0% |
| Visual & Performing Arts | 0 | 0.0% |
| Communications | 0 | 0.0% |
| Arts & Humanities | 0 | 0.0% |
| Total | 16 | 100.0% |
Transportation & Commute in Edmondson
Vehicle Availability by Sex in Edmondson
The most prevalent vehicle ownership categories in Edmondson are males with 4 vehicles (20, accounting for 39.2%) and females with 4 vehicles (14, making up 40.0%).
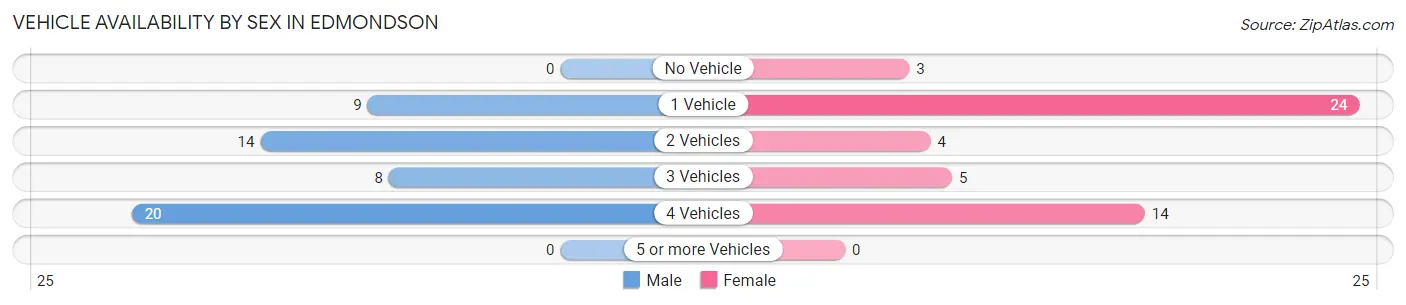
| Vehicles Available | Male | Female |
| No Vehicle | 0 (0.0%) | 3 (6.0%) |
| 1 Vehicle | 9 (17.6%) | 24 (48.0%) |
| 2 Vehicles | 14 (27.5%) | 4 (8.0%) |
| 3 Vehicles | 8 (15.7%) | 5 (10.0%) |
| 4 Vehicles | 20 (39.2%) | 14 (28.0%) |
| 5 or more Vehicles | 0 (0.0%) | 0 (0.0%) |
| Total | 51 (100.0%) | 50 (100.0%) |
Commute Time in Edmondson
The most frequently occuring commute durations in Edmondson are 15 to 19 minutes (25 commuters, 27.8%), 5 to 9 minutes (20 commuters, 22.2%), and 30 to 34 minutes (12 commuters, 13.3%).
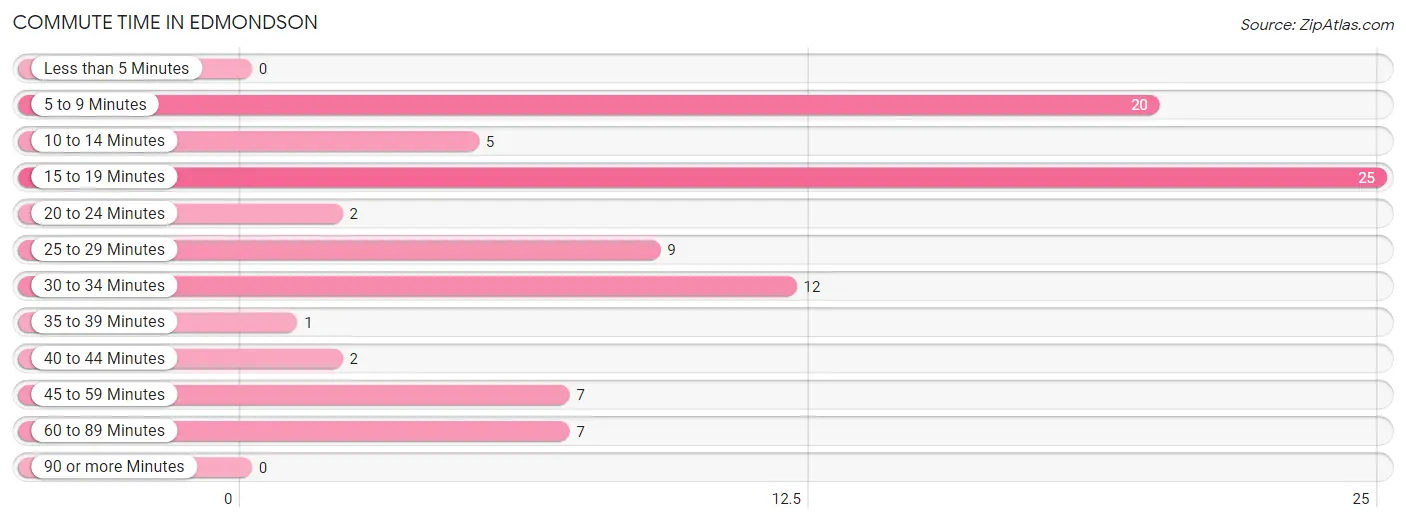
| Commute Time | # Commuters | % Commuters |
| Less than 5 Minutes | 0 | 0.0% |
| 5 to 9 Minutes | 20 | 22.2% |
| 10 to 14 Minutes | 5 | 5.6% |
| 15 to 19 Minutes | 25 | 27.8% |
| 20 to 24 Minutes | 2 | 2.2% |
| 25 to 29 Minutes | 9 | 10.0% |
| 30 to 34 Minutes | 12 | 13.3% |
| 35 to 39 Minutes | 1 | 1.1% |
| 40 to 44 Minutes | 2 | 2.2% |
| 45 to 59 Minutes | 7 | 7.8% |
| 60 to 89 Minutes | 7 | 7.8% |
| 90 or more Minutes | 0 | 0.0% |
Commute Time by Sex in Edmondson
The most common commute times in Edmondson are 15 to 19 minutes (15 commuters, 37.5%) for males and 5 to 9 minutes (13 commuters, 26.0%) for females.
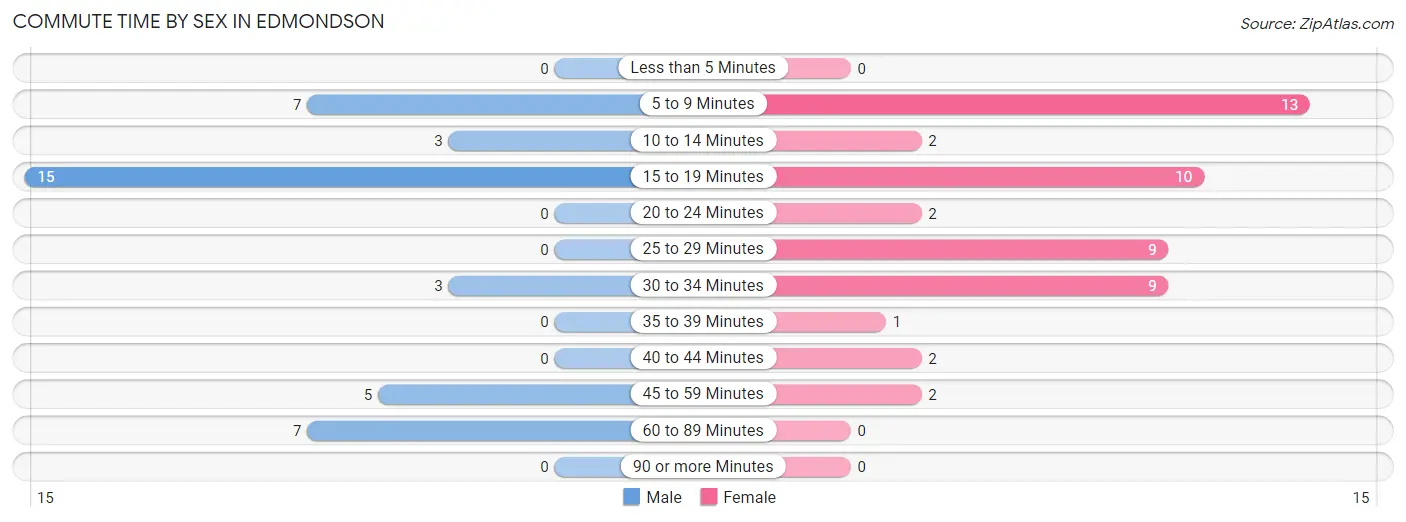
| Commute Time | Male | Female |
| Less than 5 Minutes | 0 (0.0%) | 0 (0.0%) |
| 5 to 9 Minutes | 7 (17.5%) | 13 (26.0%) |
| 10 to 14 Minutes | 3 (7.5%) | 2 (4.0%) |
| 15 to 19 Minutes | 15 (37.5%) | 10 (20.0%) |
| 20 to 24 Minutes | 0 (0.0%) | 2 (4.0%) |
| 25 to 29 Minutes | 0 (0.0%) | 9 (18.0%) |
| 30 to 34 Minutes | 3 (7.5%) | 9 (18.0%) |
| 35 to 39 Minutes | 0 (0.0%) | 1 (2.0%) |
| 40 to 44 Minutes | 0 (0.0%) | 2 (4.0%) |
| 45 to 59 Minutes | 5 (12.5%) | 2 (4.0%) |
| 60 to 89 Minutes | 7 (17.5%) | 0 (0.0%) |
| 90 or more Minutes | 0 (0.0%) | 0 (0.0%) |
Time of Departure to Work by Sex in Edmondson
The most frequent times of departure to work in Edmondson are 5:30 AM to 5:59 AM (9, 22.5%) for males and 7:00 AM to 7:29 AM (11, 22.0%) for females.
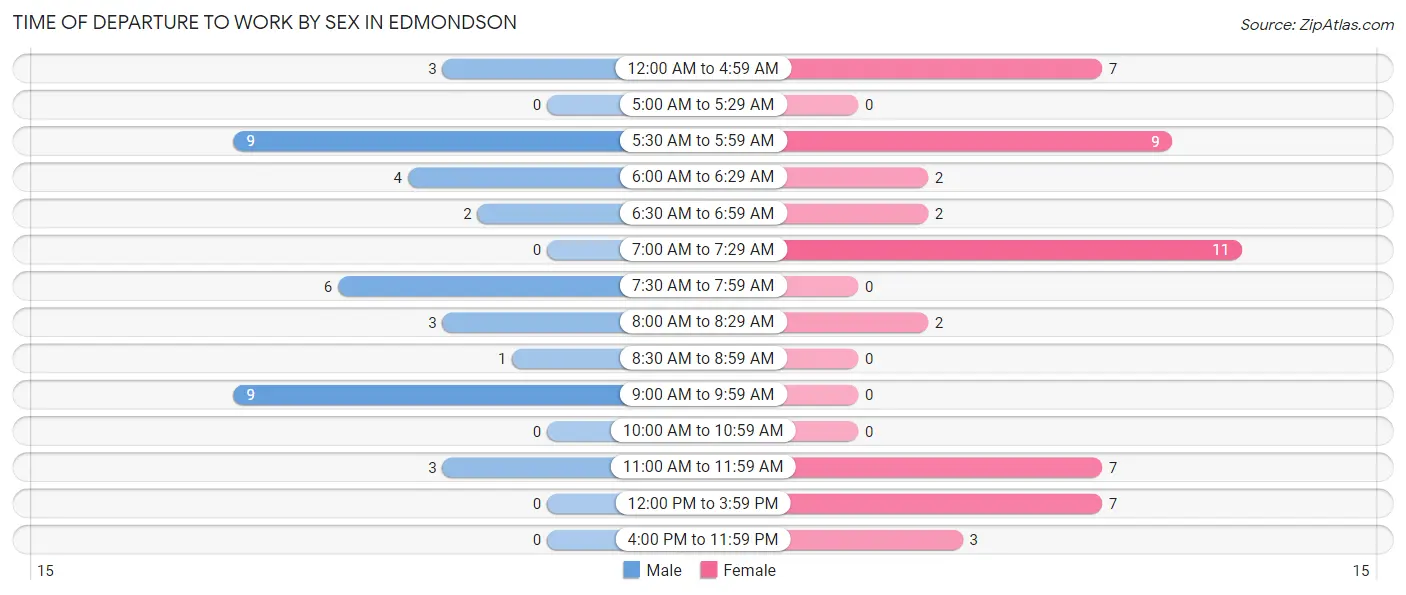
| Time of Departure | Male | Female |
| 12:00 AM to 4:59 AM | 3 (7.5%) | 7 (14.0%) |
| 5:00 AM to 5:29 AM | 0 (0.0%) | 0 (0.0%) |
| 5:30 AM to 5:59 AM | 9 (22.5%) | 9 (18.0%) |
| 6:00 AM to 6:29 AM | 4 (10.0%) | 2 (4.0%) |
| 6:30 AM to 6:59 AM | 2 (5.0%) | 2 (4.0%) |
| 7:00 AM to 7:29 AM | 0 (0.0%) | 11 (22.0%) |
| 7:30 AM to 7:59 AM | 6 (15.0%) | 0 (0.0%) |
| 8:00 AM to 8:29 AM | 3 (7.5%) | 2 (4.0%) |
| 8:30 AM to 8:59 AM | 1 (2.5%) | 0 (0.0%) |
| 9:00 AM to 9:59 AM | 9 (22.5%) | 0 (0.0%) |
| 10:00 AM to 10:59 AM | 0 (0.0%) | 0 (0.0%) |
| 11:00 AM to 11:59 AM | 3 (7.5%) | 7 (14.0%) |
| 12:00 PM to 3:59 PM | 0 (0.0%) | 7 (14.0%) |
| 4:00 PM to 11:59 PM | 0 (0.0%) | 3 (6.0%) |
| Total | 40 (100.0%) | 50 (100.0%) |
Housing Occupancy in Edmondson
Occupancy by Ownership in Edmondson
Of the total 126 dwellings in Edmondson, owner-occupied units account for 59 (46.8%), while renter-occupied units make up 67 (53.2%).
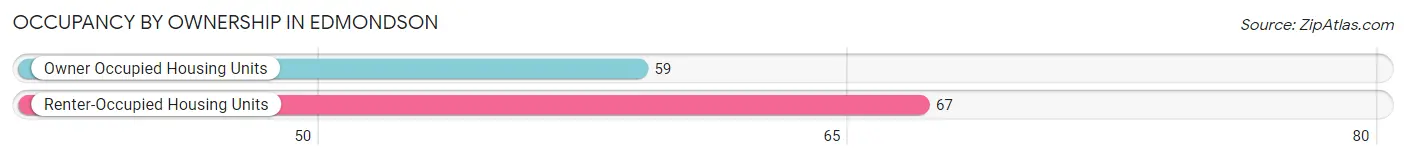
| Occupancy | # Housing Units | % Housing Units |
| Owner Occupied Housing Units | 59 | 46.8% |
| Renter-Occupied Housing Units | 67 | 53.2% |
| Total Occupied Housing Units | 126 | 100.0% |
Occupancy by Household Size in Edmondson
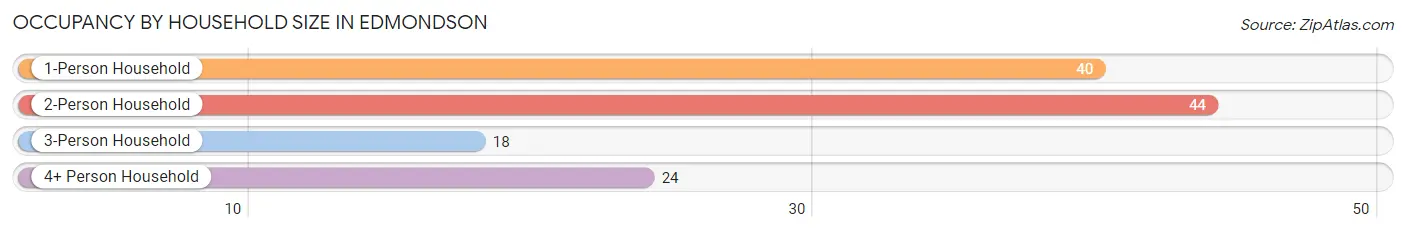
| Household Size | # Housing Units | % Housing Units |
| 1-Person Household | 40 | 31.8% |
| 2-Person Household | 44 | 34.9% |
| 3-Person Household | 18 | 14.3% |
| 4+ Person Household | 24 | 19.1% |
| Total Housing Units | 126 | 100.0% |
Occupancy by Ownership by Household Size in Edmondson
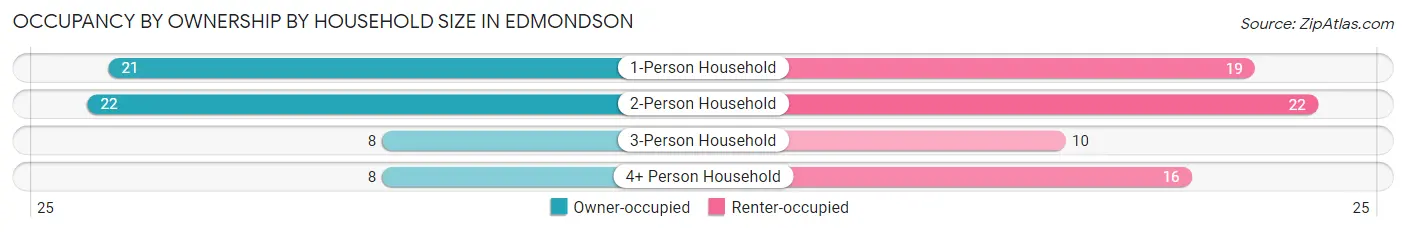
| Household Size | Owner-occupied | Renter-occupied |
| 1-Person Household | 21 (52.5%) | 19 (47.5%) |
| 2-Person Household | 22 (50.0%) | 22 (50.0%) |
| 3-Person Household | 8 (44.4%) | 10 (55.6%) |
| 4+ Person Household | 8 (33.3%) | 16 (66.7%) |
| Total Housing Units | 59 (46.8%) | 67 (53.2%) |
Occupancy by Educational Attainment in Edmondson
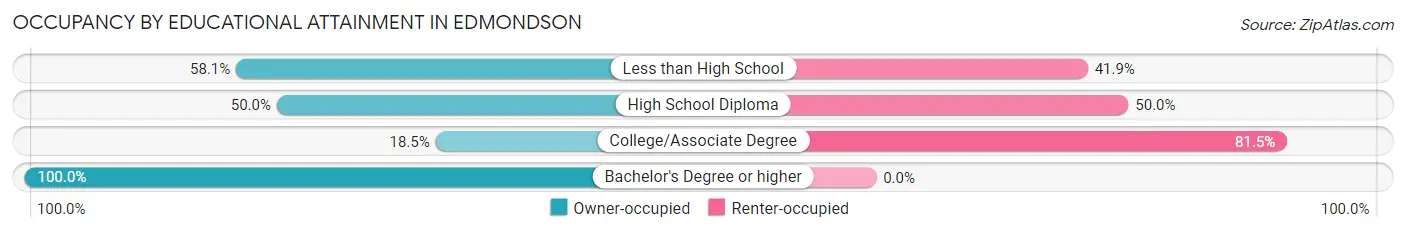
| Household Size | Owner-occupied | Renter-occupied |
| Less than High School | 18 (58.1%) | 13 (41.9%) |
| High School Diploma | 32 (50.0%) | 32 (50.0%) |
| College/Associate Degree | 5 (18.5%) | 22 (81.5%) |
| Bachelor's Degree or higher | 4 (100.0%) | 0 (0.0%) |
Occupancy by Age of Householder in Edmondson
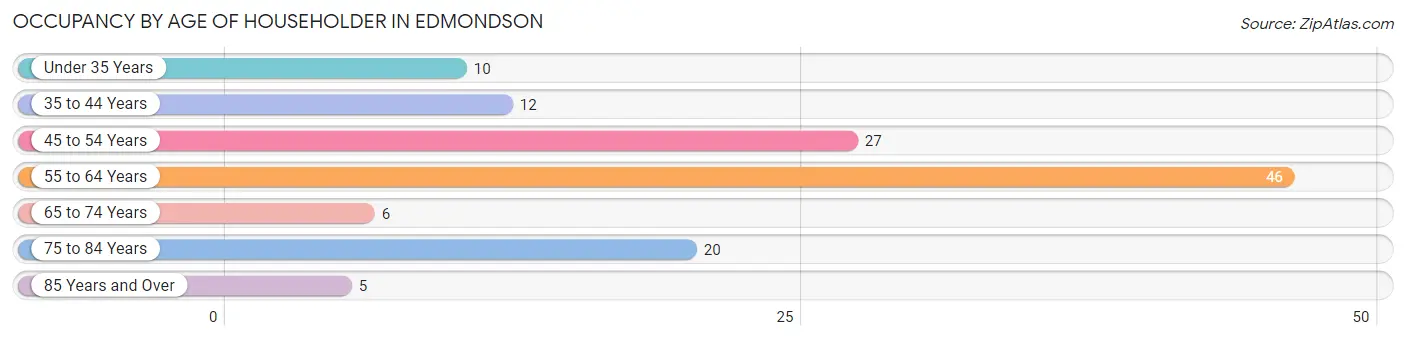
| Age Bracket | # Households | % Households |
| Under 35 Years | 10 | 7.9% |
| 35 to 44 Years | 12 | 9.5% |
| 45 to 54 Years | 27 | 21.4% |
| 55 to 64 Years | 46 | 36.5% |
| 65 to 74 Years | 6 | 4.8% |
| 75 to 84 Years | 20 | 15.9% |
| 85 Years and Over | 5 | 4.0% |
| Total | 126 | 100.0% |
Housing Finances in Edmondson
Median Income by Occupancy in Edmondson
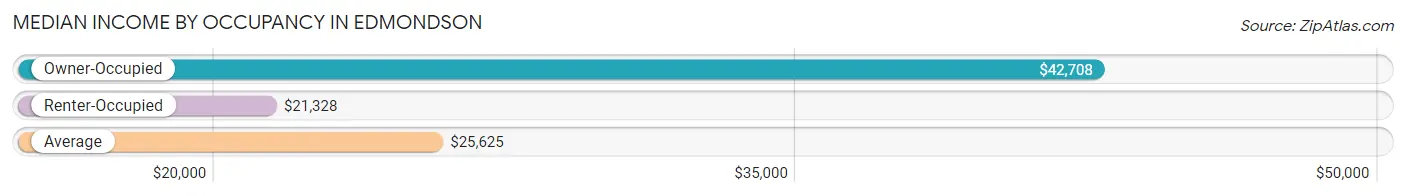
| Occupancy Type | # Households | Median Income |
| Owner-Occupied | 59 (46.8%) | $42,708 |
| Renter-Occupied | 67 (53.2%) | $21,328 |
| Average | 126 (100.0%) | $25,625 |
Occupancy by Householder Income Bracket in Edmondson
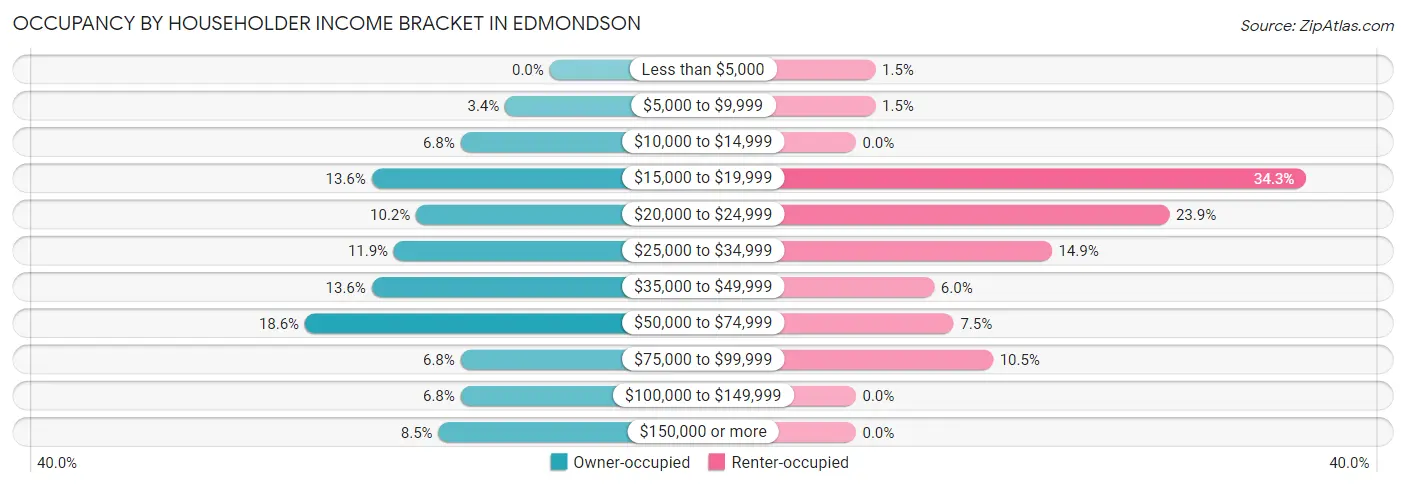
| Income Bracket | Owner-occupied | Renter-occupied |
| Less than $5,000 | 0 (0.0%) | 1 (1.5%) |
| $5,000 to $9,999 | 2 (3.4%) | 1 (1.5%) |
| $10,000 to $14,999 | 4 (6.8%) | 0 (0.0%) |
| $15,000 to $19,999 | 8 (13.6%) | 23 (34.3%) |
| $20,000 to $24,999 | 6 (10.2%) | 16 (23.9%) |
| $25,000 to $34,999 | 7 (11.9%) | 10 (14.9%) |
| $35,000 to $49,999 | 8 (13.6%) | 4 (6.0%) |
| $50,000 to $74,999 | 11 (18.6%) | 5 (7.5%) |
| $75,000 to $99,999 | 4 (6.8%) | 7 (10.4%) |
| $100,000 to $149,999 | 4 (6.8%) | 0 (0.0%) |
| $150,000 or more | 5 (8.5%) | 0 (0.0%) |
| Total | 59 (100.0%) | 67 (100.0%) |
Monthly Housing Cost Tiers in Edmondson
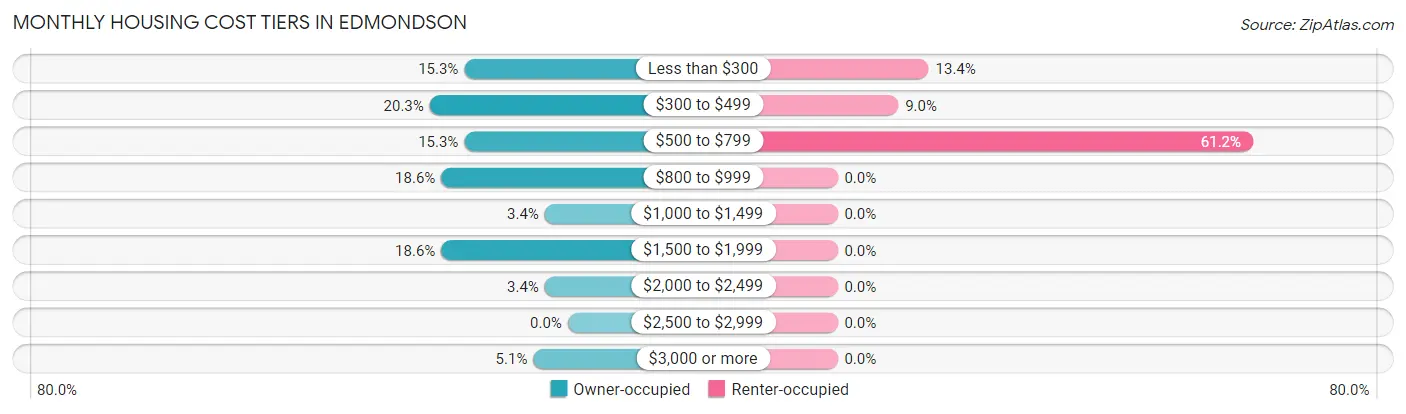
| Monthly Cost | Owner-occupied | Renter-occupied |
| Less than $300 | 9 (15.2%) | 9 (13.4%) |
| $300 to $499 | 12 (20.3%) | 6 (9.0%) |
| $500 to $799 | 9 (15.2%) | 41 (61.2%) |
| $800 to $999 | 11 (18.6%) | 0 (0.0%) |
| $1,000 to $1,499 | 2 (3.4%) | 0 (0.0%) |
| $1,500 to $1,999 | 11 (18.6%) | 0 (0.0%) |
| $2,000 to $2,499 | 2 (3.4%) | 0 (0.0%) |
| $2,500 to $2,999 | 0 (0.0%) | 0 (0.0%) |
| $3,000 or more | 3 (5.1%) | 0 (0.0%) |
| Total | 59 (100.0%) | 67 (100.0%) |
Physical Housing Characteristics in Edmondson
Housing Structures in Edmondson
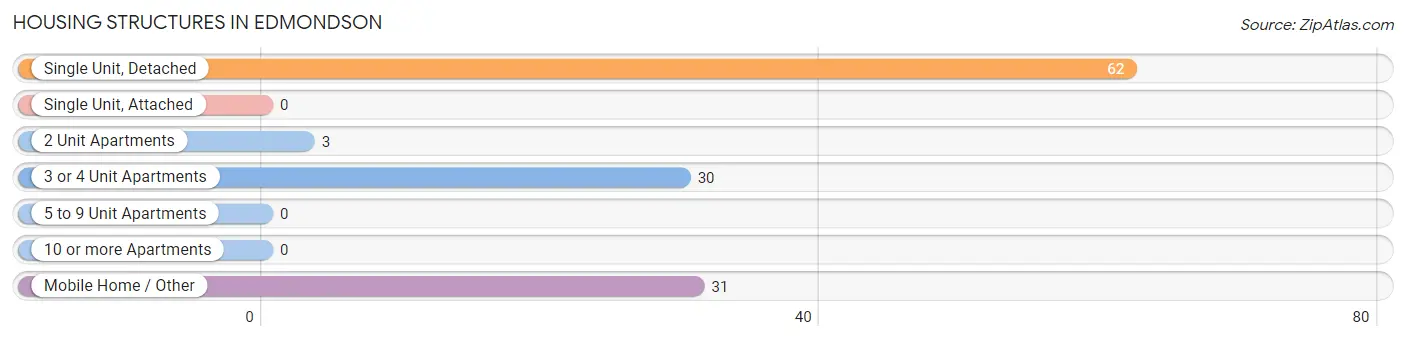
| Structure Type | # Housing Units | % Housing Units |
| Single Unit, Detached | 62 | 49.2% |
| Single Unit, Attached | 0 | 0.0% |
| 2 Unit Apartments | 3 | 2.4% |
| 3 or 4 Unit Apartments | 30 | 23.8% |
| 5 to 9 Unit Apartments | 0 | 0.0% |
| 10 or more Apartments | 0 | 0.0% |
| Mobile Home / Other | 31 | 24.6% |
| Total | 126 | 100.0% |
Housing Structures by Occupancy in Edmondson
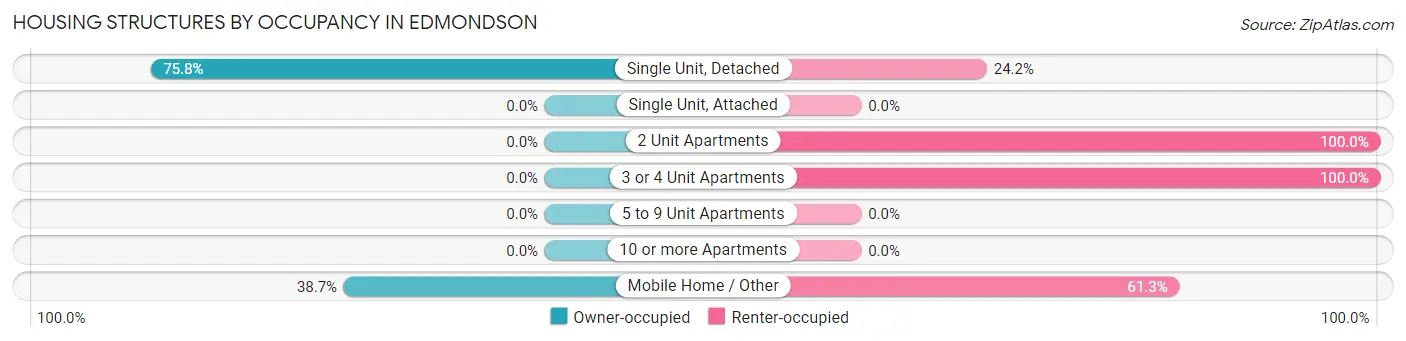
| Structure Type | Owner-occupied | Renter-occupied |
| Single Unit, Detached | 47 (75.8%) | 15 (24.2%) |
| Single Unit, Attached | 0 (0.0%) | 0 (0.0%) |
| 2 Unit Apartments | 0 (0.0%) | 3 (100.0%) |
| 3 or 4 Unit Apartments | 0 (0.0%) | 30 (100.0%) |
| 5 to 9 Unit Apartments | 0 (0.0%) | 0 (0.0%) |
| 10 or more Apartments | 0 (0.0%) | 0 (0.0%) |
| Mobile Home / Other | 12 (38.7%) | 19 (61.3%) |
| Total | 59 (46.8%) | 67 (53.2%) |
Housing Structures by Number of Rooms in Edmondson
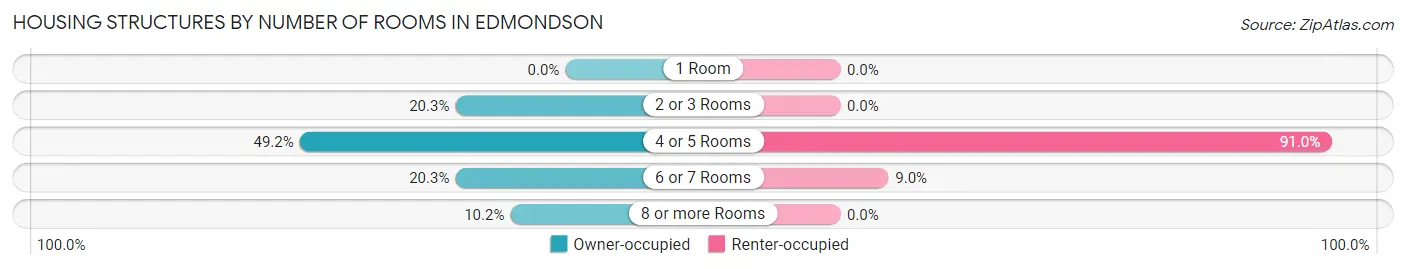
| Number of Rooms | Owner-occupied | Renter-occupied |
| 1 Room | 0 (0.0%) | 0 (0.0%) |
| 2 or 3 Rooms | 12 (20.3%) | 0 (0.0%) |
| 4 or 5 Rooms | 29 (49.1%) | 61 (91.0%) |
| 6 or 7 Rooms | 12 (20.3%) | 6 (9.0%) |
| 8 or more Rooms | 6 (10.2%) | 0 (0.0%) |
| Total | 59 (100.0%) | 67 (100.0%) |
Housing Structure by Heating Type in Edmondson
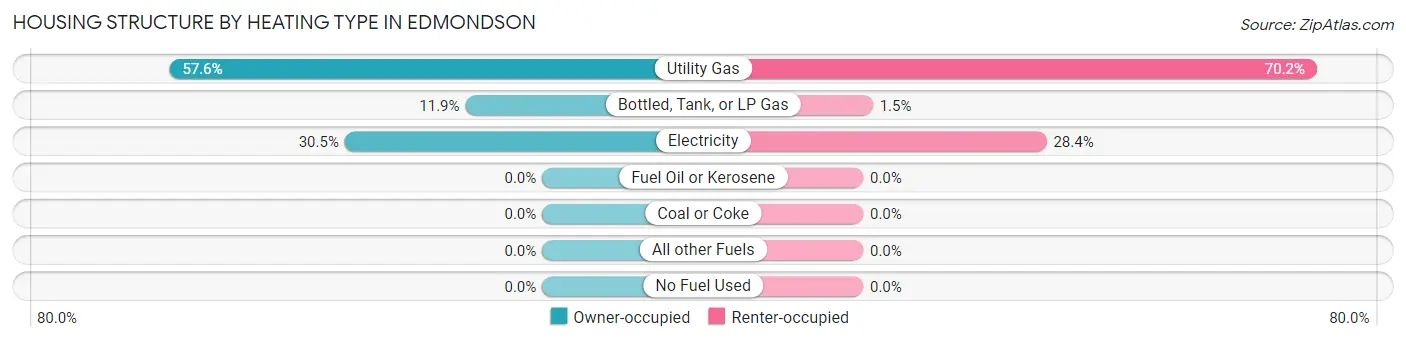
| Heating Type | Owner-occupied | Renter-occupied |
| Utility Gas | 34 (57.6%) | 47 (70.2%) |
| Bottled, Tank, or LP Gas | 7 (11.9%) | 1 (1.5%) |
| Electricity | 18 (30.5%) | 19 (28.4%) |
| Fuel Oil or Kerosene | 0 (0.0%) | 0 (0.0%) |
| Coal or Coke | 0 (0.0%) | 0 (0.0%) |
| All other Fuels | 0 (0.0%) | 0 (0.0%) |
| No Fuel Used | 0 (0.0%) | 0 (0.0%) |
| Total | 59 (100.0%) | 67 (100.0%) |
Household Vehicle Usage in Edmondson
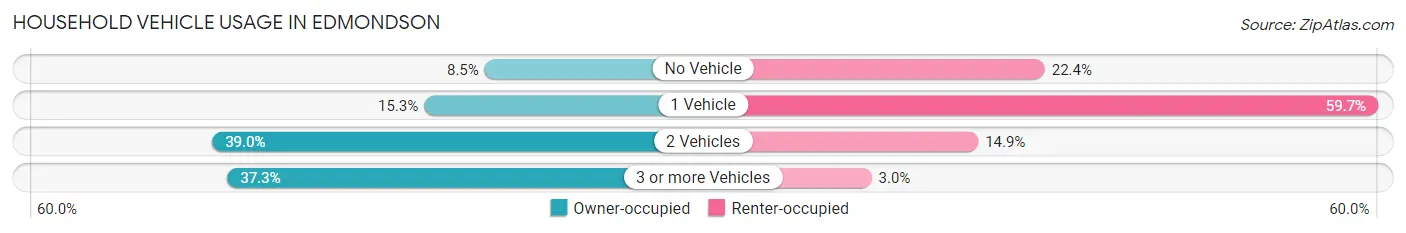
| Vehicles per Household | Owner-occupied | Renter-occupied |
| No Vehicle | 5 (8.5%) | 15 (22.4%) |
| 1 Vehicle | 9 (15.2%) | 40 (59.7%) |
| 2 Vehicles | 23 (39.0%) | 10 (14.9%) |
| 3 or more Vehicles | 22 (37.3%) | 2 (3.0%) |
| Total | 59 (100.0%) | 67 (100.0%) |
Real Estate & Mortgages in Edmondson
Real Estate and Mortgage Overview in Edmondson
| Characteristic | Without Mortgage | With Mortgage |
| Housing Units | 28 | 31 |
| Median Property Value | - | - |
| Median Household Income | $24,167 | $5 |
| Monthly Housing Costs | $342 | $3 |
| Real Estate Taxes | - | - |
Property Value by Mortgage Status in Edmondson
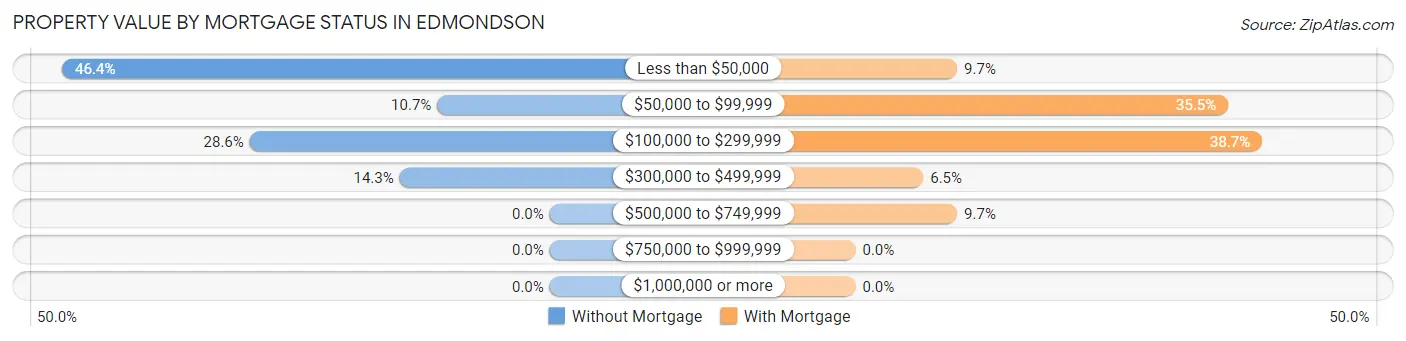
| Property Value | Without Mortgage | With Mortgage |
| Less than $50,000 | 13 (46.4%) | 3 (9.7%) |
| $50,000 to $99,999 | 3 (10.7%) | 11 (35.5%) |
| $100,000 to $299,999 | 8 (28.6%) | 12 (38.7%) |
| $300,000 to $499,999 | 4 (14.3%) | 2 (6.5%) |
| $500,000 to $749,999 | 0 (0.0%) | 3 (9.7%) |
| $750,000 to $999,999 | 0 (0.0%) | 0 (0.0%) |
| $1,000,000 or more | 0 (0.0%) | 0 (0.0%) |
| Total | 28 (100.0%) | 31 (100.0%) |
Household Income by Mortgage Status in Edmondson
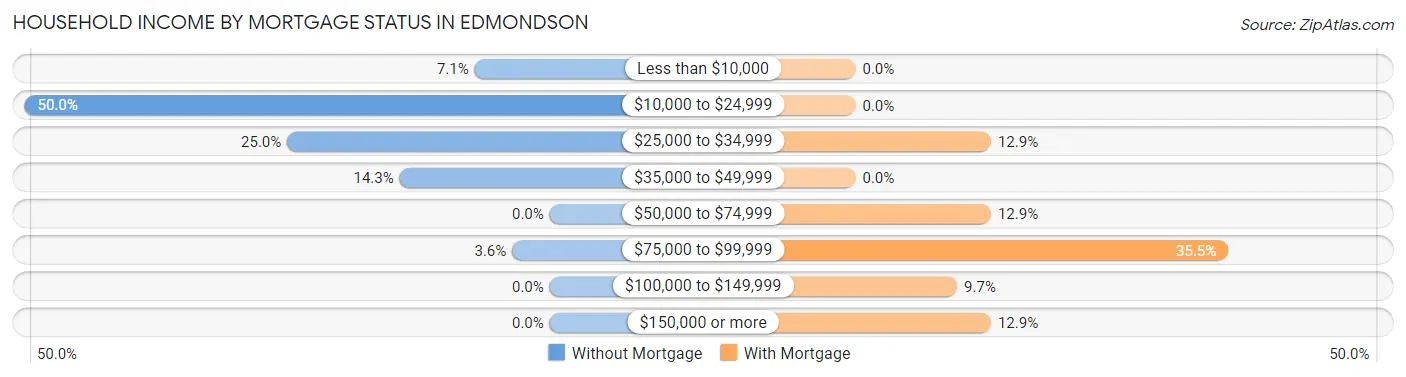
| Household Income | Without Mortgage | With Mortgage |
| Less than $10,000 | 2 (7.1%) | 0 (0.0%) |
| $10,000 to $24,999 | 14 (50.0%) | 0 (0.0%) |
| $25,000 to $34,999 | 7 (25.0%) | 4 (12.9%) |
| $35,000 to $49,999 | 4 (14.3%) | 0 (0.0%) |
| $50,000 to $74,999 | 0 (0.0%) | 4 (12.9%) |
| $75,000 to $99,999 | 1 (3.6%) | 11 (35.5%) |
| $100,000 to $149,999 | 0 (0.0%) | 3 (9.7%) |
| $150,000 or more | 0 (0.0%) | 4 (12.9%) |
| Total | 28 (100.0%) | 31 (100.0%) |
Property Value to Household Income Ratio in Edmondson
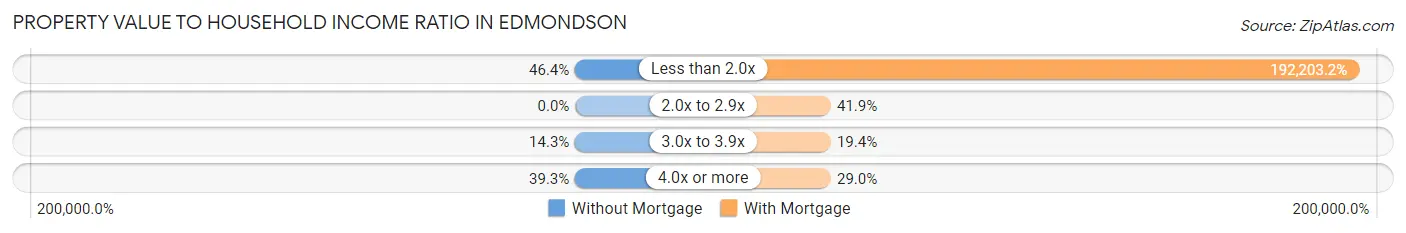
| Value-to-Income Ratio | Without Mortgage | With Mortgage |
| Less than 2.0x | 13 (46.4%) | 59,583 (192,203.2%) |
| 2.0x to 2.9x | 0 (0.0%) | 13 (41.9%) |
| 3.0x to 3.9x | 4 (14.3%) | 6 (19.4%) |
| 4.0x or more | 11 (39.3%) | 9 (29.0%) |
| Total | 28 (100.0%) | 31 (100.0%) |
Real Estate Taxes by Mortgage Status in Edmondson
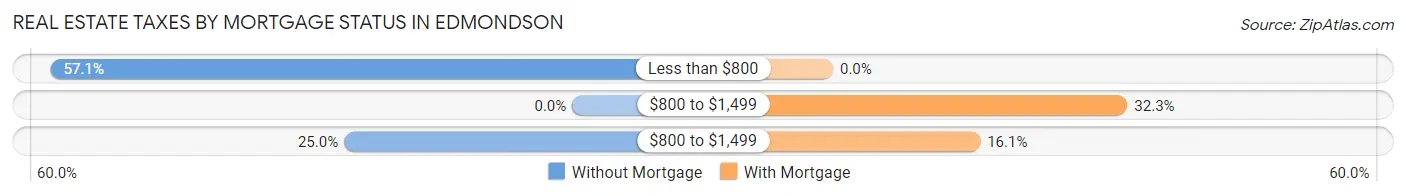
| Property Taxes | Without Mortgage | With Mortgage |
| Less than $800 | 16 (57.1%) | 0 (0.0%) |
| $800 to $1,499 | 0 (0.0%) | 10 (32.3%) |
| $800 to $1,499 | 7 (25.0%) | 5 (16.1%) |
| Total | 28 (100.0%) | 31 (100.0%) |
Health & Disability in Edmondson
Health Insurance Coverage by Age in Edmondson
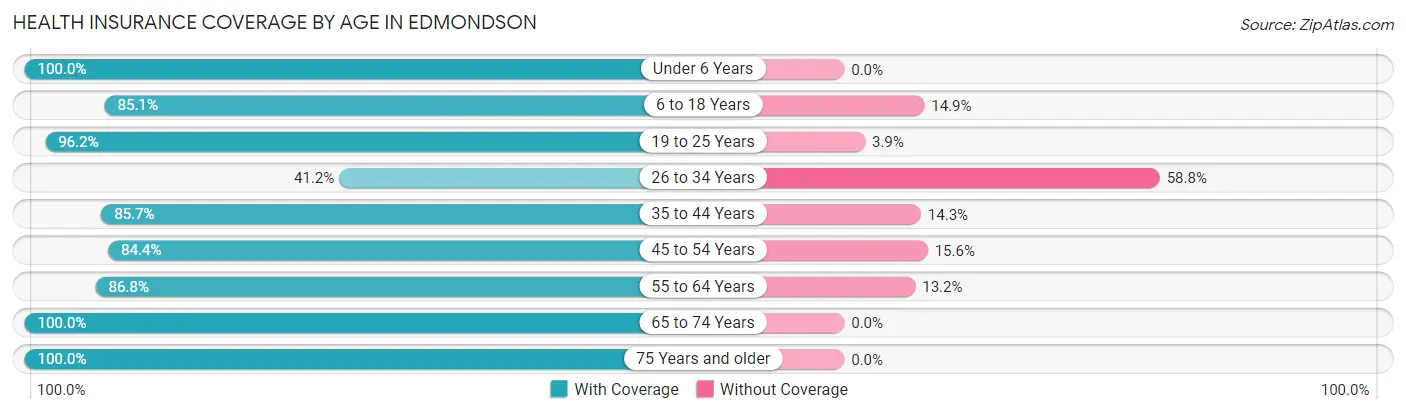
| Age Bracket | With Coverage | Without Coverage |
| Under 6 Years | 39 (100.0%) | 0 (0.0%) |
| 6 to 18 Years | 57 (85.1%) | 10 (14.9%) |
| 19 to 25 Years | 25 (96.2%) | 1 (3.8%) |
| 26 to 34 Years | 7 (41.2%) | 10 (58.8%) |
| 35 to 44 Years | 18 (85.7%) | 3 (14.3%) |
| 45 to 54 Years | 38 (84.4%) | 7 (15.6%) |
| 55 to 64 Years | 59 (86.8%) | 9 (13.2%) |
| 65 to 74 Years | 6 (100.0%) | 0 (0.0%) |
| 75 Years and older | 29 (100.0%) | 0 (0.0%) |
| Total | 278 (87.4%) | 40 (12.6%) |
Health Insurance Coverage by Citizenship Status in Edmondson
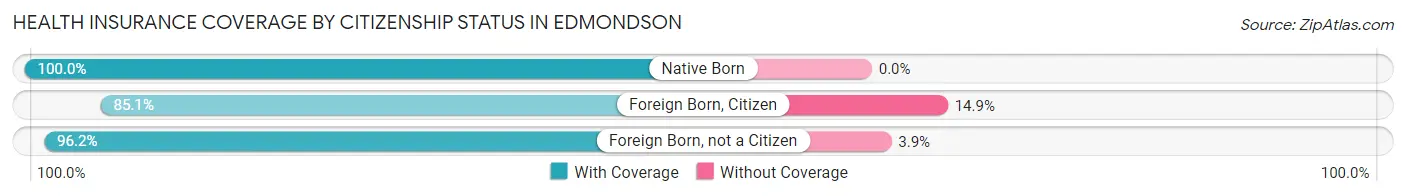
| Citizenship Status | With Coverage | Without Coverage |
| Native Born | 39 (100.0%) | 0 (0.0%) |
| Foreign Born, Citizen | 57 (85.1%) | 10 (14.9%) |
| Foreign Born, not a Citizen | 25 (96.2%) | 1 (3.8%) |
Health Insurance Coverage by Household Income in Edmondson
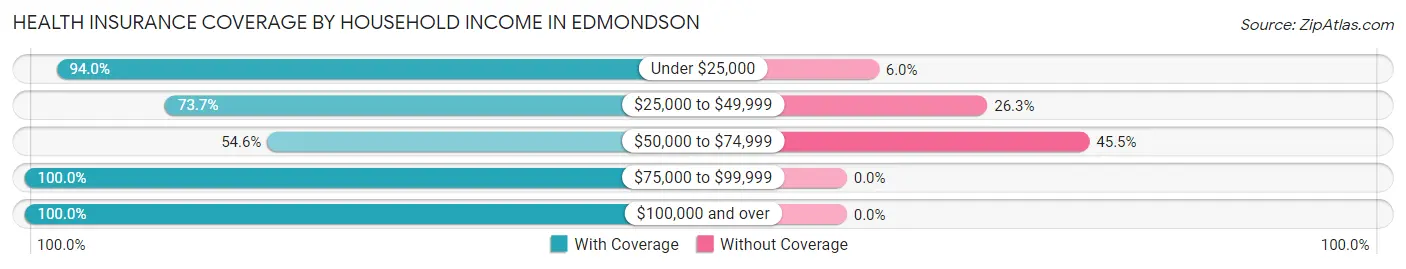
| Household Income | With Coverage | Without Coverage |
| Under $25,000 | 157 (94.0%) | 10 (6.0%) |
| $25,000 to $49,999 | 42 (73.7%) | 15 (26.3%) |
| $50,000 to $74,999 | 18 (54.5%) | 15 (45.5%) |
| $75,000 to $99,999 | 25 (100.0%) | 0 (0.0%) |
| $100,000 and over | 36 (100.0%) | 0 (0.0%) |
Public vs Private Health Insurance Coverage by Age in Edmondson
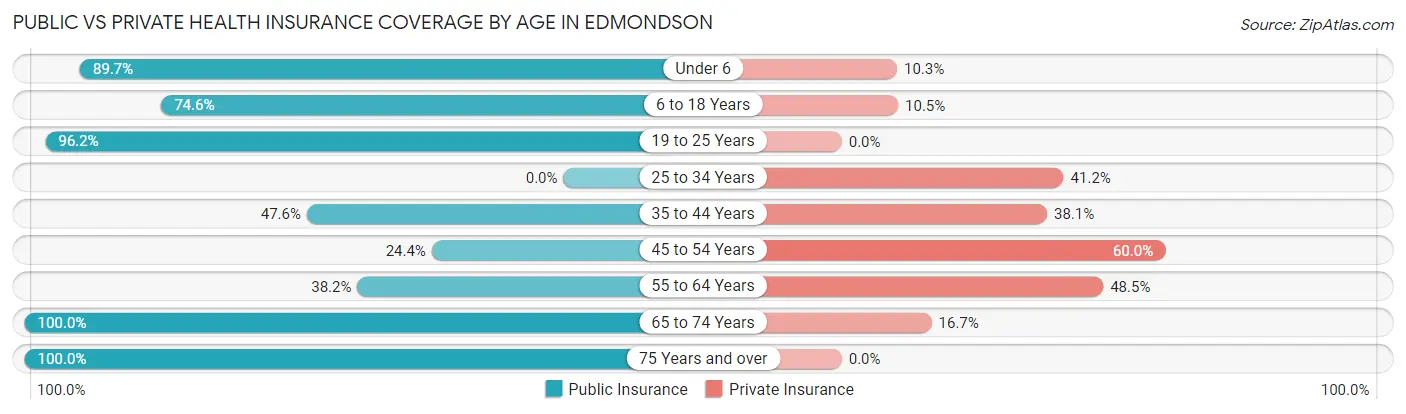
| Age Bracket | Public Insurance | Private Insurance |
| Under 6 | 35 (89.7%) | 4 (10.3%) |
| 6 to 18 Years | 50 (74.6%) | 7 (10.4%) |
| 19 to 25 Years | 25 (96.2%) | 0 (0.0%) |
| 25 to 34 Years | 0 (0.0%) | 7 (41.2%) |
| 35 to 44 Years | 10 (47.6%) | 8 (38.1%) |
| 45 to 54 Years | 11 (24.4%) | 27 (60.0%) |
| 55 to 64 Years | 26 (38.2%) | 33 (48.5%) |
| 65 to 74 Years | 6 (100.0%) | 1 (16.7%) |
| 75 Years and over | 29 (100.0%) | 0 (0.0%) |
| Total | 192 (60.4%) | 87 (27.4%) |
Disability Status by Sex by Age in Edmondson
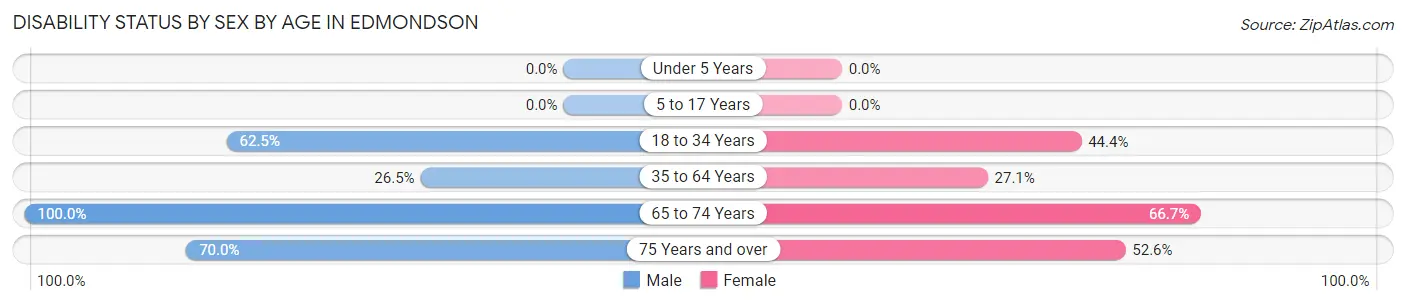
| Age Bracket | Male | Female |
| Under 5 Years | 0 (0.0%) | 0 (0.0%) |
| 5 to 17 Years | 0 (0.0%) | 0 (0.0%) |
| 18 to 34 Years | 10 (62.5%) | 12 (44.4%) |
| 35 to 64 Years | 13 (26.5%) | 23 (27.1%) |
| 65 to 74 Years | 3 (100.0%) | 2 (66.7%) |
| 75 Years and over | 7 (70.0%) | 10 (52.6%) |
Disability Class by Sex by Age in Edmondson
Disability Class: Hearing Difficulty
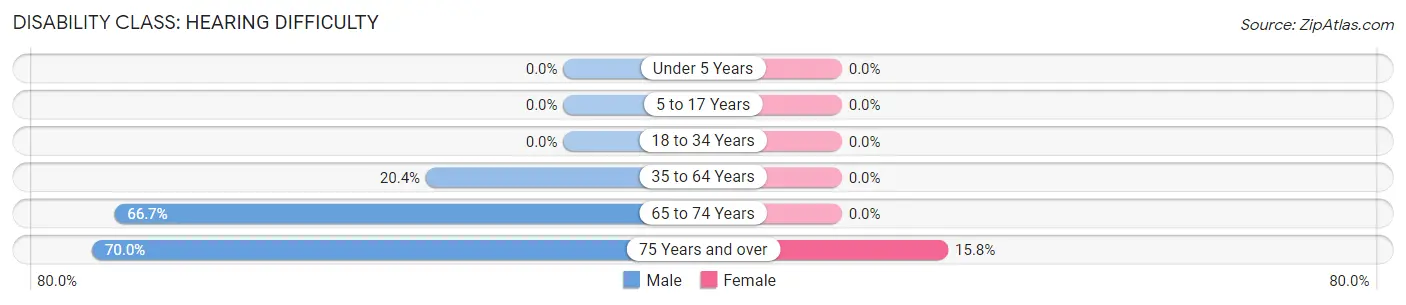
| Age Bracket | Male | Female |
| Under 5 Years | 0 (0.0%) | 0 (0.0%) |
| 5 to 17 Years | 0 (0.0%) | 0 (0.0%) |
| 18 to 34 Years | 0 (0.0%) | 0 (0.0%) |
| 35 to 64 Years | 10 (20.4%) | 0 (0.0%) |
| 65 to 74 Years | 2 (66.7%) | 0 (0.0%) |
| 75 Years and over | 7 (70.0%) | 3 (15.8%) |
Disability Class: Vision Difficulty
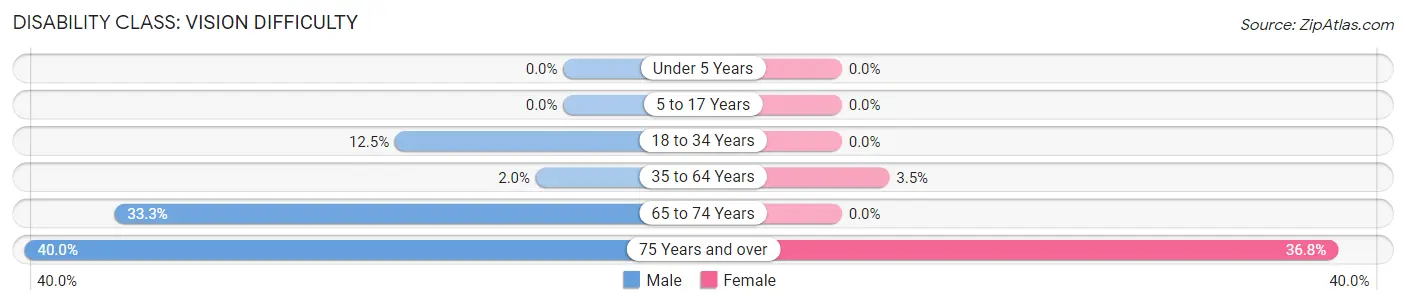
| Age Bracket | Male | Female |
| Under 5 Years | 0 (0.0%) | 0 (0.0%) |
| 5 to 17 Years | 0 (0.0%) | 0 (0.0%) |
| 18 to 34 Years | 2 (12.5%) | 0 (0.0%) |
| 35 to 64 Years | 1 (2.0%) | 3 (3.5%) |
| 65 to 74 Years | 1 (33.3%) | 0 (0.0%) |
| 75 Years and over | 4 (40.0%) | 7 (36.8%) |
Disability Class: Cognitive Difficulty
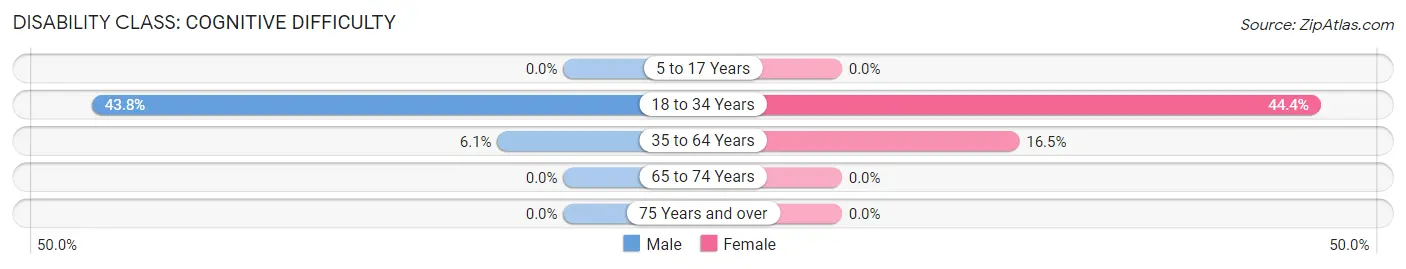
| Age Bracket | Male | Female |
| 5 to 17 Years | 0 (0.0%) | 0 (0.0%) |
| 18 to 34 Years | 7 (43.8%) | 12 (44.4%) |
| 35 to 64 Years | 3 (6.1%) | 14 (16.5%) |
| 65 to 74 Years | 0 (0.0%) | 0 (0.0%) |
| 75 Years and over | 0 (0.0%) | 0 (0.0%) |
Disability Class: Ambulatory Difficulty
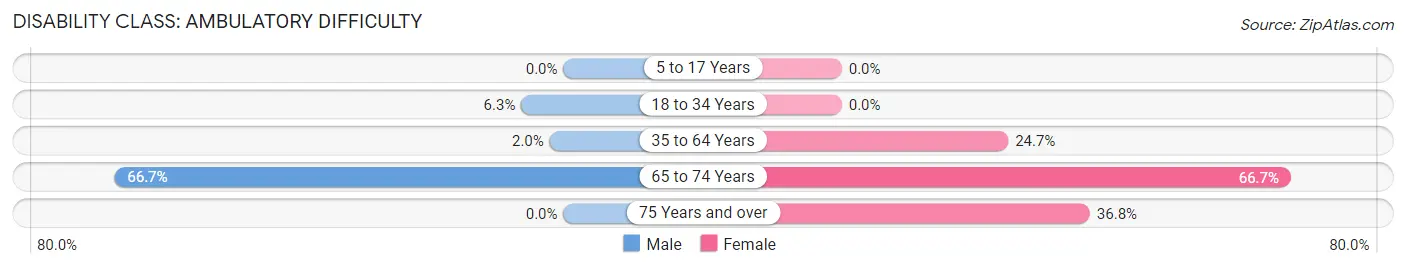
| Age Bracket | Male | Female |
| 5 to 17 Years | 0 (0.0%) | 0 (0.0%) |
| 18 to 34 Years | 1 (6.2%) | 0 (0.0%) |
| 35 to 64 Years | 1 (2.0%) | 21 (24.7%) |
| 65 to 74 Years | 2 (66.7%) | 2 (66.7%) |
| 75 Years and over | 0 (0.0%) | 7 (36.8%) |
Disability Class: Self-Care Difficulty

| Age Bracket | Male | Female |
| 5 to 17 Years | 0 (0.0%) | 0 (0.0%) |
| 18 to 34 Years | 0 (0.0%) | 0 (0.0%) |
| 35 to 64 Years | 3 (6.1%) | 15 (17.6%) |
| 65 to 74 Years | 2 (66.7%) | 0 (0.0%) |
| 75 Years and over | 0 (0.0%) | 0 (0.0%) |
Technology Access in Edmondson
Computing Device Access in Edmondson
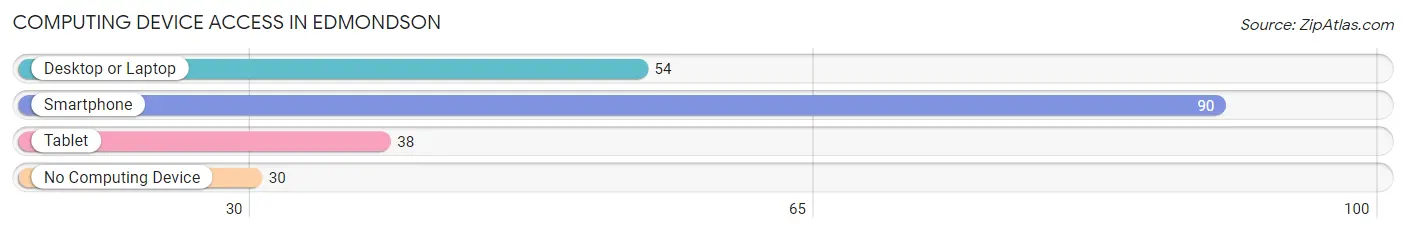
| Device Type | # Households | % Households |
| Desktop or Laptop | 54 | 42.9% |
| Smartphone | 90 | 71.4% |
| Tablet | 38 | 30.2% |
| No Computing Device | 30 | 23.8% |
| Total | 126 | 100.0% |
Internet Access in Edmondson
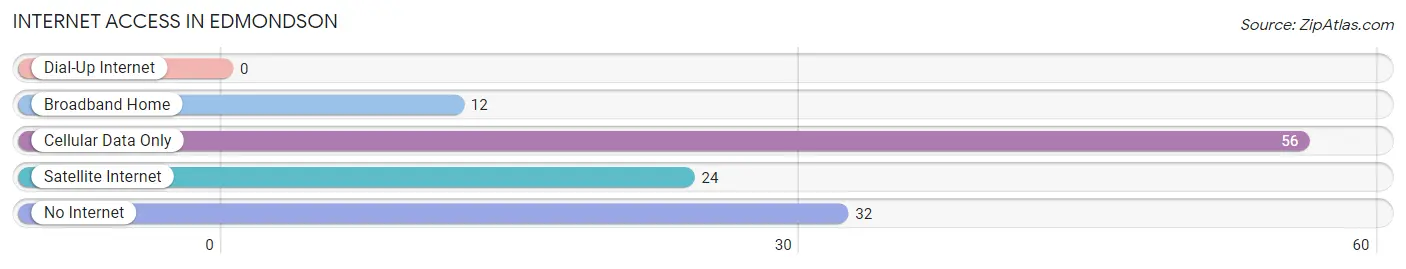
| Internet Type | # Households | % Households |
| Dial-Up Internet | 0 | 0.0% |
| Broadband Home | 12 | 9.5% |
| Cellular Data Only | 56 | 44.4% |
| Satellite Internet | 24 | 19.1% |
| No Internet | 32 | 25.4% |
| Total | 126 | 100.0% |
Edmondson Summary
Edmondson, Arkansas is a small town located in Clay County in the northeastern part of the state. It is situated on the banks of the Black River, and is home to a population of just over 500 people. The town was founded in 1883 and has a rich history of farming, logging, and other rural activities.
Geographically, Edmondson is located in the foothills of the Ozark Mountains. The town is surrounded by rolling hills and lush forests, and is home to a variety of wildlife. The Black River runs through the town, providing a source of recreation and fishing. The town is also home to several small lakes, which are popular for swimming and boating.
The economy of Edmondson is largely based on agriculture and forestry. The town is home to several farms, which produce a variety of crops, including corn, soybeans, and cotton. The town is also home to several sawmills, which provide lumber for the local economy. In addition, the town is home to several small businesses, including a grocery store, a hardware store, and a few restaurants.
Demographically, Edmondson is a predominantly white town, with a population that is approximately 95% white. The town is home to a small African American population, as well as a small Hispanic population. The median household income in Edmondson is approximately $30,000, and the median home value is around $90,000.
Edmondson is a small town with a rich history and a strong sense of community. The town is home to a variety of activities, including fishing, hunting, and camping. The town is also home to several churches, which provide a sense of community and fellowship. The town is also home to a variety of festivals and events, which bring the community together.
Overall, Edmondson is a small town with a rich history and a strong sense of community. The town is home to a variety of activities, and is a great place to live and raise a family. The town is also home to a variety of businesses, which provide a source of employment and economic stability. The town is also home to a variety of churches, which provide a sense of community and fellowship.
Common Questions
What is Per Capita Income in Edmondson?
Per Capita income in Edmondson is $19,359.
What is the Median Household income in Edmondson?
Median Household Income in Edmondson is $25,625.
What is Income or Wage Gap in Edmondson?
Income or Wage Gap in Edmondson is 43.3%.
Women in Edmondson earn 56.7 cents for every dollar earned by a man.
What is Inequality or Gini Index in Edmondson?
Inequality or Gini Index in Edmondson is 0.48.
What is the Total Population of Edmondson?
Total Population of Edmondson is 318.
What is the Total Male Population of Edmondson?
Total Male Population of Edmondson is 115.
What is the Total Female Population of Edmondson?
Total Female Population of Edmondson is 203.
What is the Ratio of Males per 100 Females in Edmondson?
There are 56.65 Males per 100 Females in Edmondson.
What is the Ratio of Females per 100 Males in Edmondson?
There are 176.52 Females per 100 Males in Edmondson.
What is the Median Population Age in Edmondson?
Median Population Age in Edmondson is 37.0 Years.
What is the Average Family Size in Edmondson
Average Family Size in Edmondson is 3.1 People.
What is the Average Household Size in Edmondson
Average Household Size in Edmondson is 2.5 People.
How Large is the Labor Force in Edmondson?
There are 114 People in the Labor Forcein in Edmondson.
What is the Percentage of People in the Labor Force in Edmondson?
52.8% of People are in the Labor Force in Edmondson.
What is the Unemployment Rate in Edmondson?
Unemployment Rate in Edmondson is 7.0%.