Prattsville, AR Map & Demographics
Prattsville Map
Prattsville Overview
$27,429
PER CAPITA INCOME
$81,250
AVG FAMILY INCOME
$44,205
AVG HOUSEHOLD INCOME
0.44
INEQUALITY / GINI INDEX
404
TOTAL POPULATION
263
MALE POPULATION
141
FEMALE POPULATION
186.52
MALES / 100 FEMALES
53.61
FEMALES / 100 MALES
45.4
MEDIAN AGE
3.8
AVG FAMILY SIZE
3.2
AVG HOUSEHOLD SIZE
168
LABOR FORCE [ PEOPLE ]
52.5%
PERCENT IN LABOR FORCE
10.7%
UNEMPLOYMENT RATE
Prattsville Zip Codes
Prattsville Area Codes
Income in Prattsville
Income Overview in Prattsville
Per Capita Income in Prattsville is $27,429, while median incomes of families and households are $81,250 and $44,205 respectively.
| Characteristic | Number | Measure |
| Per Capita Income | 404 | $27,429 |
| Median Family Income | 95 | $81,250 |
| Mean Family Income | 95 | $94,939 |
| Median Household Income | 126 | $44,205 |
| Mean Household Income | 126 | $80,032 |
| Income Deficit | 95 | $0 |
| Wage / Income Gap (%) | 404 | 0.00% |
| Wage / Income Gap ($) | 404 | 100.00¢ per $1 |
| Gini / Inequality Index | 404 | 0.44 |
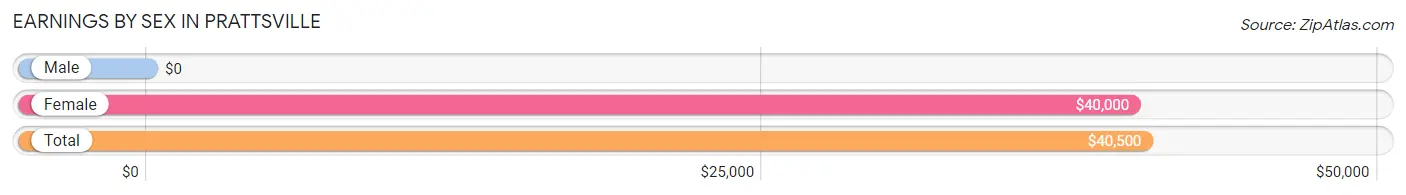
Earnings by Sex in Prattsville
| Sex | Number | Average Earnings |
| Male | 92 (59.0%) | $0 |
| Female | 64 (41.0%) | $40,000 |
| Total | 156 (100.0%) | $40,500 |
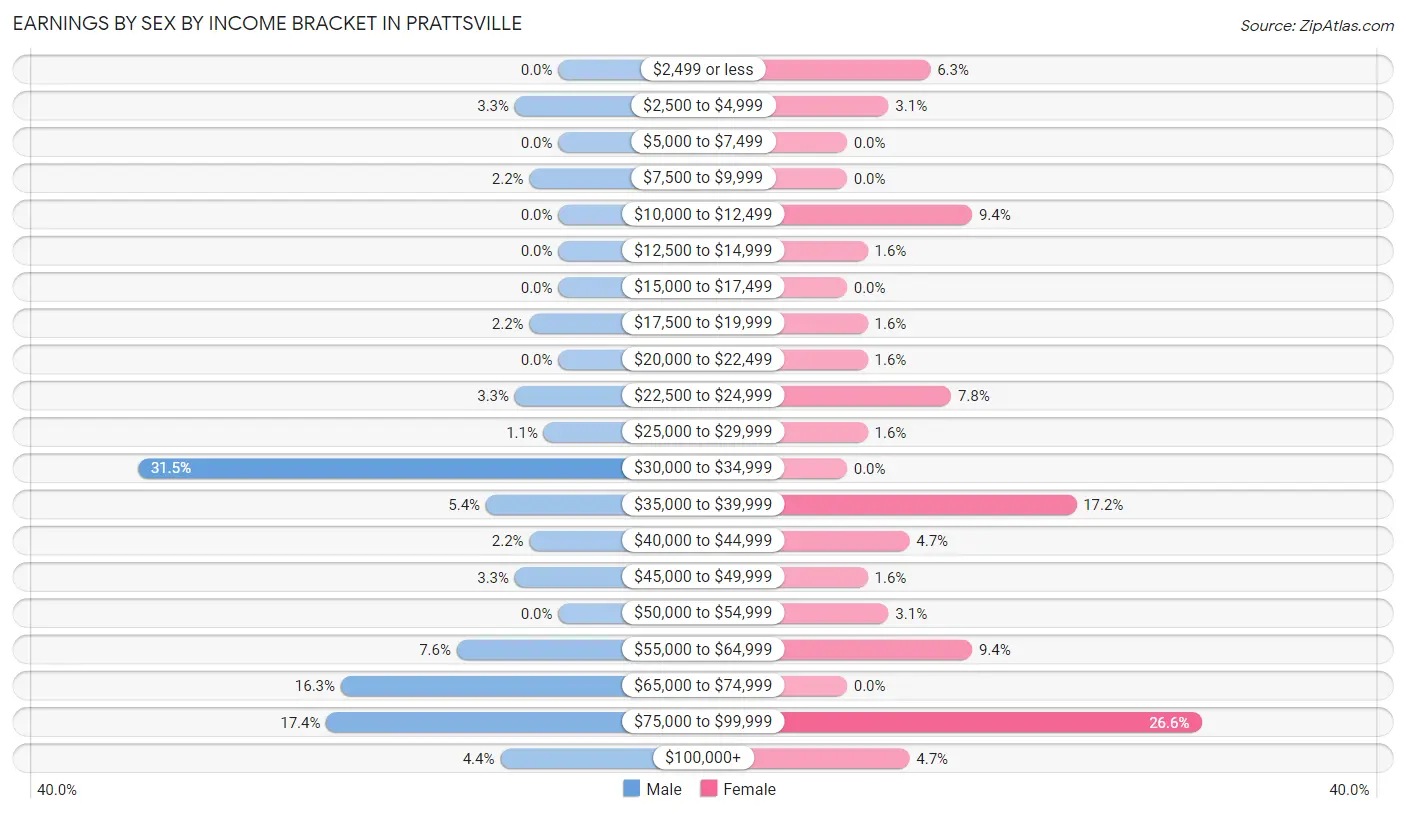
Earnings by Sex by Income Bracket in Prattsville
The most common earnings brackets in Prattsville are $30,000 to $34,999 for men (29 | 31.5%) and $75,000 to $99,999 for women (17 | 26.6%).
| Income | Male | Female |
| $2,499 or less | 0 (0.0%) | 4 (6.2%) |
| $2,500 to $4,999 | 3 (3.3%) | 2 (3.1%) |
| $5,000 to $7,499 | 0 (0.0%) | 0 (0.0%) |
| $7,500 to $9,999 | 2 (2.2%) | 0 (0.0%) |
| $10,000 to $12,499 | 0 (0.0%) | 6 (9.4%) |
| $12,500 to $14,999 | 0 (0.0%) | 1 (1.6%) |
| $15,000 to $17,499 | 0 (0.0%) | 0 (0.0%) |
| $17,500 to $19,999 | 2 (2.2%) | 1 (1.6%) |
| $20,000 to $22,499 | 0 (0.0%) | 1 (1.6%) |
| $22,500 to $24,999 | 3 (3.3%) | 5 (7.8%) |
| $25,000 to $29,999 | 1 (1.1%) | 1 (1.6%) |
| $30,000 to $34,999 | 29 (31.5%) | 0 (0.0%) |
| $35,000 to $39,999 | 5 (5.4%) | 11 (17.2%) |
| $40,000 to $44,999 | 2 (2.2%) | 3 (4.7%) |
| $45,000 to $49,999 | 3 (3.3%) | 1 (1.6%) |
| $50,000 to $54,999 | 0 (0.0%) | 2 (3.1%) |
| $55,000 to $64,999 | 7 (7.6%) | 6 (9.4%) |
| $65,000 to $74,999 | 15 (16.3%) | 0 (0.0%) |
| $75,000 to $99,999 | 16 (17.4%) | 17 (26.6%) |
| $100,000+ | 4 (4.3%) | 3 (4.7%) |
| Total | 92 (100.0%) | 64 (100.0%) |
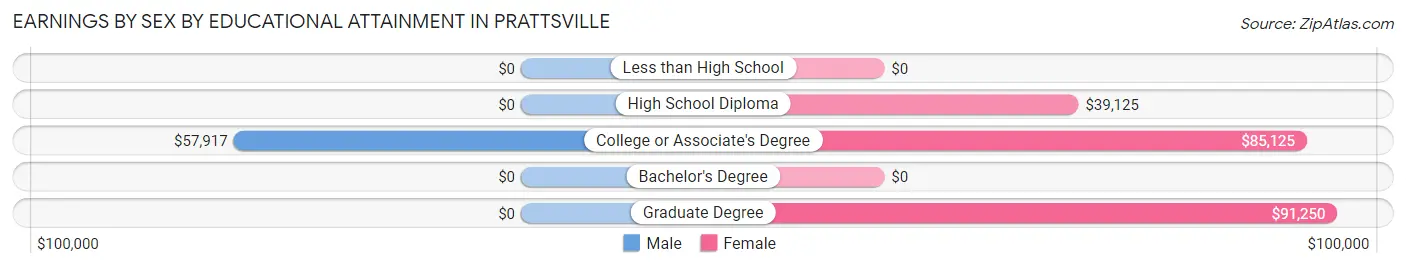
Earnings by Sex by Educational Attainment in Prattsville
Average earnings in Prattsville are $46,250 for men and $46,250 for women, a difference of 0.0%. Men with an educational attainment of college or associate's degree enjoy the highest average annual earnings of $57,917, while those with college or associate's degree education earn the least with $57,917. Women with an educational attainment of graduate degree earn the most with the average annual earnings of $91,250, while those with high school diploma education have the smallest earnings of $39,125.
| Educational Attainment | Male Income | Female Income |
| Less than High School | - | - |
| High School Diploma | - | - |
| College or Associate's Degree | $57,917 | $85,125 |
| Bachelor's Degree | - | - |
| Graduate Degree | - | - |
| Total | $46,250 | $46,250 |
Family Income in Prattsville
Family Income Brackets in Prattsville
According to the Prattsville family income data, there are 28 families falling into the $35,000 to $49,999 income range, which is the most common income bracket and makes up 29.5% of all families.
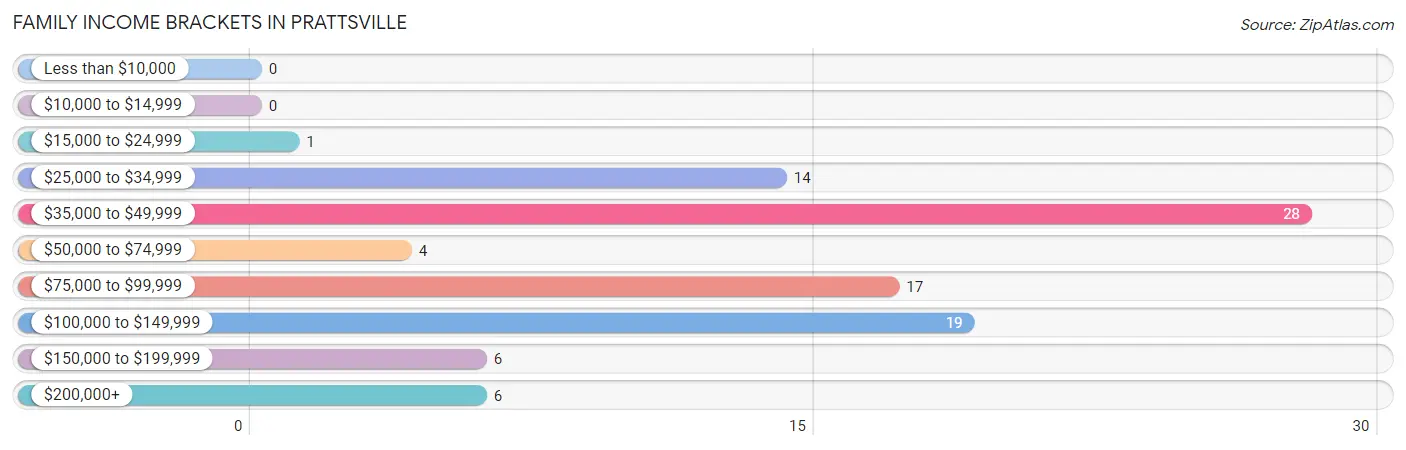
| Income Bracket | # Families | % Families |
| Less than $10,000 | 0 | 0.0% |
| $10,000 to $14,999 | 0 | 0.0% |
| $15,000 to $24,999 | 1 | 1.1% |
| $25,000 to $34,999 | 14 | 14.7% |
| $35,000 to $49,999 | 28 | 29.5% |
| $50,000 to $74,999 | 4 | 4.2% |
| $75,000 to $99,999 | 17 | 17.9% |
| $100,000 to $149,999 | 19 | 20.0% |
| $150,000 to $199,999 | 6 | 6.3% |
| $200,000+ | 6 | 6.3% |
Family Income by Famaliy Size in Prattsville
3-person families (12 | 12.6%) account for the highest median family income in Prattsville with $102,500 per family, while 2-person families (40 | 42.1%) have the highest median income of $42,625 per family member.
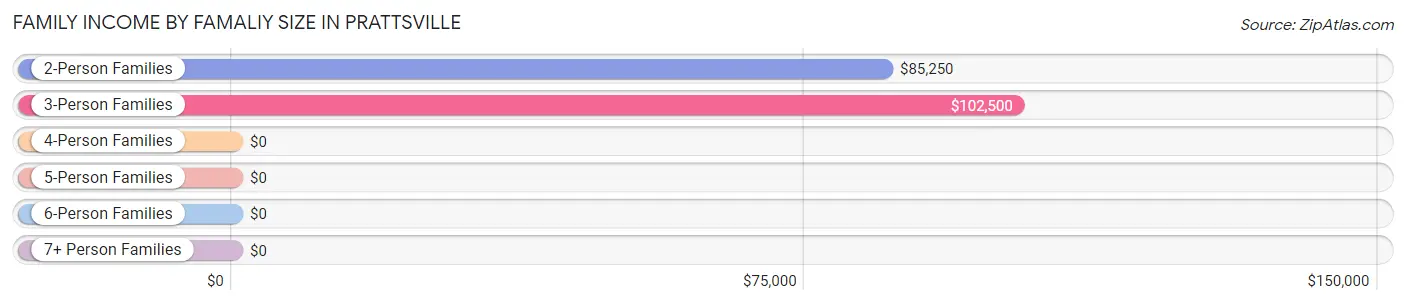
| Income Bracket | # Families | Median Income |
| 2-Person Families | 40 (42.1%) | $85,250 |
| 3-Person Families | 12 (12.6%) | $102,500 |
| 4-Person Families | 42 (44.2%) | $0 |
| 5-Person Families | 1 (1.1%) | $0 |
| 6-Person Families | 0 (0.0%) | $0 |
| 7+ Person Families | 0 (0.0%) | $0 |
| Total | 95 (100.0%) | $81,250 |
Family Income by Number of Earners in Prattsville
The median family income in Prattsville is $81,250, with families comprising 3+ earners (5) having the highest median family income of $161,250, while families with no earners (13) have the lowest median family income of $34,531, accounting for 5.3% and 13.7% of families, respectively.
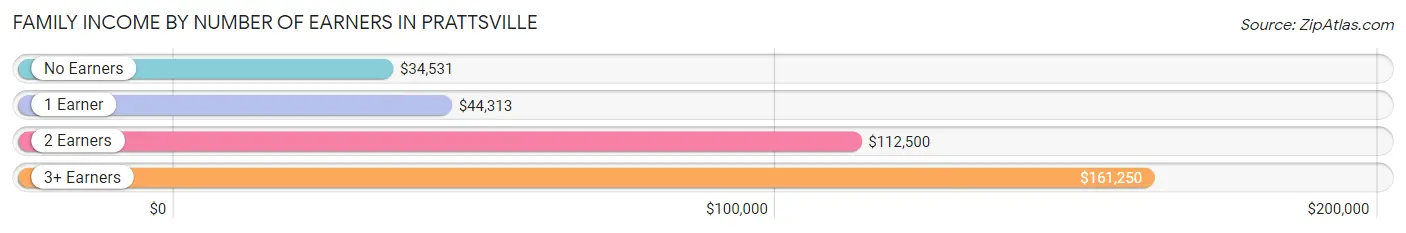
| Number of Earners | # Families | Median Income |
| No Earners | 13 (13.7%) | $34,531 |
| 1 Earner | 43 (45.3%) | $44,313 |
| 2 Earners | 34 (35.8%) | $112,500 |
| 3+ Earners | 5 (5.3%) | $161,250 |
| Total | 95 (100.0%) | $81,250 |
Household Income in Prattsville
Household Income Brackets in Prattsville
With 31 households falling in the category, the $25,000 to $34,999 income range is the most frequent in Prattsville, accounting for 24.6% of all households.
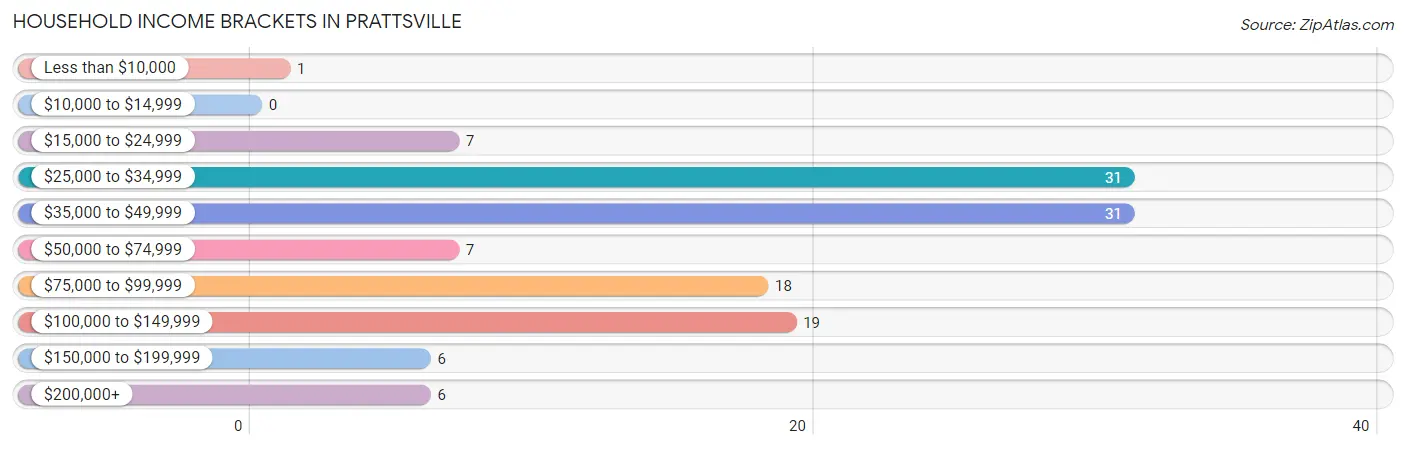
| Income Bracket | # Households | % Households |
| Less than $10,000 | 1 | 0.8% |
| $10,000 to $14,999 | 0 | 0.0% |
| $15,000 to $24,999 | 7 | 5.6% |
| $25,000 to $34,999 | 31 | 24.6% |
| $35,000 to $49,999 | 31 | 24.6% |
| $50,000 to $74,999 | 7 | 5.6% |
| $75,000 to $99,999 | 18 | 14.3% |
| $100,000 to $149,999 | 19 | 15.1% |
| $150,000 to $199,999 | 6 | 4.8% |
| $200,000+ | 6 | 4.8% |
Household Income by Householder Age in Prattsville
The median household income in Prattsville is $44,205, with the highest median household income of $32,500 found in the 65+ years age bracket for the primary householder. A total of 36 households (28.6%) fall into this category. Meanwhile, the 15 to 24 years age bracket for the primary householder has the lowest median household income of $0, with 5 households (4.0%) in this group.
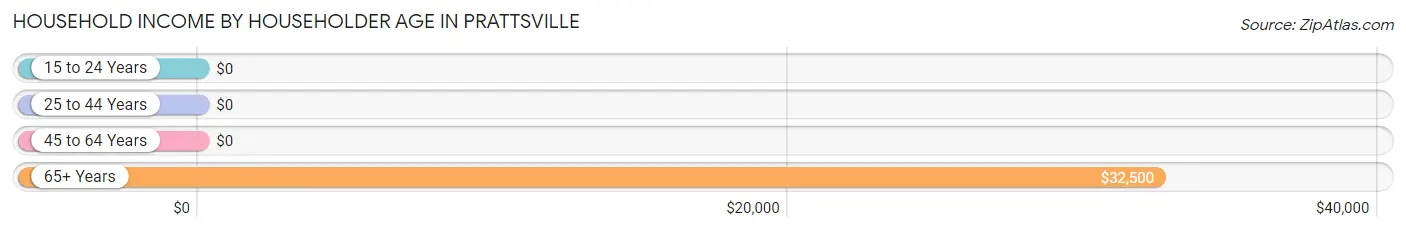
| Income Bracket | # Households | Median Income |
| 15 to 24 Years | 5 (4.0%) | $0 |
| 25 to 44 Years | 13 (10.3%) | $0 |
| 45 to 64 Years | 72 (57.1%) | $0 |
| 65+ Years | 36 (28.6%) | $32,500 |
| Total | 126 (100.0%) | $44,205 |
Poverty in Prattsville
Income Below Poverty by Sex and Age in Prattsville
With 2.3% poverty level for males and 2.8% for females among the residents of Prattsville, under 5 year old males and 16 and 17 year old females are the most vulnerable to poverty, with 1 males (25.0%) and 2 females (100.0%) in their respective age groups living below the poverty level.
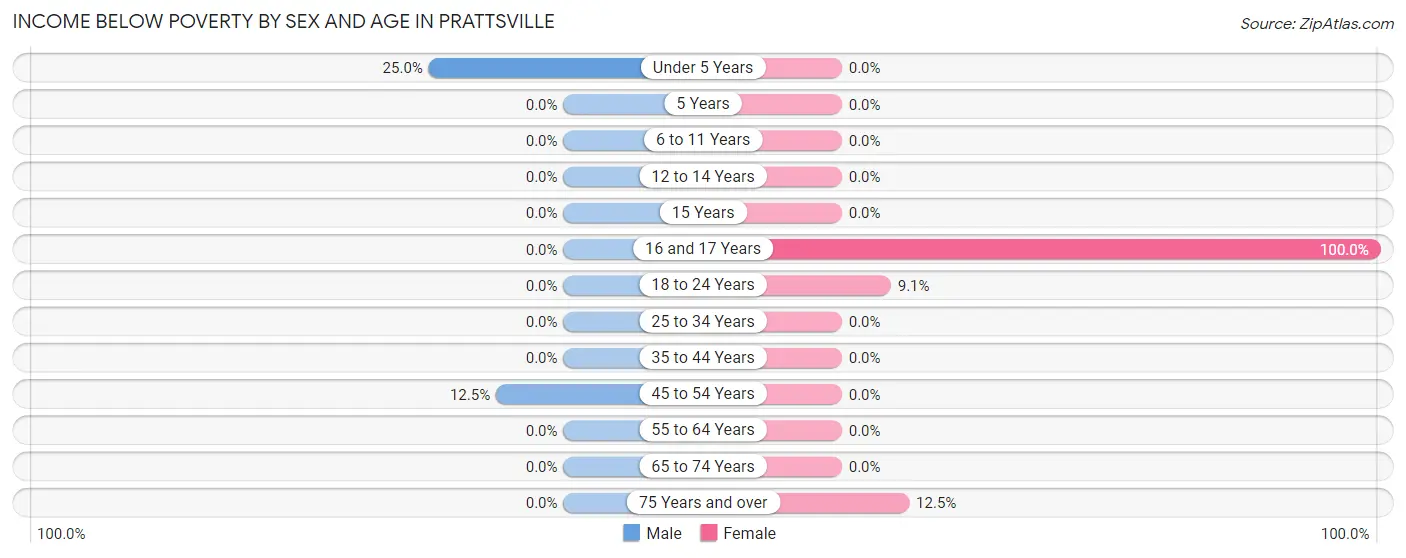
| Age Bracket | Male | Female |
| Under 5 Years | 1 (25.0%) | 0 (0.0%) |
| 5 Years | 0 (0.0%) | 0 (0.0%) |
| 6 to 11 Years | 0 (0.0%) | 0 (0.0%) |
| 12 to 14 Years | 0 (0.0%) | 0 (0.0%) |
| 15 Years | 0 (0.0%) | 0 (0.0%) |
| 16 and 17 Years | 0 (0.0%) | 2 (100.0%) |
| 18 to 24 Years | 0 (0.0%) | 1 (9.1%) |
| 25 to 34 Years | 0 (0.0%) | 0 (0.0%) |
| 35 to 44 Years | 0 (0.0%) | 0 (0.0%) |
| 45 to 54 Years | 5 (12.5%) | 0 (0.0%) |
| 55 to 64 Years | 0 (0.0%) | 0 (0.0%) |
| 65 to 74 Years | 0 (0.0%) | 0 (0.0%) |
| 75 Years and over | 0 (0.0%) | 1 (12.5%) |
| Total | 6 (2.3%) | 4 (2.8%) |
Income Above Poverty by Sex and Age in Prattsville
According to the poverty statistics in Prattsville, males aged 6 to 11 years and females aged under 5 years are the age groups that are most secure financially, with 100.0% of males and 100.0% of females in these age groups living above the poverty line.
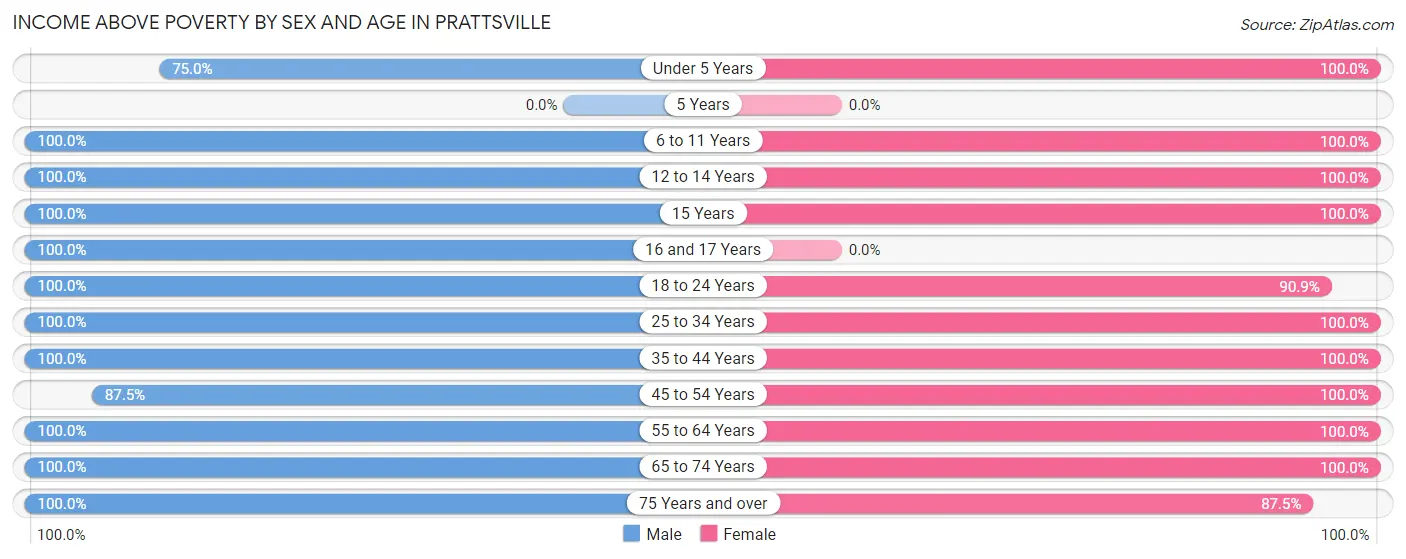
| Age Bracket | Male | Female |
| Under 5 Years | 3 (75.0%) | 3 (100.0%) |
| 5 Years | 0 (0.0%) | 0 (0.0%) |
| 6 to 11 Years | 3 (100.0%) | 3 (100.0%) |
| 12 to 14 Years | 61 (100.0%) | 2 (100.0%) |
| 15 Years | 6 (100.0%) | 2 (100.0%) |
| 16 and 17 Years | 14 (100.0%) | 0 (0.0%) |
| 18 to 24 Years | 13 (100.0%) | 10 (90.9%) |
| 25 to 34 Years | 40 (100.0%) | 16 (100.0%) |
| 35 to 44 Years | 10 (100.0%) | 7 (100.0%) |
| 45 to 54 Years | 35 (87.5%) | 25 (100.0%) |
| 55 to 64 Years | 52 (100.0%) | 38 (100.0%) |
| 65 to 74 Years | 9 (100.0%) | 24 (100.0%) |
| 75 Years and over | 11 (100.0%) | 7 (87.5%) |
| Total | 257 (97.7%) | 137 (97.2%) |
Income Below Poverty Among Married-Couple Families in Prattsville
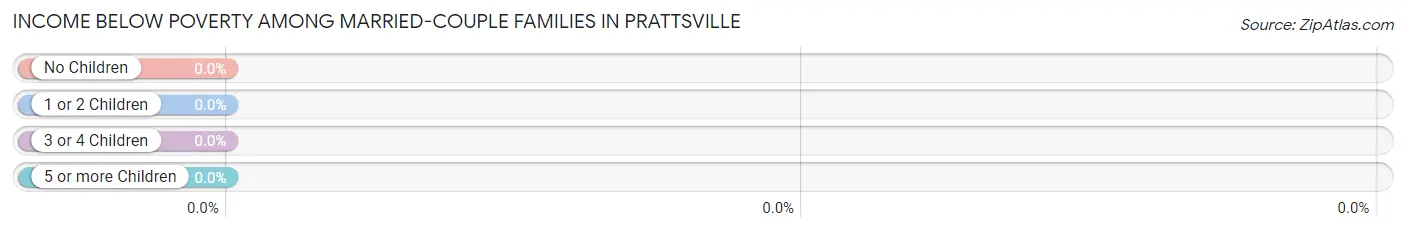
| Children | Above Poverty | Below Poverty |
| No Children | 44 (100.0%) | 0 (0.0%) |
| 1 or 2 Children | 34 (100.0%) | 0 (0.0%) |
| 3 or 4 Children | 0 (0.0%) | 0 (0.0%) |
| 5 or more Children | 0 (0.0%) | 0 (0.0%) |
| Total | 78 (100.0%) | 0 (0.0%) |
Income Below Poverty Among Single-Parent Households in Prattsville
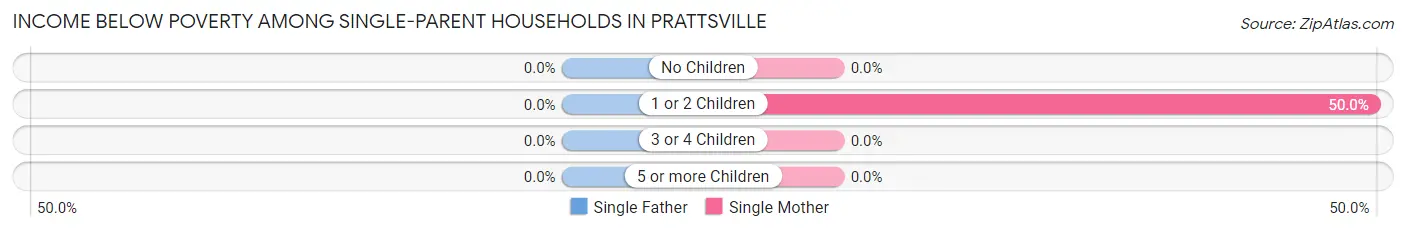
| Children | Single Father | Single Mother |
| No Children | 0 (0.0%) | 0 (0.0%) |
| 1 or 2 Children | 0 (0.0%) | 1 (50.0%) |
| 3 or 4 Children | 0 (0.0%) | 0 (0.0%) |
| 5 or more Children | 0 (0.0%) | 0 (0.0%) |
| Total | 0 (0.0%) | 1 (5.9%) |
Income Below Poverty Among Married-Couple vs Single-Parent Households in Prattsville
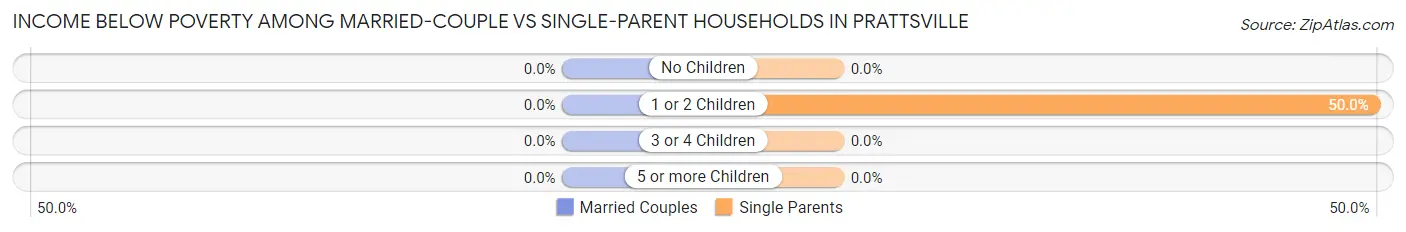
| Children | Married-Couple Families | Single-Parent Households |
| No Children | 0 (0.0%) | 0 (0.0%) |
| 1 or 2 Children | 0 (0.0%) | 1 (50.0%) |
| 3 or 4 Children | 0 (0.0%) | 0 (0.0%) |
| 5 or more Children | 0 (0.0%) | 0 (0.0%) |
| Total | 0 (0.0%) | 1 (5.9%) |
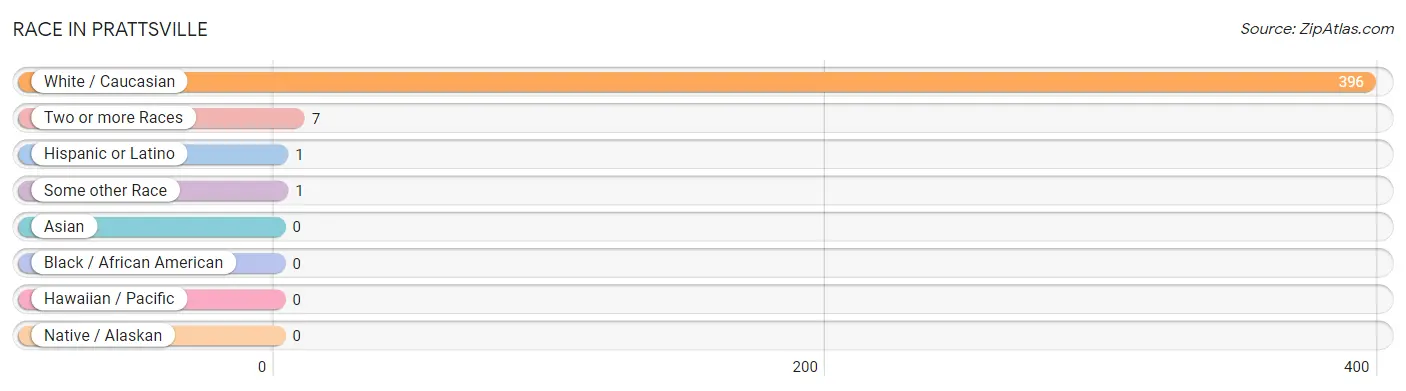
Race in Prattsville
The most populous races in Prattsville are White / Caucasian (396 | 98.0%), Two or more Races (7 | 1.7%), and Hispanic or Latino (1 | 0.3%).
| Race | # Population | % Population |
| Asian | 0 | 0.0% |
| Black / African American | 0 | 0.0% |
| Hawaiian / Pacific | 0 | 0.0% |
| Hispanic or Latino | 1 | 0.3% |
| Native / Alaskan | 0 | 0.0% |
| White / Caucasian | 396 | 98.0% |
| Two or more Races | 7 | 1.7% |
| Some other Race | 1 | 0.3% |
| Total | 404 | 100.0% |
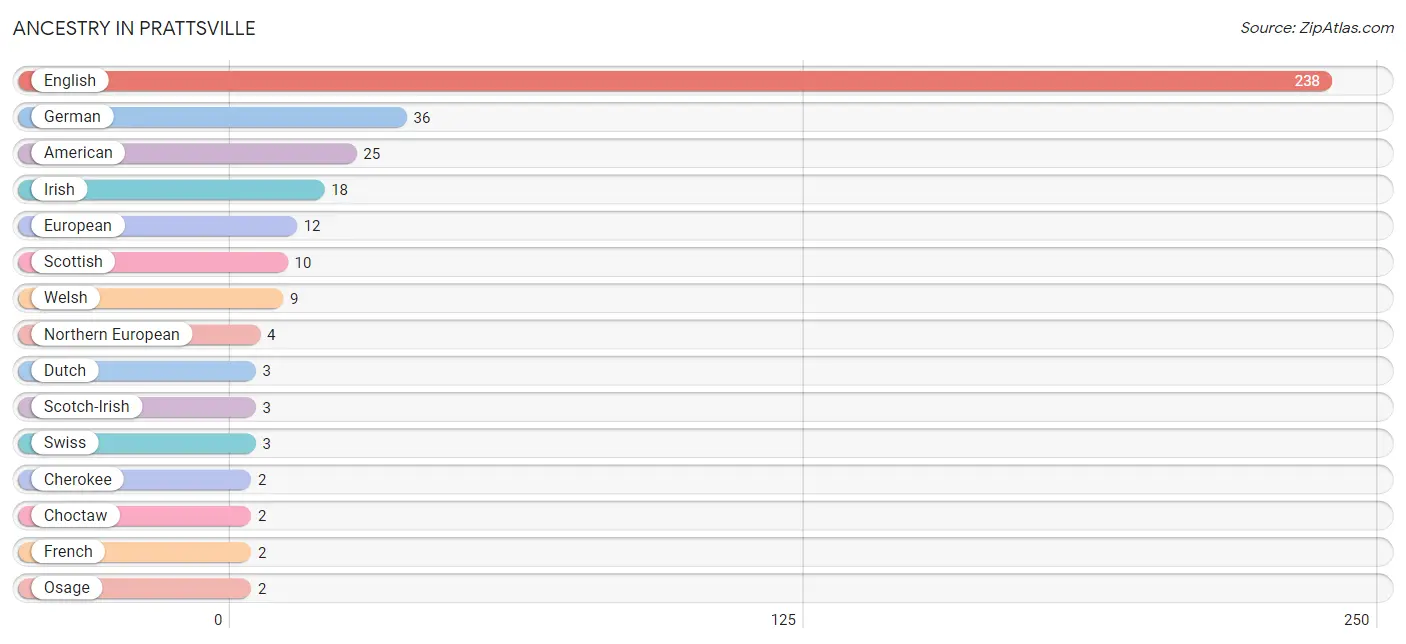
Ancestry in Prattsville
The most populous ancestries reported in Prattsville are English (238 | 58.9%), German (36 | 8.9%), American (25 | 6.2%), Irish (18 | 4.5%), and European (12 | 3.0%), together accounting for 81.4% of all Prattsville residents.
| Ancestry | # Population | % Population |
| American | 25 | 6.2% |
| Cherokee | 2 | 0.5% |
| Choctaw | 2 | 0.5% |
| Dutch | 3 | 0.7% |
| English | 238 | 58.9% |
| European | 12 | 3.0% |
| French | 2 | 0.5% |
| French Canadian | 1 | 0.3% |
| German | 36 | 8.9% |
| Irish | 18 | 4.5% |
| Mexican | 1 | 0.3% |
| Northern European | 4 | 1.0% |
| Osage | 2 | 0.5% |
| Scotch-Irish | 3 | 0.7% |
| Scottish | 10 | 2.5% |
| Slovak | 1 | 0.3% |
| Swiss | 3 | 0.7% |
| Welsh | 9 | 2.2% | View All 18 Rows |
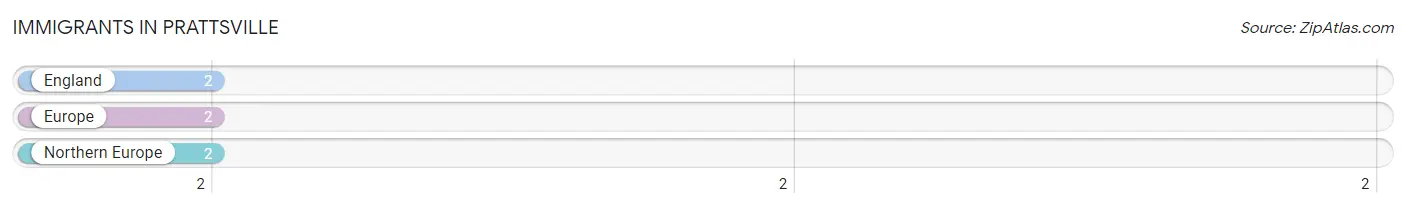
Immigrants in Prattsville
The most numerous immigrant groups reported in Prattsville came from England (2 | 0.5%), Europe (2 | 0.5%), and Northern Europe (2 | 0.5%), together accounting for 1.5% of all Prattsville residents.
| Immigration Origin | # Population | % Population |
| England | 2 | 0.5% |
| Europe | 2 | 0.5% |
| Northern Europe | 2 | 0.5% | View All 3 Rows |
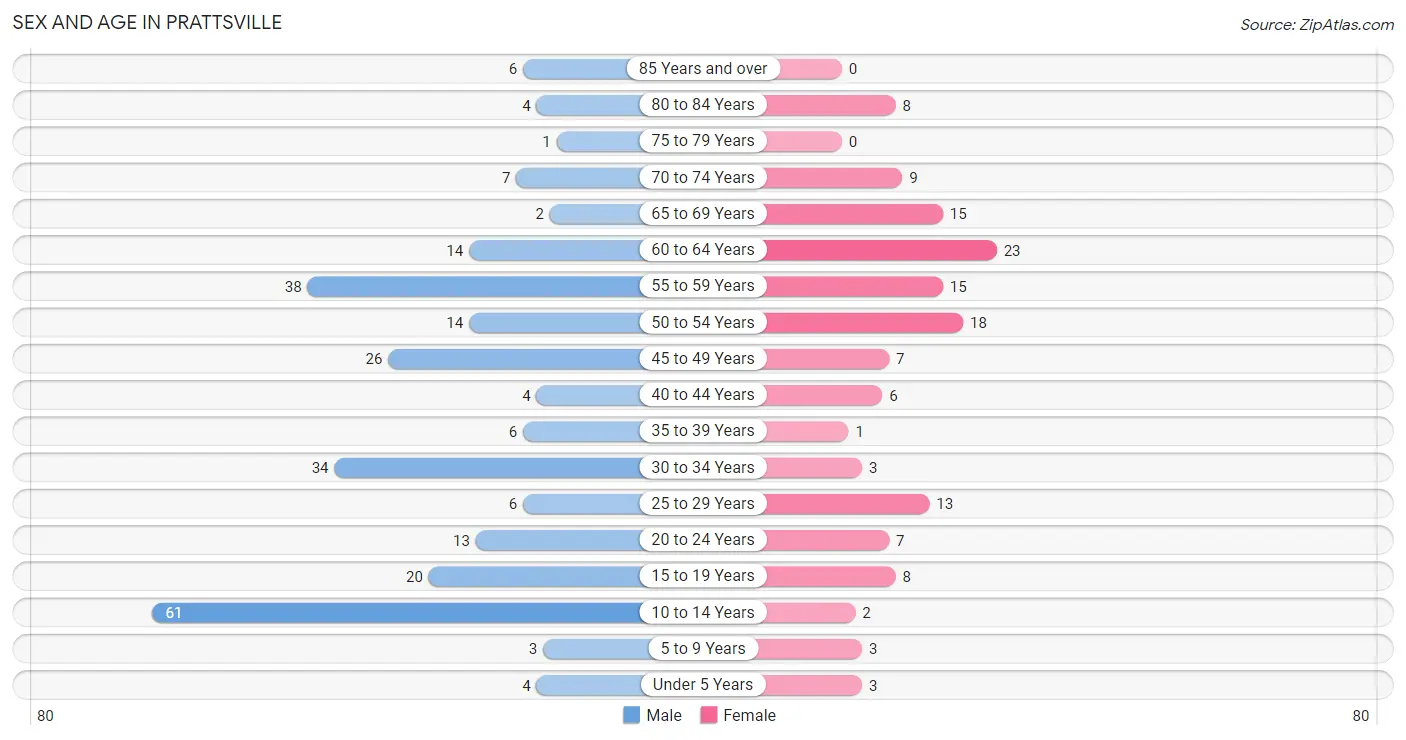
Sex and Age in Prattsville
Sex and Age in Prattsville
The most populous age groups in Prattsville are 10 to 14 Years (61 | 23.2%) for men and 60 to 64 Years (23 | 16.3%) for women.
| Age Bracket | Male | Female |
| Under 5 Years | 4 (1.5%) | 3 (2.1%) |
| 5 to 9 Years | 3 (1.1%) | 3 (2.1%) |
| 10 to 14 Years | 61 (23.2%) | 2 (1.4%) |
| 15 to 19 Years | 20 (7.6%) | 8 (5.7%) |
| 20 to 24 Years | 13 (4.9%) | 7 (5.0%) |
| 25 to 29 Years | 6 (2.3%) | 13 (9.2%) |
| 30 to 34 Years | 34 (12.9%) | 3 (2.1%) |
| 35 to 39 Years | 6 (2.3%) | 1 (0.7%) |
| 40 to 44 Years | 4 (1.5%) | 6 (4.3%) |
| 45 to 49 Years | 26 (9.9%) | 7 (5.0%) |
| 50 to 54 Years | 14 (5.3%) | 18 (12.8%) |
| 55 to 59 Years | 38 (14.4%) | 15 (10.6%) |
| 60 to 64 Years | 14 (5.3%) | 23 (16.3%) |
| 65 to 69 Years | 2 (0.8%) | 15 (10.6%) |
| 70 to 74 Years | 7 (2.7%) | 9 (6.4%) |
| 75 to 79 Years | 1 (0.4%) | 0 (0.0%) |
| 80 to 84 Years | 4 (1.5%) | 8 (5.7%) |
| 85 Years and over | 6 (2.3%) | 0 (0.0%) |
| Total | 263 (100.0%) | 141 (100.0%) |
Families and Households in Prattsville
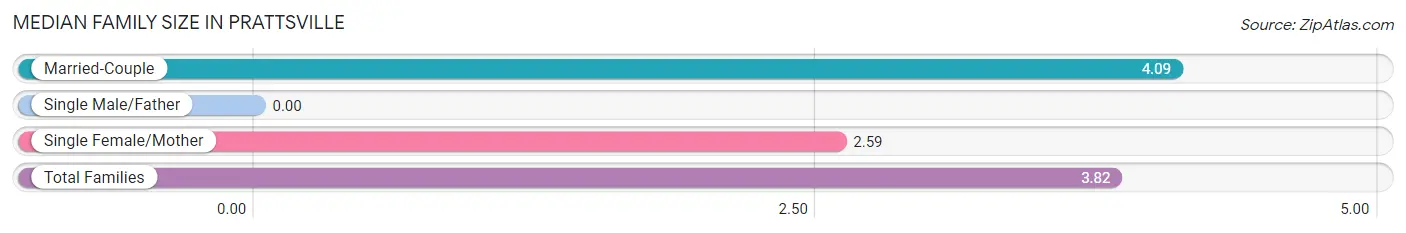
Median Family Size in Prattsville
| Family Type | # Families | Family Size |
| Married-Couple | 78 (82.1%) | 4.09 |
| Single Male/Father | 0 (0.0%) | - |
| Single Female/Mother | 17 (17.9%) | 2.59 |
| Total Families | 95 (100.0%) | 3.82 |
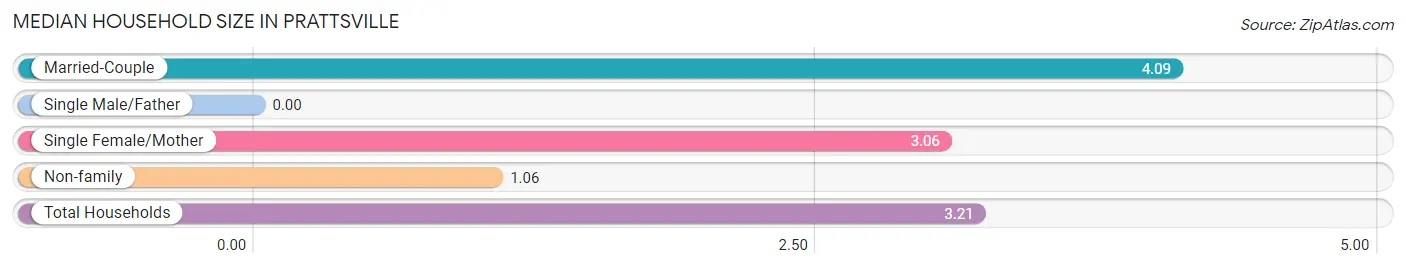
Median Household Size in Prattsville
| Household Type | # Households | Household Size |
| Married-Couple | 78 (61.9%) | 4.09 |
| Single Male/Father | 0 (0.0%) | - |
| Single Female/Mother | 17 (13.5%) | 3.06 |
| Non-family | 31 (24.6%) | 1.06 |
| Total Households | 126 (100.0%) | 3.21 |
Household Size by Marriage Status in Prattsville
Out of a total of 126 households in Prattsville, 95 (75.4%) are family households, while 31 (24.6%) are nonfamily households. The most numerous type of family households are 4-person households, comprising 39, and the most common type of nonfamily households are 1-person households, comprising 29.
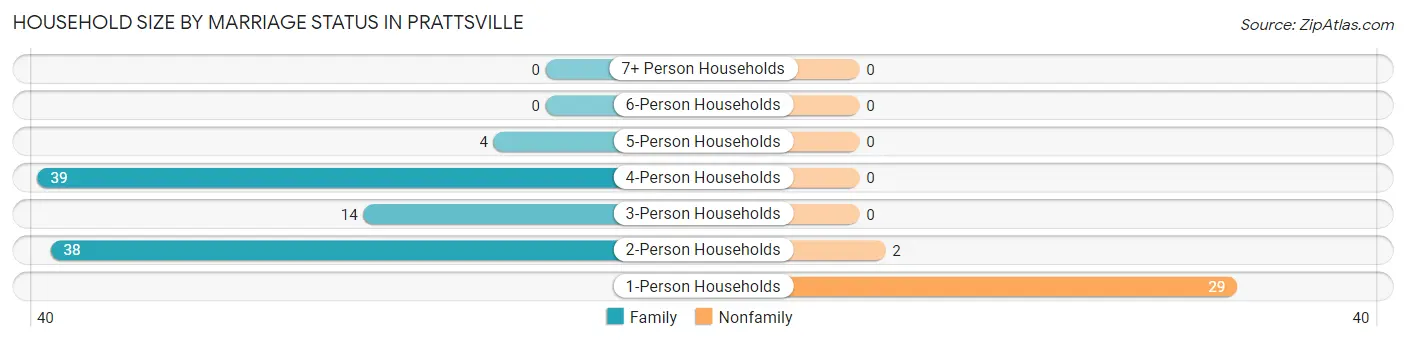
| Household Size | Family Households | Nonfamily Households |
| 1-Person Households | - | 29 (23.0%) |
| 2-Person Households | 38 (30.2%) | 2 (1.6%) |
| 3-Person Households | 14 (11.1%) | 0 (0.0%) |
| 4-Person Households | 39 (30.9%) | 0 (0.0%) |
| 5-Person Households | 4 (3.2%) | 0 (0.0%) |
| 6-Person Households | 0 (0.0%) | 0 (0.0%) |
| 7+ Person Households | 0 (0.0%) | 0 (0.0%) |
| Total | 95 (75.4%) | 31 (24.6%) |
Female Fertility in Prattsville
Fertility by Age in Prattsville
Average fertility rate in Prattsville is 44.0 births per 1,000 women. Women in the age bracket of 20 to 34 years have the highest fertility rate with 87.0 births per 1,000 women. Women in the age bracket of 20 to 34 years acount for 100.0% of all women with births.
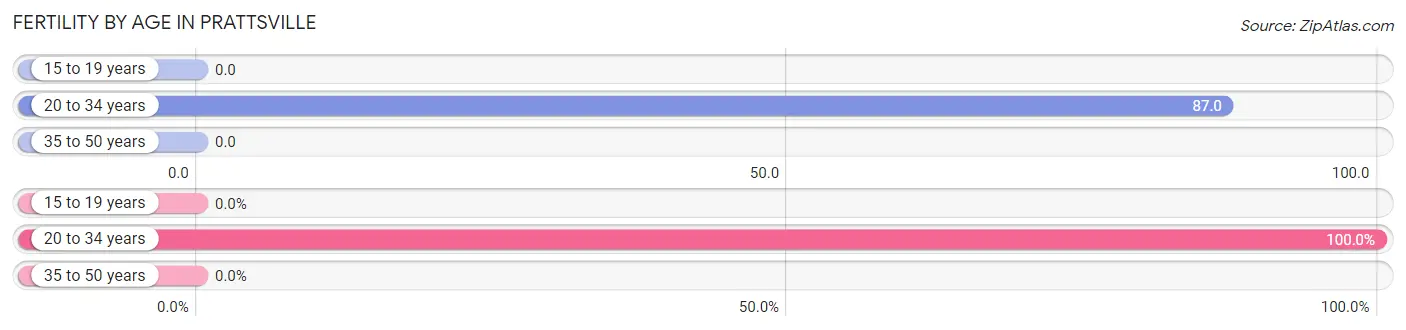
| Age Bracket | Women with Births | Births / 1,000 Women |
| 15 to 19 years | 0 (0.0%) | 0.0 |
| 20 to 34 years | 2 (100.0%) | 87.0 |
| 35 to 50 years | 0 (0.0%) | 0.0 |
| Total | 2 (100.0%) | 44.0 |
Fertility by Age by Marriage Status in Prattsville
50.0% of women with births (2) in Prattsville are married. The highest percentage of unmarried women with births falls into 20 to 34 years age bracket with 50.0% of them unmarried at the time of birth, while the lowest percentage of unmarried women with births belong to 20 to 34 years age bracket with 50.0% of them unmarried.
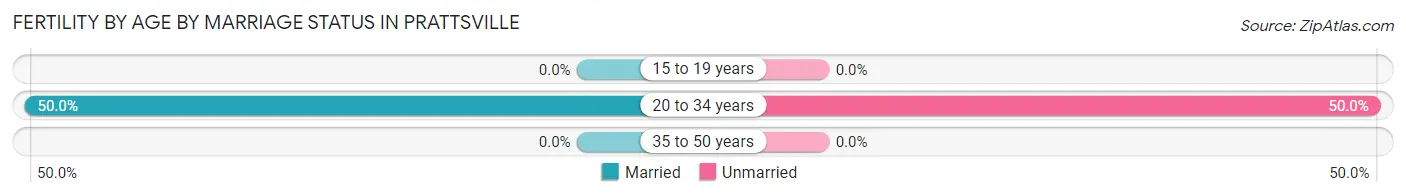
| Age Bracket | Married | Unmarried |
| 15 to 19 years | 0 (0.0%) | 0 (0.0%) |
| 20 to 34 years | 1 (50.0%) | 1 (50.0%) |
| 35 to 50 years | 0 (0.0%) | 0 (0.0%) |
| Total | 1 (50.0%) | 1 (50.0%) |
Fertility by Education in Prattsville
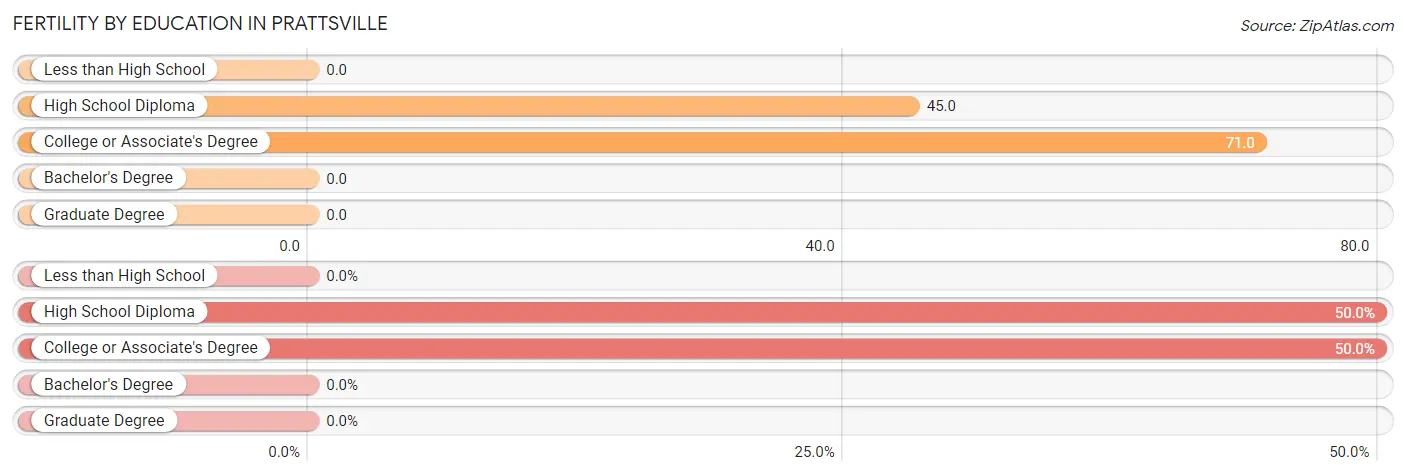
| Educational Attainment | Women with Births | Births / 1,000 Women |
| Less than High School | 0 (0.0%) | 0.0 |
| High School Diploma | 1 (50.0%) | 45.0 |
| College or Associate's Degree | 1 (50.0%) | 71.0 |
| Bachelor's Degree | 0 (0.0%) | 0.0 |
| Graduate Degree | 0 (0.0%) | 0.0 |
| Total | 2 (100.0%) | 44.0 |
Fertility by Education by Marriage Status in Prattsville
50.0% of women with births in Prattsville are unmarried. Women with the educational attainment of college or associate's degree are most likely to be married with 100.0% of them married at childbirth, while women with the educational attainment of high school diploma are least likely to be married with 100.0% of them unmarried at childbirth.
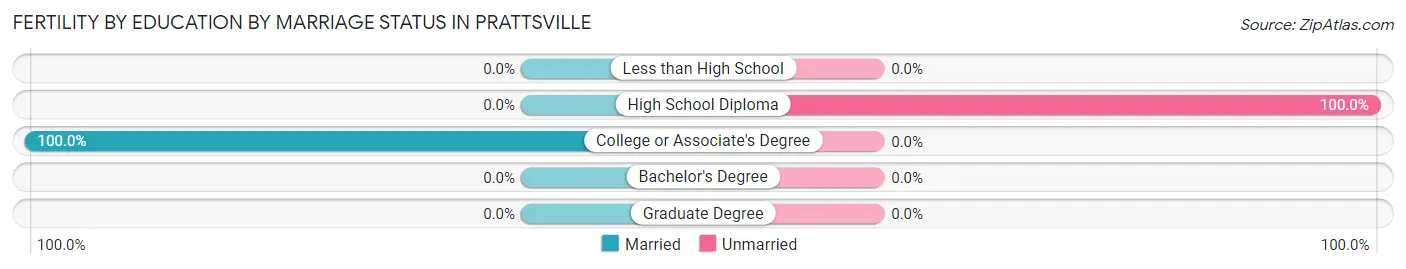
| Educational Attainment | Married | Unmarried |
| Less than High School | 0 (0.0%) | 0 (0.0%) |
| High School Diploma | 0 (0.0%) | 1 (100.0%) |
| College or Associate's Degree | 1 (100.0%) | 0 (0.0%) |
| Bachelor's Degree | 0 (0.0%) | 0 (0.0%) |
| Graduate Degree | 0 (0.0%) | 0 (0.0%) |
| Total | 1 (50.0%) | 1 (50.0%) |
Employment Characteristics in Prattsville
Employment by Class of Employer in Prattsville
Among the 148 employed individuals in Prattsville, private company employees (102 | 68.9%), self-employed (not incorporated) (26 | 17.6%), and local government employees (8 | 5.4%) make up the most common classes of employment.
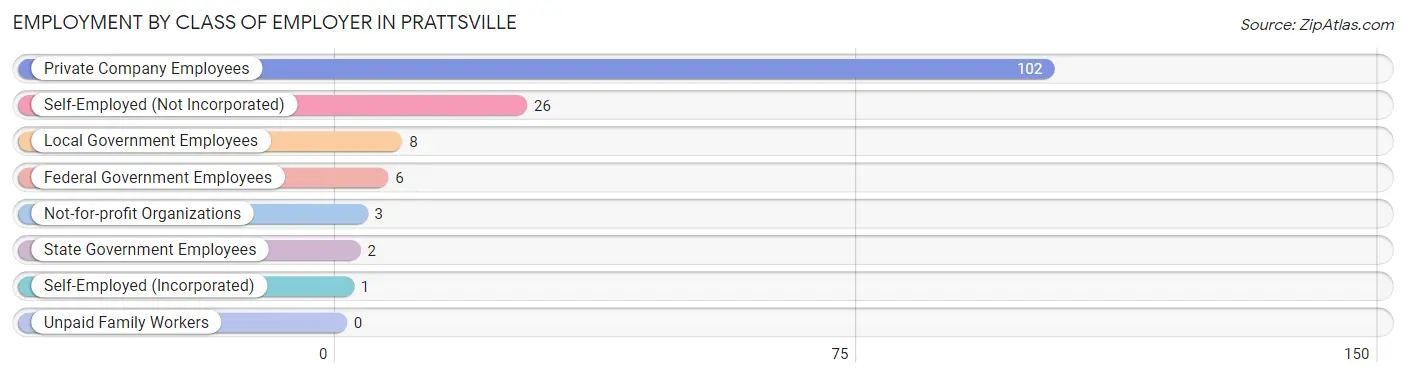
| Employer Class | # Employees | % Employees |
| Private Company Employees | 102 | 68.9% |
| Self-Employed (Incorporated) | 1 | 0.7% |
| Self-Employed (Not Incorporated) | 26 | 17.6% |
| Not-for-profit Organizations | 3 | 2.0% |
| Local Government Employees | 8 | 5.4% |
| State Government Employees | 2 | 1.3% |
| Federal Government Employees | 6 | 4.1% |
| Unpaid Family Workers | 0 | 0.0% |
| Total | 148 | 100.0% |
Employment Status by Age in Prattsville
According to the labor force statistics for Prattsville, out of the total population over 16 years of age (320), 52.5% or 168 individuals are in the labor force, with 10.7% or 18 of them unemployed. The age group with the highest labor force participation rate is 45 to 54 years, with 81.5% or 53 individuals in the labor force. Within the labor force, the 20 to 24 years age range has the highest percentage of unemployed individuals, with 33.3% or 4 of them being unemployed.
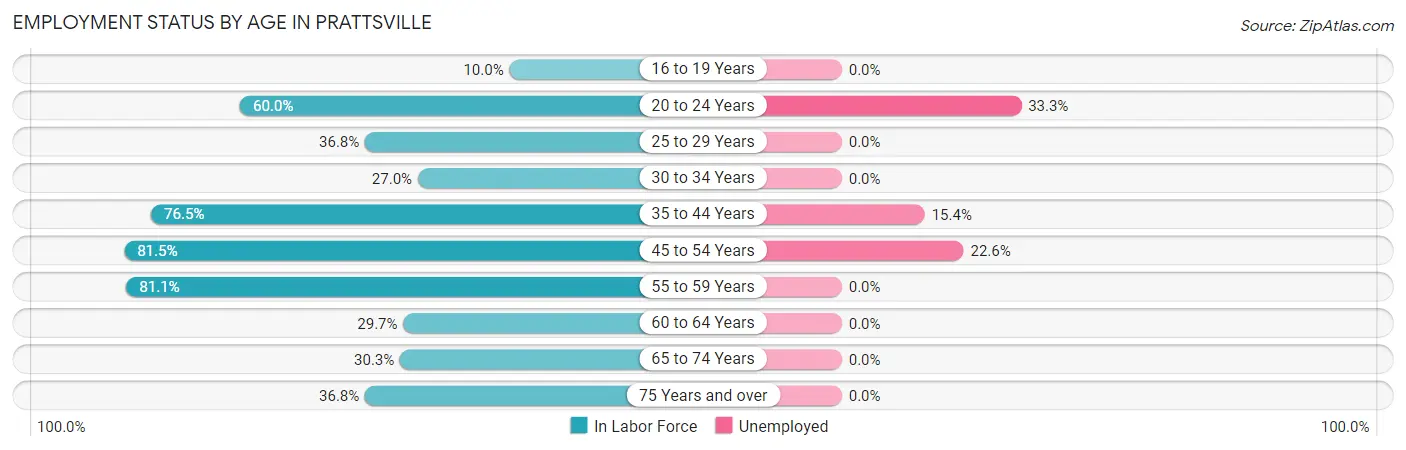
| Age Bracket | In Labor Force | Unemployed |
| 16 to 19 Years | 2 (10.0%) | 0 (0.0%) |
| 20 to 24 Years | 12 (60.0%) | 4 (33.3%) |
| 25 to 29 Years | 7 (36.8%) | 0 (0.0%) |
| 30 to 34 Years | 10 (27.0%) | 0 (0.0%) |
| 35 to 44 Years | 13 (76.5%) | 2 (15.4%) |
| 45 to 54 Years | 53 (81.5%) | 12 (22.6%) |
| 55 to 59 Years | 43 (81.1%) | 0 (0.0%) |
| 60 to 64 Years | 11 (29.7%) | 0 (0.0%) |
| 65 to 74 Years | 10 (30.3%) | 0 (0.0%) |
| 75 Years and over | 7 (36.8%) | 0 (0.0%) |
| Total | 168 (52.5%) | 18 (10.7%) |
Employment Status by Educational Attainment in Prattsville
According to labor force statistics for Prattsville, 60.1% of individuals (137) out of the total population between 25 and 64 years of age (228) are in the labor force, with 10.2% or 14 of them being unemployed. The group with the highest labor force participation rate are those with the educational attainment of bachelor's degree or higher, with 90.0% or 9 individuals in the labor force. Within the labor force, individuals with high school diploma education have the highest percentage of unemployment, with 13.6% or 12 of them being unemployed.
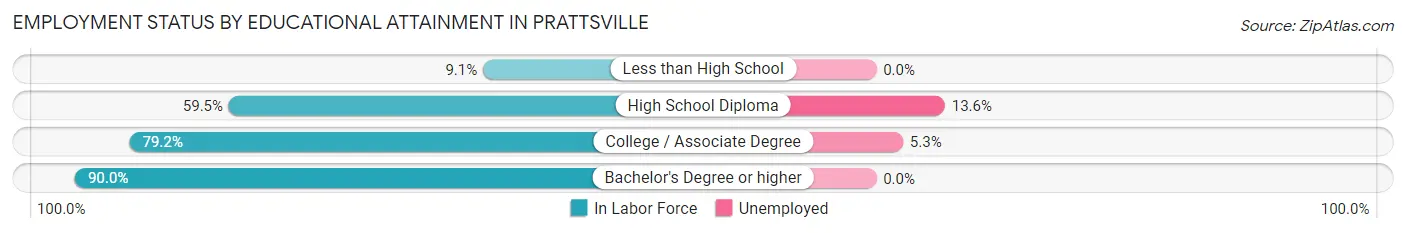
| Educational Attainment | In Labor Force | Unemployed |
| Less than High School | 2 (9.1%) | 0 (0.0%) |
| High School Diploma | 88 (59.5%) | 20 (13.6%) |
| College / Associate Degree | 38 (79.2%) | 3 (5.3%) |
| Bachelor's Degree or higher | 9 (90.0%) | 0 (0.0%) |
| Total | 137 (60.1%) | 23 (10.2%) |
Employment Occupations by Sex in Prattsville
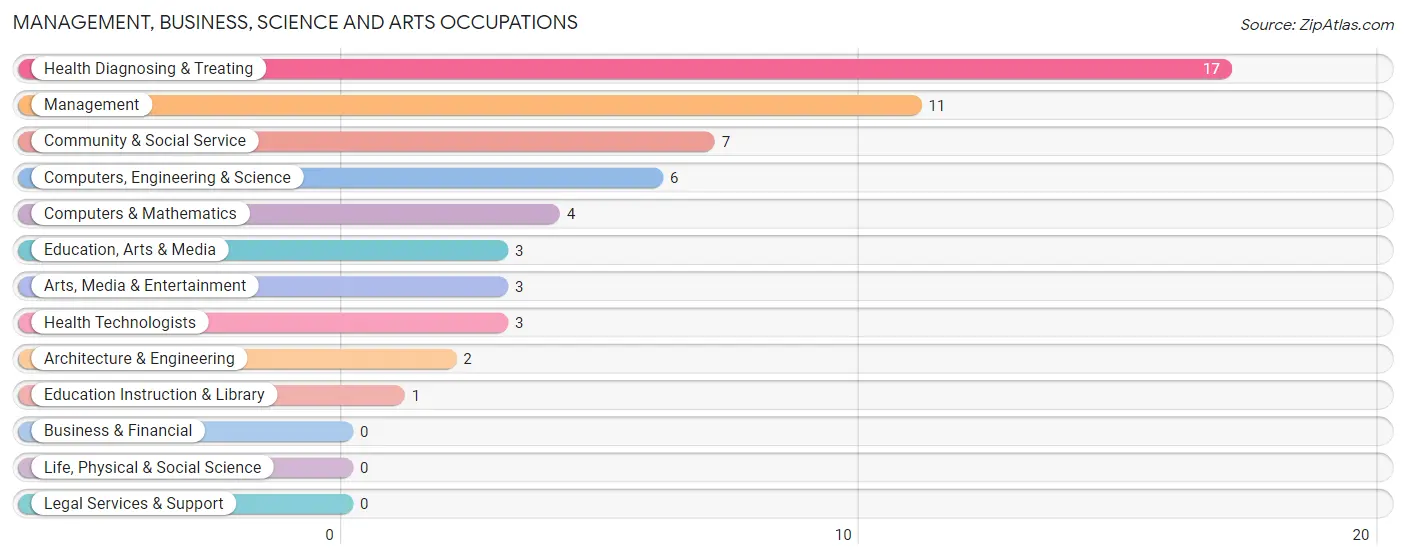
Management, Business, Science and Arts Occupations
The most common Management, Business, Science and Arts occupations in Prattsville are Health Diagnosing & Treating (17 | 11.3%), Management (11 | 7.3%), Community & Social Service (7 | 4.7%), Computers, Engineering & Science (6 | 4.0%), and Computers & Mathematics (4 | 2.7%).
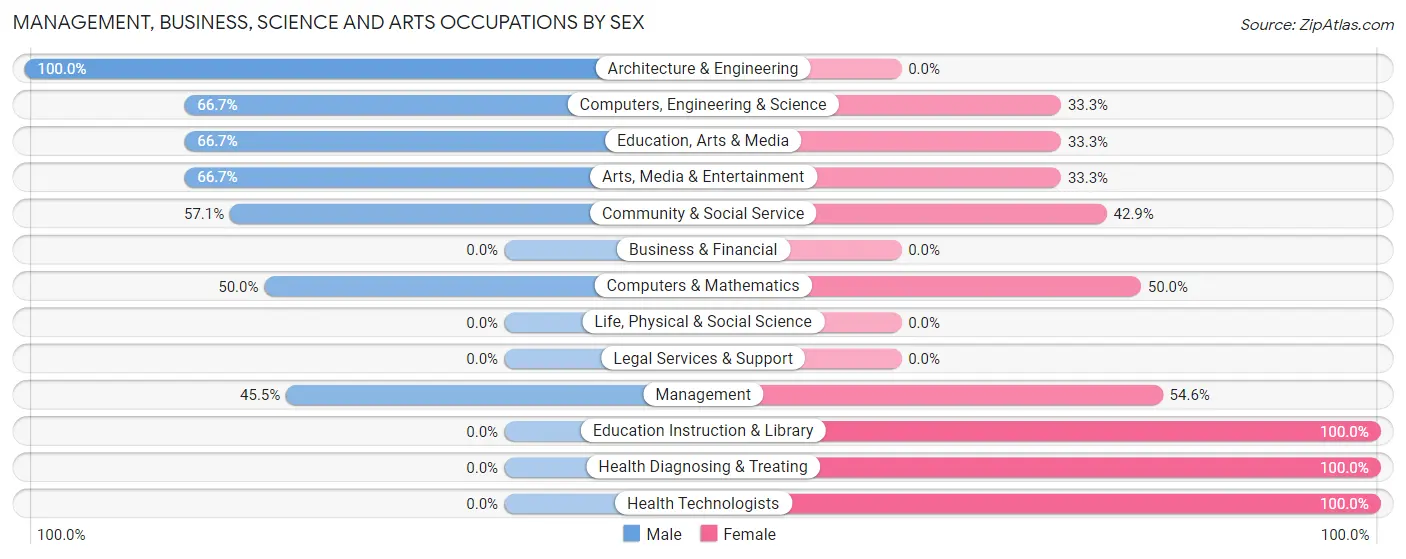
Management, Business, Science and Arts Occupations by Sex
Within the Management, Business, Science and Arts occupations in Prattsville, the most male-oriented occupations are Architecture & Engineering (100.0%), Computers, Engineering & Science (66.7%), and Education, Arts & Media (66.7%), while the most female-oriented occupations are Education Instruction & Library (100.0%), Health Diagnosing & Treating (100.0%), and Health Technologists (100.0%).
| Occupation | Male | Female |
| Management | 5 (45.5%) | 6 (54.5%) |
| Business & Financial | 0 (0.0%) | 0 (0.0%) |
| Computers, Engineering & Science | 4 (66.7%) | 2 (33.3%) |
| Computers & Mathematics | 2 (50.0%) | 2 (50.0%) |
| Architecture & Engineering | 2 (100.0%) | 0 (0.0%) |
| Life, Physical & Social Science | 0 (0.0%) | 0 (0.0%) |
| Community & Social Service | 4 (57.1%) | 3 (42.9%) |
| Education, Arts & Media | 2 (66.7%) | 1 (33.3%) |
| Legal Services & Support | 0 (0.0%) | 0 (0.0%) |
| Education Instruction & Library | 0 (0.0%) | 1 (100.0%) |
| Arts, Media & Entertainment | 2 (66.7%) | 1 (33.3%) |
| Health Diagnosing & Treating | 0 (0.0%) | 17 (100.0%) |
| Health Technologists | 0 (0.0%) | 3 (100.0%) |
| Total (Category) | 13 (31.7%) | 28 (68.3%) |
| Total (Overall) | 89 (59.3%) | 61 (40.7%) |
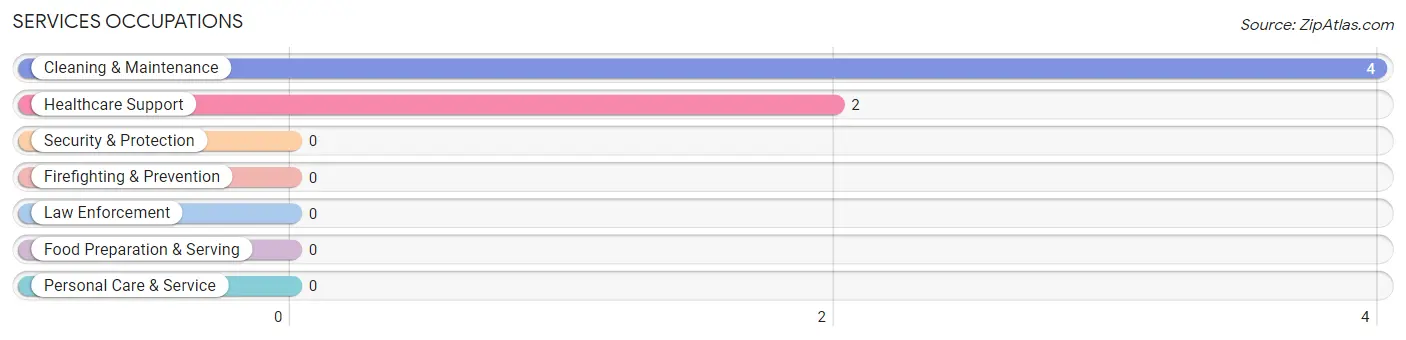
Services Occupations
The most common Services occupations in Prattsville are Cleaning & Maintenance (4 | 2.7%), and Healthcare Support (2 | 1.3%).
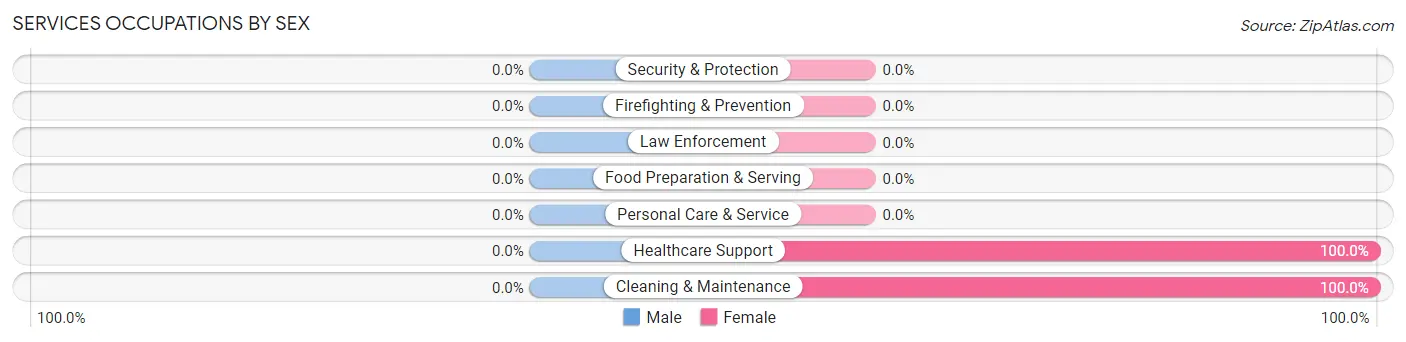
Services Occupations by Sex
| Occupation | Male | Female |
| Healthcare Support | 0 (0.0%) | 2 (100.0%) |
| Security & Protection | 0 (0.0%) | 0 (0.0%) |
| Firefighting & Prevention | 0 (0.0%) | 0 (0.0%) |
| Law Enforcement | 0 (0.0%) | 0 (0.0%) |
| Food Preparation & Serving | 0 (0.0%) | 0 (0.0%) |
| Cleaning & Maintenance | 0 (0.0%) | 4 (100.0%) |
| Personal Care & Service | 0 (0.0%) | 0 (0.0%) |
| Total (Category) | 0 (0.0%) | 6 (100.0%) |
| Total (Overall) | 89 (59.3%) | 61 (40.7%) |
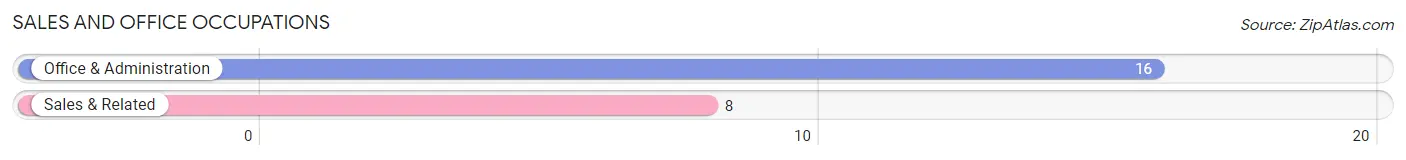
Sales and Office Occupations
The most common Sales and Office occupations in Prattsville are Office & Administration (16 | 10.7%), and Sales & Related (8 | 5.3%).
Sales and Office Occupations by Sex
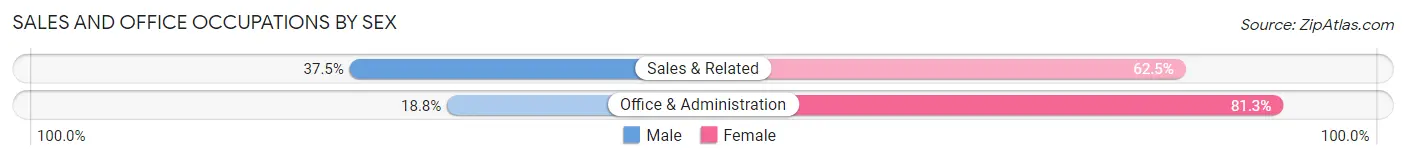
| Occupation | Male | Female |
| Sales & Related | 3 (37.5%) | 5 (62.5%) |
| Office & Administration | 3 (18.8%) | 13 (81.2%) |
| Total (Category) | 6 (25.0%) | 18 (75.0%) |
| Total (Overall) | 89 (59.3%) | 61 (40.7%) |
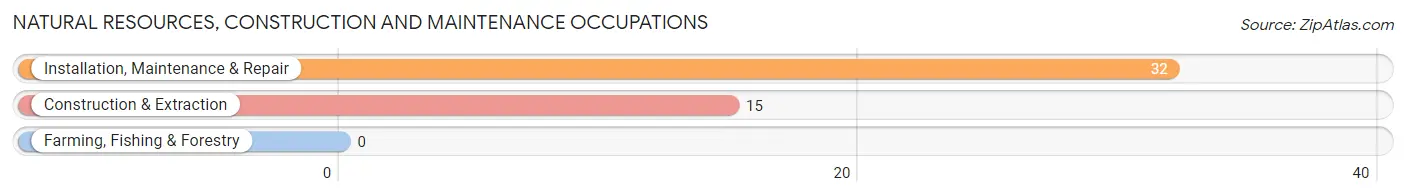
Natural Resources, Construction and Maintenance Occupations
The most common Natural Resources, Construction and Maintenance occupations in Prattsville are Installation, Maintenance & Repair (32 | 21.3%), and Construction & Extraction (15 | 10.0%).
Natural Resources, Construction and Maintenance Occupations by Sex
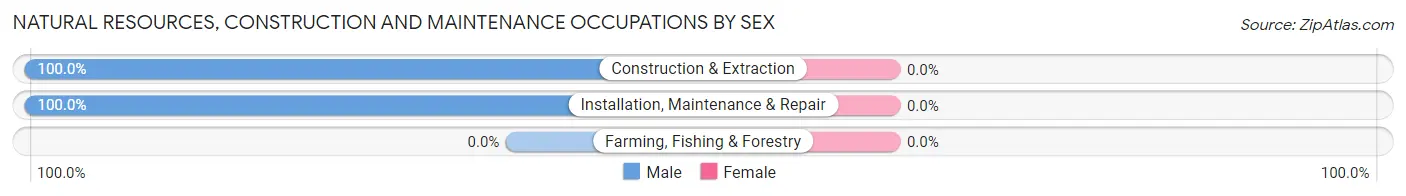
| Occupation | Male | Female |
| Farming, Fishing & Forestry | 0 (0.0%) | 0 (0.0%) |
| Construction & Extraction | 15 (100.0%) | 0 (0.0%) |
| Installation, Maintenance & Repair | 32 (100.0%) | 0 (0.0%) |
| Total (Category) | 47 (100.0%) | 0 (0.0%) |
| Total (Overall) | 89 (59.3%) | 61 (40.7%) |
Production, Transportation and Moving Occupations
The most common Production, Transportation and Moving occupations in Prattsville are Production (12 | 8.0%), Material Moving (12 | 8.0%), and Transportation (8 | 5.3%).
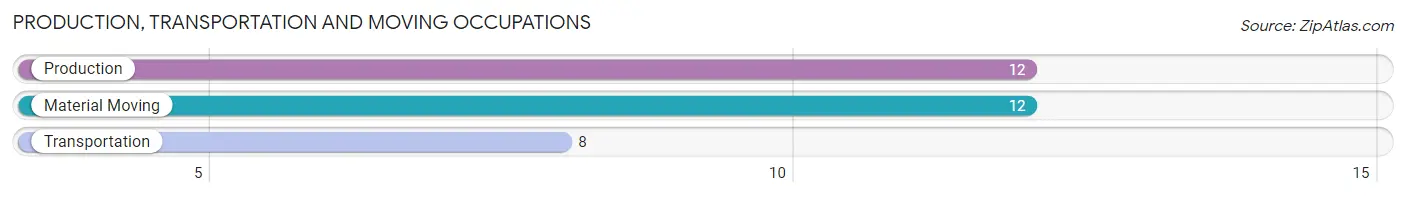
Production, Transportation and Moving Occupations by Sex
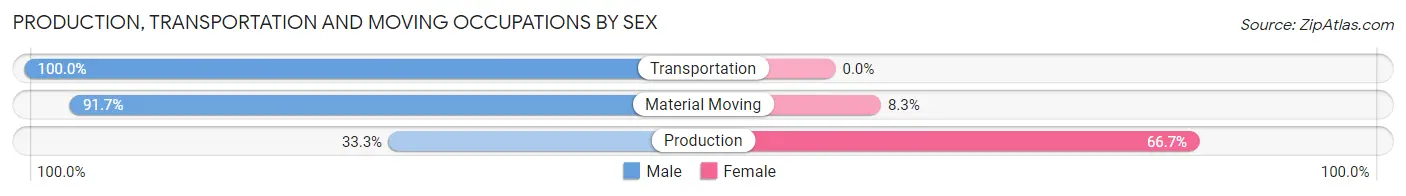
| Occupation | Male | Female |
| Production | 4 (33.3%) | 8 (66.7%) |
| Transportation | 8 (100.0%) | 0 (0.0%) |
| Material Moving | 11 (91.7%) | 1 (8.3%) |
| Total (Category) | 23 (71.9%) | 9 (28.1%) |
| Total (Overall) | 89 (59.3%) | 61 (40.7%) |
Employment Industries by Sex in Prattsville
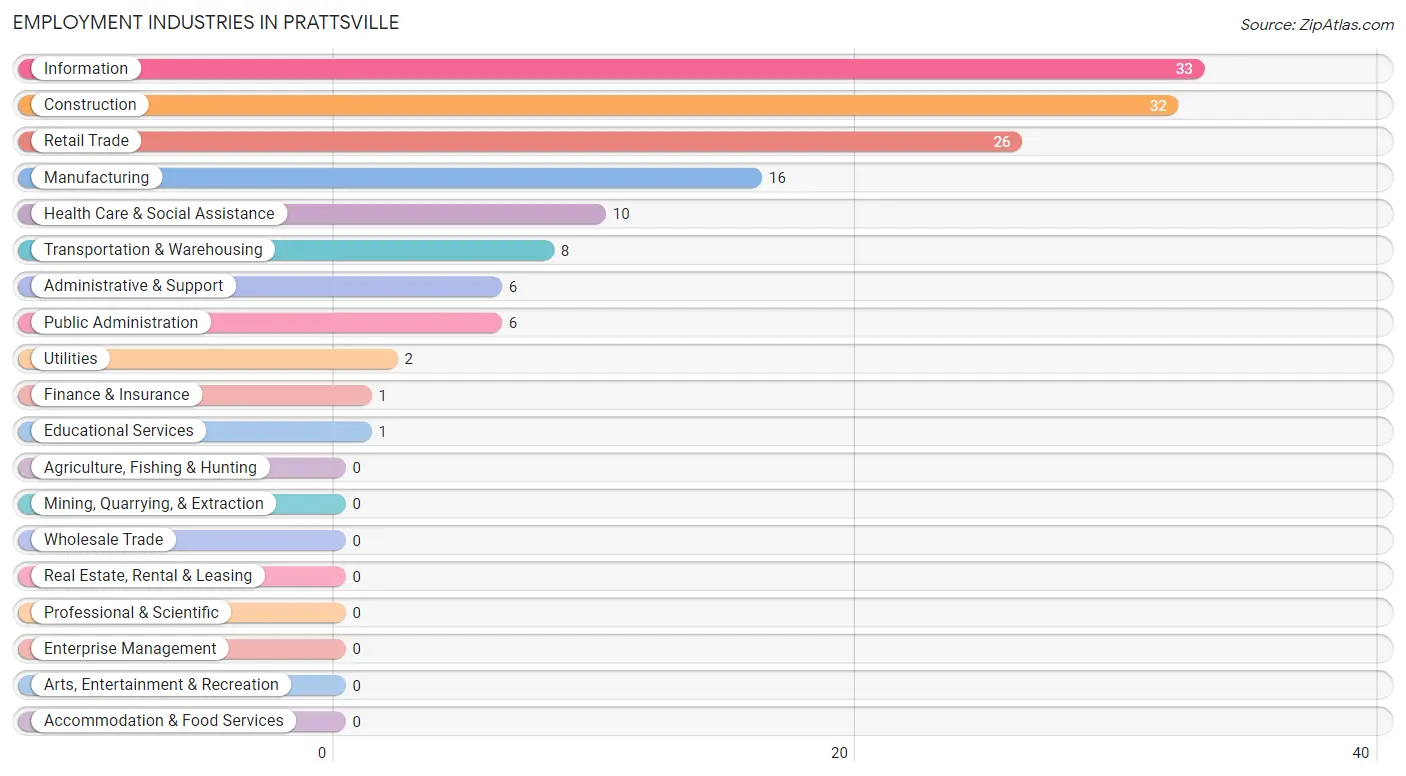
Employment Industries in Prattsville
The major employment industries in Prattsville include Information (33 | 22.0%), Construction (32 | 21.3%), Retail Trade (26 | 17.3%), Manufacturing (16 | 10.7%), and Health Care & Social Assistance (10 | 6.7%).
Employment Industries by Sex in Prattsville
The Prattsville industries that see more men than women are Transportation & Warehousing (100.0%), Information (84.9%), and Construction (78.1%), whereas the industries that tend to have a higher number of women are Utilities (100.0%), Finance & Insurance (100.0%), and Educational Services (100.0%).
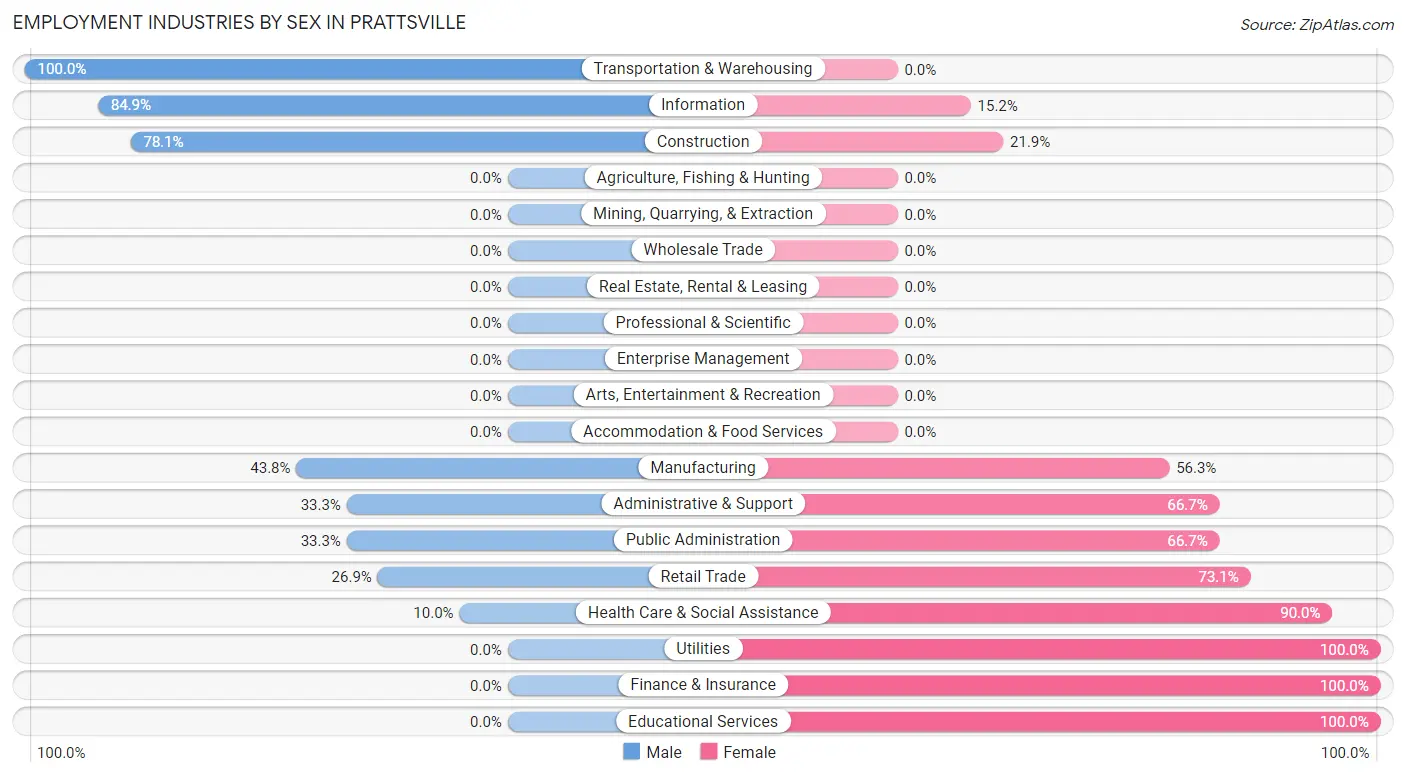
| Industry | Male | Female |
| Agriculture, Fishing & Hunting | 0 (0.0%) | 0 (0.0%) |
| Mining, Quarrying, & Extraction | 0 (0.0%) | 0 (0.0%) |
| Construction | 25 (78.1%) | 7 (21.9%) |
| Manufacturing | 7 (43.8%) | 9 (56.2%) |
| Wholesale Trade | 0 (0.0%) | 0 (0.0%) |
| Retail Trade | 7 (26.9%) | 19 (73.1%) |
| Transportation & Warehousing | 8 (100.0%) | 0 (0.0%) |
| Utilities | 0 (0.0%) | 2 (100.0%) |
| Information | 28 (84.9%) | 5 (15.1%) |
| Finance & Insurance | 0 (0.0%) | 1 (100.0%) |
| Real Estate, Rental & Leasing | 0 (0.0%) | 0 (0.0%) |
| Professional & Scientific | 0 (0.0%) | 0 (0.0%) |
| Enterprise Management | 0 (0.0%) | 0 (0.0%) |
| Administrative & Support | 2 (33.3%) | 4 (66.7%) |
| Educational Services | 0 (0.0%) | 1 (100.0%) |
| Health Care & Social Assistance | 1 (10.0%) | 9 (90.0%) |
| Arts, Entertainment & Recreation | 0 (0.0%) | 0 (0.0%) |
| Accommodation & Food Services | 0 (0.0%) | 0 (0.0%) |
| Public Administration | 2 (33.3%) | 4 (66.7%) |
| Total | 89 (59.3%) | 61 (40.7%) |
Education in Prattsville
School Enrollment in Prattsville
The most common levels of schooling among the 101 students in Prattsville are middle school (63 | 62.4%), high school (24 | 23.8%), and college / undergraduate (8 | 7.9%).
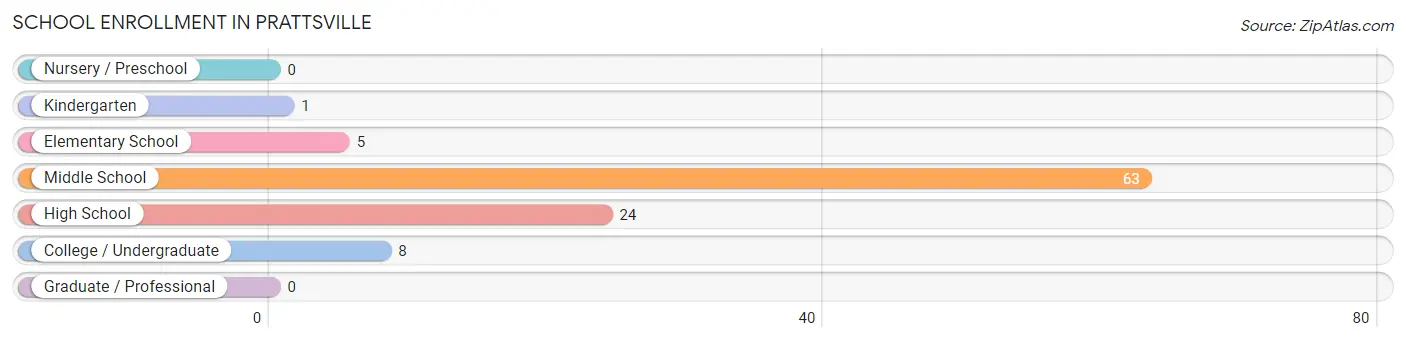
| School Level | # Students | % Students |
| Nursery / Preschool | 0 | 0.0% |
| Kindergarten | 1 | 1.0% |
| Elementary School | 5 | 5.0% |
| Middle School | 63 | 62.4% |
| High School | 24 | 23.8% |
| College / Undergraduate | 8 | 7.9% |
| Graduate / Professional | 0 | 0.0% |
| Total | 101 | 100.0% |
School Enrollment by Age by Funding Source in Prattsville
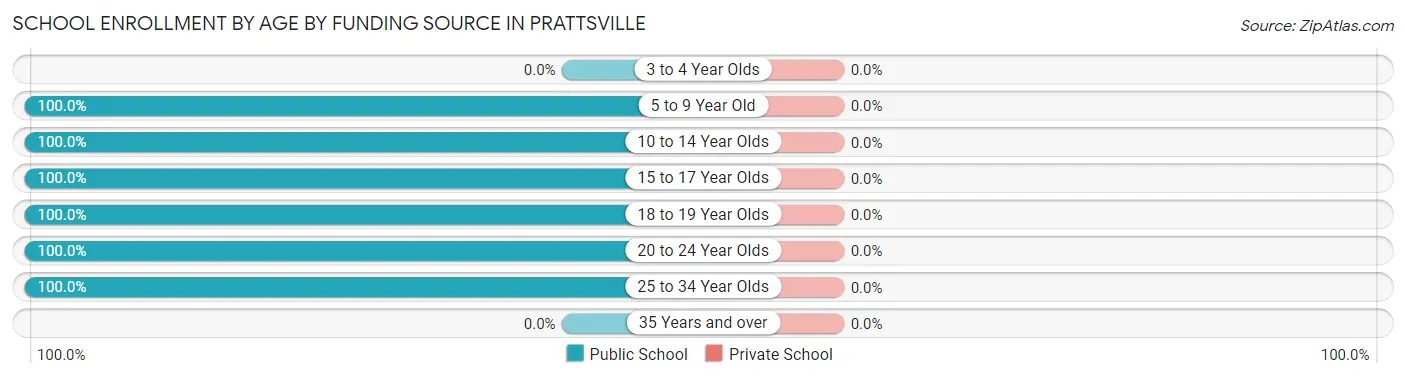
| Age Bracket | Public School | Private School |
| 3 to 4 Year Olds | 0 (0.0%) | 0 (0.0%) |
| 5 to 9 Year Old | 6 (100.0%) | 0 (0.0%) |
| 10 to 14 Year Olds | 63 (100.0%) | 0 (0.0%) |
| 15 to 17 Year Olds | 24 (100.0%) | 0 (0.0%) |
| 18 to 19 Year Olds | 4 (100.0%) | 0 (0.0%) |
| 20 to 24 Year Olds | 2 (100.0%) | 0 (0.0%) |
| 25 to 34 Year Olds | 2 (100.0%) | 0 (0.0%) |
| 35 Years and over | 0 (0.0%) | 0 (0.0%) |
| Total | 101 (100.0%) | 0 (0.0%) |
Educational Attainment by Field of Study in Prattsville
Business (7 | 58.3%), literature & languages (2 | 16.7%), science & technology (1 | 8.3%), education (1 | 8.3%), and arts & humanities (1 | 8.3%) are the most common fields of study among 12 individuals in Prattsville who have obtained a bachelor's degree or higher.
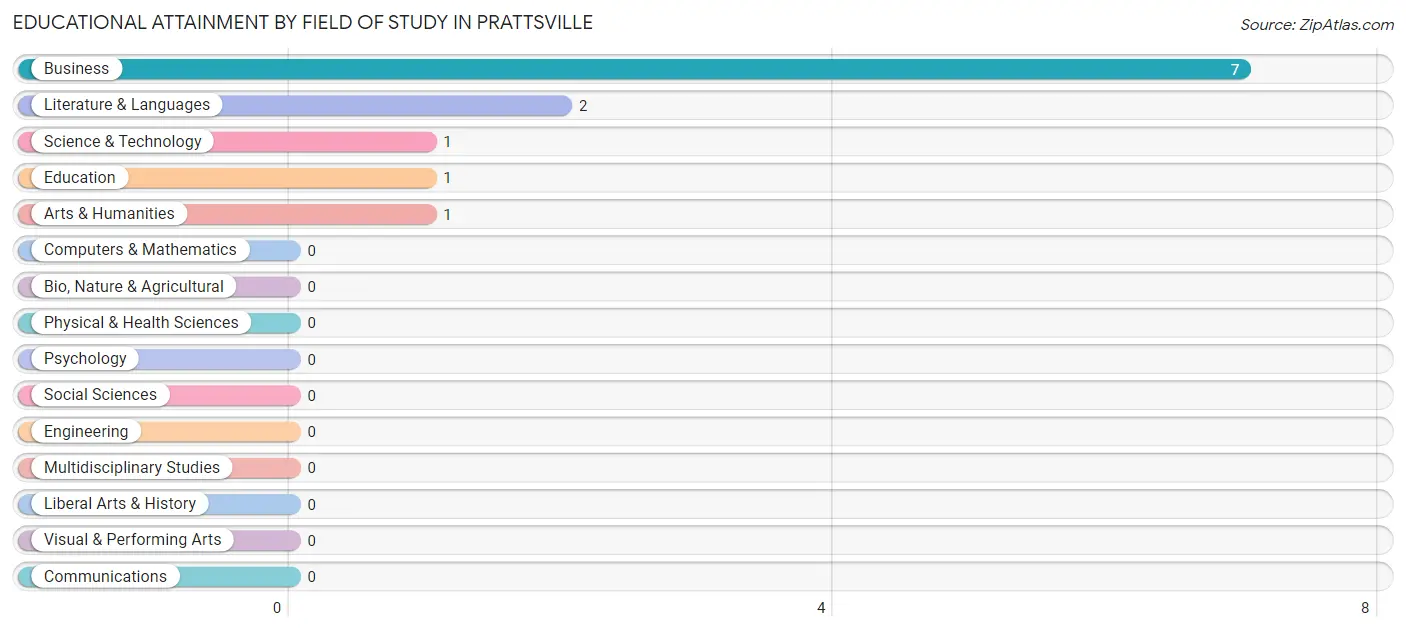
| Field of Study | # Graduates | % Graduates |
| Computers & Mathematics | 0 | 0.0% |
| Bio, Nature & Agricultural | 0 | 0.0% |
| Physical & Health Sciences | 0 | 0.0% |
| Psychology | 0 | 0.0% |
| Social Sciences | 0 | 0.0% |
| Engineering | 0 | 0.0% |
| Multidisciplinary Studies | 0 | 0.0% |
| Science & Technology | 1 | 8.3% |
| Business | 7 | 58.3% |
| Education | 1 | 8.3% |
| Literature & Languages | 2 | 16.7% |
| Liberal Arts & History | 0 | 0.0% |
| Visual & Performing Arts | 0 | 0.0% |
| Communications | 0 | 0.0% |
| Arts & Humanities | 1 | 8.3% |
| Total | 12 | 100.0% |
Transportation & Commute in Prattsville
Vehicle Availability by Sex in Prattsville
The most prevalent vehicle ownership categories in Prattsville are males with 2 vehicles (53, accounting for 59.6%) and females with 2 vehicles (27, making up 89.8%).
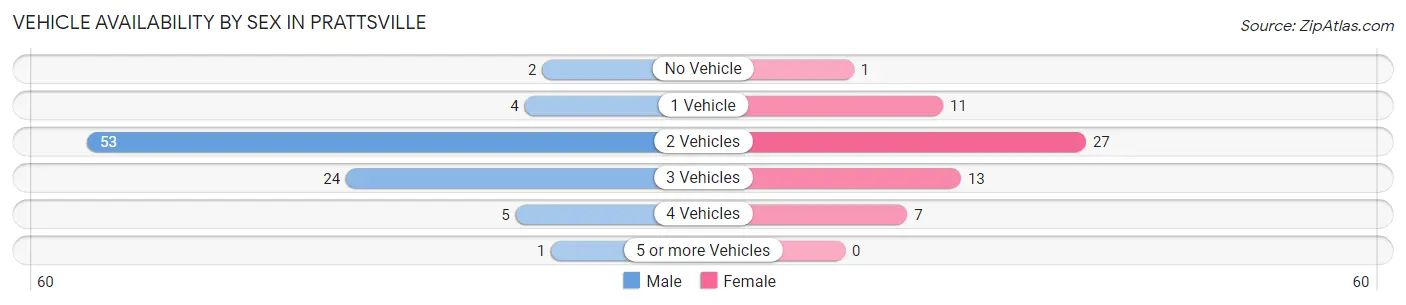
| Vehicles Available | Male | Female |
| No Vehicle | 2 (2.2%) | 1 (1.7%) |
| 1 Vehicle | 4 (4.5%) | 11 (18.6%) |
| 2 Vehicles | 53 (59.6%) | 27 (45.8%) |
| 3 Vehicles | 24 (27.0%) | 13 (22.0%) |
| 4 Vehicles | 5 (5.6%) | 7 (11.9%) |
| 5 or more Vehicles | 1 (1.1%) | 0 (0.0%) |
| Total | 89 (100.0%) | 59 (100.0%) |
Commute Time in Prattsville
The most frequently occuring commute durations in Prattsville are 30 to 34 minutes (42 commuters, 30.9%), 15 to 19 minutes (25 commuters, 18.4%), and 60 to 89 minutes (15 commuters, 11.0%).
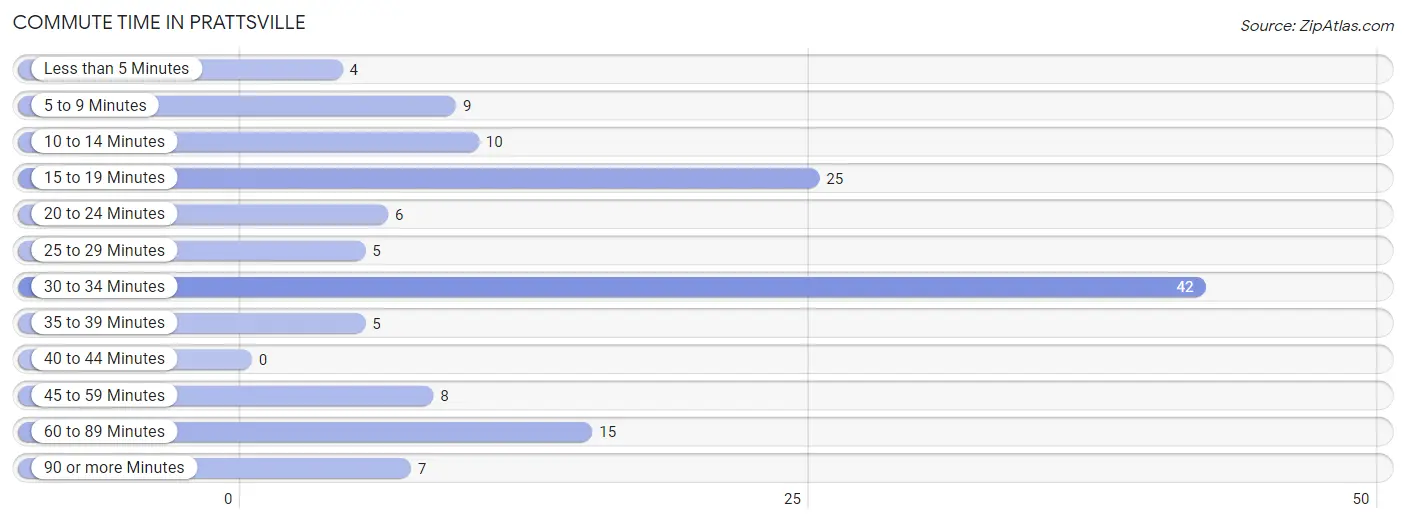
| Commute Time | # Commuters | % Commuters |
| Less than 5 Minutes | 4 | 2.9% |
| 5 to 9 Minutes | 9 | 6.6% |
| 10 to 14 Minutes | 10 | 7.3% |
| 15 to 19 Minutes | 25 | 18.4% |
| 20 to 24 Minutes | 6 | 4.4% |
| 25 to 29 Minutes | 5 | 3.7% |
| 30 to 34 Minutes | 42 | 30.9% |
| 35 to 39 Minutes | 5 | 3.7% |
| 40 to 44 Minutes | 0 | 0.0% |
| 45 to 59 Minutes | 8 | 5.9% |
| 60 to 89 Minutes | 15 | 11.0% |
| 90 or more Minutes | 7 | 5.1% |
Commute Time by Sex in Prattsville
The most common commute times in Prattsville are 30 to 34 minutes (31 commuters, 36.0%) for males and 15 to 19 minutes (22 commuters, 44.0%) for females.
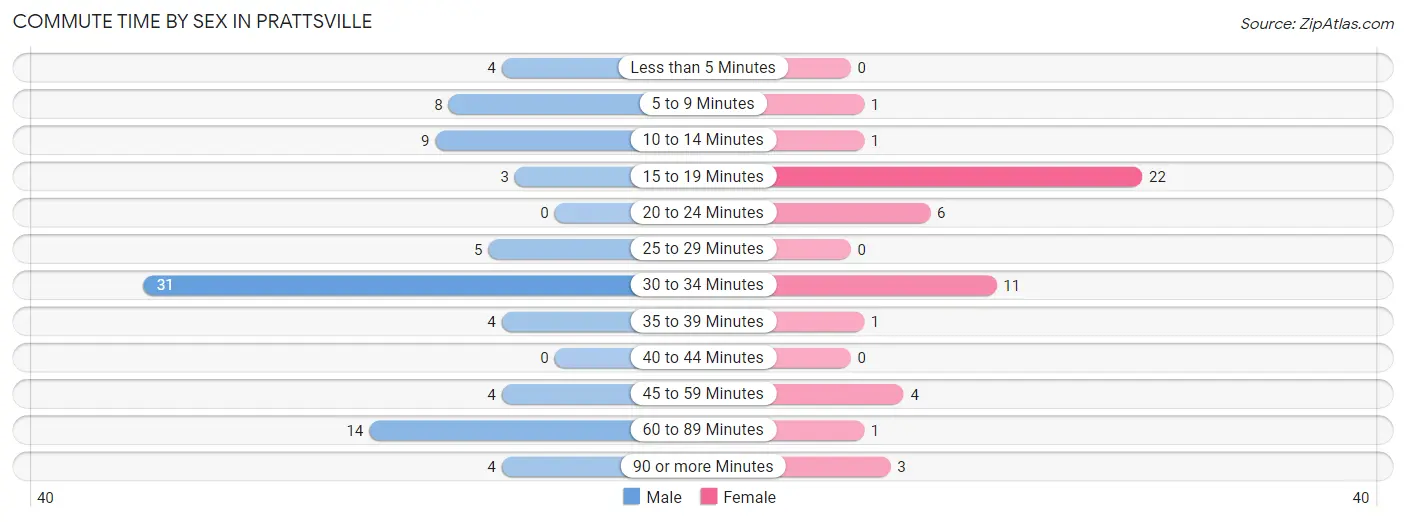
| Commute Time | Male | Female |
| Less than 5 Minutes | 4 (4.6%) | 0 (0.0%) |
| 5 to 9 Minutes | 8 (9.3%) | 1 (2.0%) |
| 10 to 14 Minutes | 9 (10.5%) | 1 (2.0%) |
| 15 to 19 Minutes | 3 (3.5%) | 22 (44.0%) |
| 20 to 24 Minutes | 0 (0.0%) | 6 (12.0%) |
| 25 to 29 Minutes | 5 (5.8%) | 0 (0.0%) |
| 30 to 34 Minutes | 31 (36.0%) | 11 (22.0%) |
| 35 to 39 Minutes | 4 (4.6%) | 1 (2.0%) |
| 40 to 44 Minutes | 0 (0.0%) | 0 (0.0%) |
| 45 to 59 Minutes | 4 (4.6%) | 4 (8.0%) |
| 60 to 89 Minutes | 14 (16.3%) | 1 (2.0%) |
| 90 or more Minutes | 4 (4.6%) | 3 (6.0%) |
Time of Departure to Work by Sex in Prattsville
The most frequent times of departure to work in Prattsville are 7:00 AM to 7:29 AM (34, 39.5%) for males and 7:30 AM to 7:59 AM (22, 44.0%) for females.
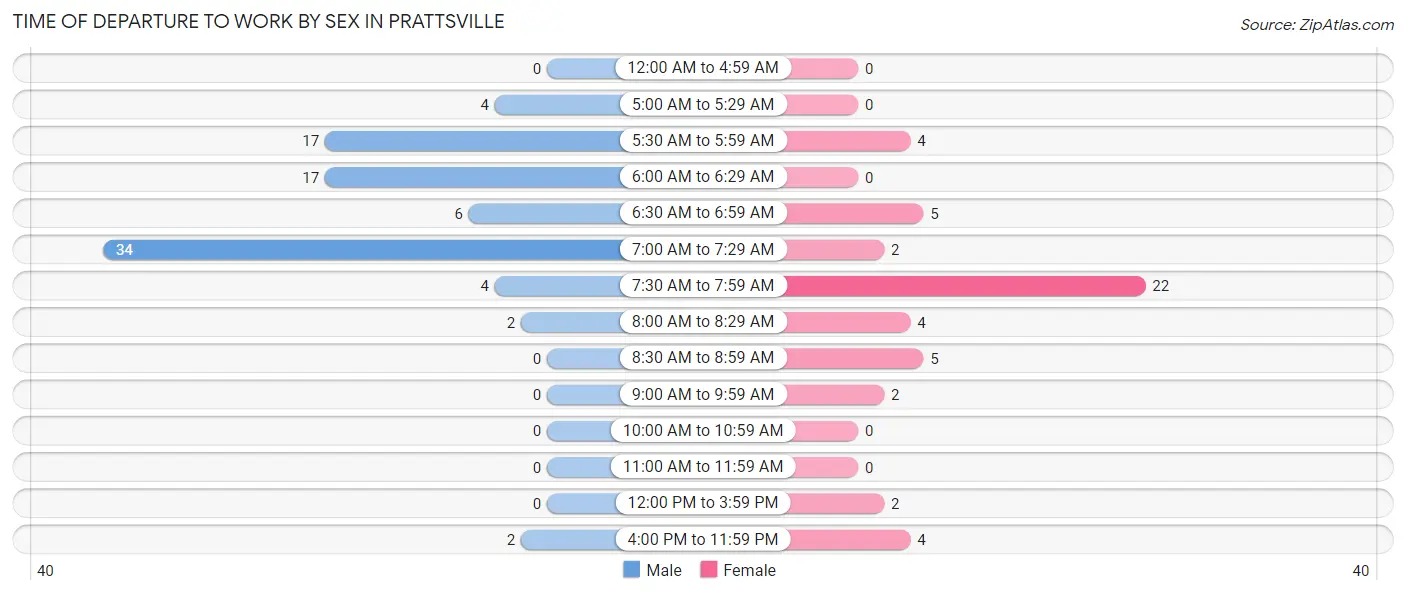
| Time of Departure | Male | Female |
| 12:00 AM to 4:59 AM | 0 (0.0%) | 0 (0.0%) |
| 5:00 AM to 5:29 AM | 4 (4.6%) | 0 (0.0%) |
| 5:30 AM to 5:59 AM | 17 (19.8%) | 4 (8.0%) |
| 6:00 AM to 6:29 AM | 17 (19.8%) | 0 (0.0%) |
| 6:30 AM to 6:59 AM | 6 (7.0%) | 5 (10.0%) |
| 7:00 AM to 7:29 AM | 34 (39.5%) | 2 (4.0%) |
| 7:30 AM to 7:59 AM | 4 (4.6%) | 22 (44.0%) |
| 8:00 AM to 8:29 AM | 2 (2.3%) | 4 (8.0%) |
| 8:30 AM to 8:59 AM | 0 (0.0%) | 5 (10.0%) |
| 9:00 AM to 9:59 AM | 0 (0.0%) | 2 (4.0%) |
| 10:00 AM to 10:59 AM | 0 (0.0%) | 0 (0.0%) |
| 11:00 AM to 11:59 AM | 0 (0.0%) | 0 (0.0%) |
| 12:00 PM to 3:59 PM | 0 (0.0%) | 2 (4.0%) |
| 4:00 PM to 11:59 PM | 2 (2.3%) | 4 (8.0%) |
| Total | 86 (100.0%) | 50 (100.0%) |
Housing Occupancy in Prattsville
Occupancy by Ownership in Prattsville
Of the total 126 dwellings in Prattsville, owner-occupied units account for 115 (91.3%), while renter-occupied units make up 11 (8.7%).
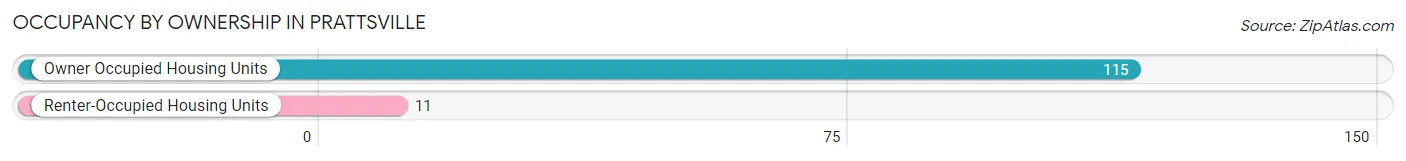
| Occupancy | # Housing Units | % Housing Units |
| Owner Occupied Housing Units | 115 | 91.3% |
| Renter-Occupied Housing Units | 11 | 8.7% |
| Total Occupied Housing Units | 126 | 100.0% |
Occupancy by Household Size in Prattsville
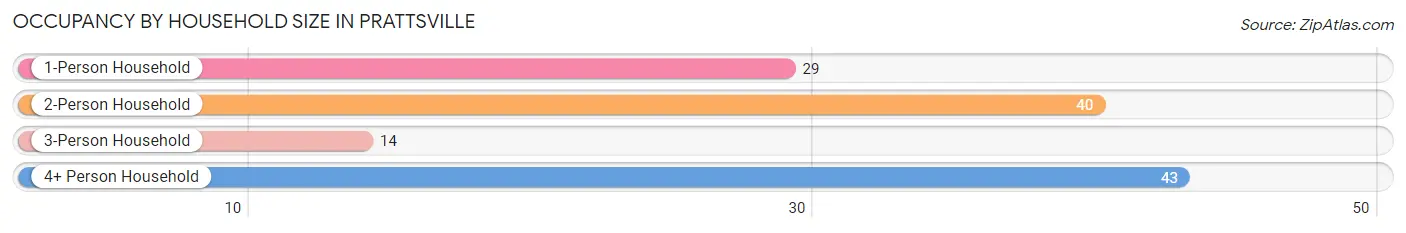
| Household Size | # Housing Units | % Housing Units |
| 1-Person Household | 29 | 23.0% |
| 2-Person Household | 40 | 31.8% |
| 3-Person Household | 14 | 11.1% |
| 4+ Person Household | 43 | 34.1% |
| Total Housing Units | 126 | 100.0% |
Occupancy by Ownership by Household Size in Prattsville
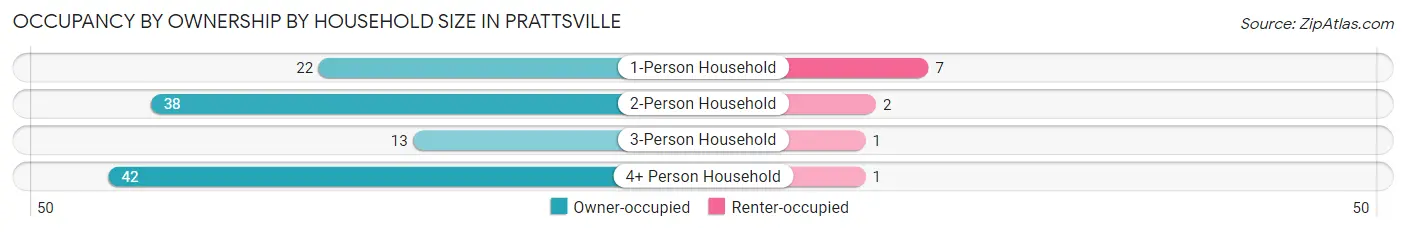
| Household Size | Owner-occupied | Renter-occupied |
| 1-Person Household | 22 (75.9%) | 7 (24.1%) |
| 2-Person Household | 38 (95.0%) | 2 (5.0%) |
| 3-Person Household | 13 (92.9%) | 1 (7.1%) |
| 4+ Person Household | 42 (97.7%) | 1 (2.3%) |
| Total Housing Units | 115 (91.3%) | 11 (8.7%) |
Occupancy by Educational Attainment in Prattsville
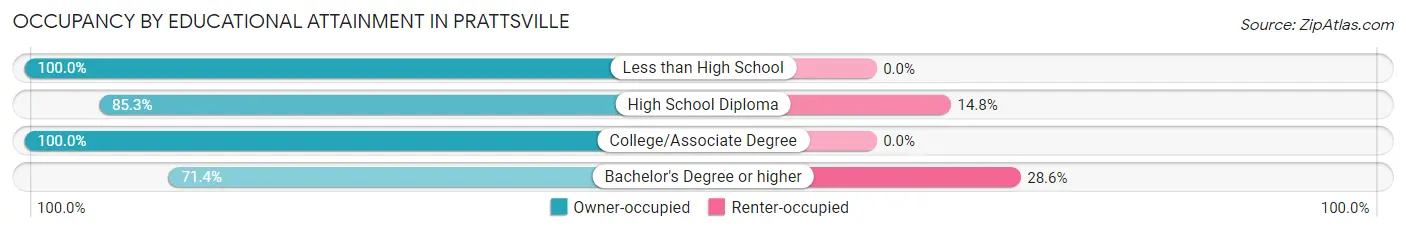
| Household Size | Owner-occupied | Renter-occupied |
| Less than High School | 23 (100.0%) | 0 (0.0%) |
| High School Diploma | 52 (85.3%) | 9 (14.7%) |
| College/Associate Degree | 35 (100.0%) | 0 (0.0%) |
| Bachelor's Degree or higher | 5 (71.4%) | 2 (28.6%) |
Occupancy by Age of Householder in Prattsville
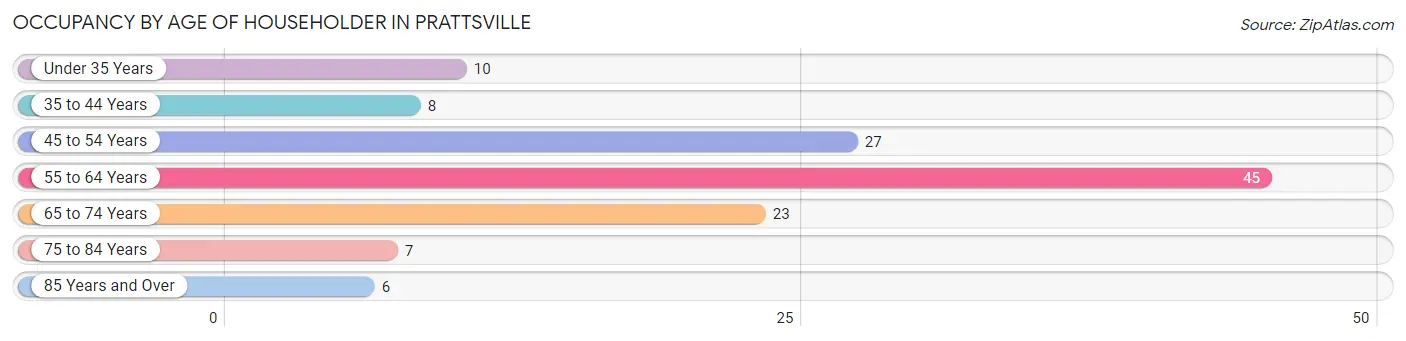
| Age Bracket | # Households | % Households |
| Under 35 Years | 10 | 7.9% |
| 35 to 44 Years | 8 | 6.4% |
| 45 to 54 Years | 27 | 21.4% |
| 55 to 64 Years | 45 | 35.7% |
| 65 to 74 Years | 23 | 18.2% |
| 75 to 84 Years | 7 | 5.6% |
| 85 Years and Over | 6 | 4.8% |
| Total | 126 | 100.0% |
Housing Finances in Prattsville
Median Income by Occupancy in Prattsville
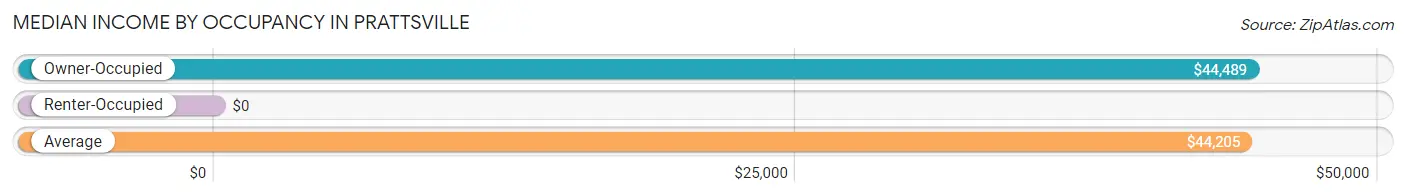
| Occupancy Type | # Households | Median Income |
| Owner-Occupied | 115 (91.3%) | $44,489 |
| Renter-Occupied | 11 (8.7%) | $0 |
| Average | 126 (100.0%) | $44,205 |
Occupancy by Householder Income Bracket in Prattsville
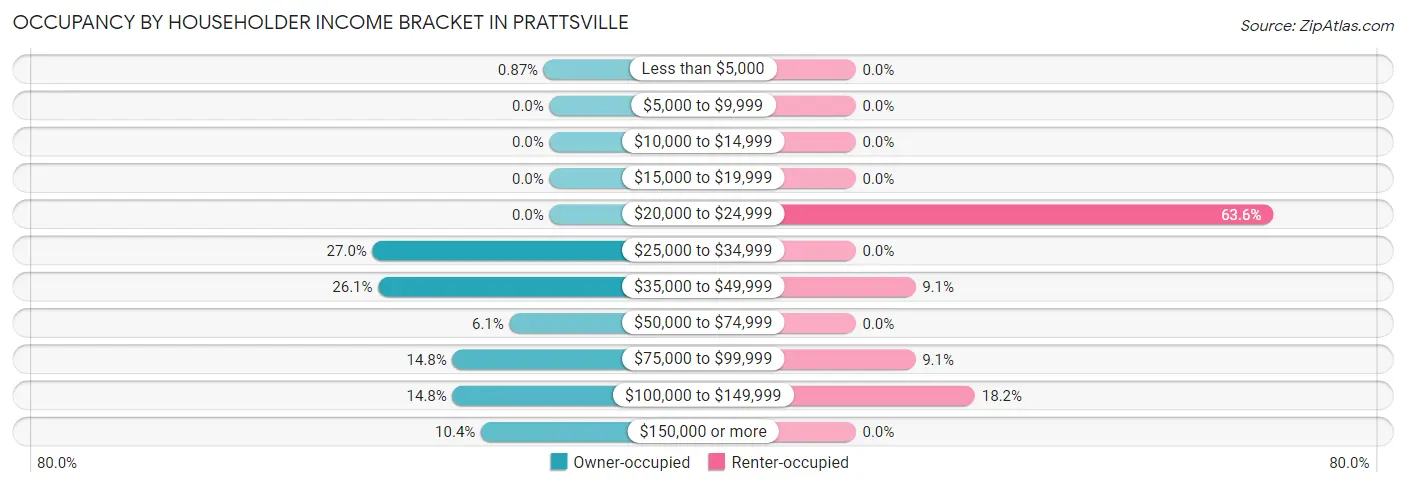
| Income Bracket | Owner-occupied | Renter-occupied |
| Less than $5,000 | 1 (0.9%) | 0 (0.0%) |
| $5,000 to $9,999 | 0 (0.0%) | 0 (0.0%) |
| $10,000 to $14,999 | 0 (0.0%) | 0 (0.0%) |
| $15,000 to $19,999 | 0 (0.0%) | 0 (0.0%) |
| $20,000 to $24,999 | 0 (0.0%) | 7 (63.6%) |
| $25,000 to $34,999 | 31 (27.0%) | 0 (0.0%) |
| $35,000 to $49,999 | 30 (26.1%) | 1 (9.1%) |
| $50,000 to $74,999 | 7 (6.1%) | 0 (0.0%) |
| $75,000 to $99,999 | 17 (14.8%) | 1 (9.1%) |
| $100,000 to $149,999 | 17 (14.8%) | 2 (18.2%) |
| $150,000 or more | 12 (10.4%) | 0 (0.0%) |
| Total | 115 (100.0%) | 11 (100.0%) |
Monthly Housing Cost Tiers in Prattsville
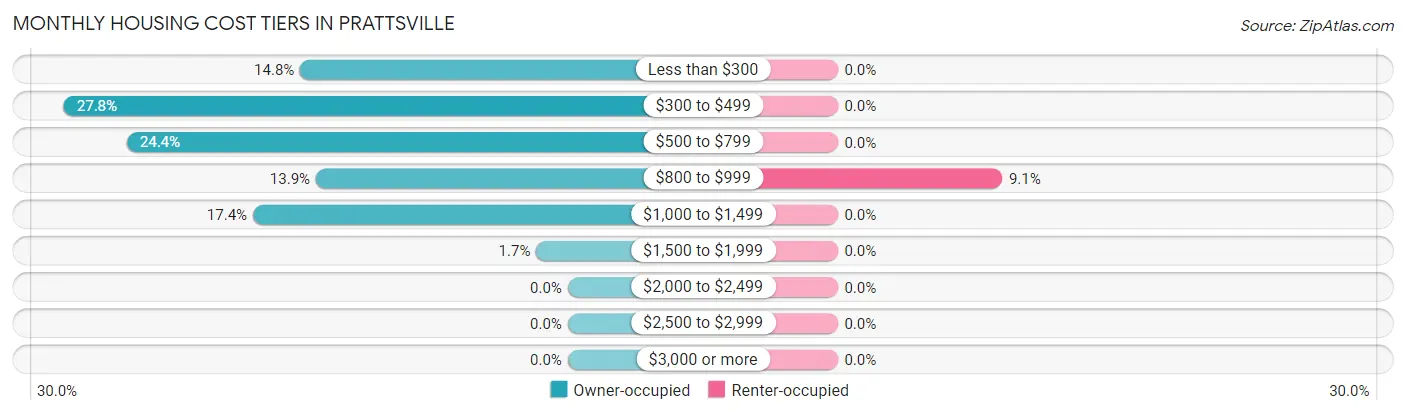
| Monthly Cost | Owner-occupied | Renter-occupied |
| Less than $300 | 17 (14.8%) | 0 (0.0%) |
| $300 to $499 | 32 (27.8%) | 0 (0.0%) |
| $500 to $799 | 28 (24.3%) | 0 (0.0%) |
| $800 to $999 | 16 (13.9%) | 1 (9.1%) |
| $1,000 to $1,499 | 20 (17.4%) | 0 (0.0%) |
| $1,500 to $1,999 | 2 (1.7%) | 0 (0.0%) |
| $2,000 to $2,499 | 0 (0.0%) | 0 (0.0%) |
| $2,500 to $2,999 | 0 (0.0%) | 0 (0.0%) |
| $3,000 or more | 0 (0.0%) | 0 (0.0%) |
| Total | 115 (100.0%) | 11 (100.0%) |
Physical Housing Characteristics in Prattsville
Housing Structures in Prattsville
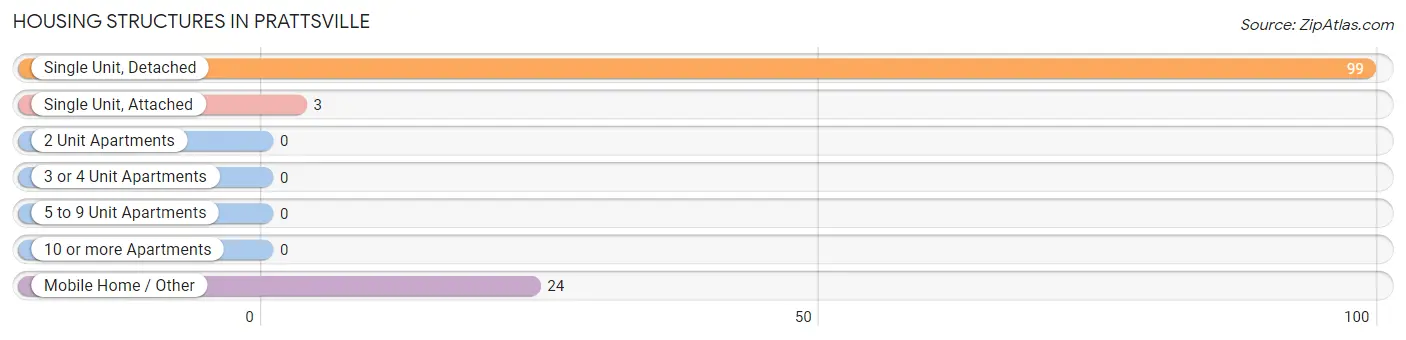
| Structure Type | # Housing Units | % Housing Units |
| Single Unit, Detached | 99 | 78.6% |
| Single Unit, Attached | 3 | 2.4% |
| 2 Unit Apartments | 0 | 0.0% |
| 3 or 4 Unit Apartments | 0 | 0.0% |
| 5 to 9 Unit Apartments | 0 | 0.0% |
| 10 or more Apartments | 0 | 0.0% |
| Mobile Home / Other | 24 | 19.1% |
| Total | 126 | 100.0% |
Housing Structures by Occupancy in Prattsville
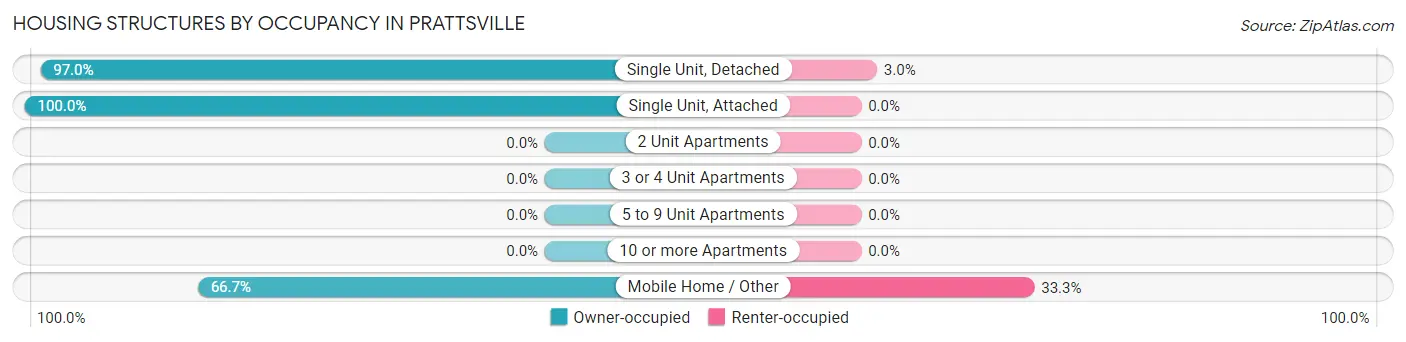
| Structure Type | Owner-occupied | Renter-occupied |
| Single Unit, Detached | 96 (97.0%) | 3 (3.0%) |
| Single Unit, Attached | 3 (100.0%) | 0 (0.0%) |
| 2 Unit Apartments | 0 (0.0%) | 0 (0.0%) |
| 3 or 4 Unit Apartments | 0 (0.0%) | 0 (0.0%) |
| 5 to 9 Unit Apartments | 0 (0.0%) | 0 (0.0%) |
| 10 or more Apartments | 0 (0.0%) | 0 (0.0%) |
| Mobile Home / Other | 16 (66.7%) | 8 (33.3%) |
| Total | 115 (91.3%) | 11 (8.7%) |
Housing Structures by Number of Rooms in Prattsville
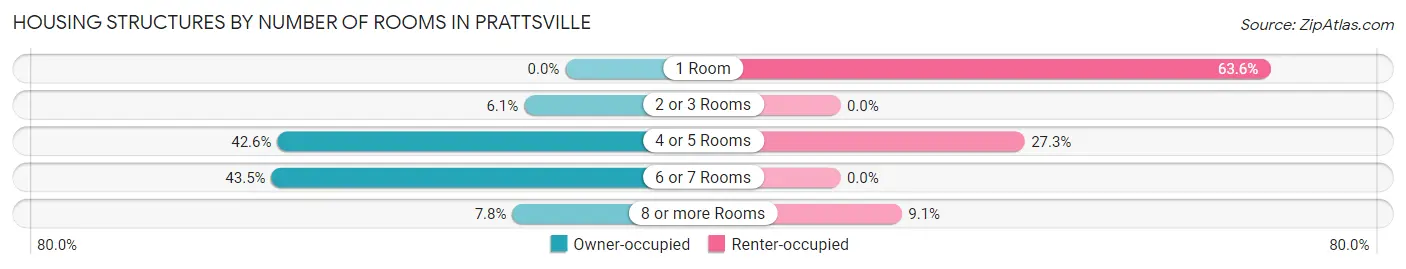
| Number of Rooms | Owner-occupied | Renter-occupied |
| 1 Room | 0 (0.0%) | 7 (63.6%) |
| 2 or 3 Rooms | 7 (6.1%) | 0 (0.0%) |
| 4 or 5 Rooms | 49 (42.6%) | 3 (27.3%) |
| 6 or 7 Rooms | 50 (43.5%) | 0 (0.0%) |
| 8 or more Rooms | 9 (7.8%) | 1 (9.1%) |
| Total | 115 (100.0%) | 11 (100.0%) |
Housing Structure by Heating Type in Prattsville
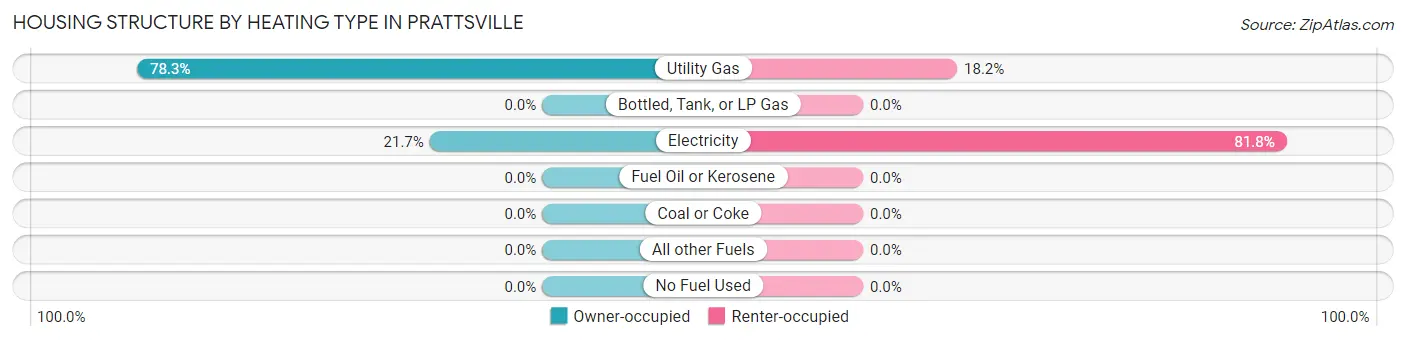
| Heating Type | Owner-occupied | Renter-occupied |
| Utility Gas | 90 (78.3%) | 2 (18.2%) |
| Bottled, Tank, or LP Gas | 0 (0.0%) | 0 (0.0%) |
| Electricity | 25 (21.7%) | 9 (81.8%) |
| Fuel Oil or Kerosene | 0 (0.0%) | 0 (0.0%) |
| Coal or Coke | 0 (0.0%) | 0 (0.0%) |
| All other Fuels | 0 (0.0%) | 0 (0.0%) |
| No Fuel Used | 0 (0.0%) | 0 (0.0%) |
| Total | 115 (100.0%) | 11 (100.0%) |
Household Vehicle Usage in Prattsville
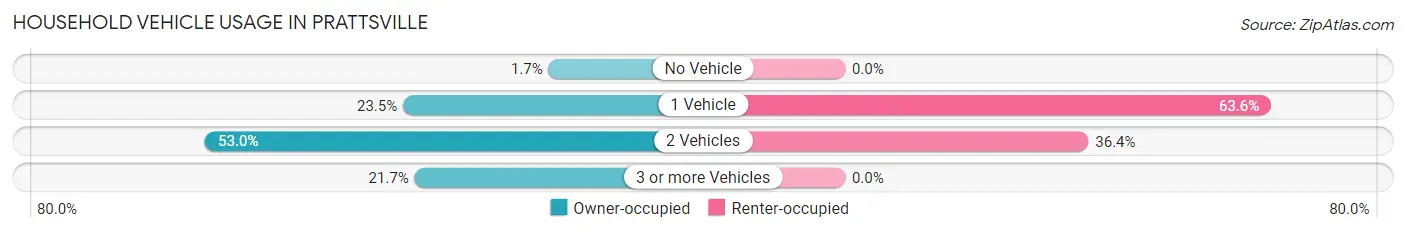
| Vehicles per Household | Owner-occupied | Renter-occupied |
| No Vehicle | 2 (1.7%) | 0 (0.0%) |
| 1 Vehicle | 27 (23.5%) | 7 (63.6%) |
| 2 Vehicles | 61 (53.0%) | 4 (36.4%) |
| 3 or more Vehicles | 25 (21.7%) | 0 (0.0%) |
| Total | 115 (100.0%) | 11 (100.0%) |
Real Estate & Mortgages in Prattsville
Real Estate and Mortgage Overview in Prattsville
| Characteristic | Without Mortgage | With Mortgage |
| Housing Units | 63 | 52 |
| Median Property Value | - | - |
| Median Household Income | $43,239 | $5 |
| Monthly Housing Costs | $376 | $0 |
| Real Estate Taxes | $338 | $0 |
Property Value by Mortgage Status in Prattsville
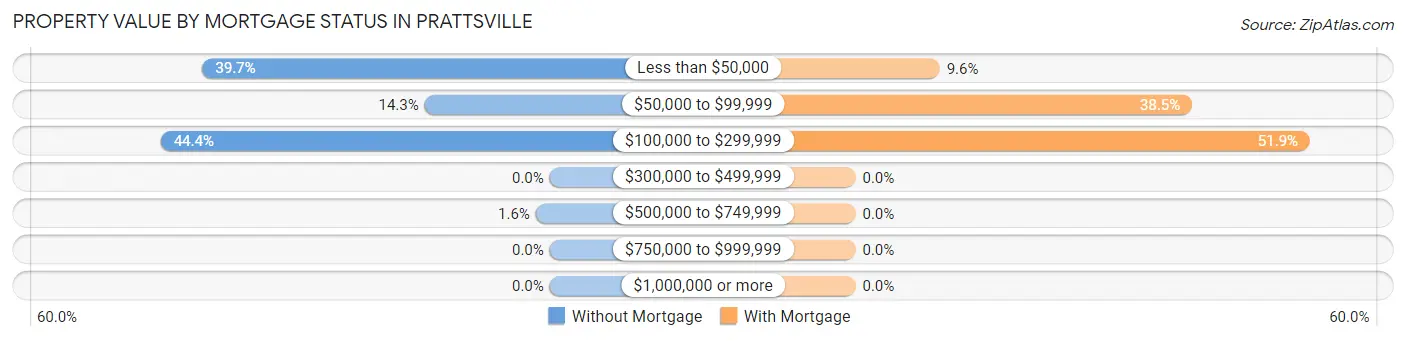
| Property Value | Without Mortgage | With Mortgage |
| Less than $50,000 | 25 (39.7%) | 5 (9.6%) |
| $50,000 to $99,999 | 9 (14.3%) | 20 (38.5%) |
| $100,000 to $299,999 | 28 (44.4%) | 27 (51.9%) |
| $300,000 to $499,999 | 0 (0.0%) | 0 (0.0%) |
| $500,000 to $749,999 | 1 (1.6%) | 0 (0.0%) |
| $750,000 to $999,999 | 0 (0.0%) | 0 (0.0%) |
| $1,000,000 or more | 0 (0.0%) | 0 (0.0%) |
| Total | 63 (100.0%) | 52 (100.0%) |
Household Income by Mortgage Status in Prattsville
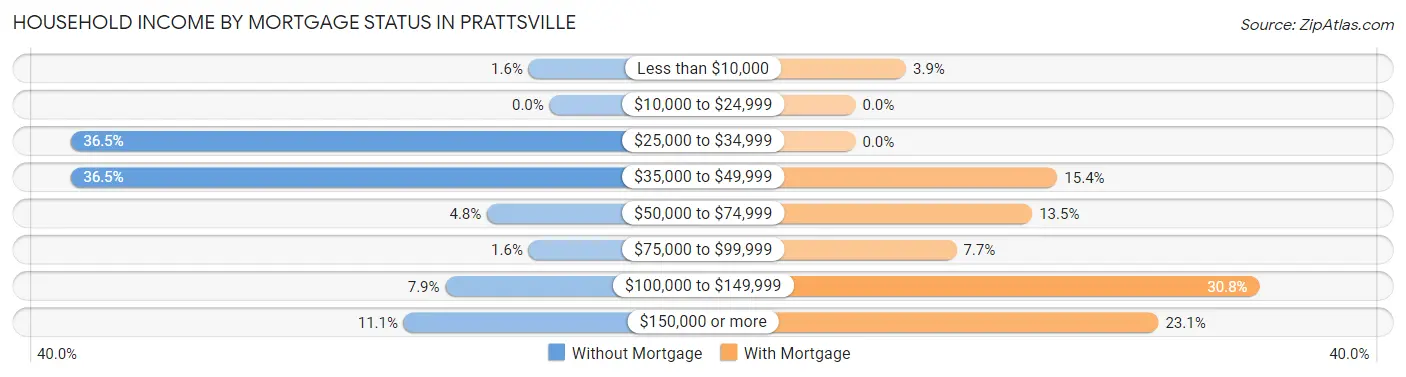
| Household Income | Without Mortgage | With Mortgage |
| Less than $10,000 | 1 (1.6%) | 2 (3.8%) |
| $10,000 to $24,999 | 0 (0.0%) | 0 (0.0%) |
| $25,000 to $34,999 | 23 (36.5%) | 0 (0.0%) |
| $35,000 to $49,999 | 23 (36.5%) | 8 (15.4%) |
| $50,000 to $74,999 | 3 (4.8%) | 7 (13.5%) |
| $75,000 to $99,999 | 1 (1.6%) | 4 (7.7%) |
| $100,000 to $149,999 | 5 (7.9%) | 16 (30.8%) |
| $150,000 or more | 7 (11.1%) | 12 (23.1%) |
| Total | 63 (100.0%) | 52 (100.0%) |
Property Value to Household Income Ratio in Prattsville
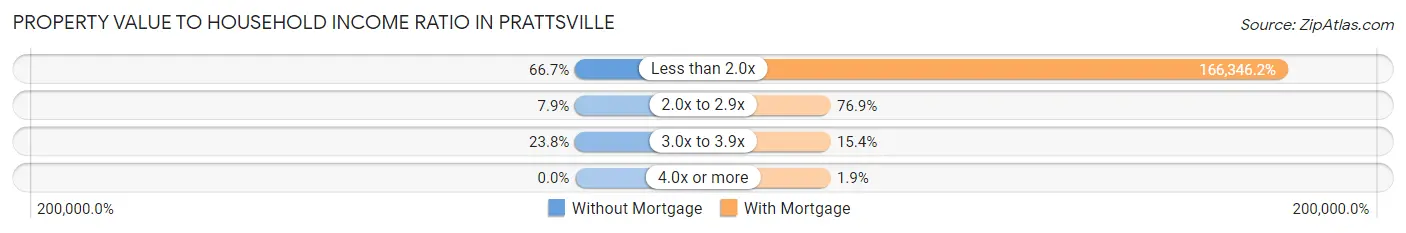
| Value-to-Income Ratio | Without Mortgage | With Mortgage |
| Less than 2.0x | 42 (66.7%) | 86,500 (166,346.1%) |
| 2.0x to 2.9x | 5 (7.9%) | 40 (76.9%) |
| 3.0x to 3.9x | 15 (23.8%) | 8 (15.4%) |
| 4.0x or more | 0 (0.0%) | 1 (1.9%) |
| Total | 63 (100.0%) | 52 (100.0%) |
Real Estate Taxes by Mortgage Status in Prattsville
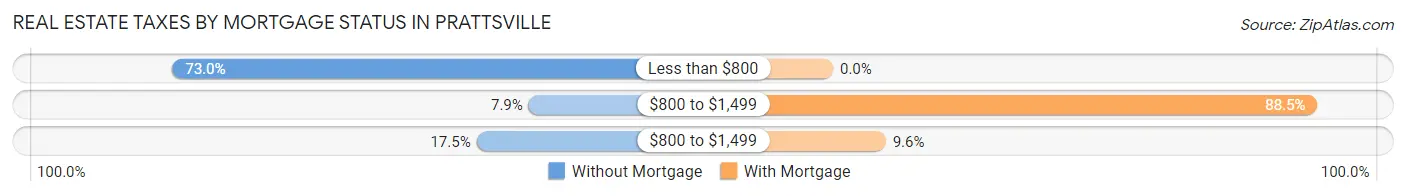
| Property Taxes | Without Mortgage | With Mortgage |
| Less than $800 | 46 (73.0%) | 0 (0.0%) |
| $800 to $1,499 | 5 (7.9%) | 46 (88.5%) |
| $800 to $1,499 | 11 (17.5%) | 5 (9.6%) |
| Total | 63 (100.0%) | 52 (100.0%) |
Health & Disability in Prattsville
Health Insurance Coverage by Age in Prattsville
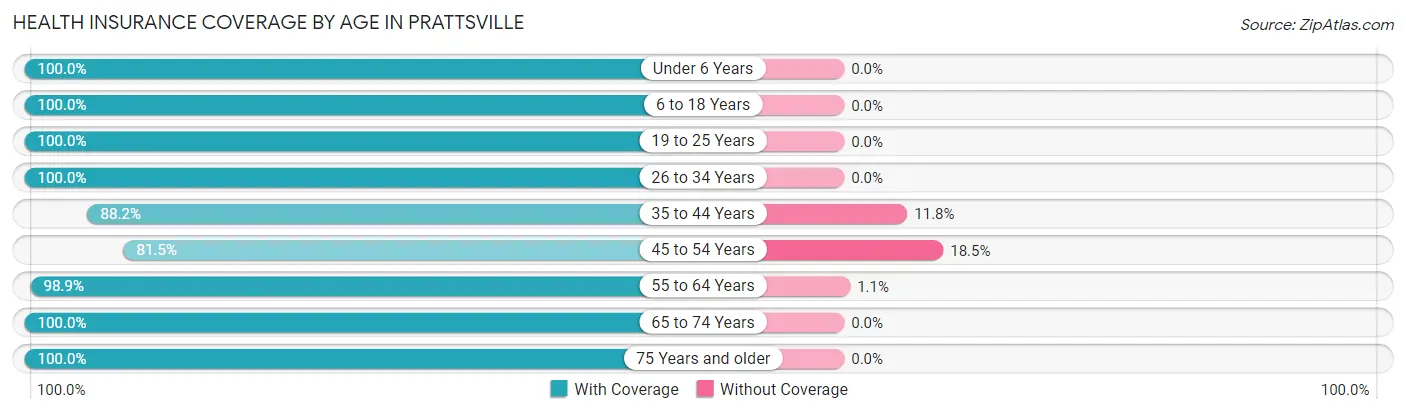
| Age Bracket | With Coverage | Without Coverage |
| Under 6 Years | 7 (100.0%) | 0 (0.0%) |
| 6 to 18 Years | 96 (100.0%) | 0 (0.0%) |
| 19 to 25 Years | 31 (100.0%) | 0 (0.0%) |
| 26 to 34 Years | 46 (100.0%) | 0 (0.0%) |
| 35 to 44 Years | 15 (88.2%) | 2 (11.8%) |
| 45 to 54 Years | 53 (81.5%) | 12 (18.5%) |
| 55 to 64 Years | 89 (98.9%) | 1 (1.1%) |
| 65 to 74 Years | 33 (100.0%) | 0 (0.0%) |
| 75 Years and older | 19 (100.0%) | 0 (0.0%) |
| Total | 389 (96.3%) | 15 (3.7%) |
Health Insurance Coverage by Citizenship Status in Prattsville
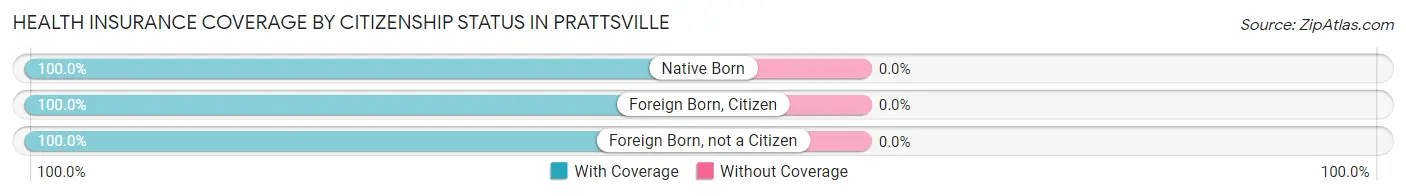
| Citizenship Status | With Coverage | Without Coverage |
| Native Born | 7 (100.0%) | 0 (0.0%) |
| Foreign Born, Citizen | 96 (100.0%) | 0 (0.0%) |
| Foreign Born, not a Citizen | 31 (100.0%) | 0 (0.0%) |
Health Insurance Coverage by Household Income in Prattsville
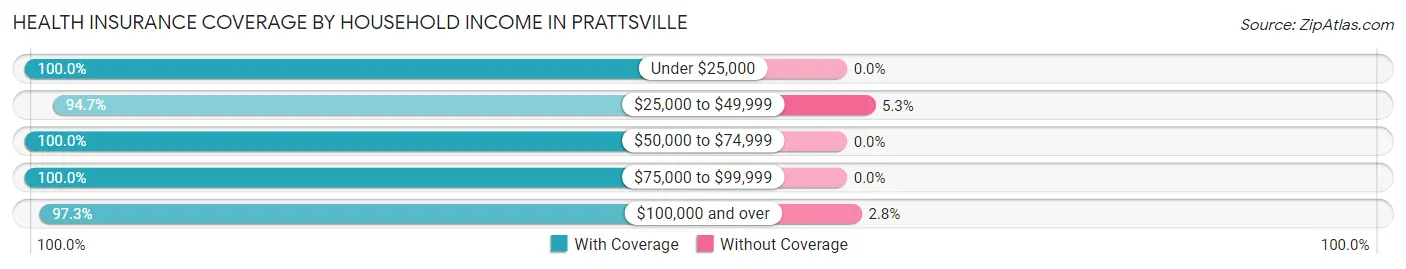
| Household Income | With Coverage | Without Coverage |
| Under $25,000 | 8 (100.0%) | 0 (0.0%) |
| $25,000 to $49,999 | 215 (94.7%) | 12 (5.3%) |
| $50,000 to $74,999 | 12 (100.0%) | 0 (0.0%) |
| $75,000 to $99,999 | 48 (100.0%) | 0 (0.0%) |
| $100,000 and over | 106 (97.3%) | 3 (2.8%) |
Public vs Private Health Insurance Coverage by Age in Prattsville
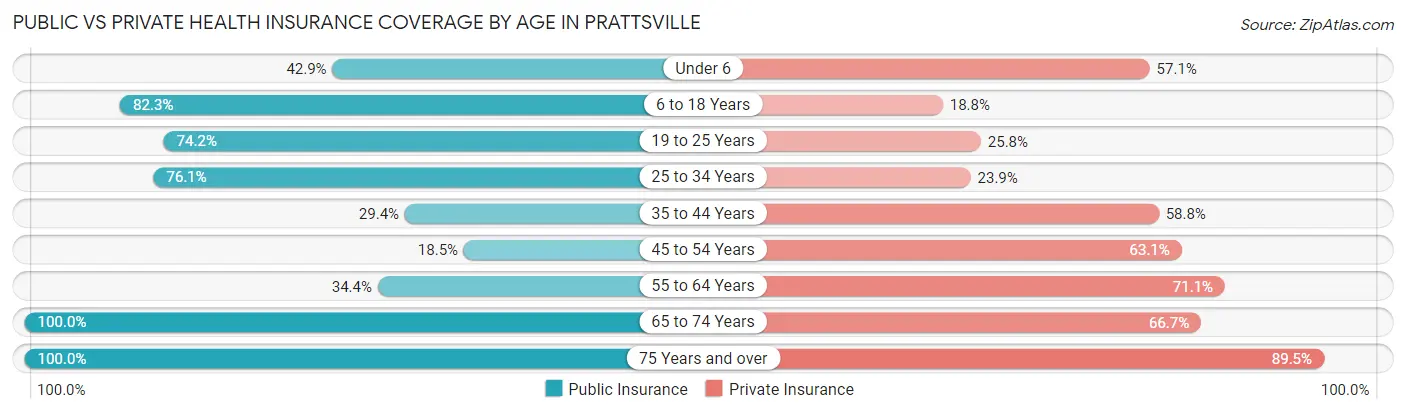
| Age Bracket | Public Insurance | Private Insurance |
| Under 6 | 3 (42.9%) | 4 (57.1%) |
| 6 to 18 Years | 79 (82.3%) | 18 (18.8%) |
| 19 to 25 Years | 23 (74.2%) | 8 (25.8%) |
| 25 to 34 Years | 35 (76.1%) | 11 (23.9%) |
| 35 to 44 Years | 5 (29.4%) | 10 (58.8%) |
| 45 to 54 Years | 12 (18.5%) | 41 (63.1%) |
| 55 to 64 Years | 31 (34.4%) | 64 (71.1%) |
| 65 to 74 Years | 33 (100.0%) | 22 (66.7%) |
| 75 Years and over | 19 (100.0%) | 17 (89.5%) |
| Total | 240 (59.4%) | 195 (48.3%) |
Disability Status by Sex by Age in Prattsville
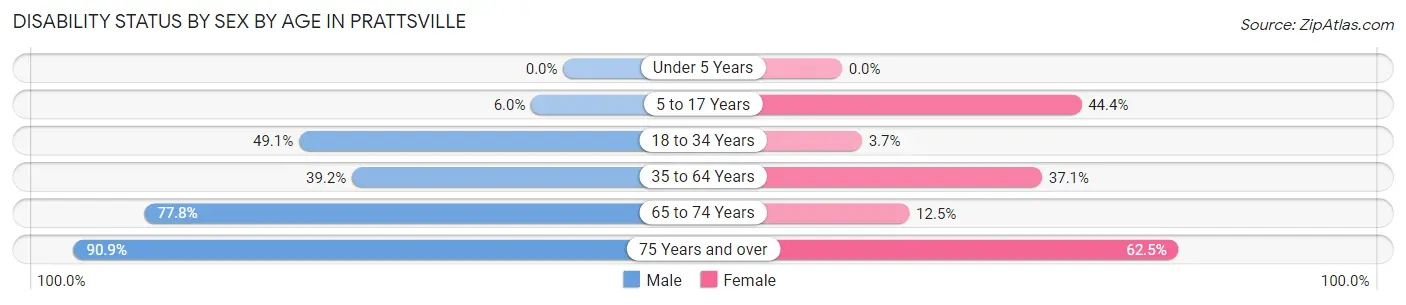
| Age Bracket | Male | Female |
| Under 5 Years | 0 (0.0%) | 0 (0.0%) |
| 5 to 17 Years | 5 (5.9%) | 4 (44.4%) |
| 18 to 34 Years | 26 (49.1%) | 1 (3.7%) |
| 35 to 64 Years | 40 (39.2%) | 26 (37.1%) |
| 65 to 74 Years | 7 (77.8%) | 3 (12.5%) |
| 75 Years and over | 10 (90.9%) | 5 (62.5%) |
Disability Class by Sex by Age in Prattsville
Disability Class: Hearing Difficulty
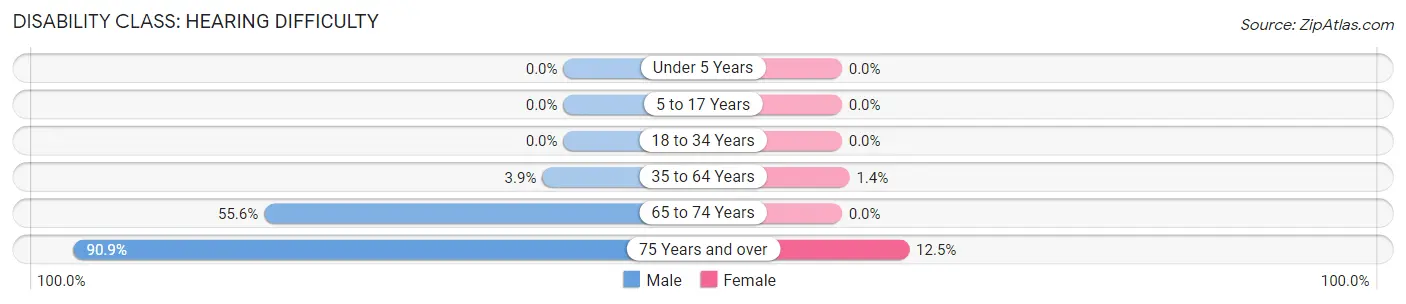
| Age Bracket | Male | Female |
| Under 5 Years | 0 (0.0%) | 0 (0.0%) |
| 5 to 17 Years | 0 (0.0%) | 0 (0.0%) |
| 18 to 34 Years | 0 (0.0%) | 0 (0.0%) |
| 35 to 64 Years | 4 (3.9%) | 1 (1.4%) |
| 65 to 74 Years | 5 (55.6%) | 0 (0.0%) |
| 75 Years and over | 10 (90.9%) | 1 (12.5%) |
Disability Class: Vision Difficulty
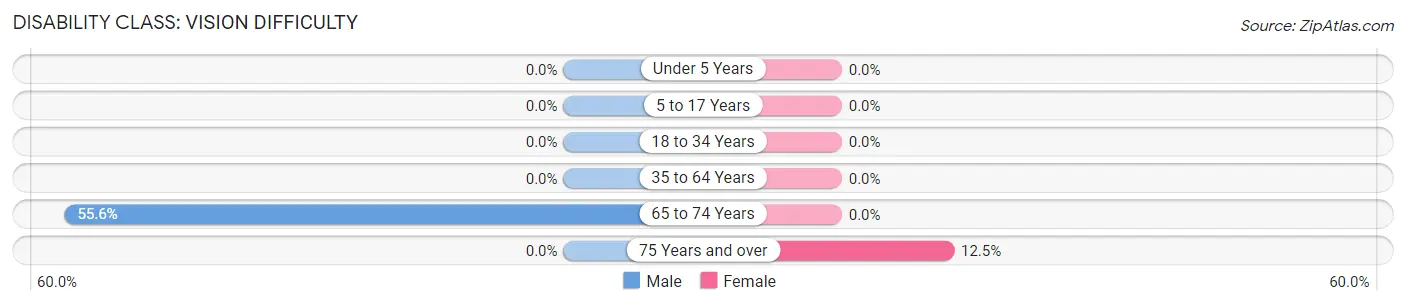
| Age Bracket | Male | Female |
| Under 5 Years | 0 (0.0%) | 0 (0.0%) |
| 5 to 17 Years | 0 (0.0%) | 0 (0.0%) |
| 18 to 34 Years | 0 (0.0%) | 0 (0.0%) |
| 35 to 64 Years | 0 (0.0%) | 0 (0.0%) |
| 65 to 74 Years | 5 (55.6%) | 0 (0.0%) |
| 75 Years and over | 0 (0.0%) | 1 (12.5%) |
Disability Class: Cognitive Difficulty
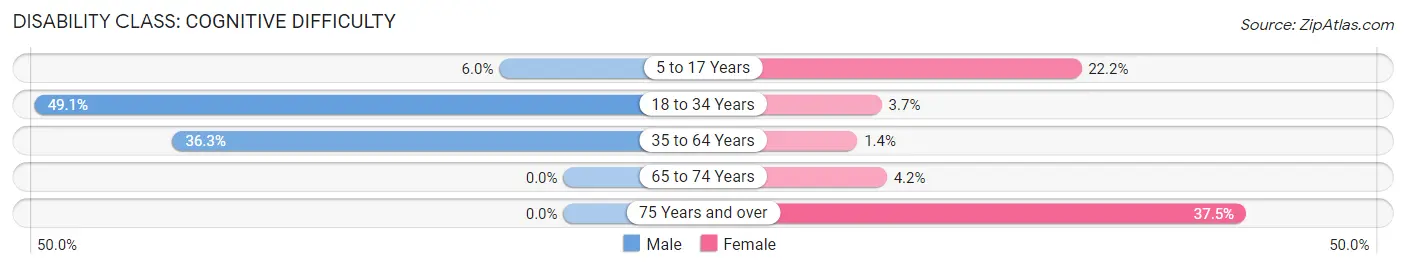
| Age Bracket | Male | Female |
| 5 to 17 Years | 5 (5.9%) | 2 (22.2%) |
| 18 to 34 Years | 26 (49.1%) | 1 (3.7%) |
| 35 to 64 Years | 37 (36.3%) | 1 (1.4%) |
| 65 to 74 Years | 0 (0.0%) | 1 (4.2%) |
| 75 Years and over | 0 (0.0%) | 3 (37.5%) |
Disability Class: Ambulatory Difficulty
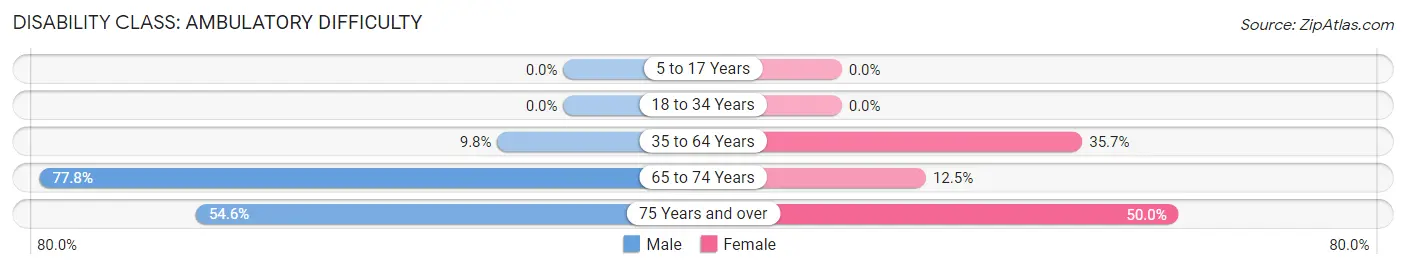
| Age Bracket | Male | Female |
| 5 to 17 Years | 0 (0.0%) | 0 (0.0%) |
| 18 to 34 Years | 0 (0.0%) | 0 (0.0%) |
| 35 to 64 Years | 10 (9.8%) | 25 (35.7%) |
| 65 to 74 Years | 7 (77.8%) | 3 (12.5%) |
| 75 Years and over | 6 (54.5%) | 4 (50.0%) |
Disability Class: Self-Care Difficulty
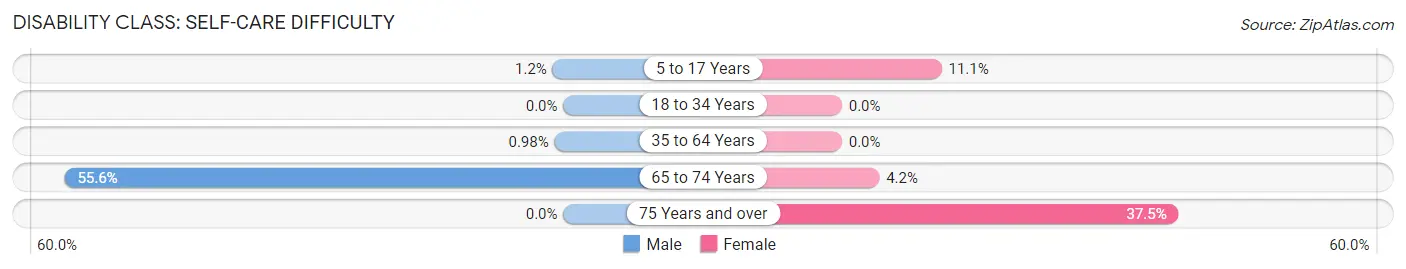
| Age Bracket | Male | Female |
| 5 to 17 Years | 1 (1.2%) | 1 (11.1%) |
| 18 to 34 Years | 0 (0.0%) | 0 (0.0%) |
| 35 to 64 Years | 1 (1.0%) | 0 (0.0%) |
| 65 to 74 Years | 5 (55.6%) | 1 (4.2%) |
| 75 Years and over | 0 (0.0%) | 3 (37.5%) |
Technology Access in Prattsville
Computing Device Access in Prattsville
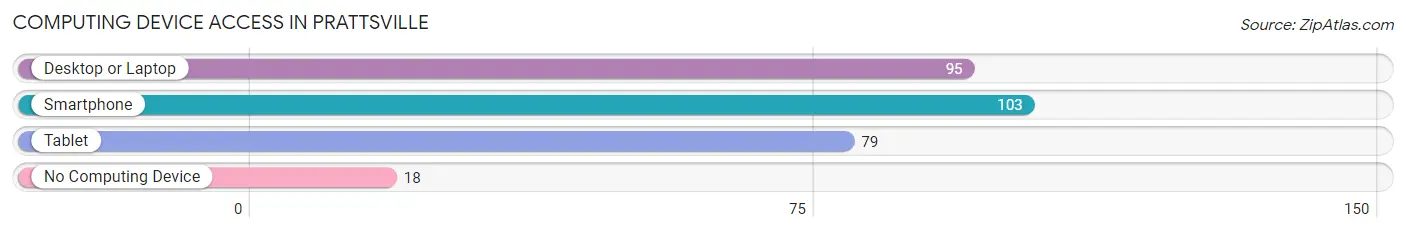
| Device Type | # Households | % Households |
| Desktop or Laptop | 95 | 75.4% |
| Smartphone | 103 | 81.8% |
| Tablet | 79 | 62.7% |
| No Computing Device | 18 | 14.3% |
| Total | 126 | 100.0% |
Internet Access in Prattsville
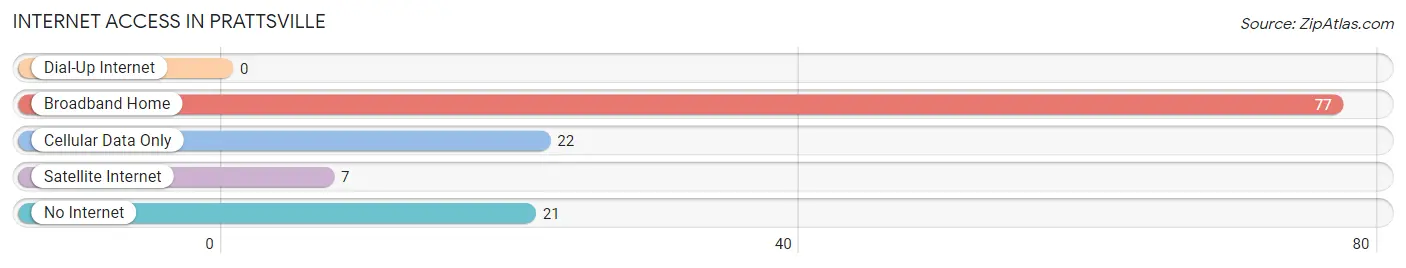
| Internet Type | # Households | % Households |
| Dial-Up Internet | 0 | 0.0% |
| Broadband Home | 77 | 61.1% |
| Cellular Data Only | 22 | 17.5% |
| Satellite Internet | 7 | 5.6% |
| No Internet | 21 | 16.7% |
| Total | 126 | 100.0% |
Prattsville Summary
Prattsville, Arkansas is a small town located in Grant County in the southwestern part of the state. It is situated on the banks of the Little Missouri River, and is surrounded by the Ouachita National Forest. The town was founded in 1872 by William Pratt, who named it after himself. It was incorporated in 1883.
History
The area around Prattsville was first settled in the early 1800s by settlers from the South. The town was founded in 1872 by William Pratt, who named it after himself. He was a former Confederate soldier who had moved to the area from Mississippi. He built a sawmill and a gristmill, and the town quickly grew. By 1883, the town had a population of over 500 people and was incorporated.
In the late 1800s, Prattsville was a thriving community with a variety of businesses, including a hotel, a bank, a newspaper, and a variety of stores. The town was also home to a number of churches, including the First Baptist Church, which was founded in 1883.
In the early 1900s, the town began to decline as the timber industry in the area began to decline. The Great Depression also had a negative impact on the town, and by the 1940s, the population had dropped to just over 200 people.
In the 1950s, the town began to experience a resurgence as the timber industry began to recover. The population grew to over 500 people by the 1960s.
Geography
Prattsville is located in Grant County in the southwestern part of the state. It is situated on the banks of the Little Missouri River, and is surrounded by the Ouachita National Forest. The town is located about 25 miles south of Hot Springs and about 50 miles northwest of Little Rock.
The town has a total area of 1.2 square miles, all of which is land. The terrain is mostly flat, with some rolling hills. The climate is humid subtropical, with hot, humid summers and mild winters.
Economy
The economy of Prattsville is largely based on the timber industry. The town is home to several sawmills and lumber companies, as well as a number of other businesses. The town also has a number of small retail stores and restaurants.
The town is also home to a number of small manufacturing companies, including a furniture factory and a plastics factory. The town also has a number of small farms, which produce a variety of crops, including corn, soybeans, and cotton.
Demographics
As of the 2010 census, the population of Prattsville was 845 people. The racial makeup of the town was 97.2% White, 0.6% African American, 0.2% Native American, 0.2% Asian, 0.2% from other races, and 1.8% from two or more races. Hispanic or Latino of any race were 1.2% of the population.
The median household income in Prattsville was $30,938, and the median family income was $37,500. The per capita income was $15,945. About 17.2% of the population was below the poverty line.
Common Questions
What is Per Capita Income in Prattsville?
Per Capita income in Prattsville is $27,429.
What is the Median Family Income in Prattsville?
Median Family Income in Prattsville is $81,250.
What is the Median Household income in Prattsville?
Median Household Income in Prattsville is $44,205.
What is Inequality or Gini Index in Prattsville?
Inequality or Gini Index in Prattsville is 0.44.
What is the Total Population of Prattsville?
Total Population of Prattsville is 404.
What is the Total Male Population of Prattsville?
Total Male Population of Prattsville is 263.
What is the Total Female Population of Prattsville?
Total Female Population of Prattsville is 141.
What is the Ratio of Males per 100 Females in Prattsville?
There are 186.52 Males per 100 Females in Prattsville.
What is the Ratio of Females per 100 Males in Prattsville?
There are 53.61 Females per 100 Males in Prattsville.
What is the Median Population Age in Prattsville?
Median Population Age in Prattsville is 45.4 Years.
What is the Average Family Size in Prattsville
Average Family Size in Prattsville is 3.8 People.
What is the Average Household Size in Prattsville
Average Household Size in Prattsville is 3.2 People.
How Large is the Labor Force in Prattsville?
There are 168 People in the Labor Forcein in Prattsville.
What is the Percentage of People in the Labor Force in Prattsville?
52.5% of People are in the Labor Force in Prattsville.
What is the Unemployment Rate in Prattsville?
Unemployment Rate in Prattsville is 10.7%.