Humnoke, AR Map & Demographics
Humnoke Map
Humnoke Overview
$24,579
PER CAPITA INCOME
$62,000
AVG FAMILY INCOME
$41,477
AVG HOUSEHOLD INCOME
46.4%
WAGE / INCOME GAP [ % ]
53.6¢/ $1
WAGE / INCOME GAP [ $ ]
0.34
INEQUALITY / GINI INDEX
135
TOTAL POPULATION
78
MALE POPULATION
57
FEMALE POPULATION
136.84
MALES / 100 FEMALES
73.08
FEMALES / 100 MALES
59.1
MEDIAN AGE
3.3
AVG FAMILY SIZE
2.2
AVG HOUSEHOLD SIZE
53
LABOR FORCE [ PEOPLE ]
46.5%
PERCENT IN LABOR FORCE
Humnoke Zip Codes
Humnoke Area Codes
Income in Humnoke
Income Overview in Humnoke
Per Capita Income in Humnoke is $24,579, while median incomes of families and households are $62,000 and $41,477 respectively.
| Characteristic | Number | Measure |
| Per Capita Income | 135 | $24,579 |
| Median Family Income | 30 | $62,000 |
| Mean Family Income | 30 | $69,977 |
| Median Household Income | 61 | $41,477 |
| Mean Household Income | 61 | $49,634 |
| Income Deficit | 30 | $0 |
| Wage / Income Gap (%) | 135 | 46.42% |
| Wage / Income Gap ($) | 135 | 53.58¢ per $1 |
| Gini / Inequality Index | 135 | 0.34 |
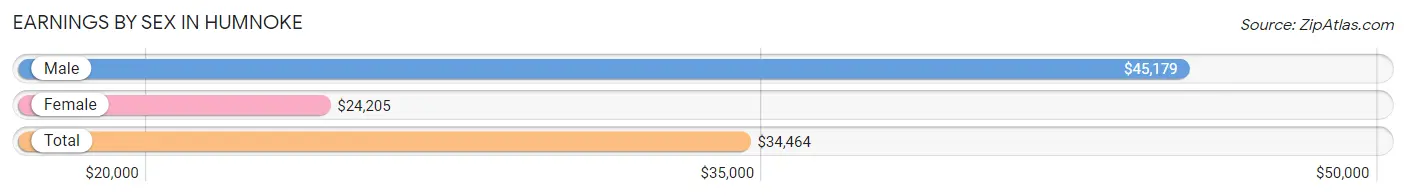
Earnings by Sex in Humnoke
Average Earnings in Humnoke are $34,464, $45,179 for men and $24,205 for women, a difference of 46.4%.
| Sex | Number | Average Earnings |
| Male | 31 (55.4%) | $45,179 |
| Female | 25 (44.6%) | $24,205 |
| Total | 56 (100.0%) | $34,464 |
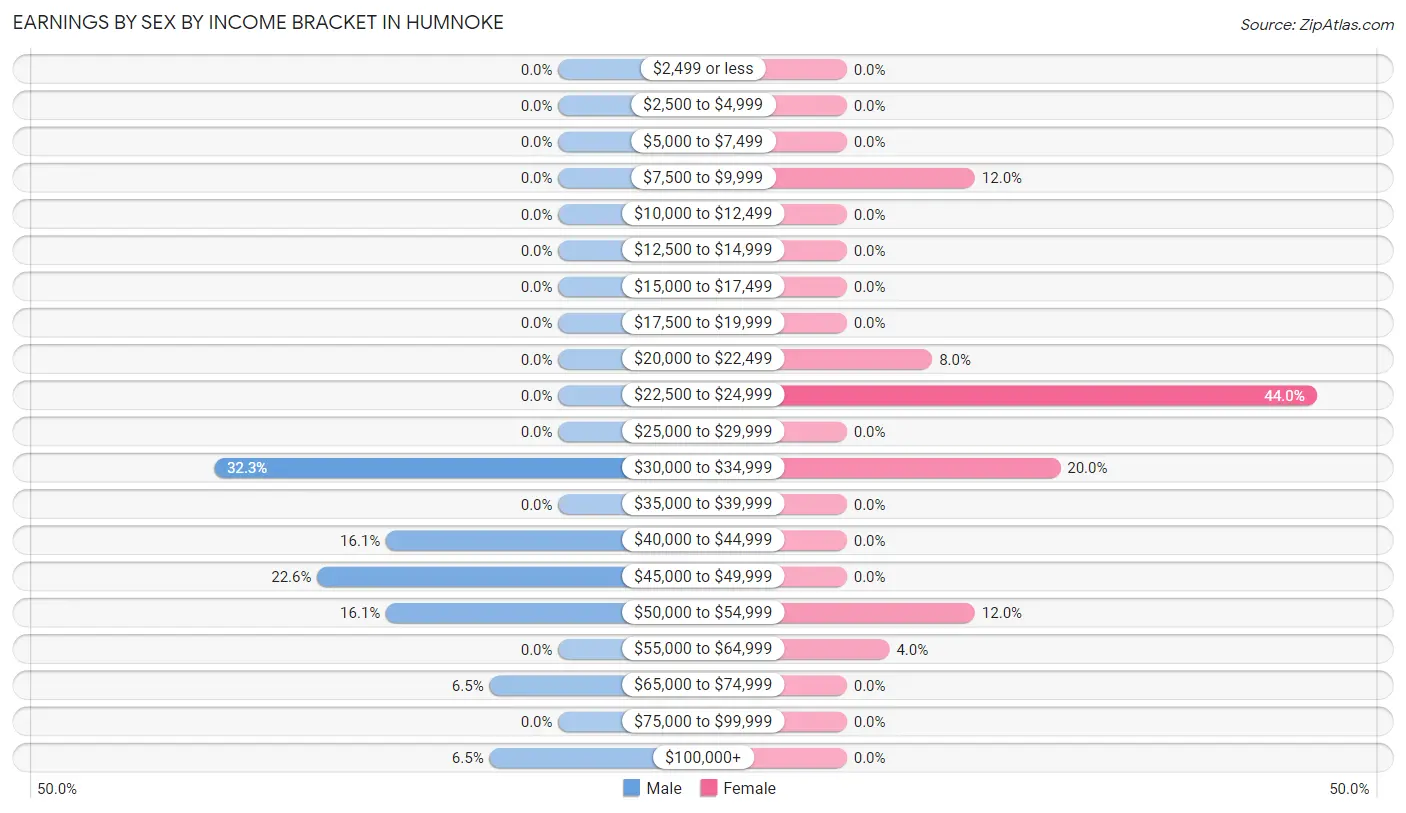
Earnings by Sex by Income Bracket in Humnoke
The most common earnings brackets in Humnoke are $30,000 to $34,999 for men (10 | 32.3%) and $22,500 to $24,999 for women (11 | 44.0%).
| Income | Male | Female |
| $2,499 or less | 0 (0.0%) | 0 (0.0%) |
| $2,500 to $4,999 | 0 (0.0%) | 0 (0.0%) |
| $5,000 to $7,499 | 0 (0.0%) | 0 (0.0%) |
| $7,500 to $9,999 | 0 (0.0%) | 3 (12.0%) |
| $10,000 to $12,499 | 0 (0.0%) | 0 (0.0%) |
| $12,500 to $14,999 | 0 (0.0%) | 0 (0.0%) |
| $15,000 to $17,499 | 0 (0.0%) | 0 (0.0%) |
| $17,500 to $19,999 | 0 (0.0%) | 0 (0.0%) |
| $20,000 to $22,499 | 0 (0.0%) | 2 (8.0%) |
| $22,500 to $24,999 | 0 (0.0%) | 11 (44.0%) |
| $25,000 to $29,999 | 0 (0.0%) | 0 (0.0%) |
| $30,000 to $34,999 | 10 (32.3%) | 5 (20.0%) |
| $35,000 to $39,999 | 0 (0.0%) | 0 (0.0%) |
| $40,000 to $44,999 | 5 (16.1%) | 0 (0.0%) |
| $45,000 to $49,999 | 7 (22.6%) | 0 (0.0%) |
| $50,000 to $54,999 | 5 (16.1%) | 3 (12.0%) |
| $55,000 to $64,999 | 0 (0.0%) | 1 (4.0%) |
| $65,000 to $74,999 | 2 (6.5%) | 0 (0.0%) |
| $75,000 to $99,999 | 0 (0.0%) | 0 (0.0%) |
| $100,000+ | 2 (6.5%) | 0 (0.0%) |
| Total | 31 (100.0%) | 25 (100.0%) |
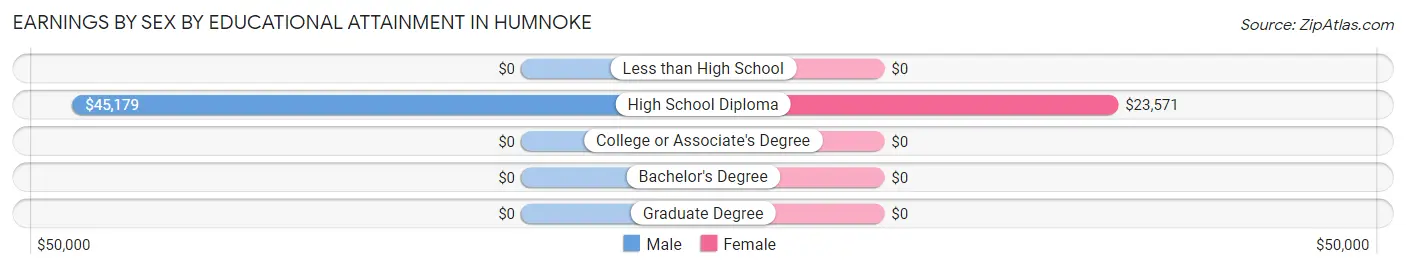
Earnings by Sex by Educational Attainment in Humnoke
Average earnings in Humnoke are $45,179 for men and $24,205 for women, a difference of 46.4%. Men with an educational attainment of high school diploma enjoy the highest average annual earnings of $45,179, while those with high school diploma education earn the least with $45,179. Women with an educational attainment of high school diploma earn the most with the average annual earnings of $23,571, while those with high school diploma education have the smallest earnings of $23,571.
| Educational Attainment | Male Income | Female Income |
| Less than High School | - | - |
| High School Diploma | $45,179 | $23,571 |
| College or Associate's Degree | - | - |
| Bachelor's Degree | - | - |
| Graduate Degree | - | - |
| Total | $45,179 | $24,205 |
Family Income in Humnoke
Family Income Brackets in Humnoke
According to the Humnoke family income data, there are 16 families falling into the $50,000 to $74,999 income range, which is the most common income bracket and makes up 53.3% of all families.
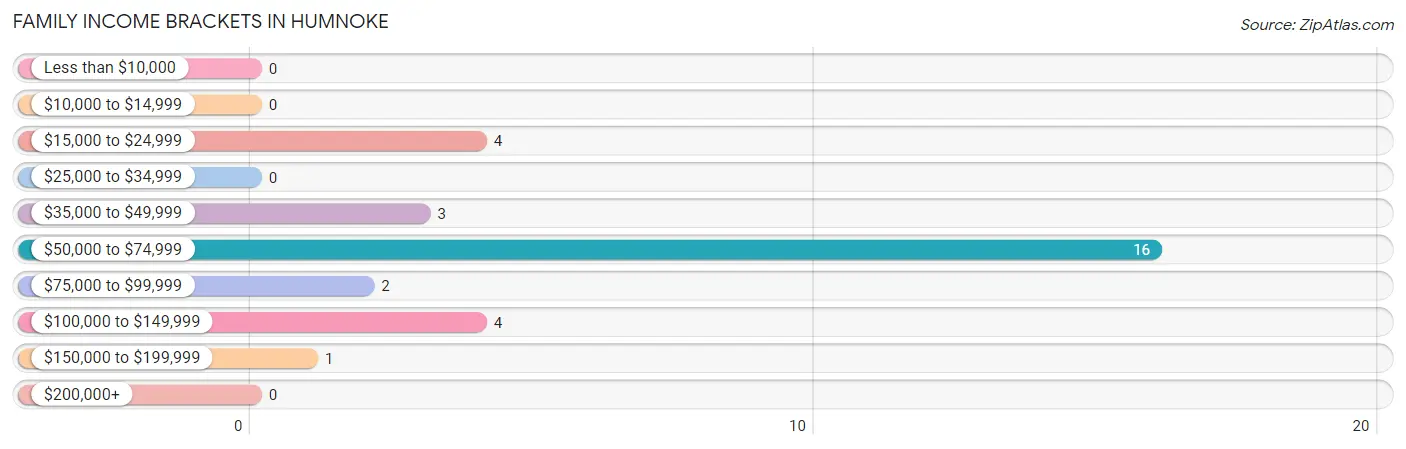
| Income Bracket | # Families | % Families |
| Less than $10,000 | 0 | 0.0% |
| $10,000 to $14,999 | 0 | 0.0% |
| $15,000 to $24,999 | 4 | 13.3% |
| $25,000 to $34,999 | 0 | 0.0% |
| $35,000 to $49,999 | 3 | 10.0% |
| $50,000 to $74,999 | 16 | 53.3% |
| $75,000 to $99,999 | 2 | 6.7% |
| $100,000 to $149,999 | 4 | 13.3% |
| $150,000 to $199,999 | 1 | 3.3% |
| $200,000+ | 0 | 0.0% |
Family Income by Famaliy Size in Humnoke
2-person families (16 | 53.3%) account for the highest median family income in Humnoke with $56,250 per family, while 2-person families (16 | 53.3%) have the highest median income of $28,125 per family member.
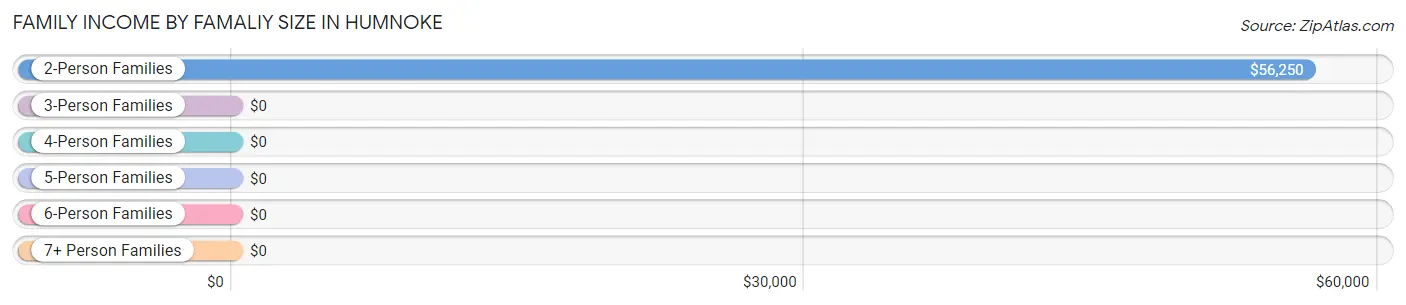
| Income Bracket | # Families | Median Income |
| 2-Person Families | 16 (53.3%) | $56,250 |
| 3-Person Families | 4 (13.3%) | $0 |
| 4-Person Families | 3 (10.0%) | $0 |
| 5-Person Families | 7 (23.3%) | $0 |
| 6-Person Families | 0 (0.0%) | $0 |
| 7+ Person Families | 0 (0.0%) | $0 |
| Total | 30 (100.0%) | $62,000 |
Family Income by Number of Earners in Humnoke
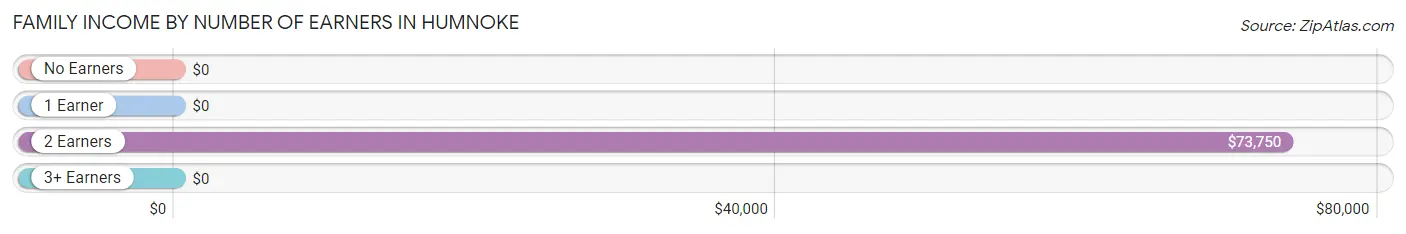
| Number of Earners | # Families | Median Income |
| No Earners | 8 (26.7%) | $0 |
| 1 Earner | 9 (30.0%) | $0 |
| 2 Earners | 13 (43.3%) | $73,750 |
| 3+ Earners | 0 (0.0%) | $0 |
| Total | 30 (100.0%) | $62,000 |
Household Income in Humnoke
Household Income Brackets in Humnoke
With 19 households falling in the category, the $50,000 to $74,999 income range is the most frequent in Humnoke, accounting for 31.1% of all households.
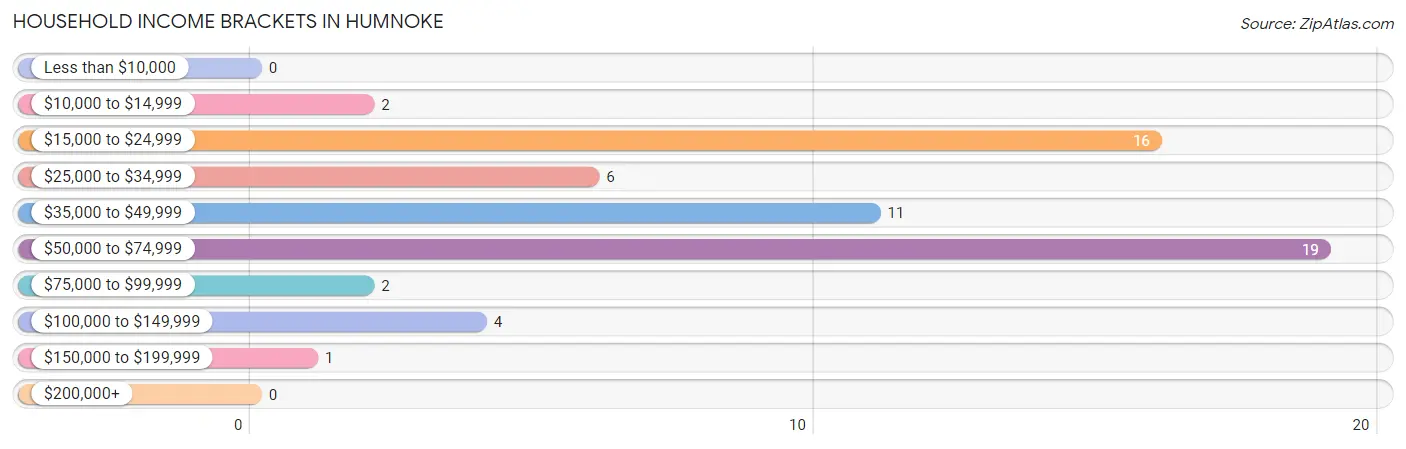
| Income Bracket | # Households | % Households |
| Less than $10,000 | 0 | 0.0% |
| $10,000 to $14,999 | 2 | 3.3% |
| $15,000 to $24,999 | 16 | 26.2% |
| $25,000 to $34,999 | 6 | 9.8% |
| $35,000 to $49,999 | 11 | 18.0% |
| $50,000 to $74,999 | 19 | 31.1% |
| $75,000 to $99,999 | 2 | 3.3% |
| $100,000 to $149,999 | 4 | 6.6% |
| $150,000 to $199,999 | 1 | 1.6% |
| $200,000+ | 0 | 0.0% |
Household Income by Householder Age in Humnoke
The median household income in Humnoke is $41,477, with the highest median household income of $34,750 found in the 45 to 64 years age bracket for the primary householder. A total of 13 households (21.3%) fall into this category.
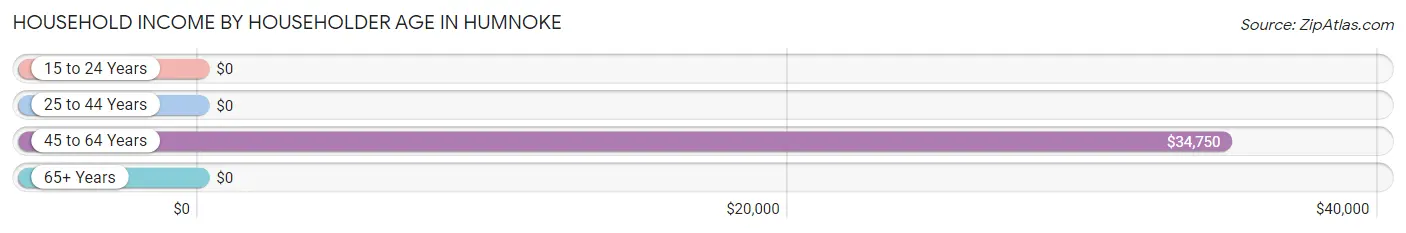
| Income Bracket | # Households | Median Income |
| 15 to 24 Years | 0 (0.0%) | $0 |
| 25 to 44 Years | 16 (26.2%) | $0 |
| 45 to 64 Years | 13 (21.3%) | $34,750 |
| 65+ Years | 32 (52.5%) | $0 |
| Total | 61 (100.0%) | $41,477 |
Poverty in Humnoke
Income Below Poverty by Sex and Age in Humnoke
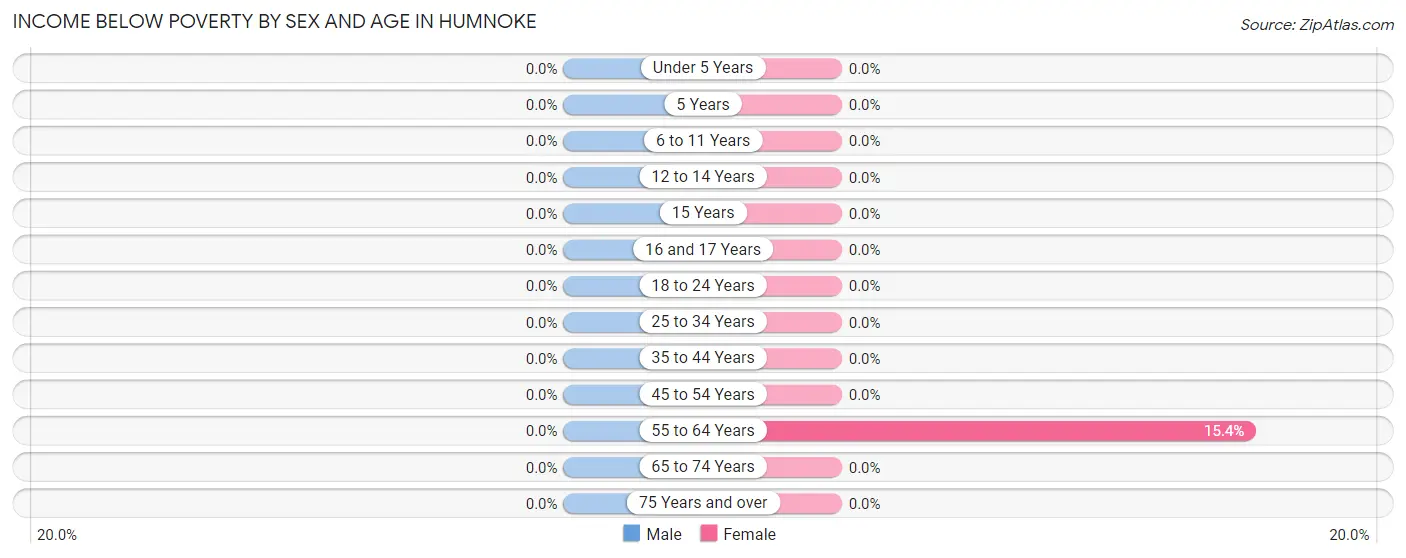
| Age Bracket | Male | Female |
| Under 5 Years | 0 (0.0%) | 0 (0.0%) |
| 5 Years | 0 (0.0%) | 0 (0.0%) |
| 6 to 11 Years | 0 (0.0%) | 0 (0.0%) |
| 12 to 14 Years | 0 (0.0%) | 0 (0.0%) |
| 15 Years | 0 (0.0%) | 0 (0.0%) |
| 16 and 17 Years | 0 (0.0%) | 0 (0.0%) |
| 18 to 24 Years | 0 (0.0%) | 0 (0.0%) |
| 25 to 34 Years | 0 (0.0%) | 0 (0.0%) |
| 35 to 44 Years | 0 (0.0%) | 0 (0.0%) |
| 45 to 54 Years | 0 (0.0%) | 0 (0.0%) |
| 55 to 64 Years | 0 (0.0%) | 2 (15.4%) |
| 65 to 74 Years | 0 (0.0%) | 0 (0.0%) |
| 75 Years and over | 0 (0.0%) | 0 (0.0%) |
| Total | 0 (0.0%) | 2 (3.5%) |
Income Above Poverty by Sex and Age in Humnoke
According to the poverty statistics in Humnoke, males aged 5 years and females aged 6 to 11 years are the age groups that are most secure financially, with 100.0% of males and 100.0% of females in these age groups living above the poverty line.
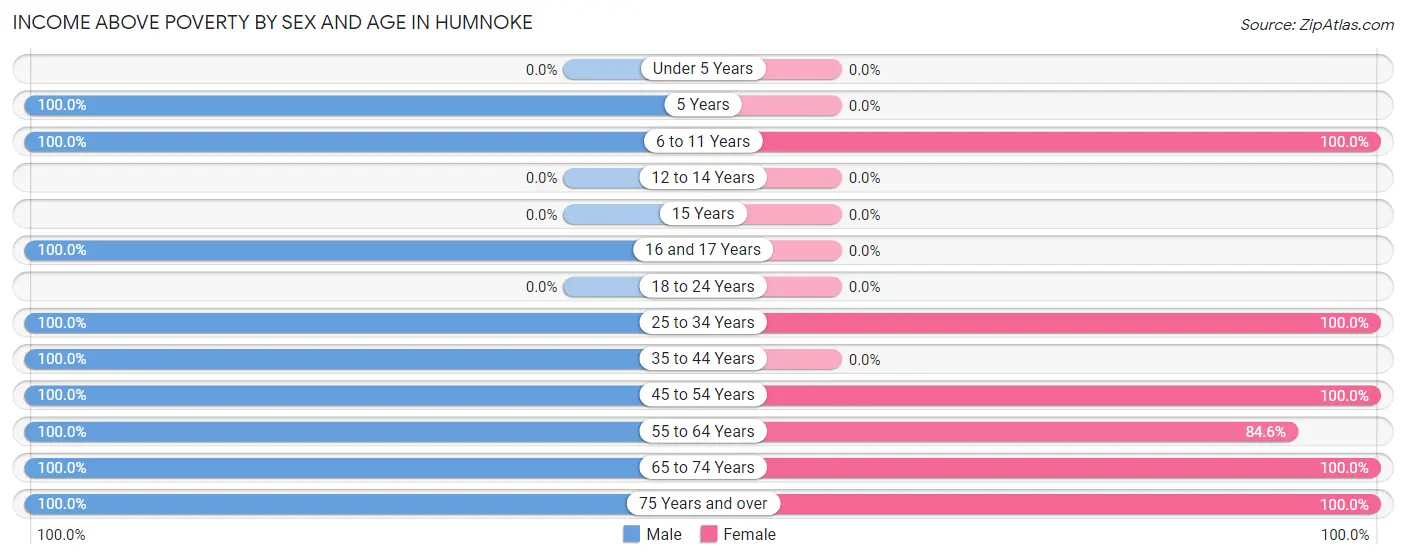
| Age Bracket | Male | Female |
| Under 5 Years | 0 (0.0%) | 0 (0.0%) |
| 5 Years | 3 (100.0%) | 0 (0.0%) |
| 6 to 11 Years | 14 (100.0%) | 4 (100.0%) |
| 12 to 14 Years | 0 (0.0%) | 0 (0.0%) |
| 15 Years | 0 (0.0%) | 0 (0.0%) |
| 16 and 17 Years | 10 (100.0%) | 0 (0.0%) |
| 18 to 24 Years | 0 (0.0%) | 0 (0.0%) |
| 25 to 34 Years | 10 (100.0%) | 10 (100.0%) |
| 35 to 44 Years | 7 (100.0%) | 0 (0.0%) |
| 45 to 54 Years | 5 (100.0%) | 2 (100.0%) |
| 55 to 64 Years | 7 (100.0%) | 11 (84.6%) |
| 65 to 74 Years | 6 (100.0%) | 7 (100.0%) |
| 75 Years and over | 16 (100.0%) | 21 (100.0%) |
| Total | 78 (100.0%) | 55 (96.5%) |
Income Below Poverty Among Married-Couple Families in Humnoke
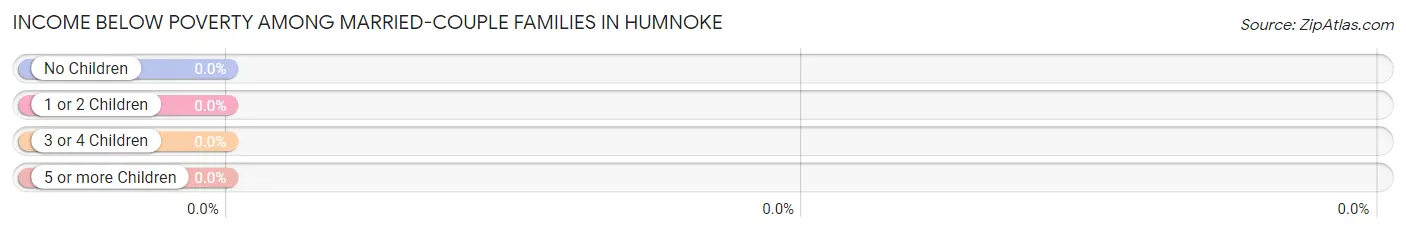
| Children | Above Poverty | Below Poverty |
| No Children | 20 (100.0%) | 0 (0.0%) |
| 1 or 2 Children | 3 (100.0%) | 0 (0.0%) |
| 3 or 4 Children | 7 (100.0%) | 0 (0.0%) |
| 5 or more Children | 0 (0.0%) | 0 (0.0%) |
| Total | 30 (100.0%) | 0 (0.0%) |
Income Below Poverty Among Single-Parent Households in Humnoke
| Children | Single Father | Single Mother |
| No Children | 0 (0.0%) | 0 (0.0%) |
| 1 or 2 Children | 0 (0.0%) | 0 (0.0%) |
| 3 or 4 Children | 0 (0.0%) | 0 (0.0%) |
| 5 or more Children | 0 (0.0%) | 0 (0.0%) |
| Total | 0 (0.0%) | 0 (0.0%) |
Income Below Poverty Among Married-Couple vs Single-Parent Households in Humnoke
| Children | Married-Couple Families | Single-Parent Households |
| No Children | 0 (0.0%) | 0 (0.0%) |
| 1 or 2 Children | 0 (0.0%) | 0 (0.0%) |
| 3 or 4 Children | 0 (0.0%) | 0 (0.0%) |
| 5 or more Children | 0 (0.0%) | 0 (0.0%) |
| Total | 0 (0.0%) | 0 (0.0%) |
Race in Humnoke
The most populous races in Humnoke are , and White / Caucasian (135 | 100.0%).
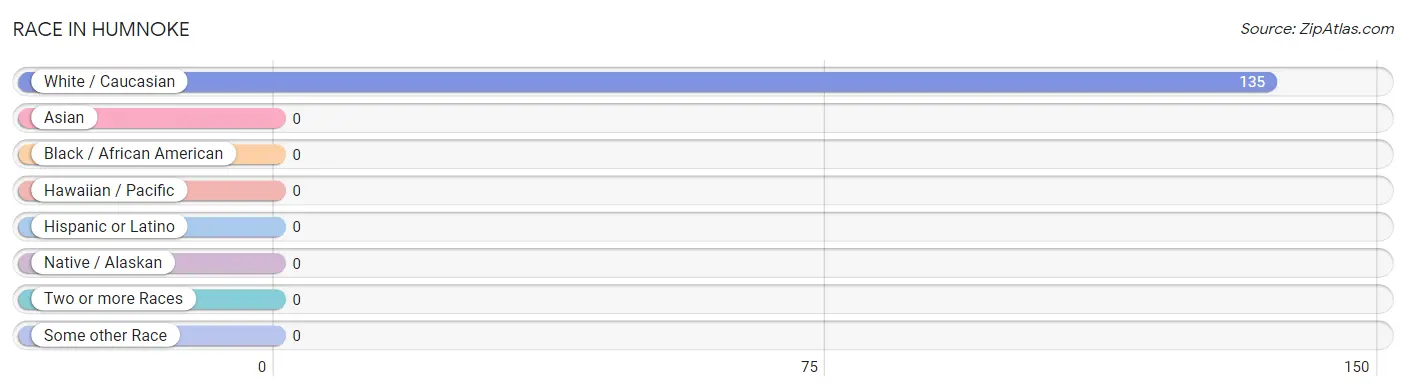
| Race | # Population | % Population |
| Asian | 0 | 0.0% |
| Black / African American | 0 | 0.0% |
| Hawaiian / Pacific | 0 | 0.0% |
| Hispanic or Latino | 0 | 0.0% |
| Native / Alaskan | 0 | 0.0% |
| White / Caucasian | 135 | 100.0% |
| Two or more Races | 0 | 0.0% |
| Some other Race | 0 | 0.0% |
| Total | 135 | 100.0% |
Ancestry in Humnoke
The most populous ancestries reported in Humnoke are Irish (24 | 17.8%), English (21 | 15.6%), and American (2 | 1.5%), together accounting for 34.8% of all Humnoke residents.
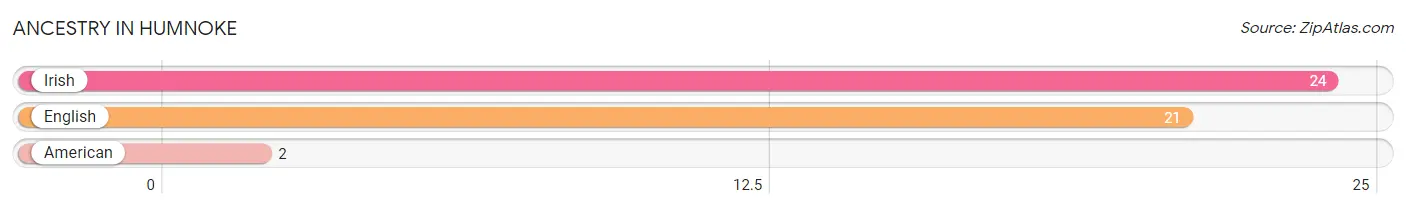
| Ancestry | # Population | % Population |
| American | 2 | 1.5% |
| English | 21 | 15.6% |
| Irish | 24 | 17.8% | View All 3 Rows |
Immigrants in Humnoke

| Immigration Origin | # Population | % Population | View All 0 Rows |
Sex and Age in Humnoke
Sex and Age in Humnoke
The most populous age groups in Humnoke are 5 to 9 Years (17 | 21.8%) for men and 80 to 84 Years (12 | 21.0%) for women.
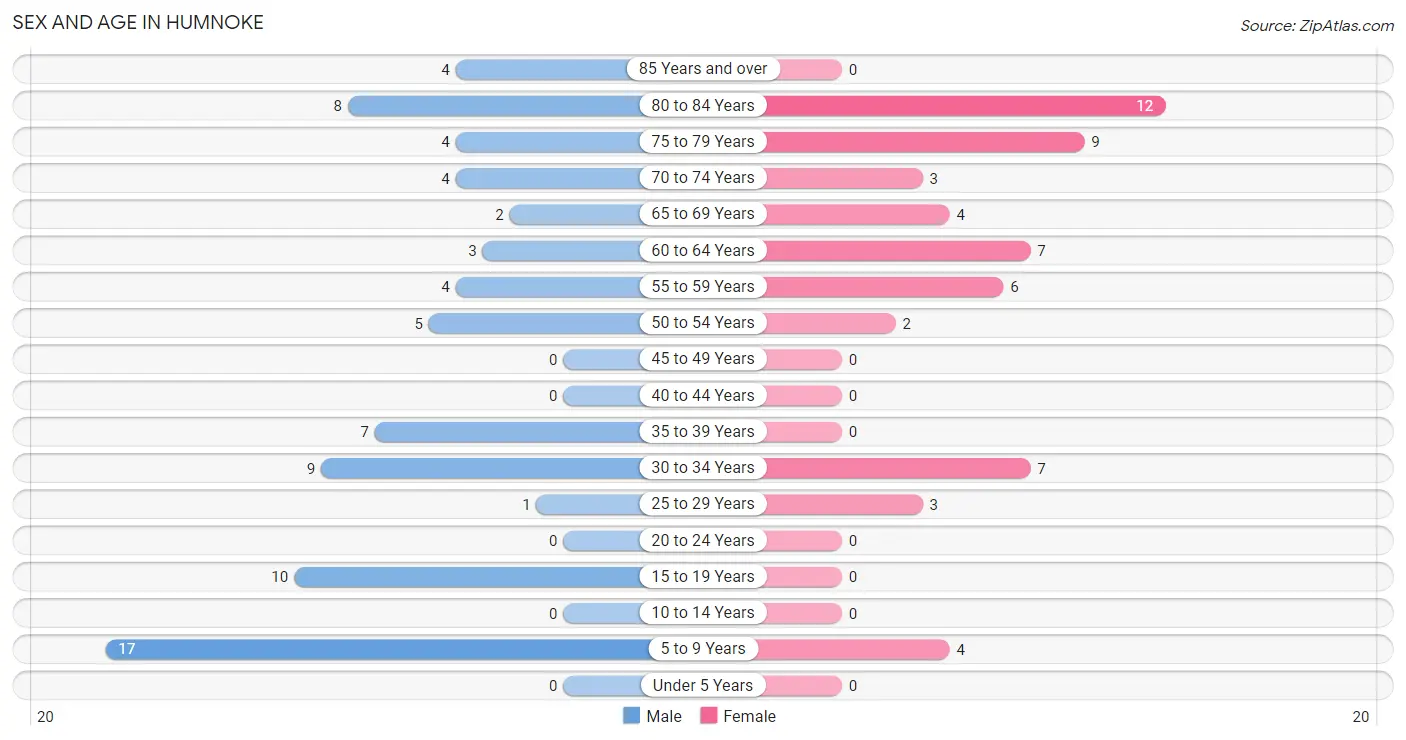
| Age Bracket | Male | Female |
| Under 5 Years | 0 (0.0%) | 0 (0.0%) |
| 5 to 9 Years | 17 (21.8%) | 4 (7.0%) |
| 10 to 14 Years | 0 (0.0%) | 0 (0.0%) |
| 15 to 19 Years | 10 (12.8%) | 0 (0.0%) |
| 20 to 24 Years | 0 (0.0%) | 0 (0.0%) |
| 25 to 29 Years | 1 (1.3%) | 3 (5.3%) |
| 30 to 34 Years | 9 (11.5%) | 7 (12.3%) |
| 35 to 39 Years | 7 (9.0%) | 0 (0.0%) |
| 40 to 44 Years | 0 (0.0%) | 0 (0.0%) |
| 45 to 49 Years | 0 (0.0%) | 0 (0.0%) |
| 50 to 54 Years | 5 (6.4%) | 2 (3.5%) |
| 55 to 59 Years | 4 (5.1%) | 6 (10.5%) |
| 60 to 64 Years | 3 (3.8%) | 7 (12.3%) |
| 65 to 69 Years | 2 (2.6%) | 4 (7.0%) |
| 70 to 74 Years | 4 (5.1%) | 3 (5.3%) |
| 75 to 79 Years | 4 (5.1%) | 9 (15.8%) |
| 80 to 84 Years | 8 (10.3%) | 12 (21.0%) |
| 85 Years and over | 4 (5.1%) | 0 (0.0%) |
| Total | 78 (100.0%) | 57 (100.0%) |
Families and Households in Humnoke
Median Family Size in Humnoke
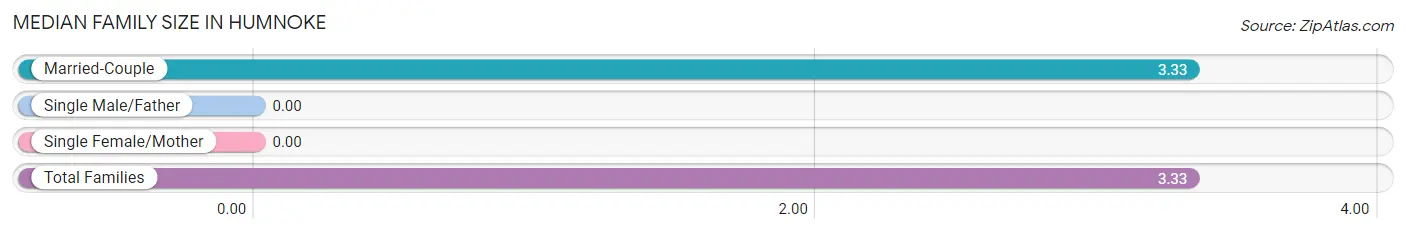
| Family Type | # Families | Family Size |
| Married-Couple | 30 (100.0%) | 3.33 |
| Single Male/Father | 0 (0.0%) | - |
| Single Female/Mother | 0 (0.0%) | - |
| Total Families | 30 (100.0%) | 3.33 |
Median Household Size in Humnoke
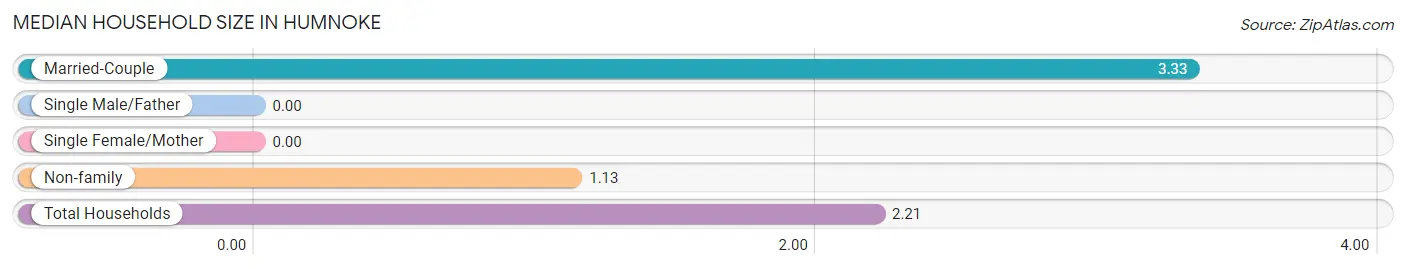
| Household Type | # Households | Household Size |
| Married-Couple | 30 (49.2%) | 3.33 |
| Single Male/Father | 0 (0.0%) | - |
| Single Female/Mother | 0 (0.0%) | - |
| Non-family | 31 (50.8%) | 1.13 |
| Total Households | 61 (100.0%) | 2.21 |
Household Size by Marriage Status in Humnoke
Out of a total of 61 households in Humnoke, 30 (49.2%) are family households, while 31 (50.8%) are nonfamily households. The most numerous type of family households are 2-person households, comprising 16, and the most common type of nonfamily households are 1-person households, comprising 28.
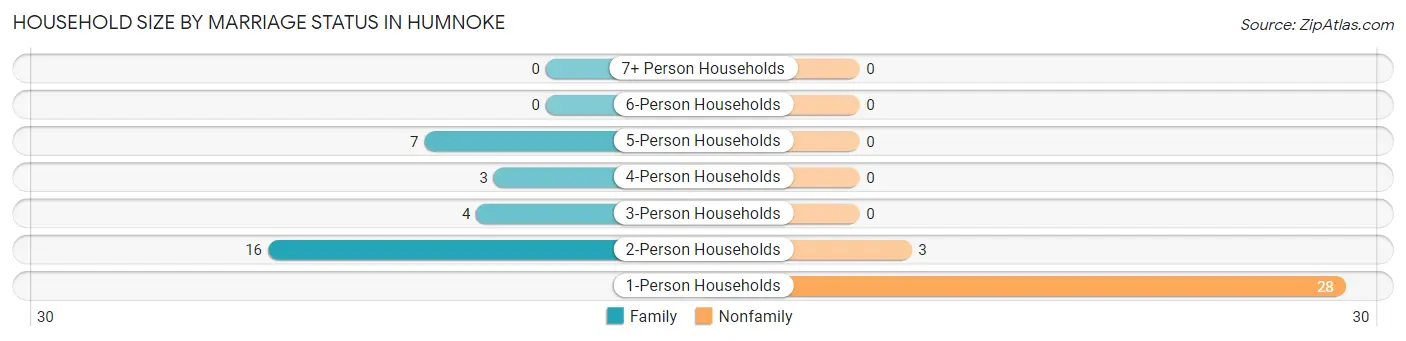
| Household Size | Family Households | Nonfamily Households |
| 1-Person Households | - | 28 (45.9%) |
| 2-Person Households | 16 (26.2%) | 3 (4.9%) |
| 3-Person Households | 4 (6.6%) | 0 (0.0%) |
| 4-Person Households | 3 (4.9%) | 0 (0.0%) |
| 5-Person Households | 7 (11.5%) | 0 (0.0%) |
| 6-Person Households | 0 (0.0%) | 0 (0.0%) |
| 7+ Person Households | 0 (0.0%) | 0 (0.0%) |
| Total | 30 (49.2%) | 31 (50.8%) |
Female Fertility in Humnoke
Fertility by Age in Humnoke
| Age Bracket | Women with Births | Births / 1,000 Women |
| 15 to 19 years | 0 (0.0%) | 0.0 |
| 20 to 34 years | 0 (0.0%) | 0.0 |
| 35 to 50 years | 0 (0.0%) | 0.0 |
| Total | 0 (0.0%) | 0.0 |
Fertility by Age by Marriage Status in Humnoke
| Age Bracket | Married | Unmarried |
| 15 to 19 years | 0 (0.0%) | 0 (0.0%) |
| 20 to 34 years | 0 (0.0%) | 0 (0.0%) |
| 35 to 50 years | 0 (0.0%) | 0 (0.0%) |
| Total | 0 (0.0%) | 0 (0.0%) |
Fertility by Education in Humnoke
| Educational Attainment | Women with Births | Births / 1,000 Women |
| Less than High School | 0 (0.0%) | 0.0 |
| High School Diploma | 0 (0.0%) | 0.0 |
| College or Associate's Degree | 0 (0.0%) | 0.0 |
| Bachelor's Degree | 0 (0.0%) | 0.0 |
| Graduate Degree | 0 (0.0%) | 0.0 |
| Total | 0 (0.0%) | 0.0 |
Fertility by Education by Marriage Status in Humnoke
| Educational Attainment | Married | Unmarried |
| Less than High School | 0 (0.0%) | 0 (0.0%) |
| High School Diploma | 0 (0.0%) | 0 (0.0%) |
| College or Associate's Degree | 0 (0.0%) | 0 (0.0%) |
| Bachelor's Degree | 0 (0.0%) | 0 (0.0%) |
| Graduate Degree | 0 (0.0%) | 0 (0.0%) |
| Total | 0 (0.0%) | 0 (0.0%) |
Employment Characteristics in Humnoke
Employment by Class of Employer in Humnoke
Among the 53 employed individuals in Humnoke, private company employees (22 | 41.5%), self-employed (not incorporated) (12 | 22.6%), and local government employees (7 | 13.2%) make up the most common classes of employment.
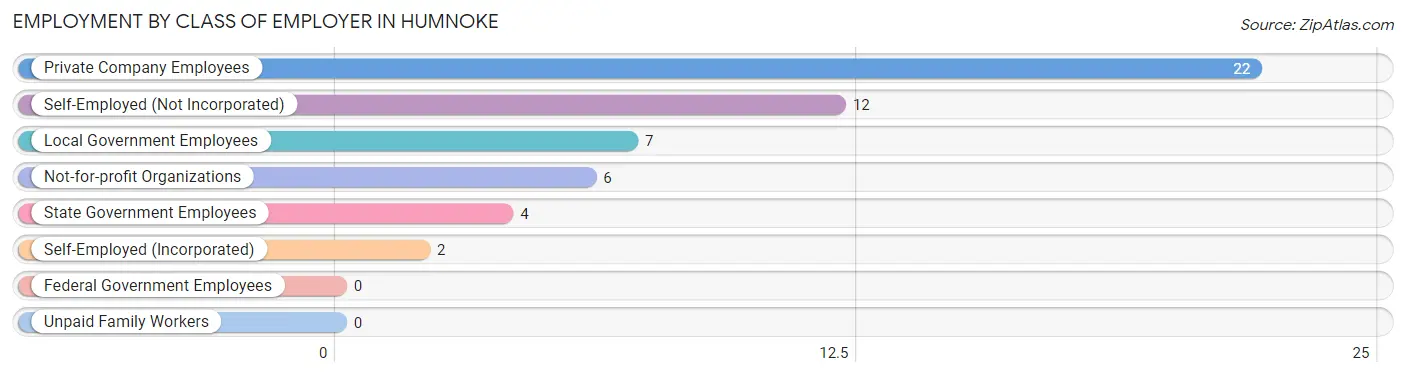
| Employer Class | # Employees | % Employees |
| Private Company Employees | 22 | 41.5% |
| Self-Employed (Incorporated) | 2 | 3.8% |
| Self-Employed (Not Incorporated) | 12 | 22.6% |
| Not-for-profit Organizations | 6 | 11.3% |
| Local Government Employees | 7 | 13.2% |
| State Government Employees | 4 | 7.5% |
| Federal Government Employees | 0 | 0.0% |
| Unpaid Family Workers | 0 | 0.0% |
| Total | 53 | 100.0% |
Employment Status by Age in Humnoke
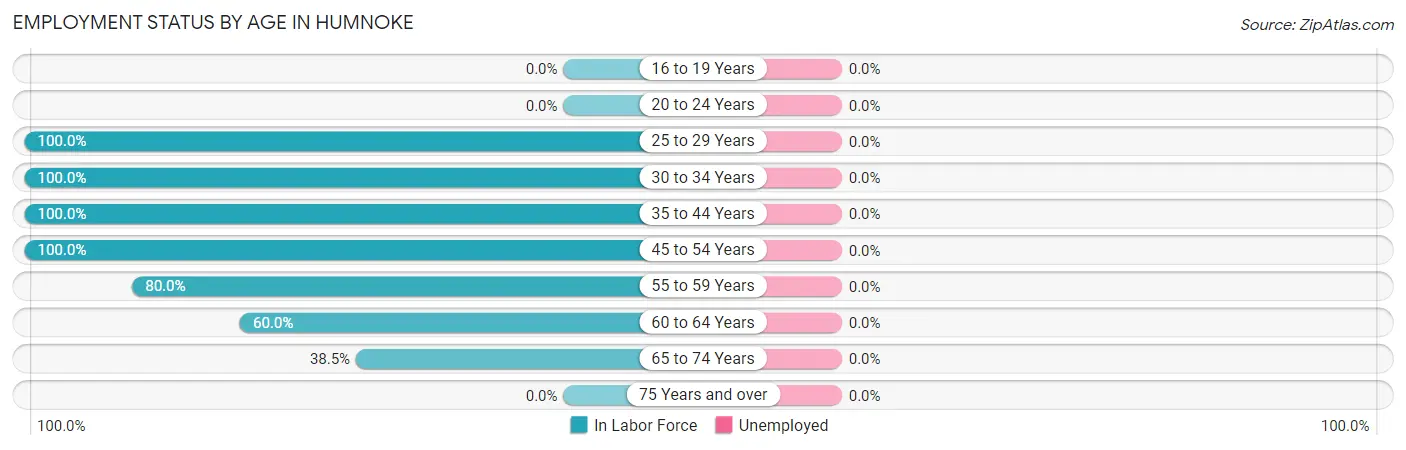
| Age Bracket | In Labor Force | Unemployed |
| 16 to 19 Years | 0 (0.0%) | 0 (0.0%) |
| 20 to 24 Years | 0 (0.0%) | 0 (0.0%) |
| 25 to 29 Years | 4 (100.0%) | 0 (0.0%) |
| 30 to 34 Years | 16 (100.0%) | 0 (0.0%) |
| 35 to 44 Years | 7 (100.0%) | 0 (0.0%) |
| 45 to 54 Years | 7 (100.0%) | 0 (0.0%) |
| 55 to 59 Years | 8 (80.0%) | 0 (0.0%) |
| 60 to 64 Years | 6 (60.0%) | 0 (0.0%) |
| 65 to 74 Years | 5 (38.5%) | 0 (0.0%) |
| 75 Years and over | 0 (0.0%) | 0 (0.0%) |
| Total | 53 (46.5%) | 0 (0.0%) |
Employment Status by Educational Attainment in Humnoke
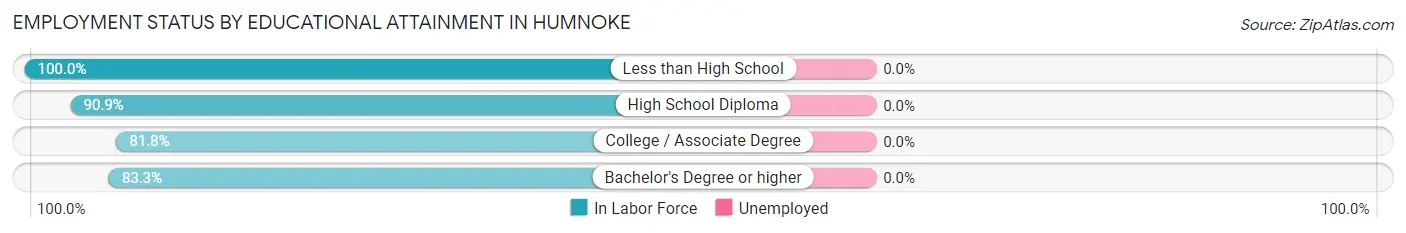
| Educational Attainment | In Labor Force | Unemployed |
| Less than High School | 4 (100.0%) | 0 (0.0%) |
| High School Diploma | 30 (90.9%) | 0 (0.0%) |
| College / Associate Degree | 9 (81.8%) | 0 (0.0%) |
| Bachelor's Degree or higher | 5 (83.3%) | 0 (0.0%) |
| Total | 48 (88.9%) | 0 (0.0%) |
Employment Occupations by Sex in Humnoke
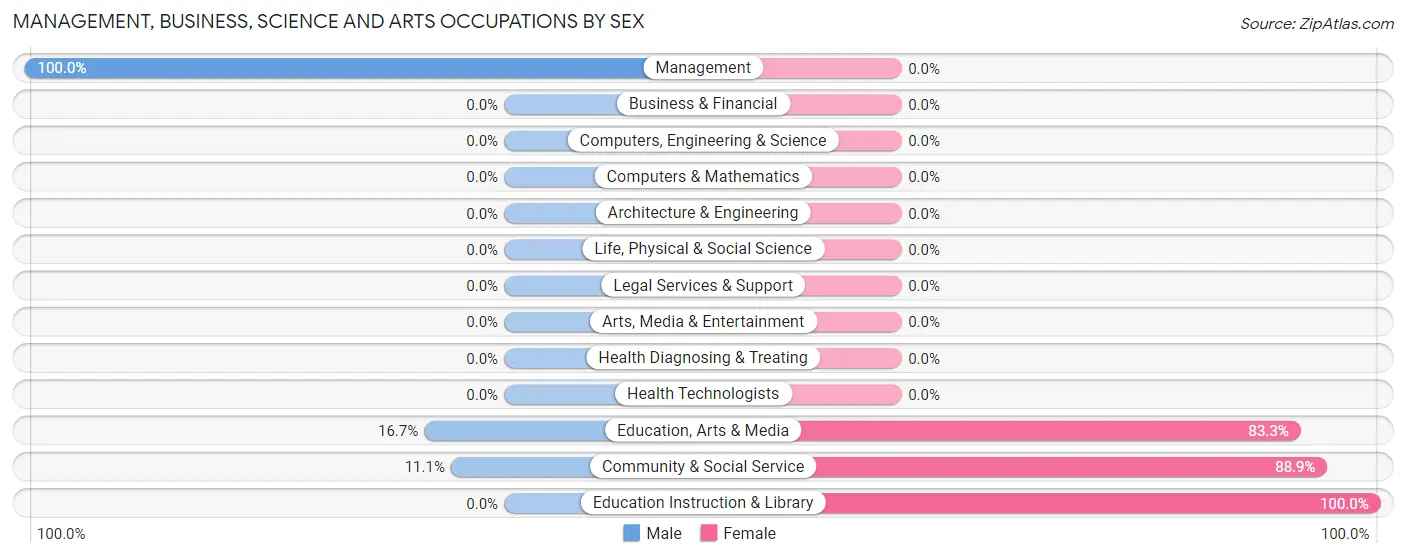
Management, Business, Science and Arts Occupations
The most common Management, Business, Science and Arts occupations in Humnoke are Community & Social Service (9 | 17.0%), Management (7 | 13.2%), Education, Arts & Media (6 | 11.3%), and Education Instruction & Library (3 | 5.7%).
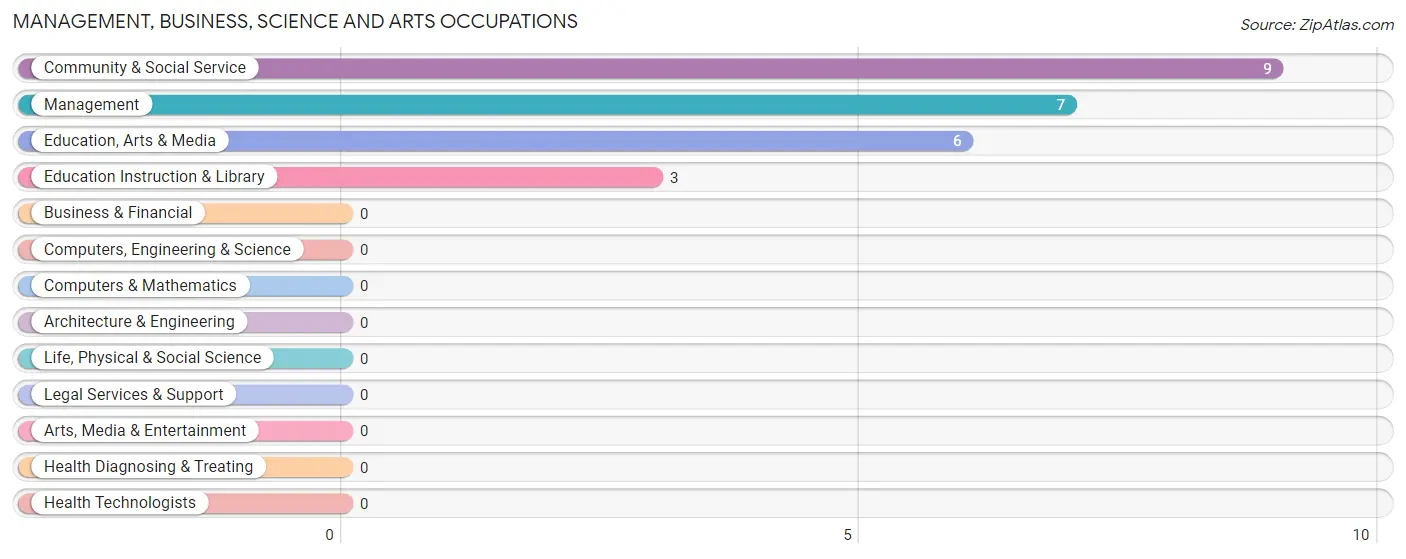
Management, Business, Science and Arts Occupations by Sex
Within the Management, Business, Science and Arts occupations in Humnoke, the most male-oriented occupations are Management (100.0%), Education, Arts & Media (16.7%), and Community & Social Service (11.1%), while the most female-oriented occupations are Education Instruction & Library (100.0%), Community & Social Service (88.9%), and Education, Arts & Media (83.3%).
| Occupation | Male | Female |
| Management | 7 (100.0%) | 0 (0.0%) |
| Business & Financial | 0 (0.0%) | 0 (0.0%) |
| Computers, Engineering & Science | 0 (0.0%) | 0 (0.0%) |
| Computers & Mathematics | 0 (0.0%) | 0 (0.0%) |
| Architecture & Engineering | 0 (0.0%) | 0 (0.0%) |
| Life, Physical & Social Science | 0 (0.0%) | 0 (0.0%) |
| Community & Social Service | 1 (11.1%) | 8 (88.9%) |
| Education, Arts & Media | 1 (16.7%) | 5 (83.3%) |
| Legal Services & Support | 0 (0.0%) | 0 (0.0%) |
| Education Instruction & Library | 0 (0.0%) | 3 (100.0%) |
| Arts, Media & Entertainment | 0 (0.0%) | 0 (0.0%) |
| Health Diagnosing & Treating | 0 (0.0%) | 0 (0.0%) |
| Health Technologists | 0 (0.0%) | 0 (0.0%) |
| Total (Category) | 8 (50.0%) | 8 (50.0%) |
| Total (Overall) | 31 (58.5%) | 22 (41.5%) |
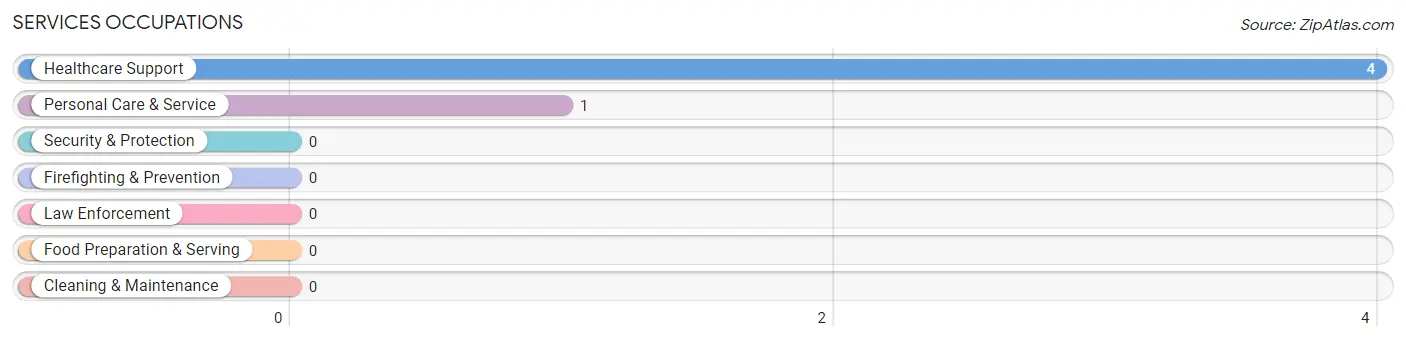
Services Occupations
The most common Services occupations in Humnoke are Healthcare Support (4 | 7.5%), and Personal Care & Service (1 | 1.9%).
Services Occupations by Sex
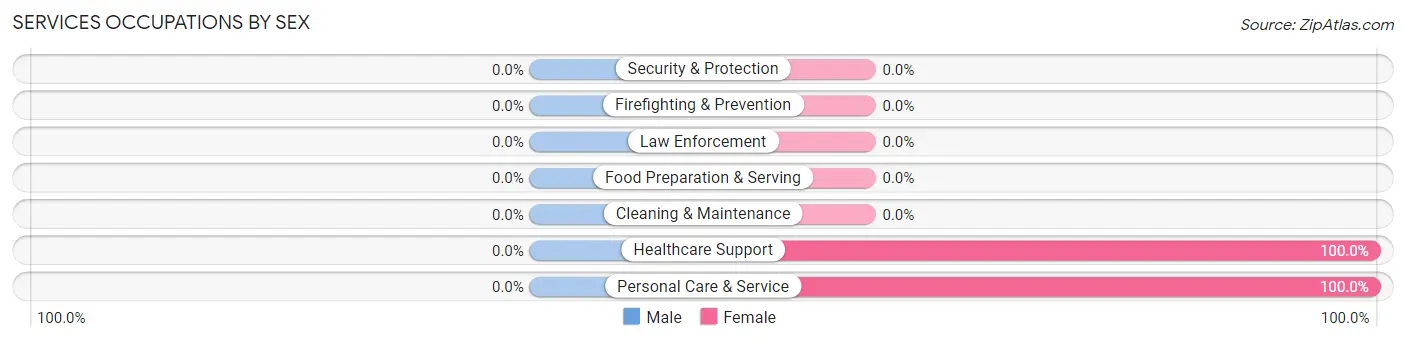
| Occupation | Male | Female |
| Healthcare Support | 0 (0.0%) | 4 (100.0%) |
| Security & Protection | 0 (0.0%) | 0 (0.0%) |
| Firefighting & Prevention | 0 (0.0%) | 0 (0.0%) |
| Law Enforcement | 0 (0.0%) | 0 (0.0%) |
| Food Preparation & Serving | 0 (0.0%) | 0 (0.0%) |
| Cleaning & Maintenance | 0 (0.0%) | 0 (0.0%) |
| Personal Care & Service | 0 (0.0%) | 1 (100.0%) |
| Total (Category) | 0 (0.0%) | 5 (100.0%) |
| Total (Overall) | 31 (58.5%) | 22 (41.5%) |
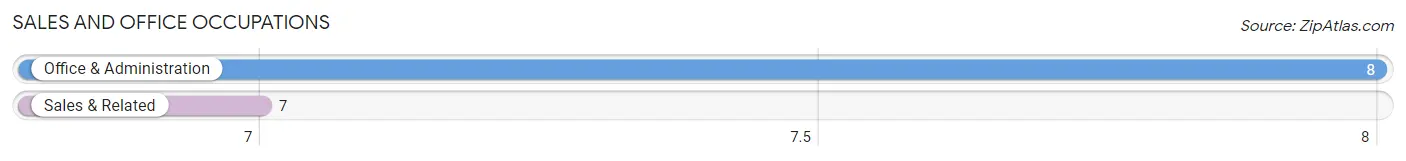
Sales and Office Occupations
The most common Sales and Office occupations in Humnoke are Office & Administration (8 | 15.1%), and Sales & Related (7 | 13.2%).
Sales and Office Occupations by Sex

| Occupation | Male | Female |
| Sales & Related | 5 (71.4%) | 2 (28.6%) |
| Office & Administration | 1 (12.5%) | 7 (87.5%) |
| Total (Category) | 6 (40.0%) | 9 (60.0%) |
| Total (Overall) | 31 (58.5%) | 22 (41.5%) |
Natural Resources, Construction and Maintenance Occupations
The most common Natural Resources, Construction and Maintenance occupations in Humnoke are Farming, Fishing & Forestry (4 | 7.5%), Construction & Extraction (2 | 3.8%), and Installation, Maintenance & Repair (2 | 3.8%).
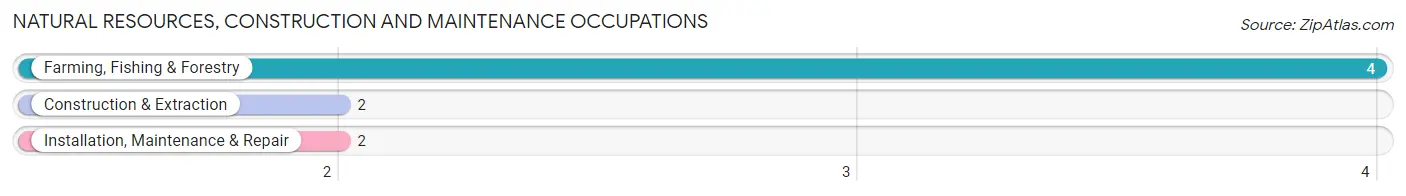
Natural Resources, Construction and Maintenance Occupations by Sex

| Occupation | Male | Female |
| Farming, Fishing & Forestry | 4 (100.0%) | 0 (0.0%) |
| Construction & Extraction | 2 (100.0%) | 0 (0.0%) |
| Installation, Maintenance & Repair | 2 (100.0%) | 0 (0.0%) |
| Total (Category) | 8 (100.0%) | 0 (0.0%) |
| Total (Overall) | 31 (58.5%) | 22 (41.5%) |
Production, Transportation and Moving Occupations
The most common Production, Transportation and Moving occupations in Humnoke are Material Moving (5 | 9.4%), and Transportation (4 | 7.5%).
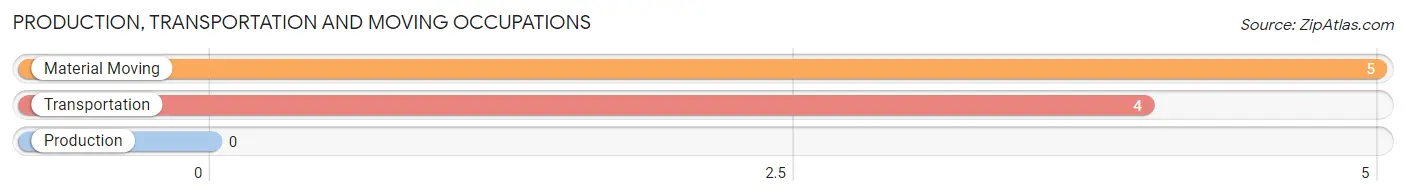
Production, Transportation and Moving Occupations by Sex
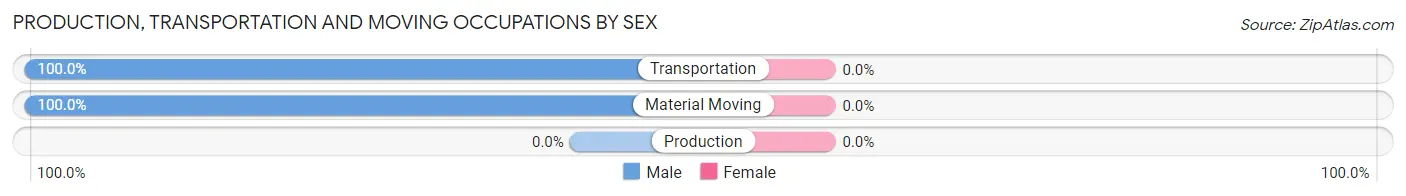
| Occupation | Male | Female |
| Production | 0 (0.0%) | 0 (0.0%) |
| Transportation | 4 (100.0%) | 0 (0.0%) |
| Material Moving | 5 (100.0%) | 0 (0.0%) |
| Total (Category) | 9 (100.0%) | 0 (0.0%) |
| Total (Overall) | 31 (58.5%) | 22 (41.5%) |
Employment Industries by Sex in Humnoke
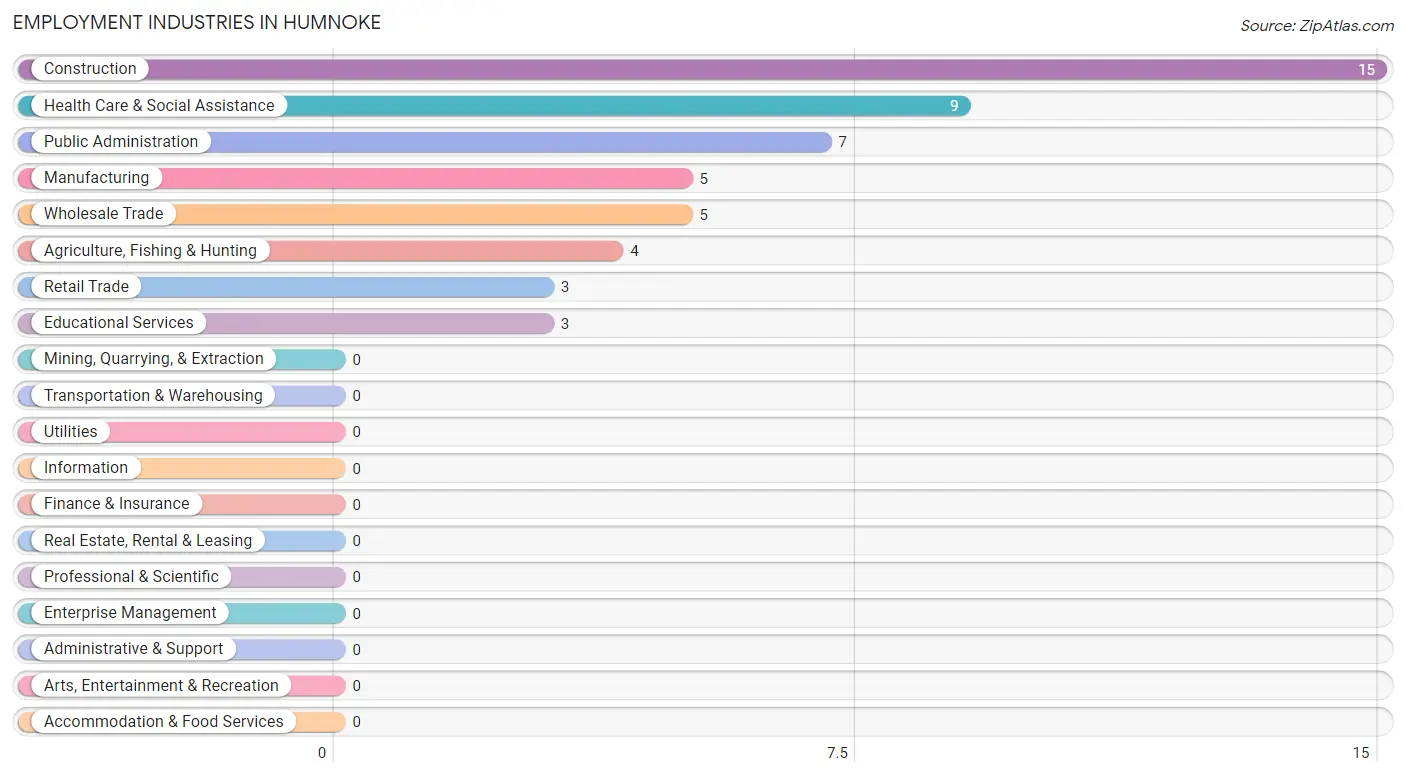
Employment Industries in Humnoke
The major employment industries in Humnoke include Construction (15 | 28.3%), Health Care & Social Assistance (9 | 17.0%), Public Administration (7 | 13.2%), Manufacturing (5 | 9.4%), and Wholesale Trade (5 | 9.4%).
Employment Industries by Sex in Humnoke
The Humnoke industries that see more men than women are Agriculture, Fishing & Hunting (100.0%), Construction (100.0%), and Manufacturing (100.0%), whereas the industries that tend to have a higher number of women are Educational Services (100.0%), Health Care & Social Assistance (100.0%), and Public Administration (100.0%).
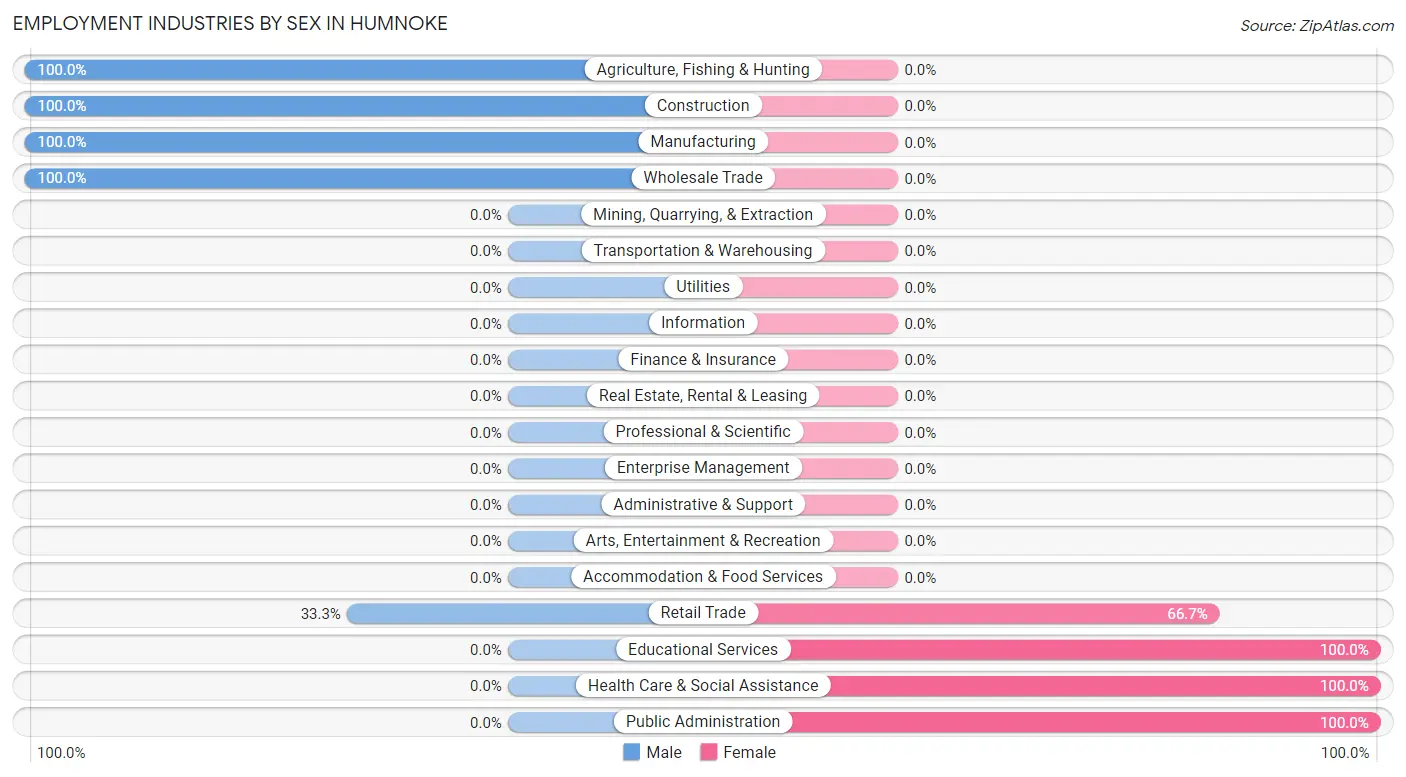
| Industry | Male | Female |
| Agriculture, Fishing & Hunting | 4 (100.0%) | 0 (0.0%) |
| Mining, Quarrying, & Extraction | 0 (0.0%) | 0 (0.0%) |
| Construction | 15 (100.0%) | 0 (0.0%) |
| Manufacturing | 5 (100.0%) | 0 (0.0%) |
| Wholesale Trade | 5 (100.0%) | 0 (0.0%) |
| Retail Trade | 1 (33.3%) | 2 (66.7%) |
| Transportation & Warehousing | 0 (0.0%) | 0 (0.0%) |
| Utilities | 0 (0.0%) | 0 (0.0%) |
| Information | 0 (0.0%) | 0 (0.0%) |
| Finance & Insurance | 0 (0.0%) | 0 (0.0%) |
| Real Estate, Rental & Leasing | 0 (0.0%) | 0 (0.0%) |
| Professional & Scientific | 0 (0.0%) | 0 (0.0%) |
| Enterprise Management | 0 (0.0%) | 0 (0.0%) |
| Administrative & Support | 0 (0.0%) | 0 (0.0%) |
| Educational Services | 0 (0.0%) | 3 (100.0%) |
| Health Care & Social Assistance | 0 (0.0%) | 9 (100.0%) |
| Arts, Entertainment & Recreation | 0 (0.0%) | 0 (0.0%) |
| Accommodation & Food Services | 0 (0.0%) | 0 (0.0%) |
| Public Administration | 0 (0.0%) | 7 (100.0%) |
| Total | 31 (58.5%) | 22 (41.5%) |
Education in Humnoke
School Enrollment in Humnoke
The most common levels of schooling among the 31 students in Humnoke are elementary school (18 | 58.1%), high school (10 | 32.3%), and kindergarten (3 | 9.7%).
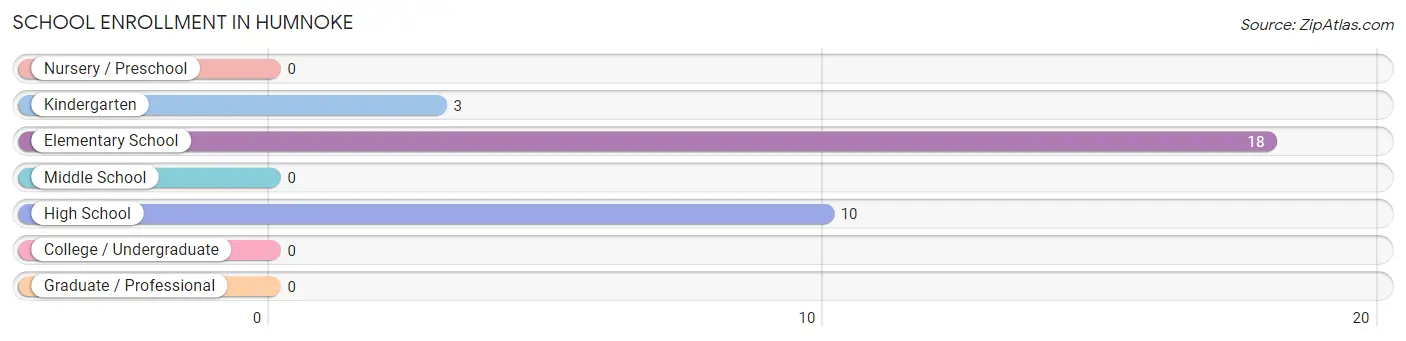
| School Level | # Students | % Students |
| Nursery / Preschool | 0 | 0.0% |
| Kindergarten | 3 | 9.7% |
| Elementary School | 18 | 58.1% |
| Middle School | 0 | 0.0% |
| High School | 10 | 32.3% |
| College / Undergraduate | 0 | 0.0% |
| Graduate / Professional | 0 | 0.0% |
| Total | 31 | 100.0% |
School Enrollment by Age by Funding Source in Humnoke
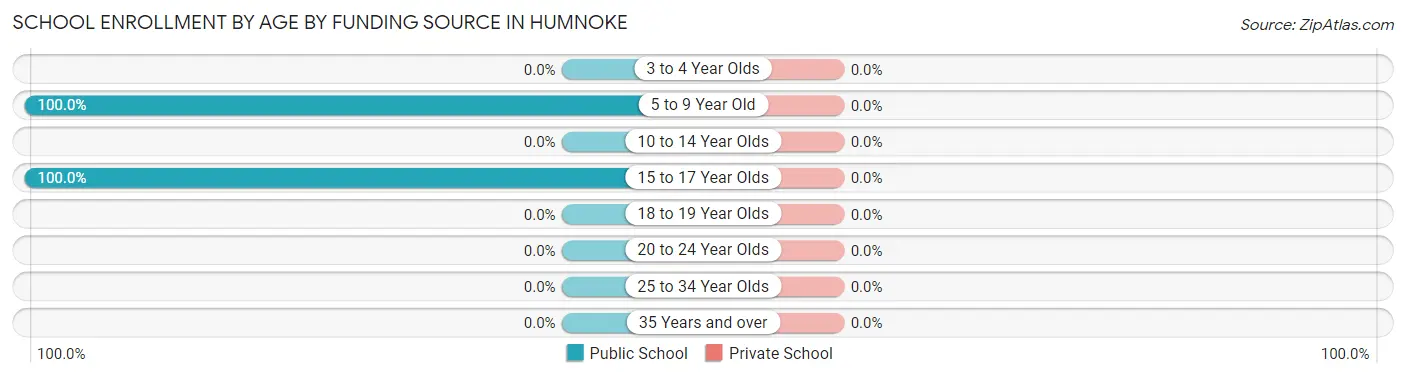
| Age Bracket | Public School | Private School |
| 3 to 4 Year Olds | 0 (0.0%) | 0 (0.0%) |
| 5 to 9 Year Old | 21 (100.0%) | 0 (0.0%) |
| 10 to 14 Year Olds | 0 (0.0%) | 0 (0.0%) |
| 15 to 17 Year Olds | 10 (100.0%) | 0 (0.0%) |
| 18 to 19 Year Olds | 0 (0.0%) | 0 (0.0%) |
| 20 to 24 Year Olds | 0 (0.0%) | 0 (0.0%) |
| 25 to 34 Year Olds | 0 (0.0%) | 0 (0.0%) |
| 35 Years and over | 0 (0.0%) | 0 (0.0%) |
| Total | 31 (100.0%) | 0 (0.0%) |
Educational Attainment by Field of Study in Humnoke
Psychology (5 | 25.0%), bio, nature & agricultural (4 | 20.0%), physical & health sciences (4 | 20.0%), engineering (4 | 20.0%), and education (2 | 10.0%) are the most common fields of study among 20 individuals in Humnoke who have obtained a bachelor's degree or higher.
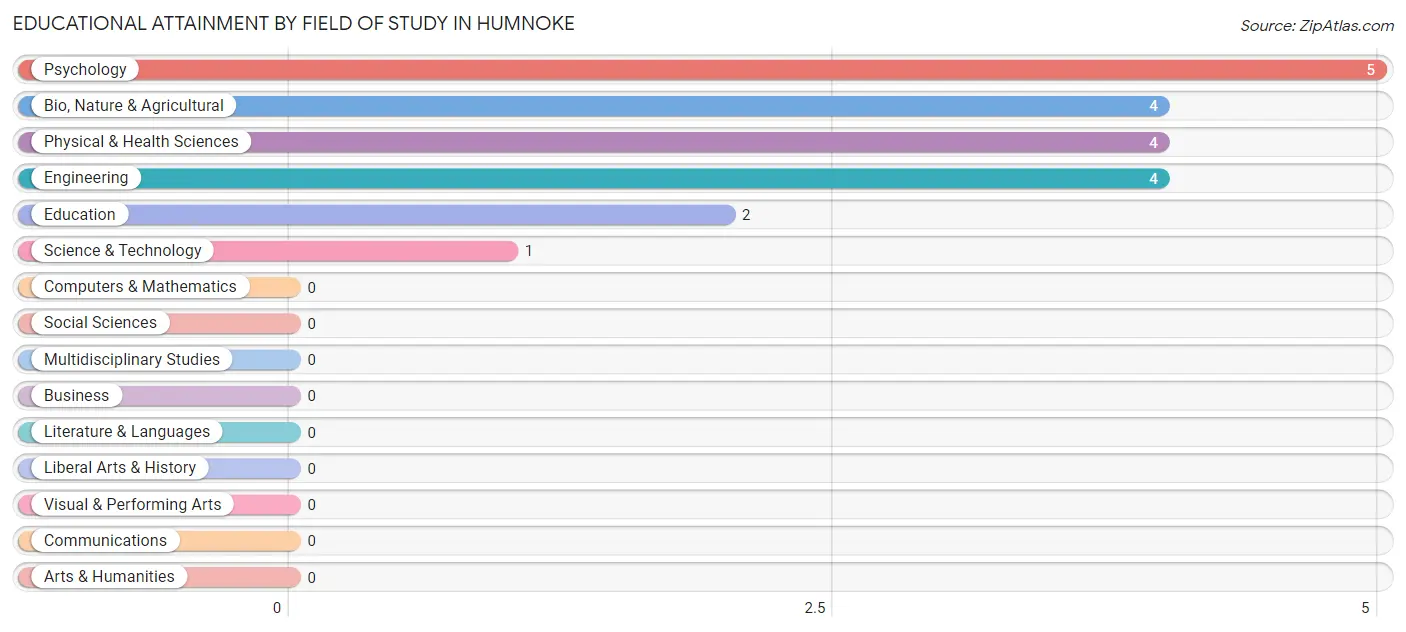
| Field of Study | # Graduates | % Graduates |
| Computers & Mathematics | 0 | 0.0% |
| Bio, Nature & Agricultural | 4 | 20.0% |
| Physical & Health Sciences | 4 | 20.0% |
| Psychology | 5 | 25.0% |
| Social Sciences | 0 | 0.0% |
| Engineering | 4 | 20.0% |
| Multidisciplinary Studies | 0 | 0.0% |
| Science & Technology | 1 | 5.0% |
| Business | 0 | 0.0% |
| Education | 2 | 10.0% |
| Literature & Languages | 0 | 0.0% |
| Liberal Arts & History | 0 | 0.0% |
| Visual & Performing Arts | 0 | 0.0% |
| Communications | 0 | 0.0% |
| Arts & Humanities | 0 | 0.0% |
| Total | 20 | 100.0% |
Transportation & Commute in Humnoke
Vehicle Availability by Sex in Humnoke
The most prevalent vehicle ownership categories in Humnoke are males with 2 vehicles (11, accounting for 35.5%) and females with 2 vehicles (8, making up 50.0%).
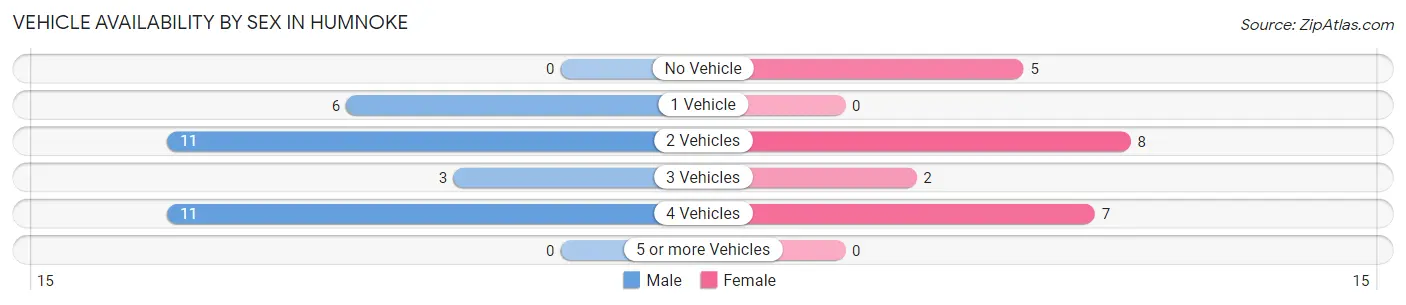
| Vehicles Available | Male | Female |
| No Vehicle | 0 (0.0%) | 5 (22.7%) |
| 1 Vehicle | 6 (19.4%) | 0 (0.0%) |
| 2 Vehicles | 11 (35.5%) | 8 (36.4%) |
| 3 Vehicles | 3 (9.7%) | 2 (9.1%) |
| 4 Vehicles | 11 (35.5%) | 7 (31.8%) |
| 5 or more Vehicles | 0 (0.0%) | 0 (0.0%) |
| Total | 31 (100.0%) | 22 (100.0%) |
Commute Time in Humnoke
The most frequently occuring commute durations in Humnoke are 30 to 34 minutes (11 commuters, 22.0%), 45 to 59 minutes (9 commuters, 18.0%), and less than 5 minutes (7 commuters, 14.0%).
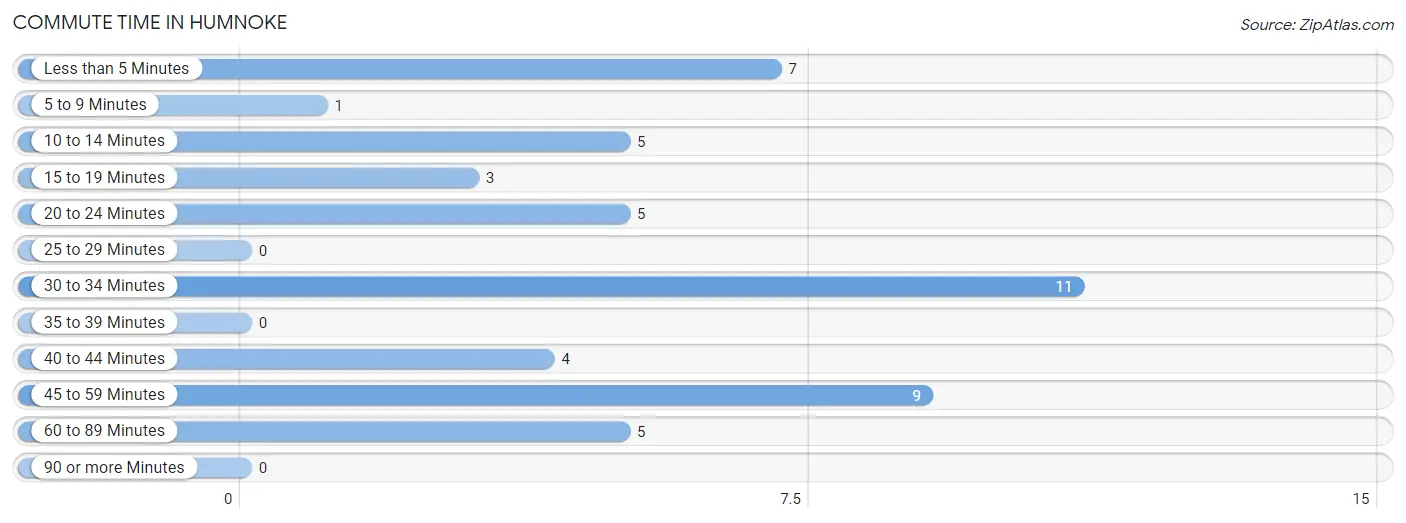
| Commute Time | # Commuters | % Commuters |
| Less than 5 Minutes | 7 | 14.0% |
| 5 to 9 Minutes | 1 | 2.0% |
| 10 to 14 Minutes | 5 | 10.0% |
| 15 to 19 Minutes | 3 | 6.0% |
| 20 to 24 Minutes | 5 | 10.0% |
| 25 to 29 Minutes | 0 | 0.0% |
| 30 to 34 Minutes | 11 | 22.0% |
| 35 to 39 Minutes | 0 | 0.0% |
| 40 to 44 Minutes | 4 | 8.0% |
| 45 to 59 Minutes | 9 | 18.0% |
| 60 to 89 Minutes | 5 | 10.0% |
| 90 or more Minutes | 0 | 0.0% |
Commute Time by Sex in Humnoke
The most common commute times in Humnoke are less than 5 minutes (7 commuters, 22.6%) for males and 30 to 34 minutes (11 commuters, 57.9%) for females.
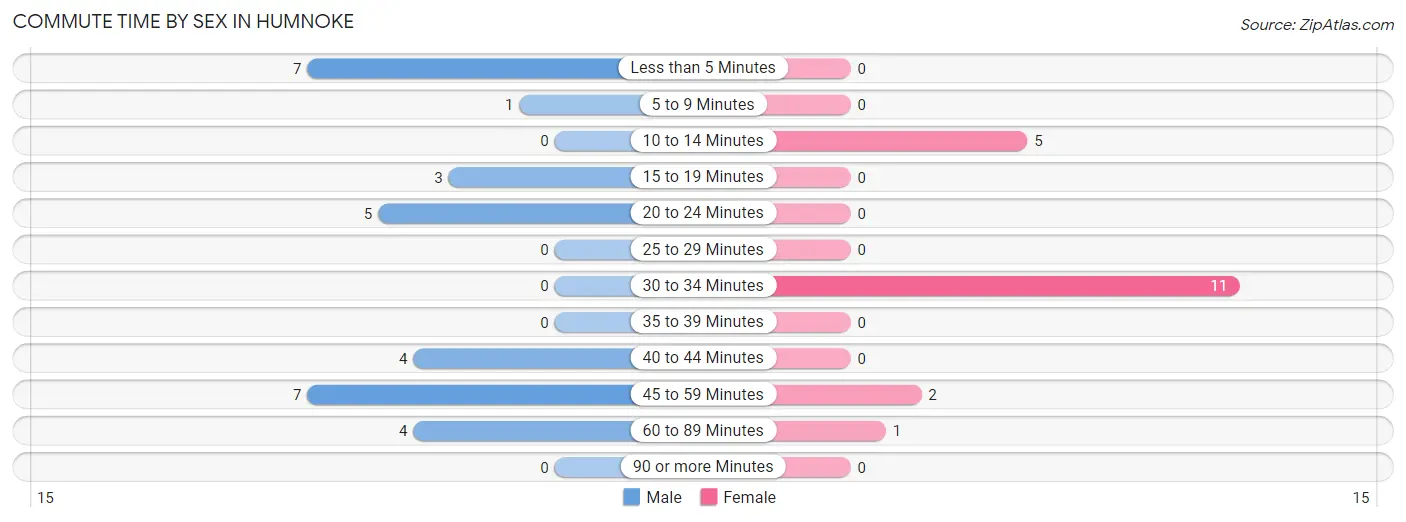
| Commute Time | Male | Female |
| Less than 5 Minutes | 7 (22.6%) | 0 (0.0%) |
| 5 to 9 Minutes | 1 (3.2%) | 0 (0.0%) |
| 10 to 14 Minutes | 0 (0.0%) | 5 (26.3%) |
| 15 to 19 Minutes | 3 (9.7%) | 0 (0.0%) |
| 20 to 24 Minutes | 5 (16.1%) | 0 (0.0%) |
| 25 to 29 Minutes | 0 (0.0%) | 0 (0.0%) |
| 30 to 34 Minutes | 0 (0.0%) | 11 (57.9%) |
| 35 to 39 Minutes | 0 (0.0%) | 0 (0.0%) |
| 40 to 44 Minutes | 4 (12.9%) | 0 (0.0%) |
| 45 to 59 Minutes | 7 (22.6%) | 2 (10.5%) |
| 60 to 89 Minutes | 4 (12.9%) | 1 (5.3%) |
| 90 or more Minutes | 0 (0.0%) | 0 (0.0%) |
Time of Departure to Work by Sex in Humnoke
The most frequent times of departure to work in Humnoke are 12:00 AM to 4:59 AM (10, 32.3%) for males and 12:00 AM to 4:59 AM (7, 36.8%) for females.
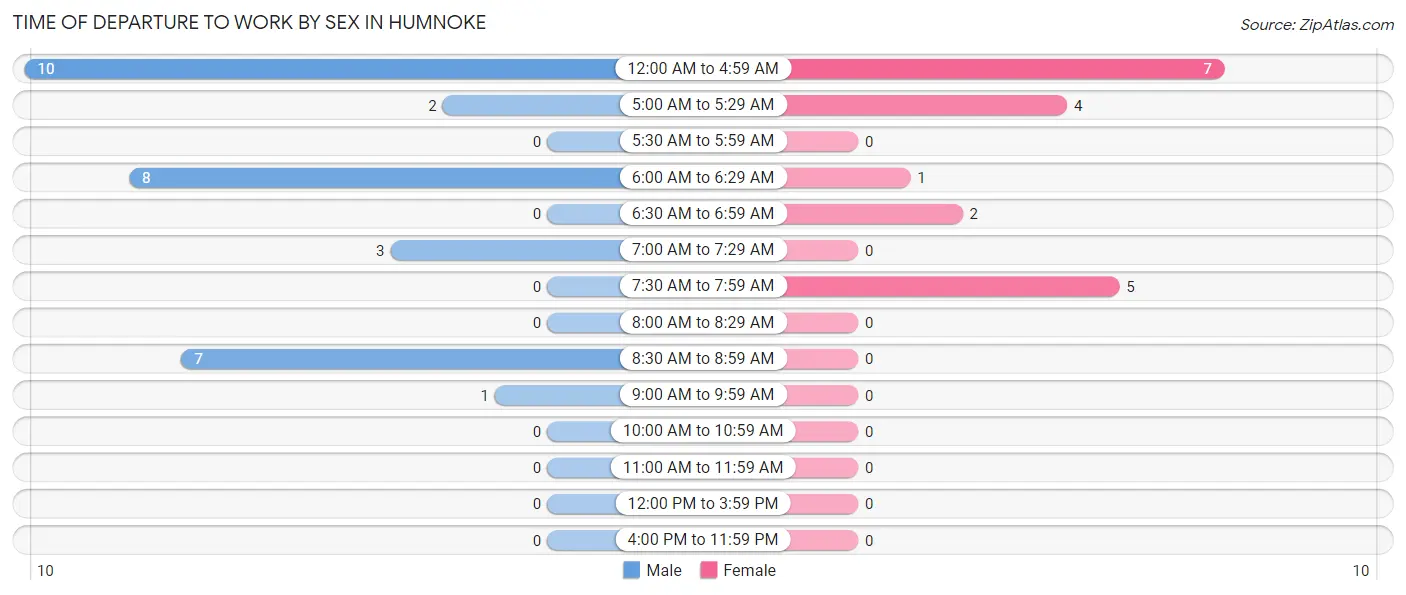
| Time of Departure | Male | Female |
| 12:00 AM to 4:59 AM | 10 (32.3%) | 7 (36.8%) |
| 5:00 AM to 5:29 AM | 2 (6.5%) | 4 (21.0%) |
| 5:30 AM to 5:59 AM | 0 (0.0%) | 0 (0.0%) |
| 6:00 AM to 6:29 AM | 8 (25.8%) | 1 (5.3%) |
| 6:30 AM to 6:59 AM | 0 (0.0%) | 2 (10.5%) |
| 7:00 AM to 7:29 AM | 3 (9.7%) | 0 (0.0%) |
| 7:30 AM to 7:59 AM | 0 (0.0%) | 5 (26.3%) |
| 8:00 AM to 8:29 AM | 0 (0.0%) | 0 (0.0%) |
| 8:30 AM to 8:59 AM | 7 (22.6%) | 0 (0.0%) |
| 9:00 AM to 9:59 AM | 1 (3.2%) | 0 (0.0%) |
| 10:00 AM to 10:59 AM | 0 (0.0%) | 0 (0.0%) |
| 11:00 AM to 11:59 AM | 0 (0.0%) | 0 (0.0%) |
| 12:00 PM to 3:59 PM | 0 (0.0%) | 0 (0.0%) |
| 4:00 PM to 11:59 PM | 0 (0.0%) | 0 (0.0%) |
| Total | 31 (100.0%) | 19 (100.0%) |
Housing Occupancy in Humnoke
Occupancy by Ownership in Humnoke
Of the total 61 dwellings in Humnoke, owner-occupied units account for 49 (80.3%), while renter-occupied units make up 12 (19.7%).
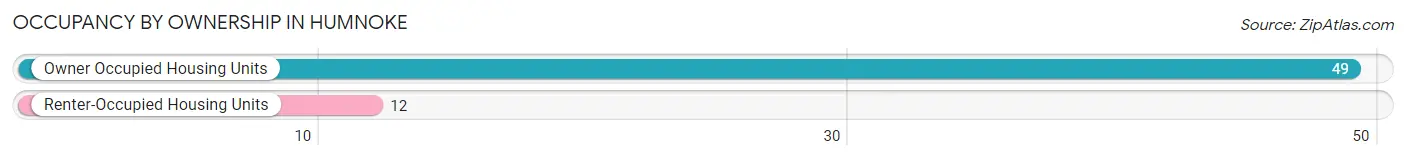
| Occupancy | # Housing Units | % Housing Units |
| Owner Occupied Housing Units | 49 | 80.3% |
| Renter-Occupied Housing Units | 12 | 19.7% |
| Total Occupied Housing Units | 61 | 100.0% |
Occupancy by Household Size in Humnoke
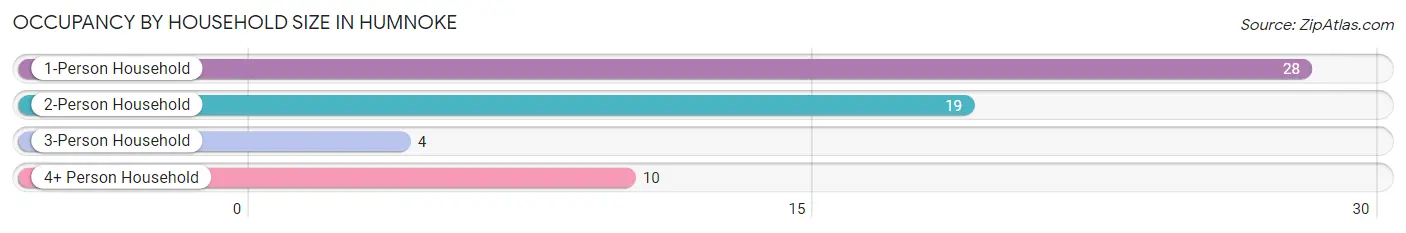
| Household Size | # Housing Units | % Housing Units |
| 1-Person Household | 28 | 45.9% |
| 2-Person Household | 19 | 31.1% |
| 3-Person Household | 4 | 6.6% |
| 4+ Person Household | 10 | 16.4% |
| Total Housing Units | 61 | 100.0% |
Occupancy by Ownership by Household Size in Humnoke
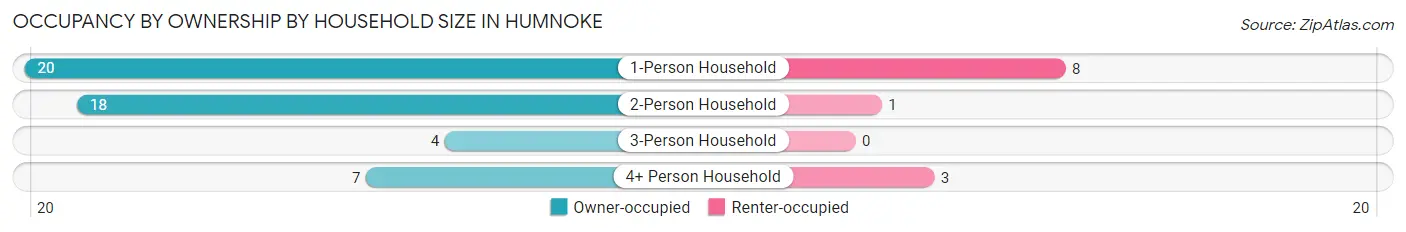
| Household Size | Owner-occupied | Renter-occupied |
| 1-Person Household | 20 (71.4%) | 8 (28.6%) |
| 2-Person Household | 18 (94.7%) | 1 (5.3%) |
| 3-Person Household | 4 (100.0%) | 0 (0.0%) |
| 4+ Person Household | 7 (70.0%) | 3 (30.0%) |
| Total Housing Units | 49 (80.3%) | 12 (19.7%) |
Occupancy by Educational Attainment in Humnoke
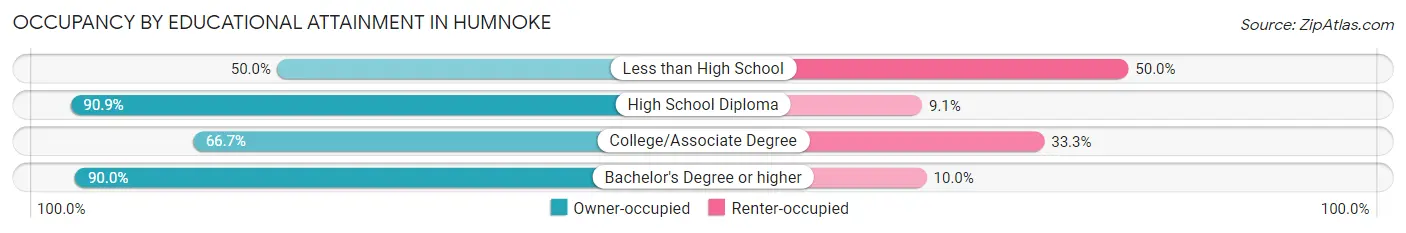
| Household Size | Owner-occupied | Renter-occupied |
| Less than High School | 6 (50.0%) | 6 (50.0%) |
| High School Diploma | 30 (90.9%) | 3 (9.1%) |
| College/Associate Degree | 4 (66.7%) | 2 (33.3%) |
| Bachelor's Degree or higher | 9 (90.0%) | 1 (10.0%) |
Occupancy by Age of Householder in Humnoke
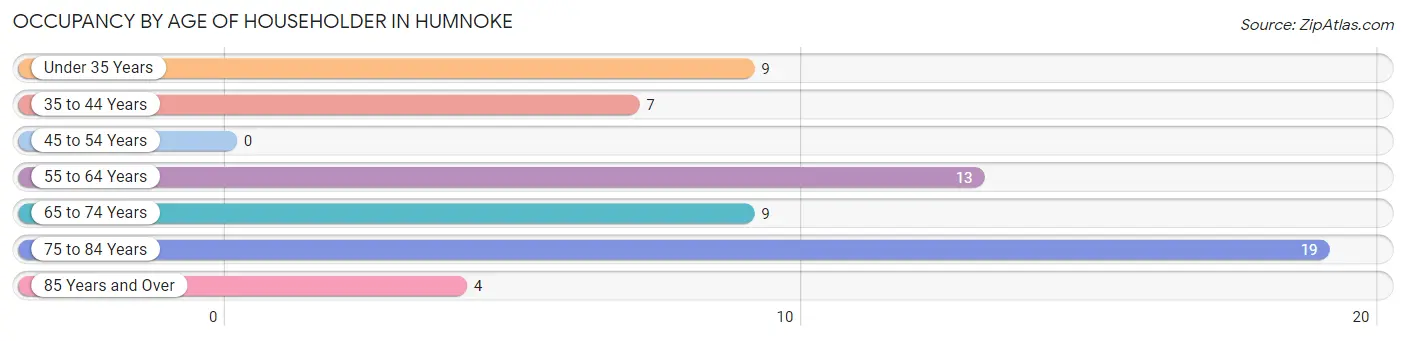
| Age Bracket | # Households | % Households |
| Under 35 Years | 9 | 14.7% |
| 35 to 44 Years | 7 | 11.5% |
| 45 to 54 Years | 0 | 0.0% |
| 55 to 64 Years | 13 | 21.3% |
| 65 to 74 Years | 9 | 14.7% |
| 75 to 84 Years | 19 | 31.1% |
| 85 Years and Over | 4 | 6.6% |
| Total | 61 | 100.0% |
Housing Finances in Humnoke
Median Income by Occupancy in Humnoke
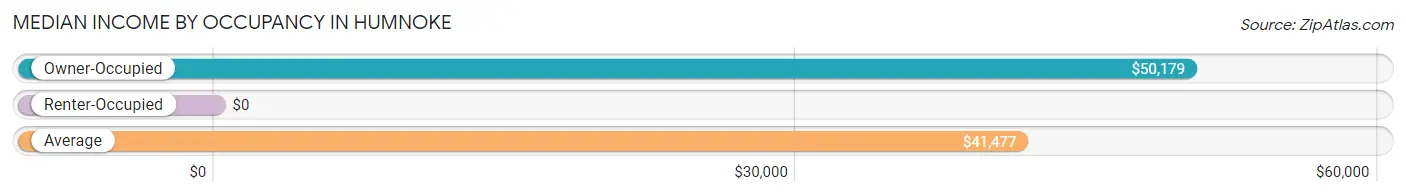
| Occupancy Type | # Households | Median Income |
| Owner-Occupied | 49 (80.3%) | $50,179 |
| Renter-Occupied | 12 (19.7%) | $0 |
| Average | 61 (100.0%) | $41,477 |
Occupancy by Householder Income Bracket in Humnoke
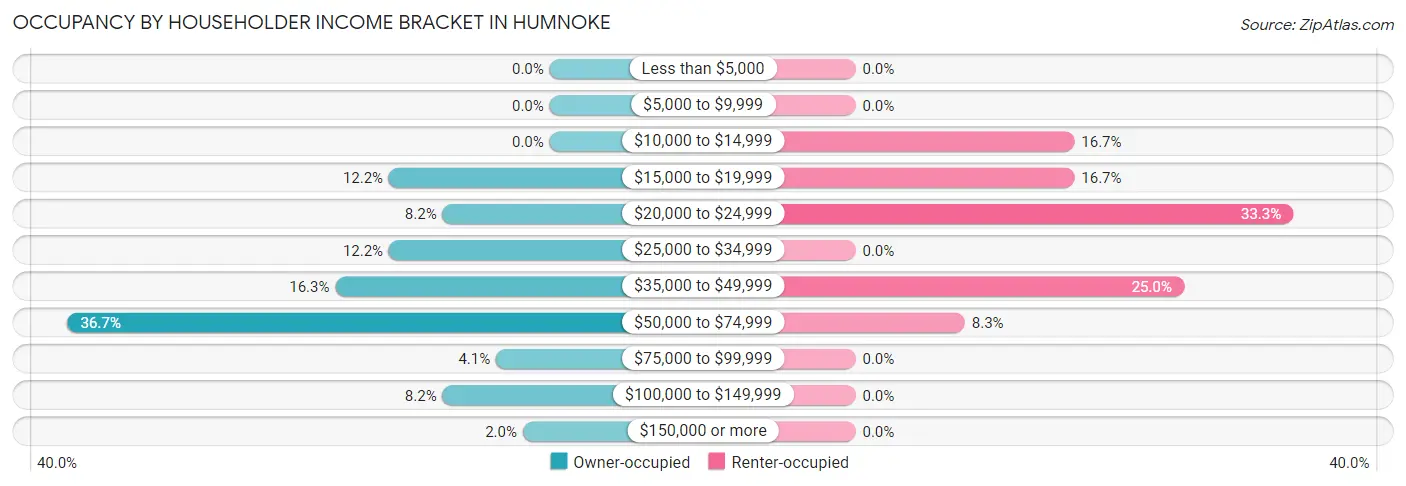
| Income Bracket | Owner-occupied | Renter-occupied |
| Less than $5,000 | 0 (0.0%) | 0 (0.0%) |
| $5,000 to $9,999 | 0 (0.0%) | 0 (0.0%) |
| $10,000 to $14,999 | 0 (0.0%) | 2 (16.7%) |
| $15,000 to $19,999 | 6 (12.2%) | 2 (16.7%) |
| $20,000 to $24,999 | 4 (8.2%) | 4 (33.3%) |
| $25,000 to $34,999 | 6 (12.2%) | 0 (0.0%) |
| $35,000 to $49,999 | 8 (16.3%) | 3 (25.0%) |
| $50,000 to $74,999 | 18 (36.7%) | 1 (8.3%) |
| $75,000 to $99,999 | 2 (4.1%) | 0 (0.0%) |
| $100,000 to $149,999 | 4 (8.2%) | 0 (0.0%) |
| $150,000 or more | 1 (2.0%) | 0 (0.0%) |
| Total | 49 (100.0%) | 12 (100.0%) |
Monthly Housing Cost Tiers in Humnoke
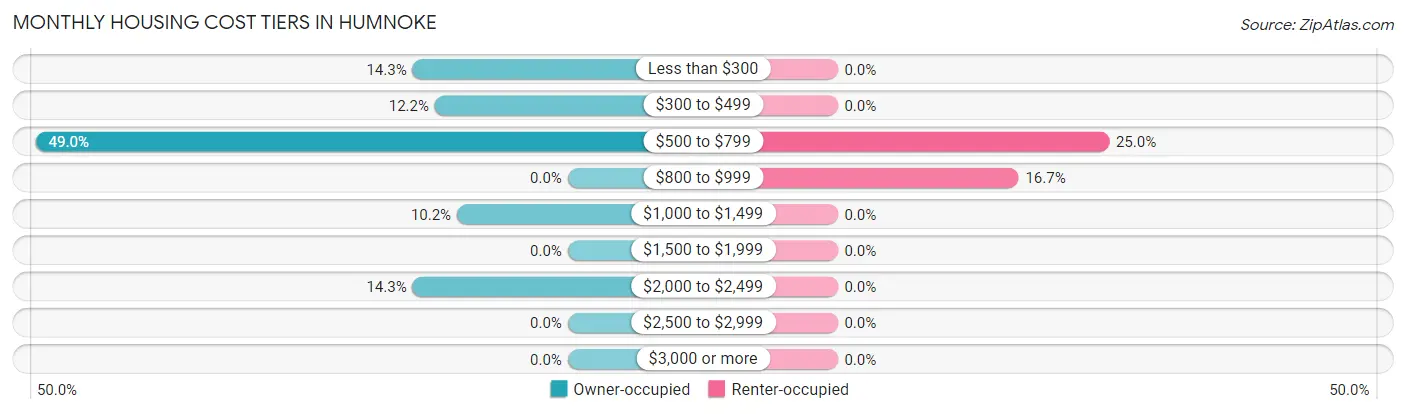
| Monthly Cost | Owner-occupied | Renter-occupied |
| Less than $300 | 7 (14.3%) | 0 (0.0%) |
| $300 to $499 | 6 (12.2%) | 0 (0.0%) |
| $500 to $799 | 24 (49.0%) | 3 (25.0%) |
| $800 to $999 | 0 (0.0%) | 2 (16.7%) |
| $1,000 to $1,499 | 5 (10.2%) | 0 (0.0%) |
| $1,500 to $1,999 | 0 (0.0%) | 0 (0.0%) |
| $2,000 to $2,499 | 7 (14.3%) | 0 (0.0%) |
| $2,500 to $2,999 | 0 (0.0%) | 0 (0.0%) |
| $3,000 or more | 0 (0.0%) | 0 (0.0%) |
| Total | 49 (100.0%) | 12 (100.0%) |
Physical Housing Characteristics in Humnoke
Housing Structures in Humnoke
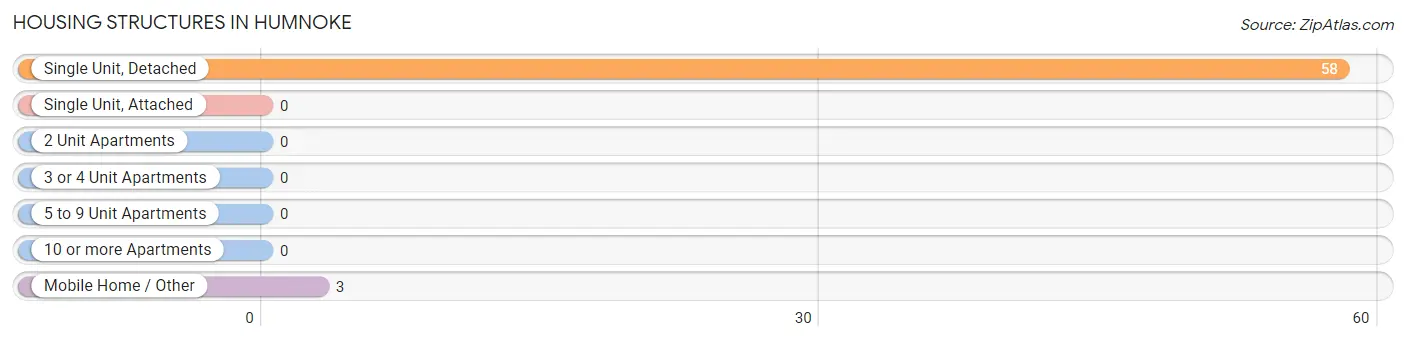
| Structure Type | # Housing Units | % Housing Units |
| Single Unit, Detached | 58 | 95.1% |
| Single Unit, Attached | 0 | 0.0% |
| 2 Unit Apartments | 0 | 0.0% |
| 3 or 4 Unit Apartments | 0 | 0.0% |
| 5 to 9 Unit Apartments | 0 | 0.0% |
| 10 or more Apartments | 0 | 0.0% |
| Mobile Home / Other | 3 | 4.9% |
| Total | 61 | 100.0% |
Housing Structures by Occupancy in Humnoke
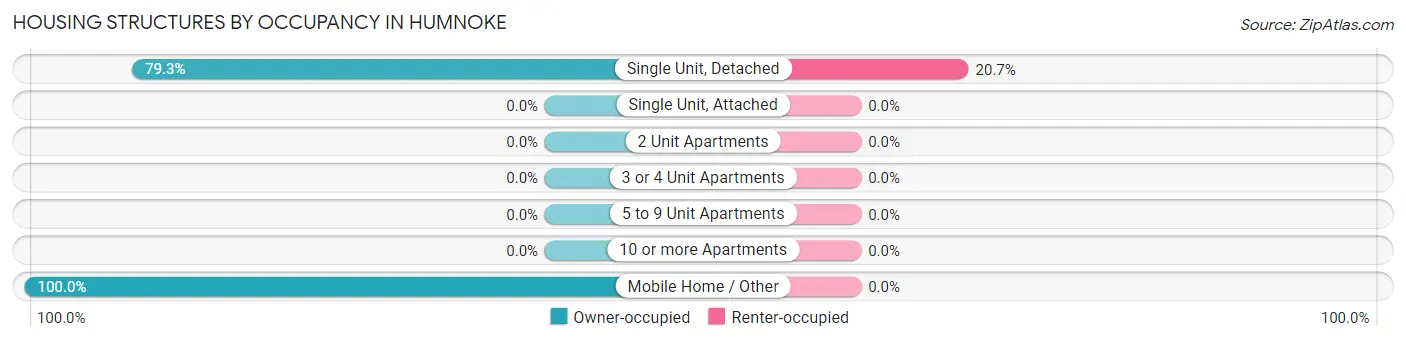
| Structure Type | Owner-occupied | Renter-occupied |
| Single Unit, Detached | 46 (79.3%) | 12 (20.7%) |
| Single Unit, Attached | 0 (0.0%) | 0 (0.0%) |
| 2 Unit Apartments | 0 (0.0%) | 0 (0.0%) |
| 3 or 4 Unit Apartments | 0 (0.0%) | 0 (0.0%) |
| 5 to 9 Unit Apartments | 0 (0.0%) | 0 (0.0%) |
| 10 or more Apartments | 0 (0.0%) | 0 (0.0%) |
| Mobile Home / Other | 3 (100.0%) | 0 (0.0%) |
| Total | 49 (80.3%) | 12 (19.7%) |
Housing Structures by Number of Rooms in Humnoke
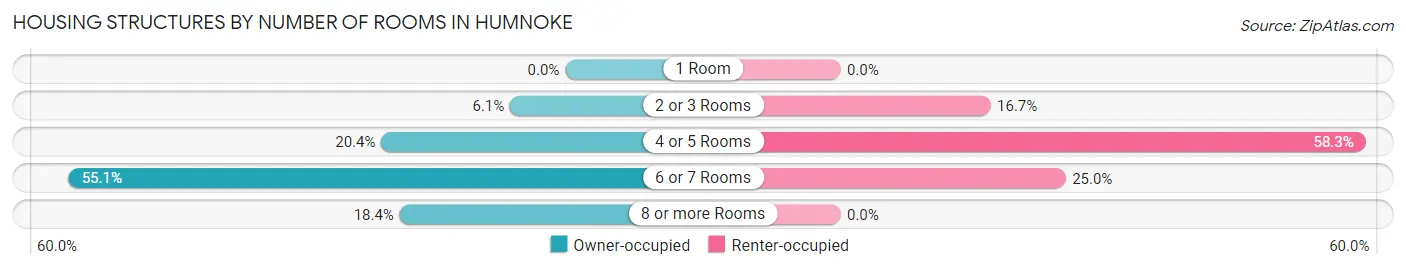
| Number of Rooms | Owner-occupied | Renter-occupied |
| 1 Room | 0 (0.0%) | 0 (0.0%) |
| 2 or 3 Rooms | 3 (6.1%) | 2 (16.7%) |
| 4 or 5 Rooms | 10 (20.4%) | 7 (58.3%) |
| 6 or 7 Rooms | 27 (55.1%) | 3 (25.0%) |
| 8 or more Rooms | 9 (18.4%) | 0 (0.0%) |
| Total | 49 (100.0%) | 12 (100.0%) |
Housing Structure by Heating Type in Humnoke
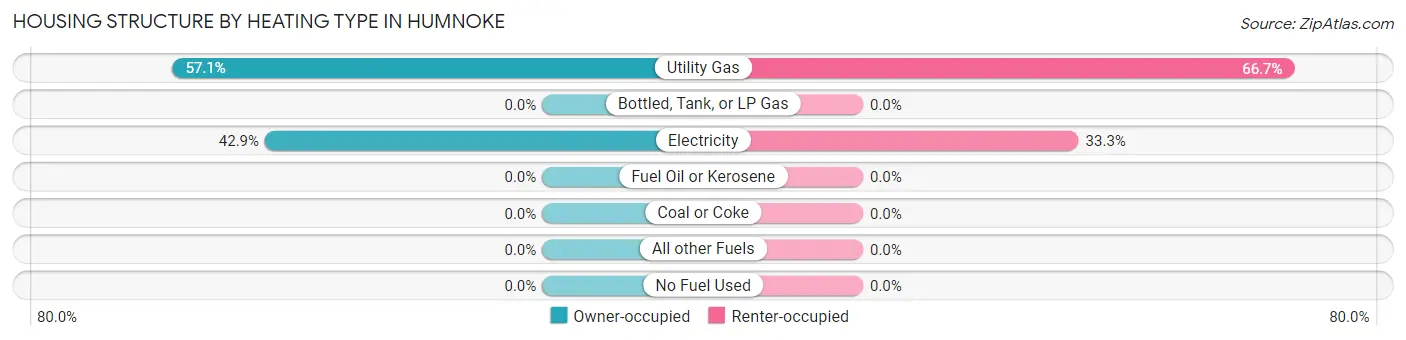
| Heating Type | Owner-occupied | Renter-occupied |
| Utility Gas | 28 (57.1%) | 8 (66.7%) |
| Bottled, Tank, or LP Gas | 0 (0.0%) | 0 (0.0%) |
| Electricity | 21 (42.9%) | 4 (33.3%) |
| Fuel Oil or Kerosene | 0 (0.0%) | 0 (0.0%) |
| Coal or Coke | 0 (0.0%) | 0 (0.0%) |
| All other Fuels | 0 (0.0%) | 0 (0.0%) |
| No Fuel Used | 0 (0.0%) | 0 (0.0%) |
| Total | 49 (100.0%) | 12 (100.0%) |
Household Vehicle Usage in Humnoke
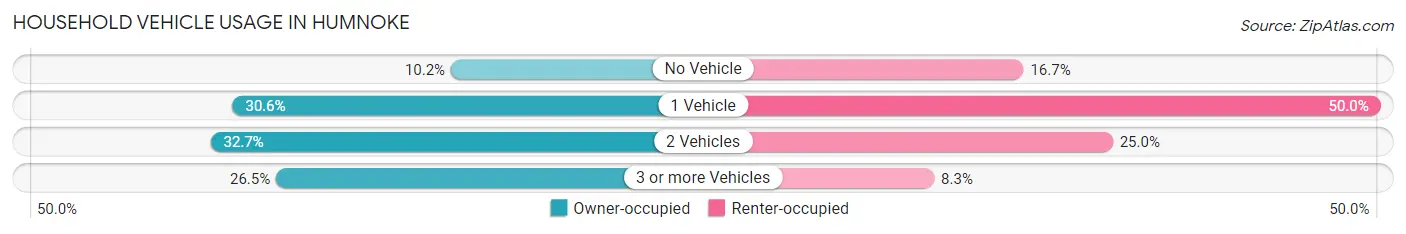
| Vehicles per Household | Owner-occupied | Renter-occupied |
| No Vehicle | 5 (10.2%) | 2 (16.7%) |
| 1 Vehicle | 15 (30.6%) | 6 (50.0%) |
| 2 Vehicles | 16 (32.7%) | 3 (25.0%) |
| 3 or more Vehicles | 13 (26.5%) | 1 (8.3%) |
| Total | 49 (100.0%) | 12 (100.0%) |
Real Estate & Mortgages in Humnoke
Real Estate and Mortgage Overview in Humnoke
| Characteristic | Without Mortgage | With Mortgage |
| Housing Units | 30 | 19 |
| Median Property Value | $85,000 | $0 |
| Median Household Income | $50,357 | $0 |
| Monthly Housing Costs | $525 | $0 |
| Real Estate Taxes | $483 | $0 |
Property Value by Mortgage Status in Humnoke
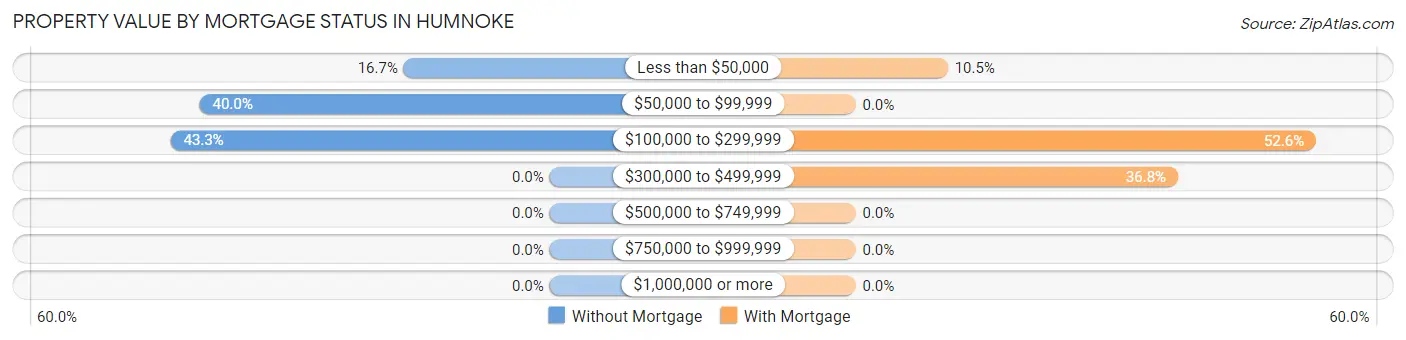
| Property Value | Without Mortgage | With Mortgage |
| Less than $50,000 | 5 (16.7%) | 2 (10.5%) |
| $50,000 to $99,999 | 12 (40.0%) | 0 (0.0%) |
| $100,000 to $299,999 | 13 (43.3%) | 10 (52.6%) |
| $300,000 to $499,999 | 0 (0.0%) | 7 (36.8%) |
| $500,000 to $749,999 | 0 (0.0%) | 0 (0.0%) |
| $750,000 to $999,999 | 0 (0.0%) | 0 (0.0%) |
| $1,000,000 or more | 0 (0.0%) | 0 (0.0%) |
| Total | 30 (100.0%) | 19 (100.0%) |
Household Income by Mortgage Status in Humnoke
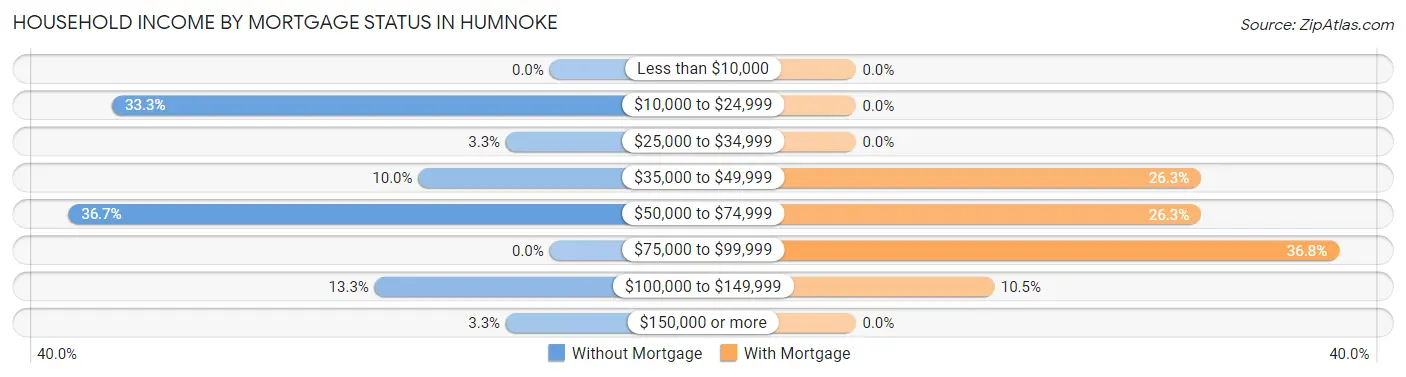
| Household Income | Without Mortgage | With Mortgage |
| Less than $10,000 | 0 (0.0%) | 0 (0.0%) |
| $10,000 to $24,999 | 10 (33.3%) | 0 (0.0%) |
| $25,000 to $34,999 | 1 (3.3%) | 0 (0.0%) |
| $35,000 to $49,999 | 3 (10.0%) | 5 (26.3%) |
| $50,000 to $74,999 | 11 (36.7%) | 5 (26.3%) |
| $75,000 to $99,999 | 0 (0.0%) | 7 (36.8%) |
| $100,000 to $149,999 | 4 (13.3%) | 2 (10.5%) |
| $150,000 or more | 1 (3.3%) | 0 (0.0%) |
| Total | 30 (100.0%) | 19 (100.0%) |
Property Value to Household Income Ratio in Humnoke
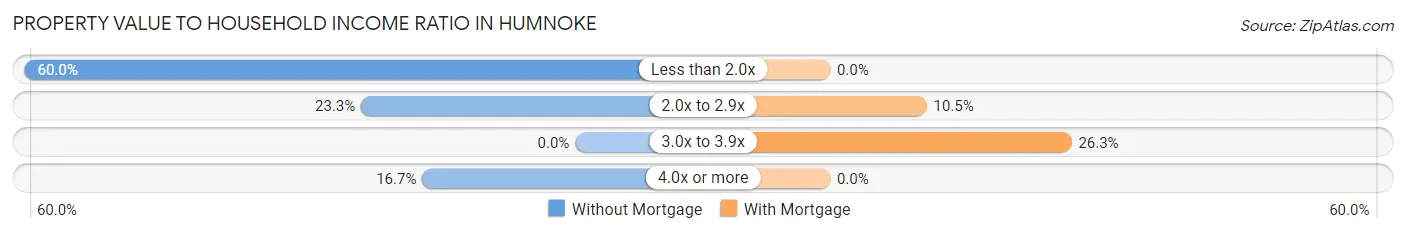
| Value-to-Income Ratio | Without Mortgage | With Mortgage |
| Less than 2.0x | 18 (60.0%) | 0 (0.0%) |
| 2.0x to 2.9x | 7 (23.3%) | 2 (10.5%) |
| 3.0x to 3.9x | 0 (0.0%) | 5 (26.3%) |
| 4.0x or more | 5 (16.7%) | 0 (0.0%) |
| Total | 30 (100.0%) | 19 (100.0%) |
Real Estate Taxes by Mortgage Status in Humnoke
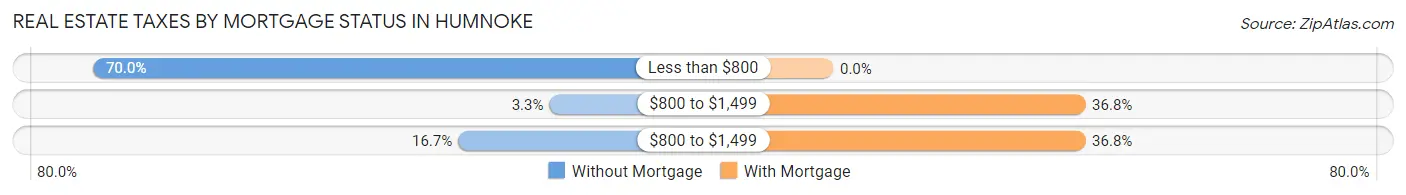
| Property Taxes | Without Mortgage | With Mortgage |
| Less than $800 | 21 (70.0%) | 0 (0.0%) |
| $800 to $1,499 | 1 (3.3%) | 7 (36.8%) |
| $800 to $1,499 | 5 (16.7%) | 7 (36.8%) |
| Total | 30 (100.0%) | 19 (100.0%) |
Health & Disability in Humnoke
Health Insurance Coverage by Age in Humnoke
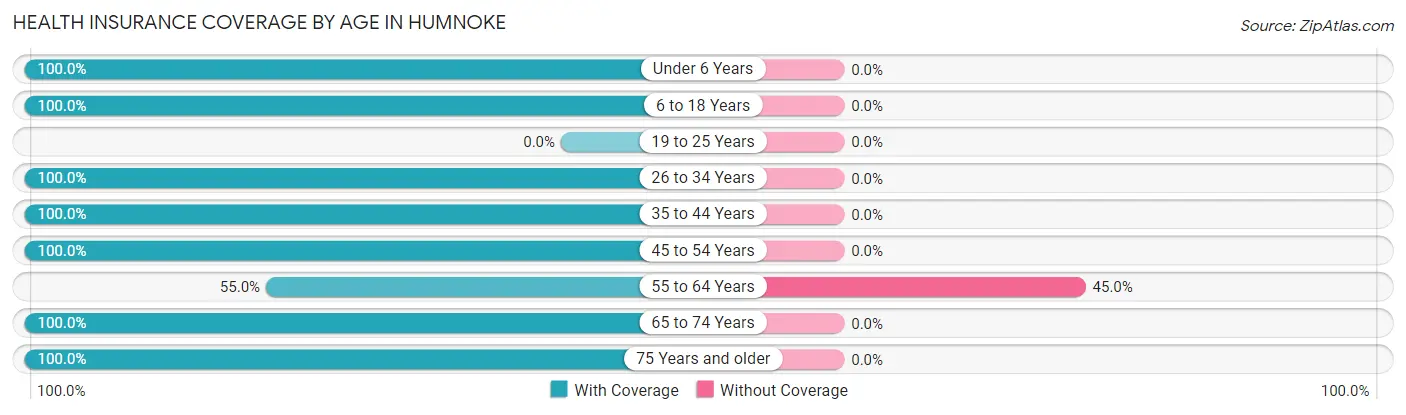
| Age Bracket | With Coverage | Without Coverage |
| Under 6 Years | 3 (100.0%) | 0 (0.0%) |
| 6 to 18 Years | 28 (100.0%) | 0 (0.0%) |
| 19 to 25 Years | 0 (0.0%) | 0 (0.0%) |
| 26 to 34 Years | 20 (100.0%) | 0 (0.0%) |
| 35 to 44 Years | 7 (100.0%) | 0 (0.0%) |
| 45 to 54 Years | 7 (100.0%) | 0 (0.0%) |
| 55 to 64 Years | 11 (55.0%) | 9 (45.0%) |
| 65 to 74 Years | 13 (100.0%) | 0 (0.0%) |
| 75 Years and older | 37 (100.0%) | 0 (0.0%) |
| Total | 126 (93.3%) | 9 (6.7%) |
Health Insurance Coverage by Citizenship Status in Humnoke
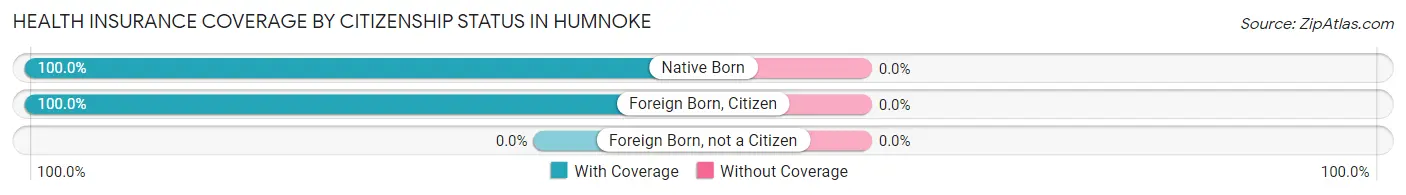
| Citizenship Status | With Coverage | Without Coverage |
| Native Born | 3 (100.0%) | 0 (0.0%) |
| Foreign Born, Citizen | 28 (100.0%) | 0 (0.0%) |
| Foreign Born, not a Citizen | 0 (0.0%) | 0 (0.0%) |
Health Insurance Coverage by Household Income in Humnoke
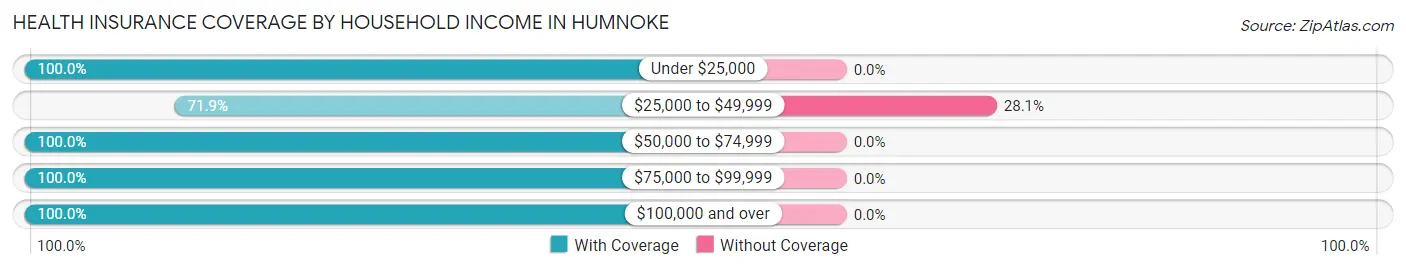
| Household Income | With Coverage | Without Coverage |
| Under $25,000 | 22 (100.0%) | 0 (0.0%) |
| $25,000 to $49,999 | 23 (71.9%) | 9 (28.1%) |
| $50,000 to $74,999 | 60 (100.0%) | 0 (0.0%) |
| $75,000 to $99,999 | 4 (100.0%) | 0 (0.0%) |
| $100,000 and over | 17 (100.0%) | 0 (0.0%) |
Public vs Private Health Insurance Coverage by Age in Humnoke
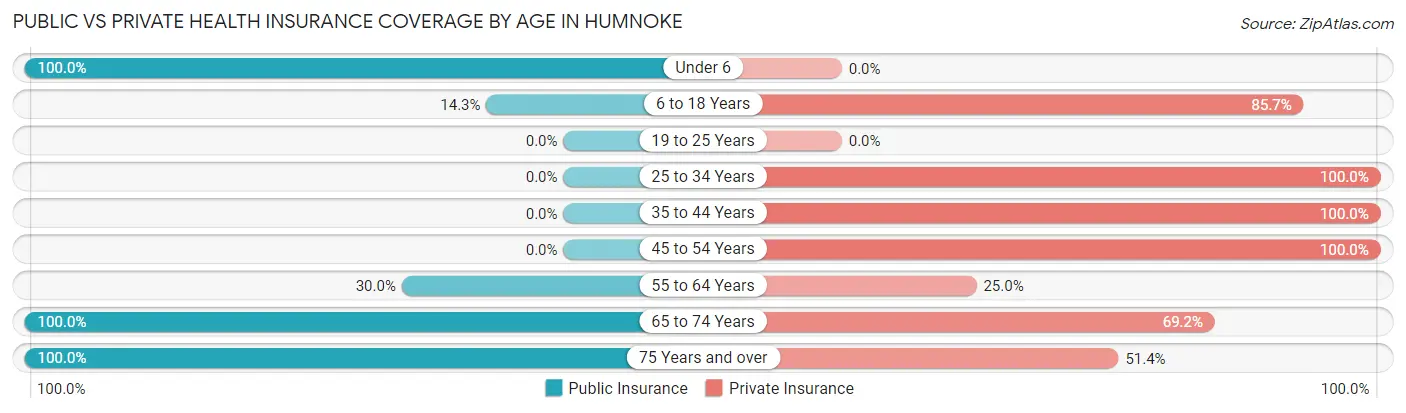
| Age Bracket | Public Insurance | Private Insurance |
| Under 6 | 3 (100.0%) | 0 (0.0%) |
| 6 to 18 Years | 4 (14.3%) | 24 (85.7%) |
| 19 to 25 Years | 0 (0.0%) | 0 (0.0%) |
| 25 to 34 Years | 0 (0.0%) | 20 (100.0%) |
| 35 to 44 Years | 0 (0.0%) | 7 (100.0%) |
| 45 to 54 Years | 0 (0.0%) | 7 (100.0%) |
| 55 to 64 Years | 6 (30.0%) | 5 (25.0%) |
| 65 to 74 Years | 13 (100.0%) | 9 (69.2%) |
| 75 Years and over | 37 (100.0%) | 19 (51.3%) |
| Total | 63 (46.7%) | 91 (67.4%) |
Disability Status by Sex by Age in Humnoke
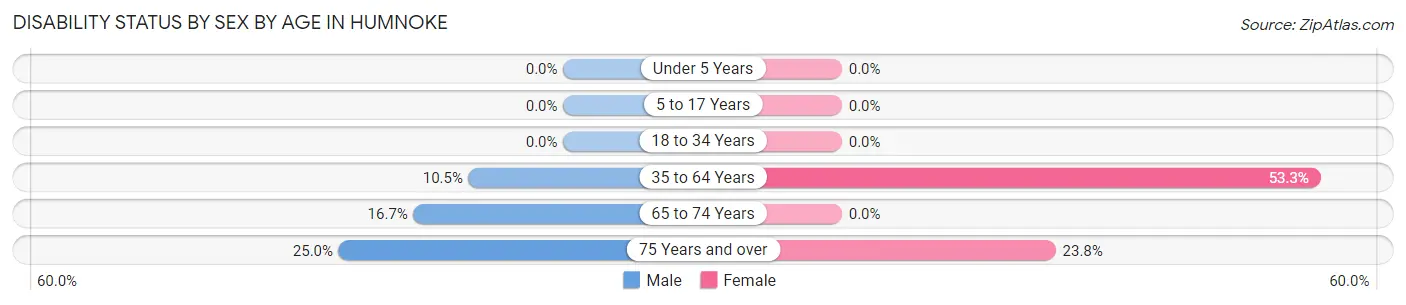
| Age Bracket | Male | Female |
| Under 5 Years | 0 (0.0%) | 0 (0.0%) |
| 5 to 17 Years | 0 (0.0%) | 0 (0.0%) |
| 18 to 34 Years | 0 (0.0%) | 0 (0.0%) |
| 35 to 64 Years | 2 (10.5%) | 8 (53.3%) |
| 65 to 74 Years | 1 (16.7%) | 0 (0.0%) |
| 75 Years and over | 4 (25.0%) | 5 (23.8%) |
Disability Class by Sex by Age in Humnoke
Disability Class: Hearing Difficulty
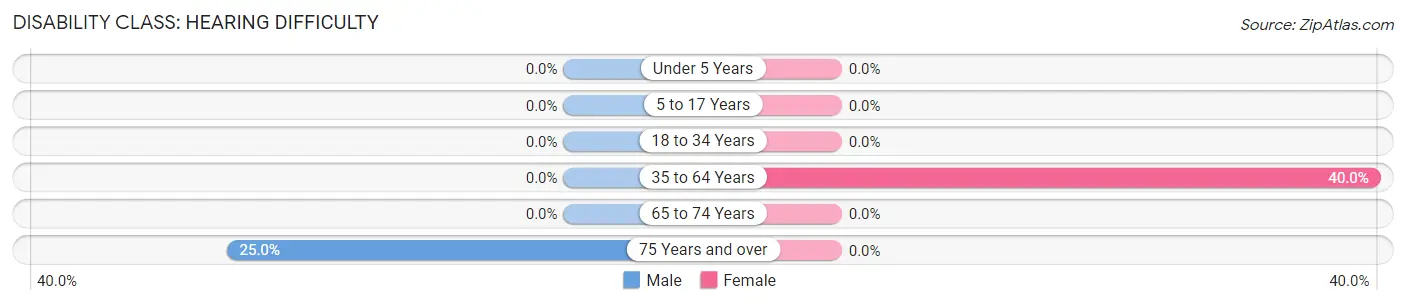
| Age Bracket | Male | Female |
| Under 5 Years | 0 (0.0%) | 0 (0.0%) |
| 5 to 17 Years | 0 (0.0%) | 0 (0.0%) |
| 18 to 34 Years | 0 (0.0%) | 0 (0.0%) |
| 35 to 64 Years | 0 (0.0%) | 6 (40.0%) |
| 65 to 74 Years | 0 (0.0%) | 0 (0.0%) |
| 75 Years and over | 4 (25.0%) | 0 (0.0%) |
Disability Class: Vision Difficulty
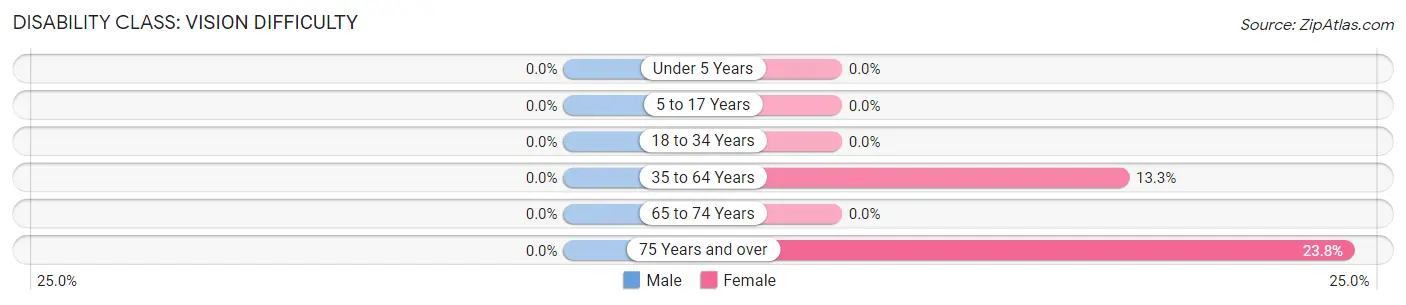
| Age Bracket | Male | Female |
| Under 5 Years | 0 (0.0%) | 0 (0.0%) |
| 5 to 17 Years | 0 (0.0%) | 0 (0.0%) |
| 18 to 34 Years | 0 (0.0%) | 0 (0.0%) |
| 35 to 64 Years | 0 (0.0%) | 2 (13.3%) |
| 65 to 74 Years | 0 (0.0%) | 0 (0.0%) |
| 75 Years and over | 0 (0.0%) | 5 (23.8%) |
Disability Class: Cognitive Difficulty
| Age Bracket | Male | Female |
| 5 to 17 Years | 0 (0.0%) | 0 (0.0%) |
| 18 to 34 Years | 0 (0.0%) | 0 (0.0%) |
| 35 to 64 Years | 0 (0.0%) | 0 (0.0%) |
| 65 to 74 Years | 0 (0.0%) | 0 (0.0%) |
| 75 Years and over | 0 (0.0%) | 0 (0.0%) |
Disability Class: Ambulatory Difficulty
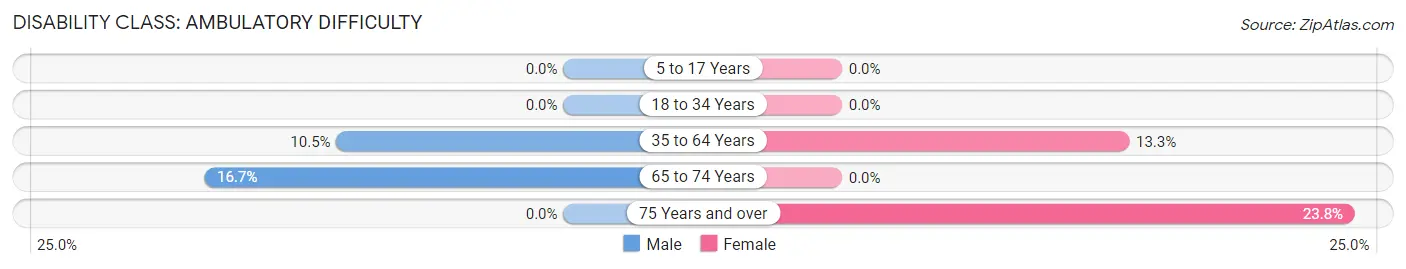
| Age Bracket | Male | Female |
| 5 to 17 Years | 0 (0.0%) | 0 (0.0%) |
| 18 to 34 Years | 0 (0.0%) | 0 (0.0%) |
| 35 to 64 Years | 2 (10.5%) | 2 (13.3%) |
| 65 to 74 Years | 1 (16.7%) | 0 (0.0%) |
| 75 Years and over | 0 (0.0%) | 5 (23.8%) |
Disability Class: Self-Care Difficulty
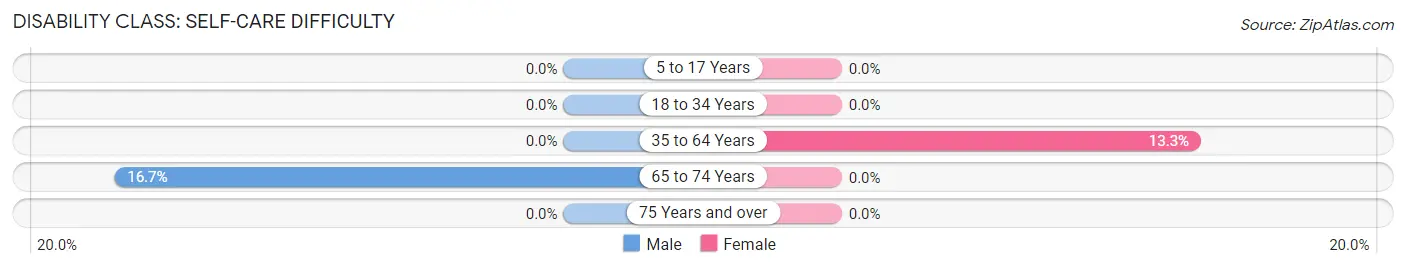
| Age Bracket | Male | Female |
| 5 to 17 Years | 0 (0.0%) | 0 (0.0%) |
| 18 to 34 Years | 0 (0.0%) | 0 (0.0%) |
| 35 to 64 Years | 0 (0.0%) | 2 (13.3%) |
| 65 to 74 Years | 1 (16.7%) | 0 (0.0%) |
| 75 Years and over | 0 (0.0%) | 0 (0.0%) |
Technology Access in Humnoke
Computing Device Access in Humnoke
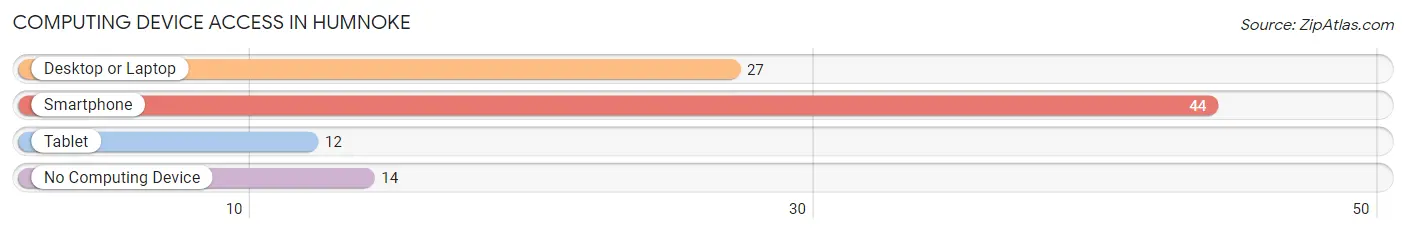
| Device Type | # Households | % Households |
| Desktop or Laptop | 27 | 44.3% |
| Smartphone | 44 | 72.1% |
| Tablet | 12 | 19.7% |
| No Computing Device | 14 | 23.0% |
| Total | 61 | 100.0% |
Internet Access in Humnoke
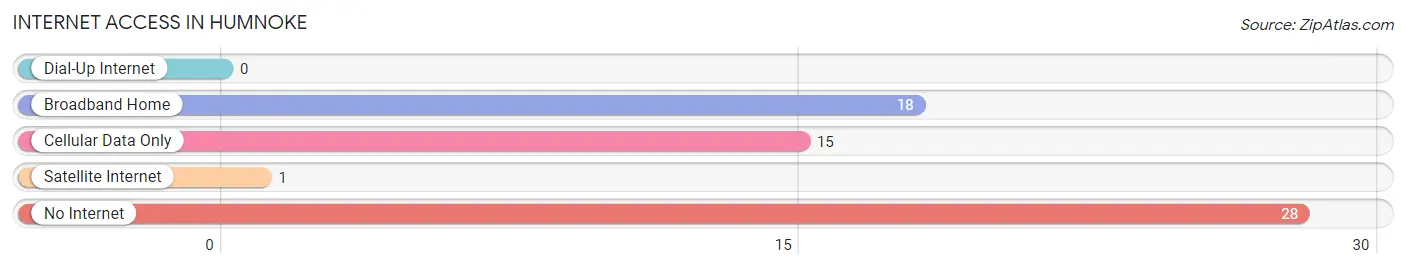
| Internet Type | # Households | % Households |
| Dial-Up Internet | 0 | 0.0% |
| Broadband Home | 18 | 29.5% |
| Cellular Data Only | 15 | 24.6% |
| Satellite Internet | 1 | 1.6% |
| No Internet | 28 | 45.9% |
| Total | 61 | 100.0% |
Humnoke Summary
Humnoke is a small town located in Arkansas, United States. It is situated in the Arkansas Delta region, in the eastern part of the state. The town is located in the Arkansas County, and is part of the Stuttgart Micropolitan Statistical Area. The population of Humnoke was estimated to be 545 in the year 2020.
History
Humnoke was founded in 1883 by the Arkansas and Louisiana Railroad. The town was named after the Humnoke Creek, which runs through the area. The town was originally a farming community, and the main crops grown were cotton, corn, and soybeans. The town was also home to a number of sawmills and lumber companies.
In the early 1900s, the town began to experience a population boom, as many African Americans moved to the area to work in the lumber industry. This influx of people led to the establishment of several churches, schools, and businesses in the town.
In the 1950s, the town began to experience a decline in population, as many of the lumber companies closed down. This led to a decrease in the number of businesses and churches in the town.
Geography
Humnoke is located in the Arkansas Delta region, in the eastern part of the state. The town is situated in the Arkansas County, and is part of the Stuttgart Micropolitan Statistical Area. The town is located at the intersection of Arkansas Highway 33 and Arkansas Highway 44.
The town is situated on the banks of the Humnoke Creek, which runs through the area. The town is surrounded by a number of small lakes and ponds, which provide a variety of recreational activities.
Economy
The economy of Humnoke is largely based on agriculture. The main crops grown in the area are cotton, corn, and soybeans. The town is also home to a number of sawmills and lumber companies.
The town is also home to a number of small businesses, including restaurants, grocery stores, and retail stores. The town is also home to a number of churches, schools, and other community organizations.
Demographics
As of the 2020 census, the population of Humnoke was estimated to be 545. The racial makeup of the town was 94.2% White, 4.2% African American, 0.2% Native American, 0.2% Asian, and 0.9% from other races.
The median household income in the town was estimated to be $31,250, and the median family income was estimated to be $37,500. The per capita income in the town was estimated to be $14,845.
Conclusion
Humnoke is a small town located in Arkansas, United States. It is situated in the Arkansas Delta region, in the eastern part of the state. The town is home to a number of small businesses, churches, schools, and other community organizations. The economy of the town is largely based on agriculture, and the main crops grown in the area are cotton, corn, and soybeans. The population of Humnoke was estimated to be 545 in the year 2020.
Common Questions
What is Per Capita Income in Humnoke?
Per Capita income in Humnoke is $24,579.
What is the Median Family Income in Humnoke?
Median Family Income in Humnoke is $62,000.
What is the Median Household income in Humnoke?
Median Household Income in Humnoke is $41,477.
What is Income or Wage Gap in Humnoke?
Income or Wage Gap in Humnoke is 46.4%.
Women in Humnoke earn 53.6 cents for every dollar earned by a man.
What is Inequality or Gini Index in Humnoke?
Inequality or Gini Index in Humnoke is 0.34.
What is the Total Population of Humnoke?
Total Population of Humnoke is 135.
What is the Total Male Population of Humnoke?
Total Male Population of Humnoke is 78.
What is the Total Female Population of Humnoke?
Total Female Population of Humnoke is 57.
What is the Ratio of Males per 100 Females in Humnoke?
There are 136.84 Males per 100 Females in Humnoke.
What is the Ratio of Females per 100 Males in Humnoke?
There are 73.08 Females per 100 Males in Humnoke.
What is the Median Population Age in Humnoke?
Median Population Age in Humnoke is 59.1 Years.
What is the Average Family Size in Humnoke
Average Family Size in Humnoke is 3.3 People.
What is the Average Household Size in Humnoke
Average Household Size in Humnoke is 2.2 People.
How Large is the Labor Force in Humnoke?
There are 53 People in the Labor Forcein in Humnoke.
What is the Percentage of People in the Labor Force in Humnoke?
46.5% of People are in the Labor Force in Humnoke.