Gillham, AR Map & Demographics
Gillham Map
Gillham Overview
$38,315
PER CAPITA INCOME
$70,769
AVG FAMILY INCOME
$71,058
AVG HOUSEHOLD INCOME
0.5%
WAGE / INCOME GAP [ % ]
99.5¢/ $1
WAGE / INCOME GAP [ $ ]
$8,663
FAMILY INCOME DEFICIT
0.65
INEQUALITY / GINI INDEX
227
TOTAL POPULATION
135
MALE POPULATION
92
FEMALE POPULATION
146.74
MALES / 100 FEMALES
68.15
FEMALES / 100 MALES
30.6
MEDIAN AGE
3.2
AVG FAMILY SIZE
3.0
AVG HOUSEHOLD SIZE
99
LABOR FORCE [ PEOPLE ]
57.2%
PERCENT IN LABOR FORCE
12.1%
UNEMPLOYMENT RATE
Gillham Zip Codes
Gillham Area Codes
Income in Gillham
Income Overview in Gillham
Per Capita Income in Gillham is $38,315, while median incomes of families and households are $70,769 and $71,058 respectively.
| Characteristic | Number | Measure |
| Per Capita Income | 227 | $38,315 |
| Median Family Income | 56 | $70,769 |
| Mean Family Income | 56 | $159,539 |
| Median Household Income | 77 | $71,058 |
| Mean Household Income | 77 | $130,690 |
| Income Deficit | 56 | $8,663 |
| Wage / Income Gap (%) | 227 | 0.55% |
| Wage / Income Gap ($) | 227 | 99.45¢ per $1 |
| Gini / Inequality Index | 227 | 0.65 |
Earnings by Sex in Gillham
Average Earnings in Gillham are $32,578, $32,500 for men and $32,679 for women, a difference of 0.5%.
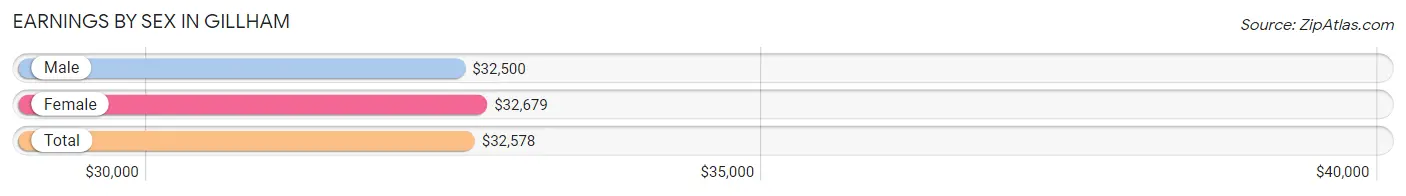
| Sex | Number | Average Earnings |
| Male | 76 (65.0%) | $32,500 |
| Female | 41 (35.0%) | $32,679 |
| Total | 117 (100.0%) | $32,578 |
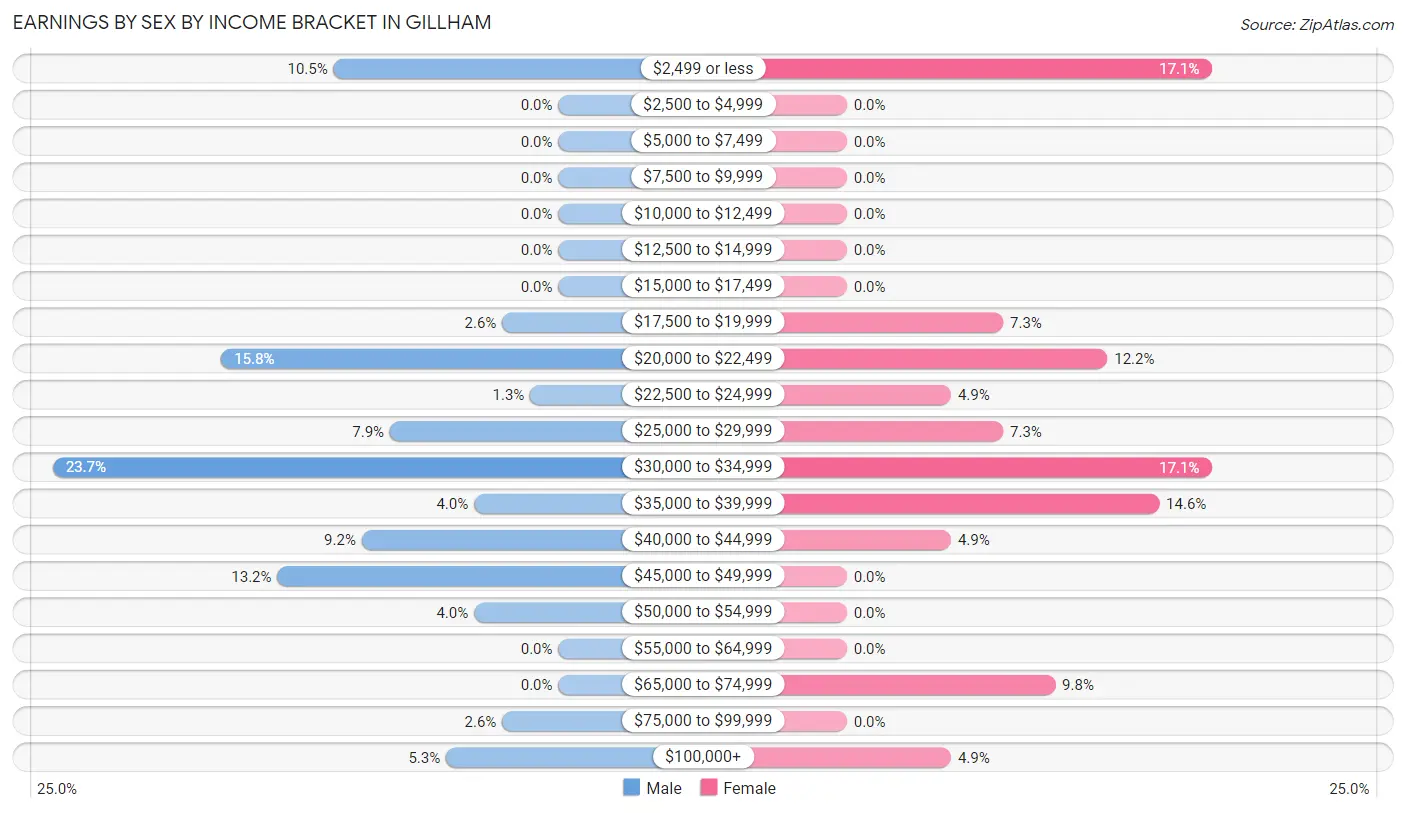
Earnings by Sex by Income Bracket in Gillham
The most common earnings brackets in Gillham are $30,000 to $34,999 for men (18 | 23.7%) and $2,499 or less for women (7 | 17.1%).
| Income | Male | Female |
| $2,499 or less | 8 (10.5%) | 7 (17.1%) |
| $2,500 to $4,999 | 0 (0.0%) | 0 (0.0%) |
| $5,000 to $7,499 | 0 (0.0%) | 0 (0.0%) |
| $7,500 to $9,999 | 0 (0.0%) | 0 (0.0%) |
| $10,000 to $12,499 | 0 (0.0%) | 0 (0.0%) |
| $12,500 to $14,999 | 0 (0.0%) | 0 (0.0%) |
| $15,000 to $17,499 | 0 (0.0%) | 0 (0.0%) |
| $17,500 to $19,999 | 2 (2.6%) | 3 (7.3%) |
| $20,000 to $22,499 | 12 (15.8%) | 5 (12.2%) |
| $22,500 to $24,999 | 1 (1.3%) | 2 (4.9%) |
| $25,000 to $29,999 | 6 (7.9%) | 3 (7.3%) |
| $30,000 to $34,999 | 18 (23.7%) | 7 (17.1%) |
| $35,000 to $39,999 | 3 (4.0%) | 6 (14.6%) |
| $40,000 to $44,999 | 7 (9.2%) | 2 (4.9%) |
| $45,000 to $49,999 | 10 (13.2%) | 0 (0.0%) |
| $50,000 to $54,999 | 3 (4.0%) | 0 (0.0%) |
| $55,000 to $64,999 | 0 (0.0%) | 0 (0.0%) |
| $65,000 to $74,999 | 0 (0.0%) | 4 (9.8%) |
| $75,000 to $99,999 | 2 (2.6%) | 0 (0.0%) |
| $100,000+ | 4 (5.3%) | 2 (4.9%) |
| Total | 76 (100.0%) | 41 (100.0%) |
Earnings by Sex by Educational Attainment in Gillham
Average earnings in Gillham are $33,472 for men and $36,250 for women, a difference of 7.7%. Men with an educational attainment of high school diploma enjoy the highest average annual earnings of $45,375, while those with less than high school education earn the least with $22,125. Women with an educational attainment of college or associate's degree earn the most with the average annual earnings of $37,750, while those with college or associate's degree education have the smallest earnings of $37,750.
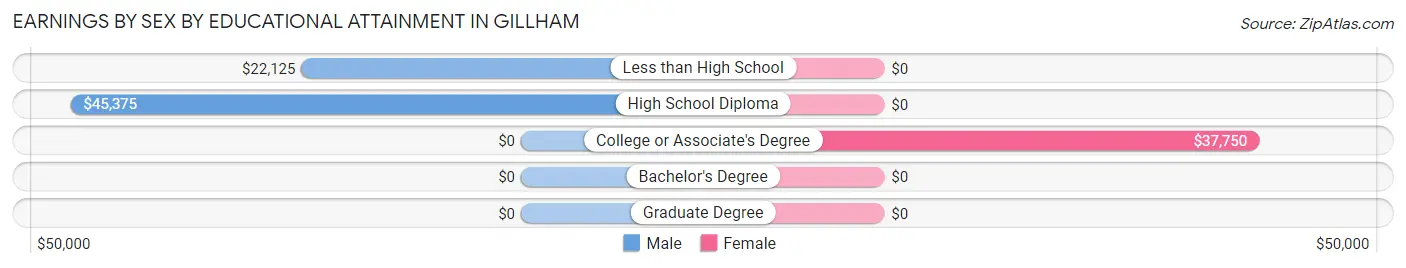
| Educational Attainment | Male Income | Female Income |
| Less than High School | $22,125 | $0 |
| High School Diploma | $45,375 | $0 |
| College or Associate's Degree | - | - |
| Bachelor's Degree | - | - |
| Graduate Degree | - | - |
| Total | $33,472 | $36,250 |
Family Income in Gillham
Family Income Brackets in Gillham
According to the Gillham family income data, there are 15 families falling into the $50,000 to $74,999 income range, which is the most common income bracket and makes up 26.8% of all families.
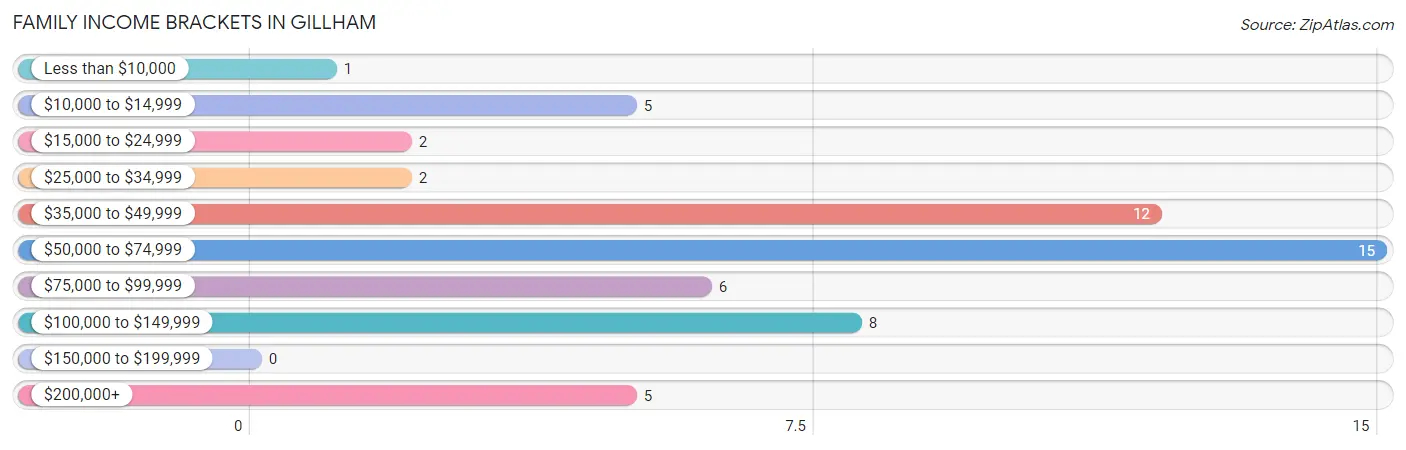
| Income Bracket | # Families | % Families |
| Less than $10,000 | 1 | 1.8% |
| $10,000 to $14,999 | 5 | 8.9% |
| $15,000 to $24,999 | 2 | 3.6% |
| $25,000 to $34,999 | 2 | 3.6% |
| $35,000 to $49,999 | 12 | 21.4% |
| $50,000 to $74,999 | 15 | 26.8% |
| $75,000 to $99,999 | 6 | 10.7% |
| $100,000 to $149,999 | 8 | 14.3% |
| $150,000 to $199,999 | 0 | 0.0% |
| $200,000+ | 5 | 8.9% |
Family Income by Famaliy Size in Gillham
2-person families (26 | 46.4%) account for the highest median family income in Gillham with $71,154 per family, while 2-person families (26 | 46.4%) have the highest median income of $35,577 per family member.
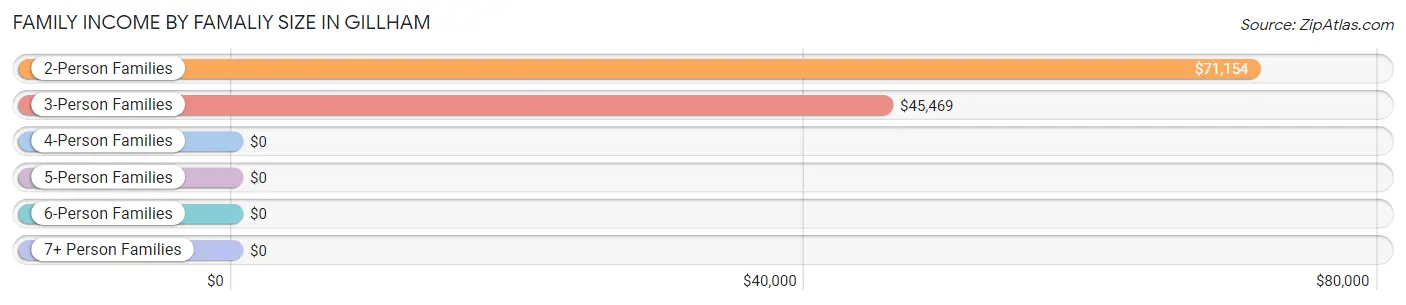
| Income Bracket | # Families | Median Income |
| 2-Person Families | 26 (46.4%) | $71,154 |
| 3-Person Families | 17 (30.4%) | $45,469 |
| 4-Person Families | 5 (8.9%) | $0 |
| 5-Person Families | 1 (1.8%) | $0 |
| 6-Person Families | 0 (0.0%) | $0 |
| 7+ Person Families | 7 (12.5%) | $0 |
| Total | 56 (100.0%) | $70,769 |
Family Income by Number of Earners in Gillham
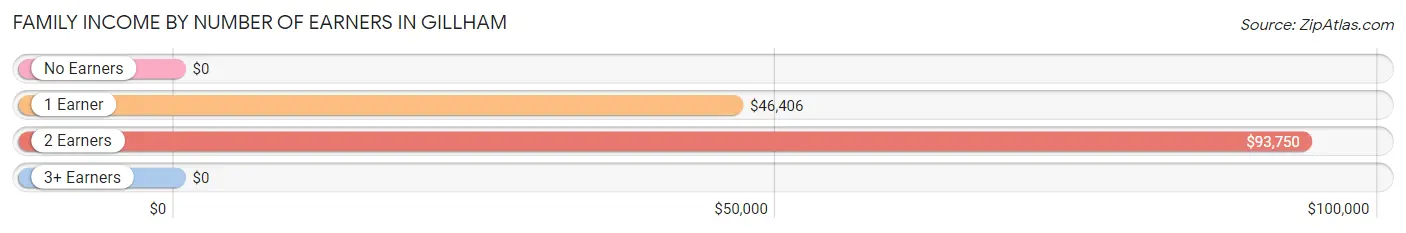
| Number of Earners | # Families | Median Income |
| No Earners | 7 (12.5%) | $0 |
| 1 Earner | 27 (48.2%) | $46,406 |
| 2 Earners | 18 (32.1%) | $93,750 |
| 3+ Earners | 4 (7.1%) | $0 |
| Total | 56 (100.0%) | $70,769 |
Household Income in Gillham
Household Income Brackets in Gillham
With 22 households falling in the category, the $50,000 to $74,999 income range is the most frequent in Gillham, accounting for 28.6% of all households.
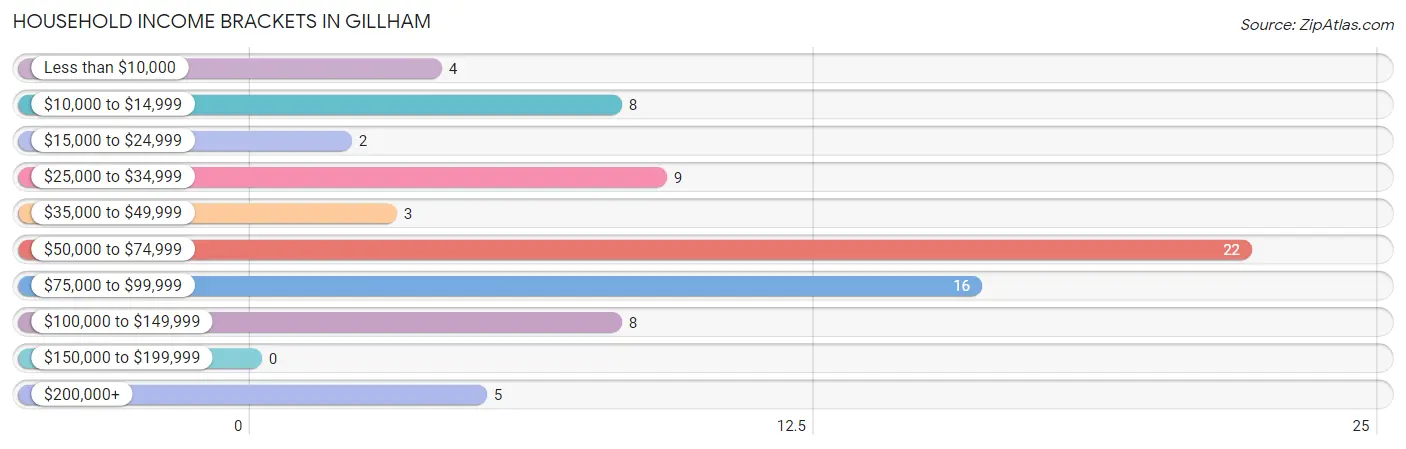
| Income Bracket | # Households | % Households |
| Less than $10,000 | 4 | 5.2% |
| $10,000 to $14,999 | 8 | 10.4% |
| $15,000 to $24,999 | 2 | 2.6% |
| $25,000 to $34,999 | 9 | 11.7% |
| $35,000 to $49,999 | 3 | 3.9% |
| $50,000 to $74,999 | 22 | 28.6% |
| $75,000 to $99,999 | 16 | 20.8% |
| $100,000 to $149,999 | 8 | 10.4% |
| $150,000 to $199,999 | 0 | 0.0% |
| $200,000+ | 5 | 6.5% |
Household Income by Householder Age in Gillham
The median household income in Gillham is $71,058, with the highest median household income of $71,667 found in the 45 to 64 years age bracket for the primary householder. A total of 22 households (28.6%) fall into this category. Meanwhile, the 15 to 24 years age bracket for the primary householder has the lowest median household income of $0, with 2 households (2.6%) in this group.
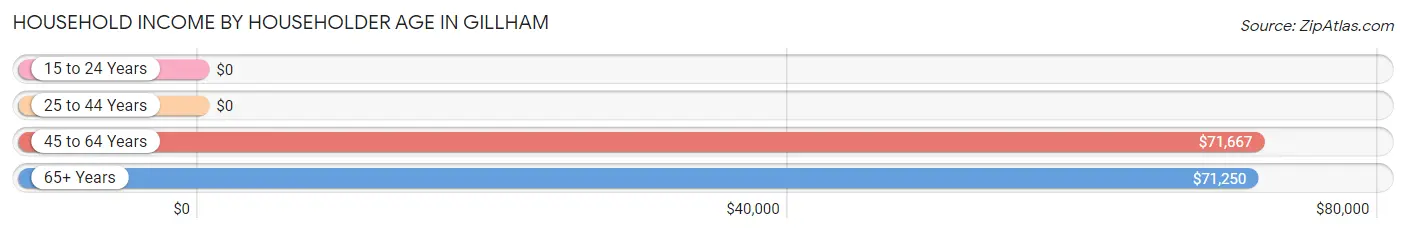
| Income Bracket | # Households | Median Income |
| 15 to 24 Years | 2 (2.6%) | $0 |
| 25 to 44 Years | 31 (40.3%) | $0 |
| 45 to 64 Years | 22 (28.6%) | $71,667 |
| 65+ Years | 22 (28.6%) | $71,250 |
| Total | 77 (100.0%) | $71,058 |
Poverty in Gillham
Income Below Poverty by Sex and Age in Gillham
With 17.0% poverty level for males and 19.6% for females among the residents of Gillham, 5 year old males and 16 and 17 year old females are the most vulnerable to poverty, with 2 males (100.0%) and 2 females (66.7%) in their respective age groups living below the poverty level.
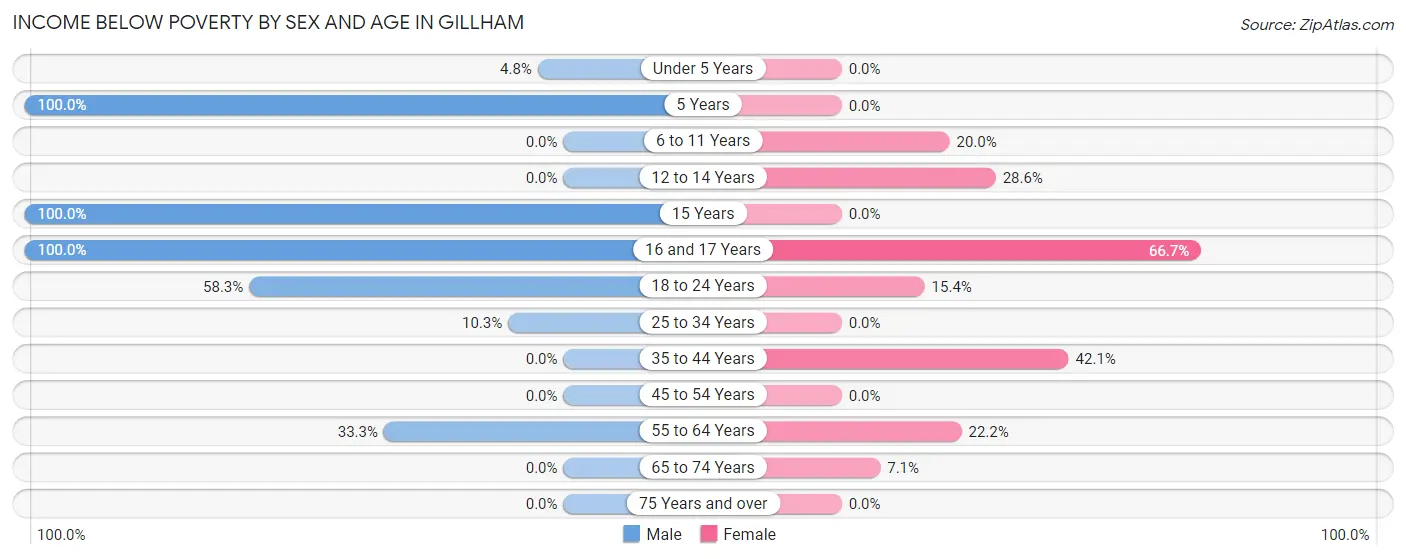
| Age Bracket | Male | Female |
| Under 5 Years | 1 (4.8%) | 0 (0.0%) |
| 5 Years | 2 (100.0%) | 0 (0.0%) |
| 6 to 11 Years | 0 (0.0%) | 1 (20.0%) |
| 12 to 14 Years | 0 (0.0%) | 2 (28.6%) |
| 15 Years | 6 (100.0%) | 0 (0.0%) |
| 16 and 17 Years | 1 (100.0%) | 2 (66.7%) |
| 18 to 24 Years | 7 (58.3%) | 2 (15.4%) |
| 25 to 34 Years | 4 (10.3%) | 0 (0.0%) |
| 35 to 44 Years | 0 (0.0%) | 8 (42.1%) |
| 45 to 54 Years | 0 (0.0%) | 0 (0.0%) |
| 55 to 64 Years | 2 (33.3%) | 2 (22.2%) |
| 65 to 74 Years | 0 (0.0%) | 1 (7.1%) |
| 75 Years and over | 0 (0.0%) | 0 (0.0%) |
| Total | 23 (17.0%) | 18 (19.6%) |
Income Above Poverty by Sex and Age in Gillham
According to the poverty statistics in Gillham, males aged 6 to 11 years and females aged 5 years are the age groups that are most secure financially, with 100.0% of males and 100.0% of females in these age groups living above the poverty line.
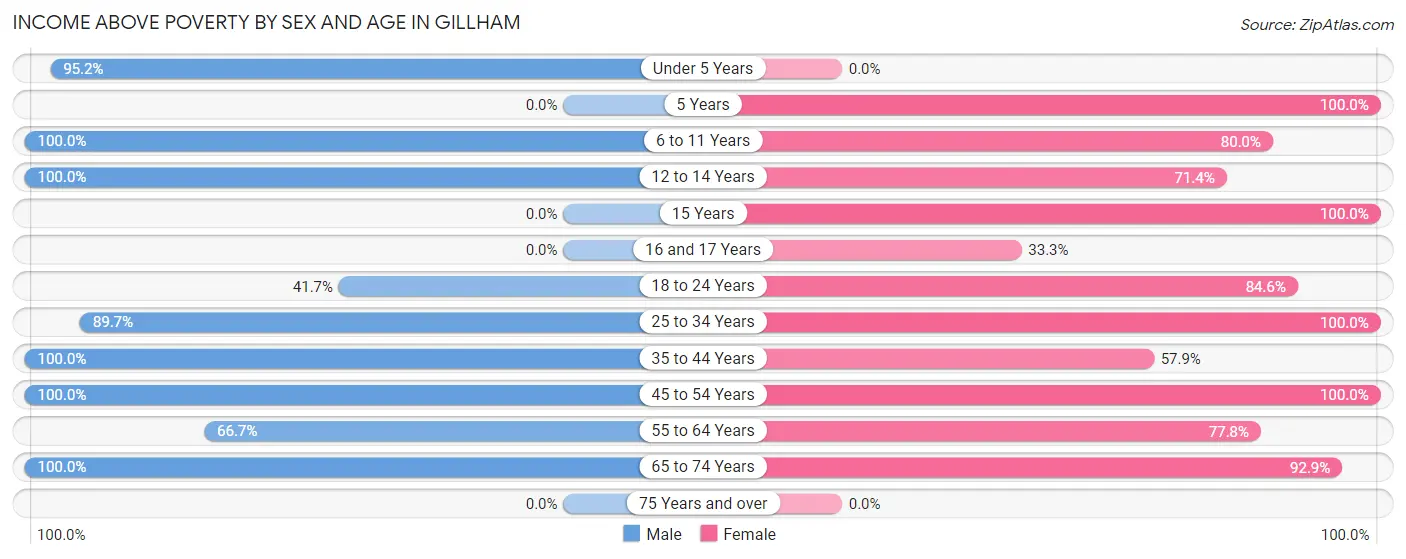
| Age Bracket | Male | Female |
| Under 5 Years | 20 (95.2%) | 0 (0.0%) |
| 5 Years | 0 (0.0%) | 2 (100.0%) |
| 6 to 11 Years | 8 (100.0%) | 4 (80.0%) |
| 12 to 14 Years | 2 (100.0%) | 5 (71.4%) |
| 15 Years | 0 (0.0%) | 1 (100.0%) |
| 16 and 17 Years | 0 (0.0%) | 1 (33.3%) |
| 18 to 24 Years | 5 (41.7%) | 11 (84.6%) |
| 25 to 34 Years | 35 (89.7%) | 7 (100.0%) |
| 35 to 44 Years | 1 (100.0%) | 11 (57.9%) |
| 45 to 54 Years | 21 (100.0%) | 12 (100.0%) |
| 55 to 64 Years | 4 (66.7%) | 7 (77.8%) |
| 65 to 74 Years | 16 (100.0%) | 13 (92.9%) |
| 75 Years and over | 0 (0.0%) | 0 (0.0%) |
| Total | 112 (83.0%) | 74 (80.4%) |
Income Below Poverty Among Married-Couple Families in Gillham
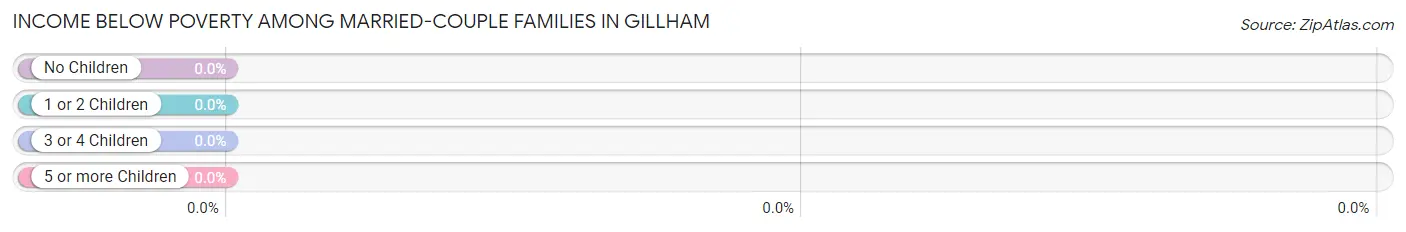
| Children | Above Poverty | Below Poverty |
| No Children | 16 (100.0%) | 0 (0.0%) |
| 1 or 2 Children | 6 (100.0%) | 0 (0.0%) |
| 3 or 4 Children | 4 (100.0%) | 0 (0.0%) |
| 5 or more Children | 3 (100.0%) | 0 (0.0%) |
| Total | 29 (100.0%) | 0 (0.0%) |
Income Below Poverty Among Single-Parent Households in Gillham
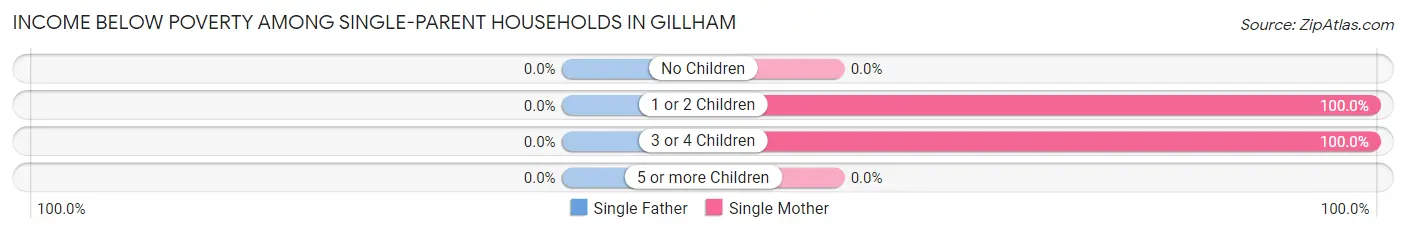
| Children | Single Father | Single Mother |
| No Children | 0 (0.0%) | 0 (0.0%) |
| 1 or 2 Children | 0 (0.0%) | 7 (100.0%) |
| 3 or 4 Children | 0 (0.0%) | 1 (100.0%) |
| 5 or more Children | 0 (0.0%) | 0 (0.0%) |
| Total | 0 (0.0%) | 8 (47.1%) |
Income Below Poverty Among Married-Couple vs Single-Parent Households in Gillham
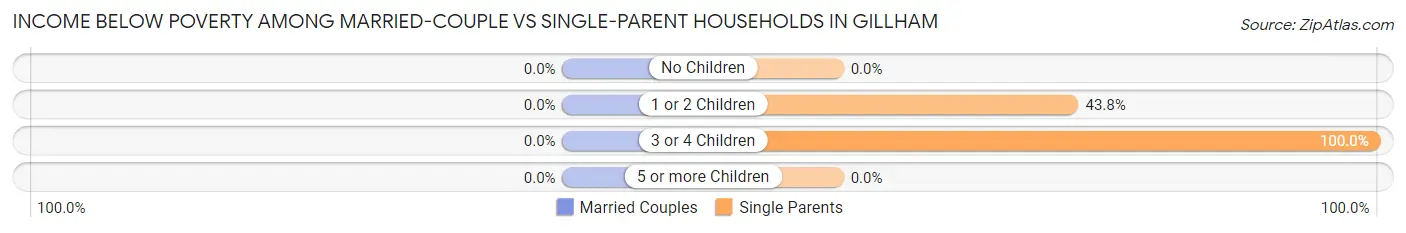
| Children | Married-Couple Families | Single-Parent Households |
| No Children | 0 (0.0%) | 0 (0.0%) |
| 1 or 2 Children | 0 (0.0%) | 7 (43.8%) |
| 3 or 4 Children | 0 (0.0%) | 1 (100.0%) |
| 5 or more Children | 0 (0.0%) | 0 (0.0%) |
| Total | 0 (0.0%) | 8 (29.6%) |
Race in Gillham
The most populous races in Gillham are White / Caucasian (196 | 86.3%), Hispanic or Latino (22 | 9.7%), and Some other Race (17 | 7.5%).
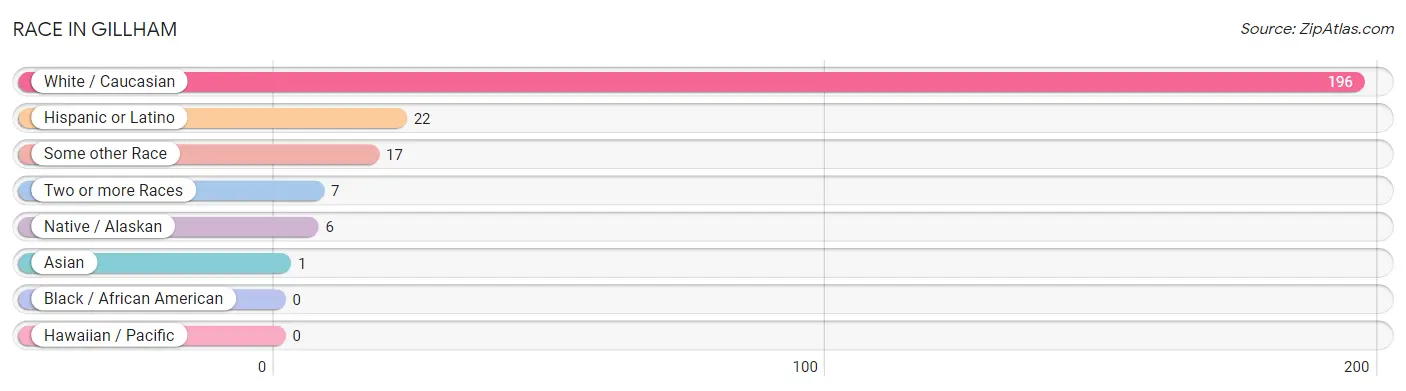
| Race | # Population | % Population |
| Asian | 1 | 0.4% |
| Black / African American | 0 | 0.0% |
| Hawaiian / Pacific | 0 | 0.0% |
| Hispanic or Latino | 22 | 9.7% |
| Native / Alaskan | 6 | 2.6% |
| White / Caucasian | 196 | 86.3% |
| Two or more Races | 7 | 3.1% |
| Some other Race | 17 | 7.5% |
| Total | 227 | 100.0% |
Ancestry in Gillham
The most populous ancestries reported in Gillham are Irish (36 | 15.9%), German (28 | 12.3%), Mexican (21 | 9.2%), American (16 | 7.0%), and Choctaw (9 | 4.0%), together accounting for 48.4% of all Gillham residents.
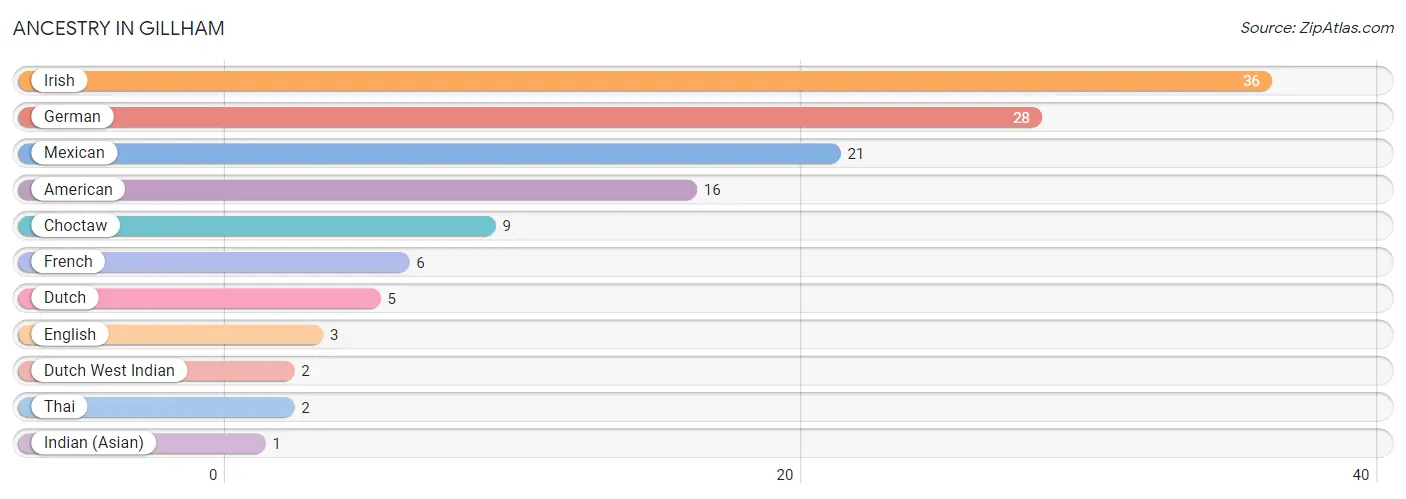
| Ancestry | # Population | % Population |
| American | 16 | 7.0% |
| Choctaw | 9 | 4.0% |
| Dutch | 5 | 2.2% |
| Dutch West Indian | 2 | 0.9% |
| English | 3 | 1.3% |
| French | 6 | 2.6% |
| German | 28 | 12.3% |
| Indian (Asian) | 1 | 0.4% |
| Irish | 36 | 15.9% |
| Mexican | 21 | 9.2% |
| Thai | 2 | 0.9% | View All 11 Rows |
Immigrants in Gillham
The most numerous immigrant groups reported in Gillham came from Central America (12 | 5.3%), Latin America (12 | 5.3%), and Mexico (12 | 5.3%), together accounting for 15.9% of all Gillham residents.
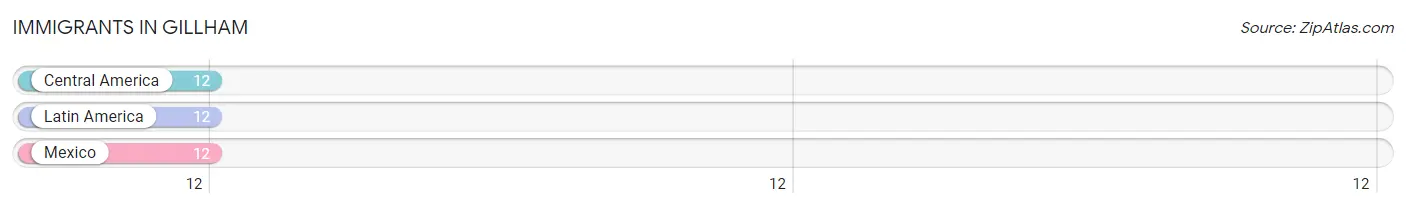
| Immigration Origin | # Population | % Population |
| Central America | 12 | 5.3% |
| Latin America | 12 | 5.3% |
| Mexico | 12 | 5.3% | View All 3 Rows |
Sex and Age in Gillham
Sex and Age in Gillham
The most populous age groups in Gillham are Under 5 Years (21 | 15.6%) for men and 40 to 44 Years (13 | 14.1%) for women.
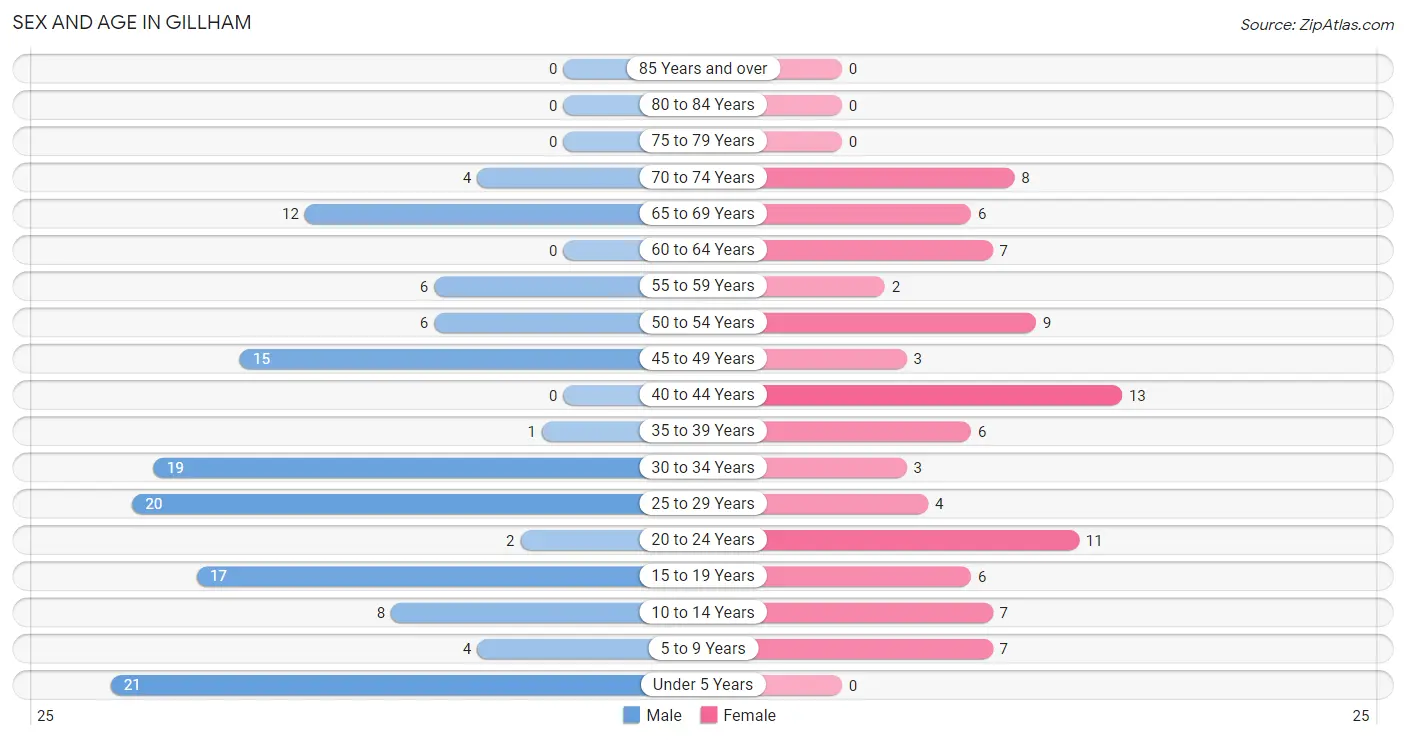
| Age Bracket | Male | Female |
| Under 5 Years | 21 (15.6%) | 0 (0.0%) |
| 5 to 9 Years | 4 (3.0%) | 7 (7.6%) |
| 10 to 14 Years | 8 (5.9%) | 7 (7.6%) |
| 15 to 19 Years | 17 (12.6%) | 6 (6.5%) |
| 20 to 24 Years | 2 (1.5%) | 11 (12.0%) |
| 25 to 29 Years | 20 (14.8%) | 4 (4.3%) |
| 30 to 34 Years | 19 (14.1%) | 3 (3.3%) |
| 35 to 39 Years | 1 (0.7%) | 6 (6.5%) |
| 40 to 44 Years | 0 (0.0%) | 13 (14.1%) |
| 45 to 49 Years | 15 (11.1%) | 3 (3.3%) |
| 50 to 54 Years | 6 (4.4%) | 9 (9.8%) |
| 55 to 59 Years | 6 (4.4%) | 2 (2.2%) |
| 60 to 64 Years | 0 (0.0%) | 7 (7.6%) |
| 65 to 69 Years | 12 (8.9%) | 6 (6.5%) |
| 70 to 74 Years | 4 (3.0%) | 8 (8.7%) |
| 75 to 79 Years | 0 (0.0%) | 0 (0.0%) |
| 80 to 84 Years | 0 (0.0%) | 0 (0.0%) |
| 85 Years and over | 0 (0.0%) | 0 (0.0%) |
| Total | 135 (100.0%) | 92 (100.0%) |
Families and Households in Gillham
Median Family Size in Gillham
The median family size in Gillham is 3.20 persons per family, with single female/mother families (17 | 30.4%) accounting for the largest median family size of 3.35 persons per family. On the other hand, married-couple families (29 | 51.8%) represent the smallest median family size with 3.10 persons per family.
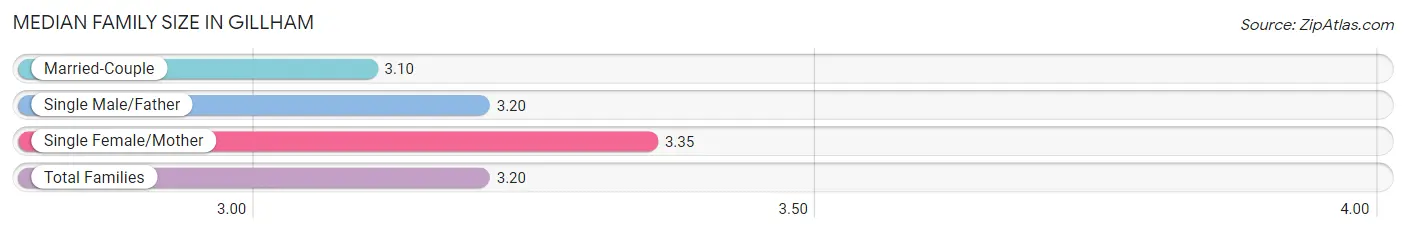
| Family Type | # Families | Family Size |
| Married-Couple | 29 (51.8%) | 3.10 |
| Single Male/Father | 10 (17.9%) | 3.20 |
| Single Female/Mother | 17 (30.4%) | 3.35 |
| Total Families | 56 (100.0%) | 3.20 |
Median Household Size in Gillham
The median household size in Gillham is 2.95 persons per household, with single female/mother households (17 | 22.1%) accounting for the largest median household size of 4.24 persons per household. non-family households (21 | 27.3%) represent the smallest median household size with 1.24 persons per household.
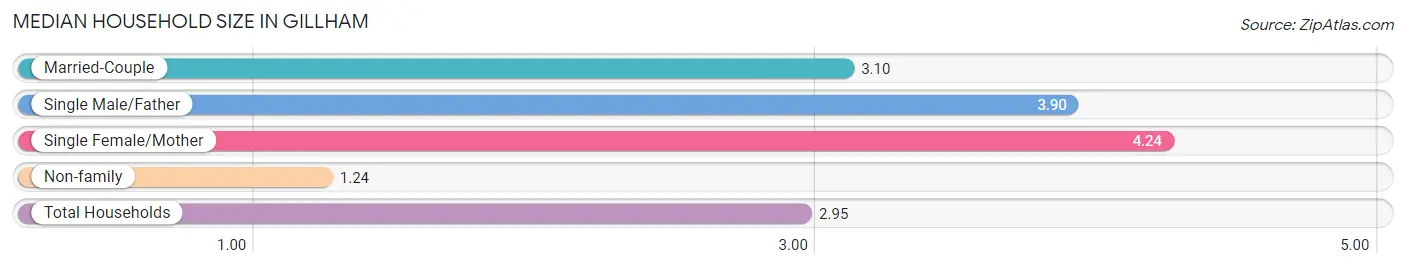
| Household Type | # Households | Household Size |
| Married-Couple | 29 (37.7%) | 3.10 |
| Single Male/Father | 10 (13.0%) | 3.90 |
| Single Female/Mother | 17 (22.1%) | 4.24 |
| Non-family | 21 (27.3%) | 1.24 |
| Total Households | 77 (100.0%) | 2.95 |
Household Size by Marriage Status in Gillham
Out of a total of 77 households in Gillham, 56 (72.7%) are family households, while 21 (27.3%) are nonfamily households. The most numerous type of family households are 2-person households, comprising 21, and the most common type of nonfamily households are 1-person households, comprising 16.
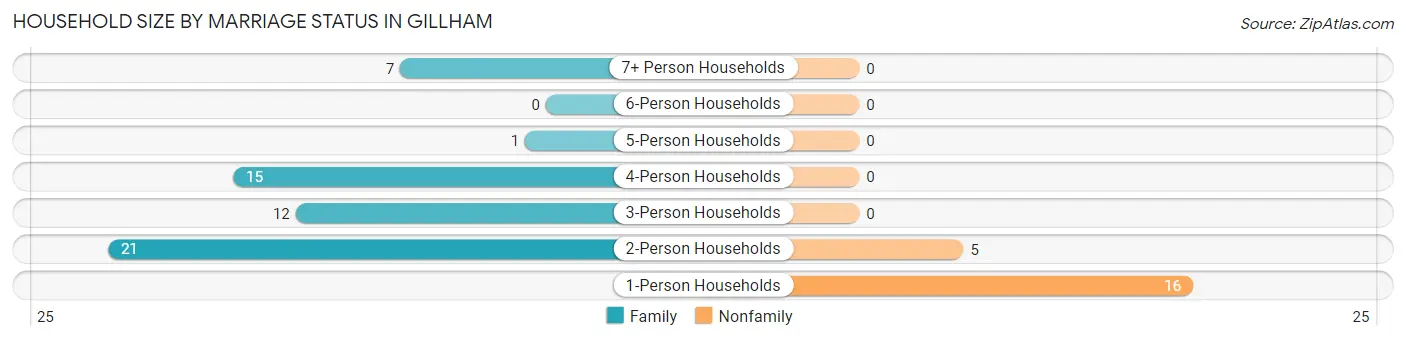
| Household Size | Family Households | Nonfamily Households |
| 1-Person Households | - | 16 (20.8%) |
| 2-Person Households | 21 (27.3%) | 5 (6.5%) |
| 3-Person Households | 12 (15.6%) | 0 (0.0%) |
| 4-Person Households | 15 (19.5%) | 0 (0.0%) |
| 5-Person Households | 1 (1.3%) | 0 (0.0%) |
| 6-Person Households | 0 (0.0%) | 0 (0.0%) |
| 7+ Person Households | 7 (9.1%) | 0 (0.0%) |
| Total | 56 (72.7%) | 21 (27.3%) |
Female Fertility in Gillham
Fertility by Age in Gillham
Average fertility rate in Gillham is 208.0 births per 1,000 women. Women in the age bracket of 20 to 34 years have the highest fertility rate with 556.0 births per 1,000 women. Women in the age bracket of 20 to 34 years acount for 100.0% of all women with births.
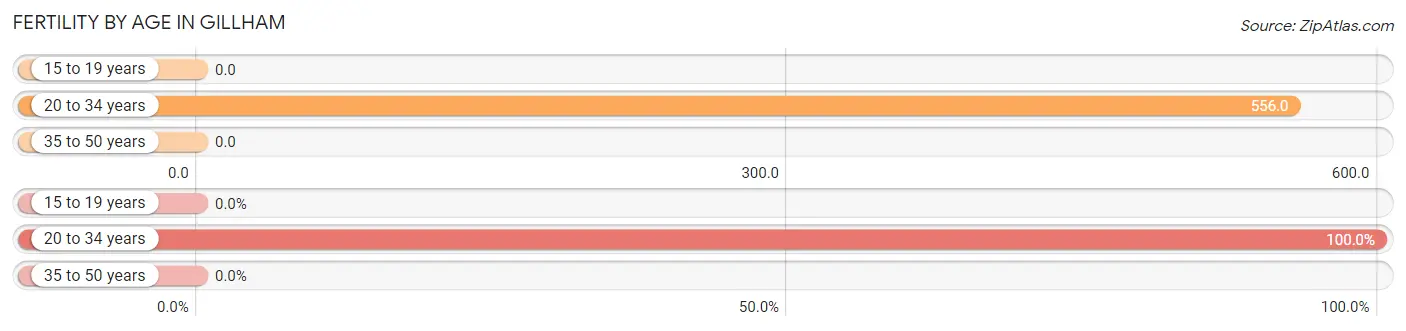
| Age Bracket | Women with Births | Births / 1,000 Women |
| 15 to 19 years | 0 (0.0%) | 0.0 |
| 20 to 34 years | 10 (100.0%) | 556.0 |
| 35 to 50 years | 0 (0.0%) | 0.0 |
| Total | 10 (100.0%) | 208.0 |
Fertility by Age by Marriage Status in Gillham
30.0% of women with births (10) in Gillham are married. The highest percentage of unmarried women with births falls into 20 to 34 years age bracket with 70.0% of them unmarried at the time of birth, while the lowest percentage of unmarried women with births belong to 20 to 34 years age bracket with 70.0% of them unmarried.
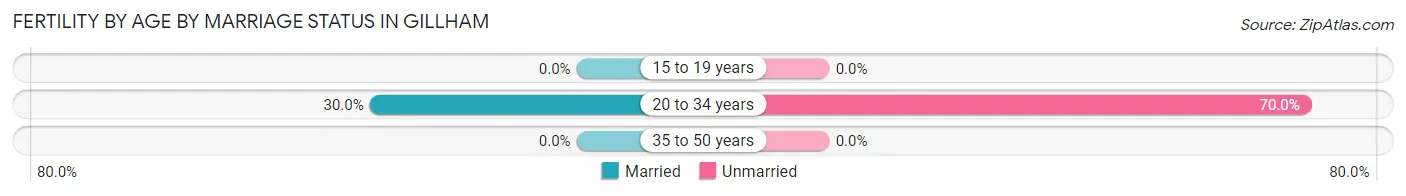
| Age Bracket | Married | Unmarried |
| 15 to 19 years | 0 (0.0%) | 0 (0.0%) |
| 20 to 34 years | 3 (30.0%) | 7 (70.0%) |
| 35 to 50 years | 0 (0.0%) | 0 (0.0%) |
| Total | 3 (30.0%) | 7 (70.0%) |
Fertility by Education in Gillham
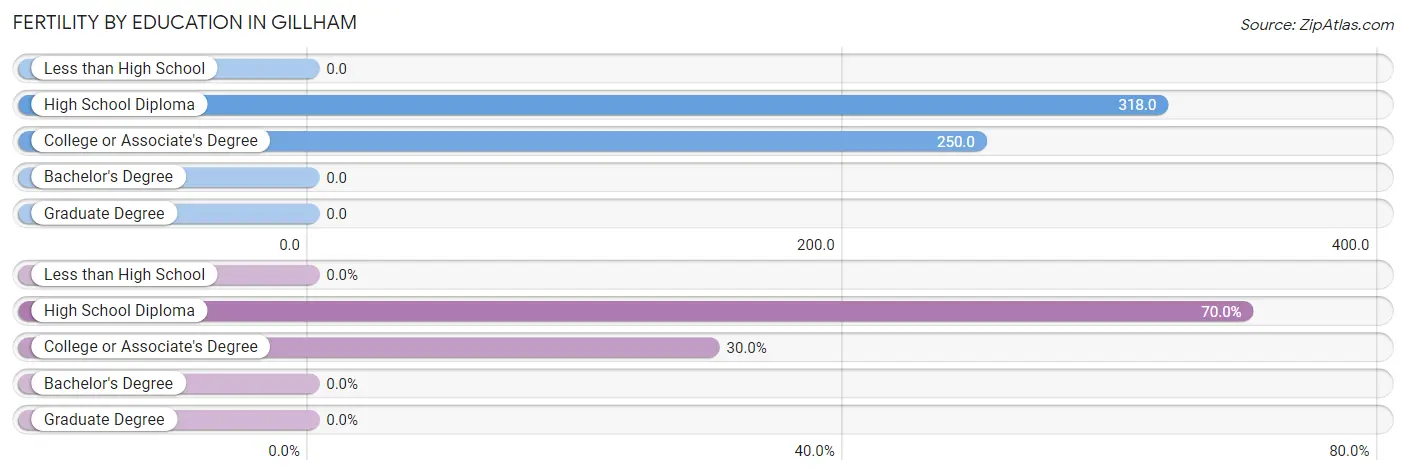
| Educational Attainment | Women with Births | Births / 1,000 Women |
| Less than High School | 0 (0.0%) | 0.0 |
| High School Diploma | 7 (70.0%) | 318.0 |
| College or Associate's Degree | 3 (30.0%) | 250.0 |
| Bachelor's Degree | 0 (0.0%) | 0.0 |
| Graduate Degree | 0 (0.0%) | 0.0 |
| Total | 10 (100.0%) | 208.0 |
Fertility by Education by Marriage Status in Gillham
70.0% of women with births in Gillham are unmarried. Women with the educational attainment of college or associate's degree are most likely to be married with 100.0% of them married at childbirth, while women with the educational attainment of high school diploma are least likely to be married with 100.0% of them unmarried at childbirth.
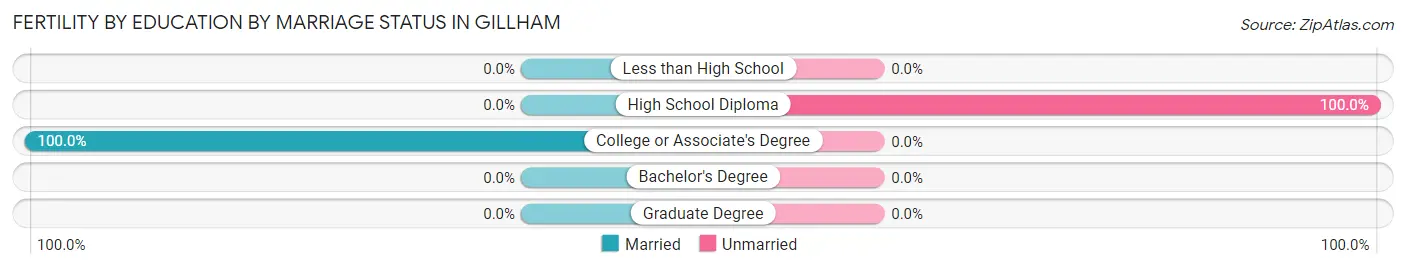
| Educational Attainment | Married | Unmarried |
| Less than High School | 0 (0.0%) | 0 (0.0%) |
| High School Diploma | 0 (0.0%) | 7 (100.0%) |
| College or Associate's Degree | 3 (100.0%) | 0 (0.0%) |
| Bachelor's Degree | 0 (0.0%) | 0 (0.0%) |
| Graduate Degree | 0 (0.0%) | 0 (0.0%) |
| Total | 3 (30.0%) | 7 (70.0%) |
Employment Characteristics in Gillham
Employment by Class of Employer in Gillham
Among the 82 employed individuals in Gillham, private company employees (69 | 84.2%), local government employees (8 | 9.8%), and federal government employees (3 | 3.7%) make up the most common classes of employment.
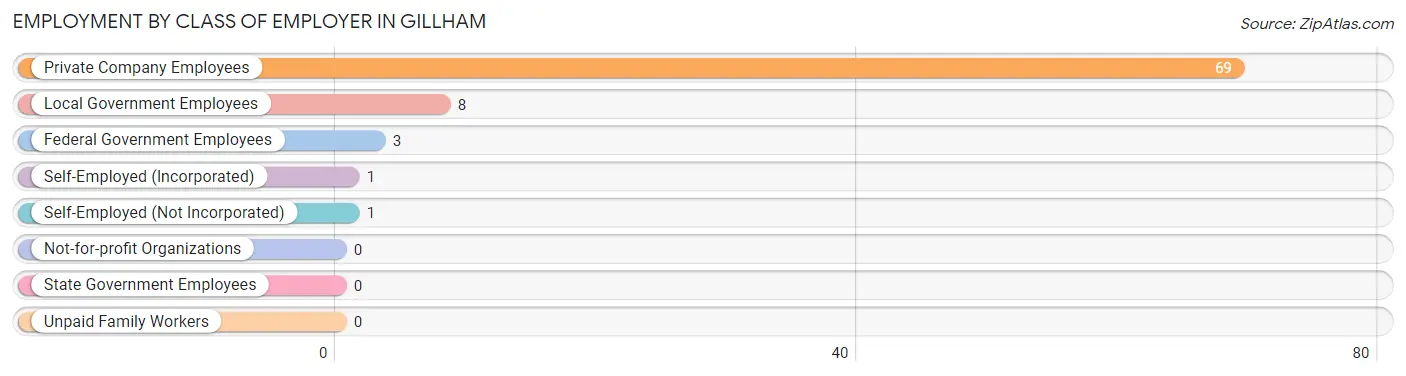
| Employer Class | # Employees | % Employees |
| Private Company Employees | 69 | 84.2% |
| Self-Employed (Incorporated) | 1 | 1.2% |
| Self-Employed (Not Incorporated) | 1 | 1.2% |
| Not-for-profit Organizations | 0 | 0.0% |
| Local Government Employees | 8 | 9.8% |
| State Government Employees | 0 | 0.0% |
| Federal Government Employees | 3 | 3.7% |
| Unpaid Family Workers | 0 | 0.0% |
| Total | 82 | 100.0% |
Employment Status by Age in Gillham
According to the labor force statistics for Gillham, out of the total population over 16 years of age (173), 57.2% or 99 individuals are in the labor force, with 12.1% or 12 of them unemployed. The age group with the highest labor force participation rate is 16 to 19 years, with 100.0% or 16 individuals in the labor force. Within the labor force, the 16 to 19 years age range has the highest percentage of unemployed individuals, with 43.8% or 7 of them being unemployed.
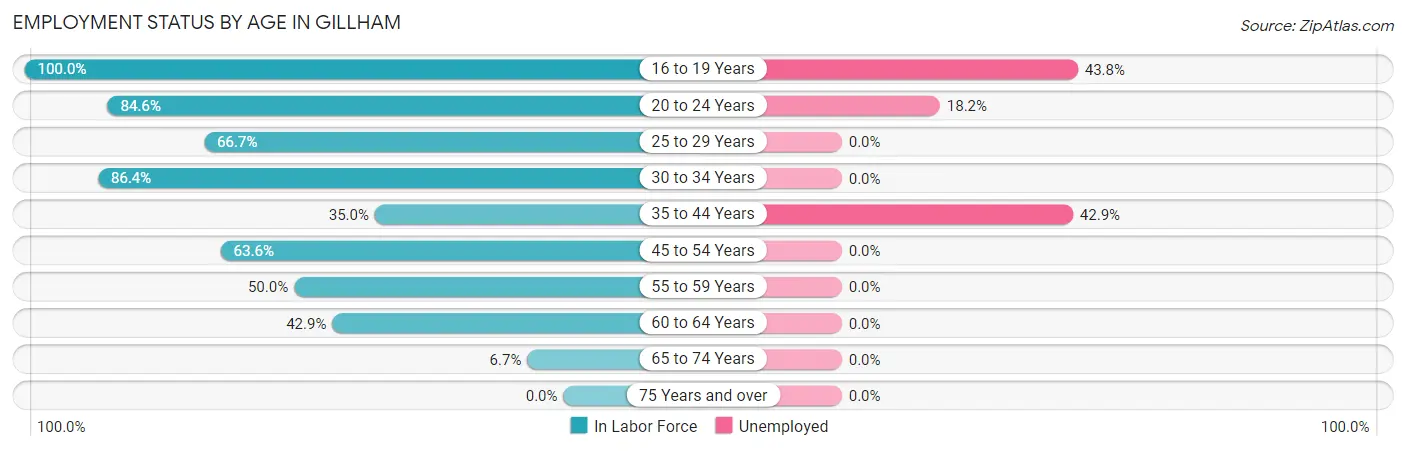
| Age Bracket | In Labor Force | Unemployed |
| 16 to 19 Years | 16 (100.0%) | 7 (43.8%) |
| 20 to 24 Years | 11 (84.6%) | 2 (18.2%) |
| 25 to 29 Years | 16 (66.7%) | 0 (0.0%) |
| 30 to 34 Years | 19 (86.4%) | 0 (0.0%) |
| 35 to 44 Years | 7 (35.0%) | 3 (42.9%) |
| 45 to 54 Years | 21 (63.6%) | 0 (0.0%) |
| 55 to 59 Years | 4 (50.0%) | 0 (0.0%) |
| 60 to 64 Years | 3 (42.9%) | 0 (0.0%) |
| 65 to 74 Years | 2 (6.7%) | 0 (0.0%) |
| 75 Years and over | 0 (0.0%) | 0 (0.0%) |
| Total | 99 (57.2%) | 12 (12.1%) |
Employment Status by Educational Attainment in Gillham
According to labor force statistics for Gillham, 61.4% of individuals (70) out of the total population between 25 and 64 years of age (114) are in the labor force, with 4.3% or 3 of them being unemployed. The group with the highest labor force participation rate are those with the educational attainment of bachelor's degree or higher, with 85.7% or 12 individuals in the labor force. Within the labor force, individuals with high school diploma education have the highest percentage of unemployment, with 10.3% or 3 of them being unemployed.
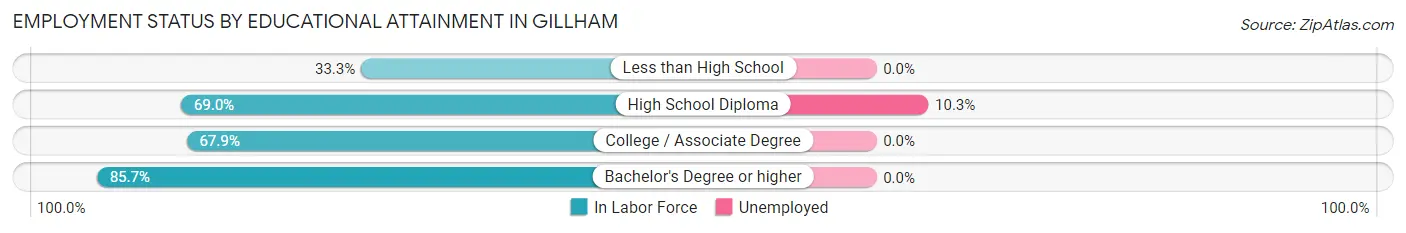
| Educational Attainment | In Labor Force | Unemployed |
| Less than High School | 10 (33.3%) | 0 (0.0%) |
| High School Diploma | 29 (69.0%) | 4 (10.3%) |
| College / Associate Degree | 19 (67.9%) | 0 (0.0%) |
| Bachelor's Degree or higher | 12 (85.7%) | 0 (0.0%) |
| Total | 70 (61.4%) | 5 (4.3%) |
Employment Occupations by Sex in Gillham
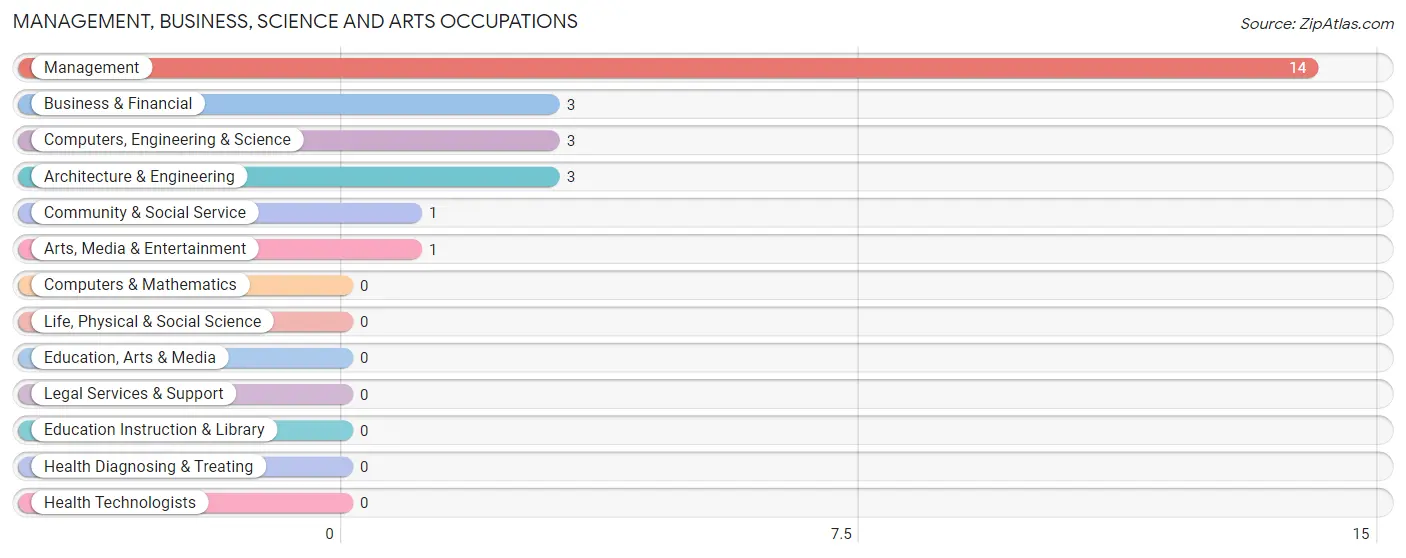
Management, Business, Science and Arts Occupations
The most common Management, Business, Science and Arts occupations in Gillham are Management (14 | 16.1%), Business & Financial (3 | 3.5%), Computers, Engineering & Science (3 | 3.5%), Architecture & Engineering (3 | 3.5%), and Community & Social Service (1 | 1.1%).
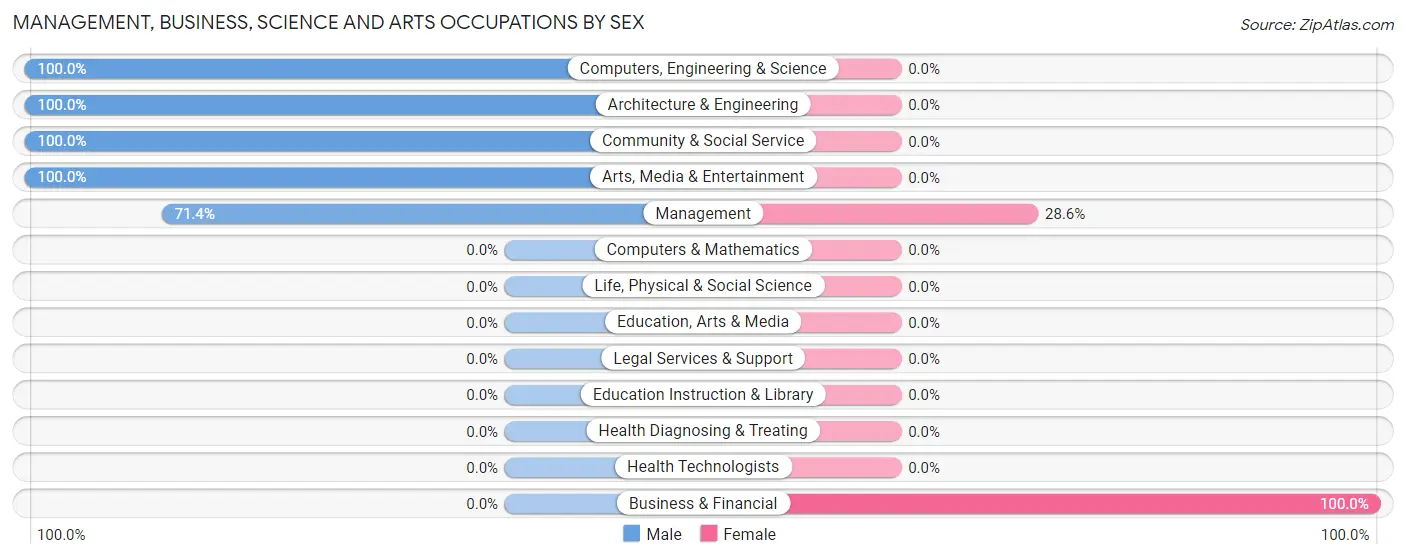
Management, Business, Science and Arts Occupations by Sex
Within the Management, Business, Science and Arts occupations in Gillham, the most male-oriented occupations are Computers, Engineering & Science (100.0%), Architecture & Engineering (100.0%), and Community & Social Service (100.0%), while the most female-oriented occupations are Business & Financial (100.0%), and Management (28.6%).
| Occupation | Male | Female |
| Management | 10 (71.4%) | 4 (28.6%) |
| Business & Financial | 0 (0.0%) | 3 (100.0%) |
| Computers, Engineering & Science | 3 (100.0%) | 0 (0.0%) |
| Computers & Mathematics | 0 (0.0%) | 0 (0.0%) |
| Architecture & Engineering | 3 (100.0%) | 0 (0.0%) |
| Life, Physical & Social Science | 0 (0.0%) | 0 (0.0%) |
| Community & Social Service | 1 (100.0%) | 0 (0.0%) |
| Education, Arts & Media | 0 (0.0%) | 0 (0.0%) |
| Legal Services & Support | 0 (0.0%) | 0 (0.0%) |
| Education Instruction & Library | 0 (0.0%) | 0 (0.0%) |
| Arts, Media & Entertainment | 1 (100.0%) | 0 (0.0%) |
| Health Diagnosing & Treating | 0 (0.0%) | 0 (0.0%) |
| Health Technologists | 0 (0.0%) | 0 (0.0%) |
| Total (Category) | 14 (66.7%) | 7 (33.3%) |
| Total (Overall) | 59 (67.8%) | 28 (32.2%) |
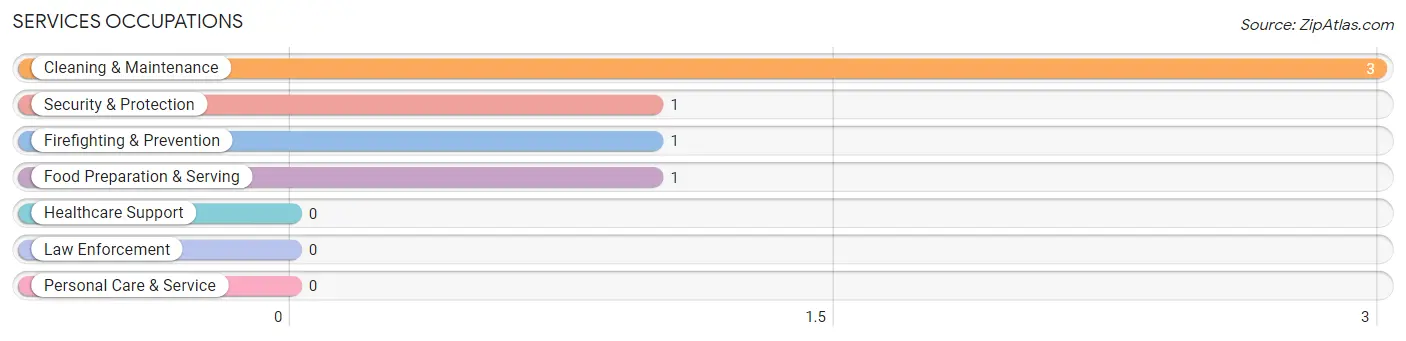
Services Occupations
The most common Services occupations in Gillham are Cleaning & Maintenance (3 | 3.5%), Security & Protection (1 | 1.1%), Firefighting & Prevention (1 | 1.1%), and Food Preparation & Serving (1 | 1.1%).
Services Occupations by Sex
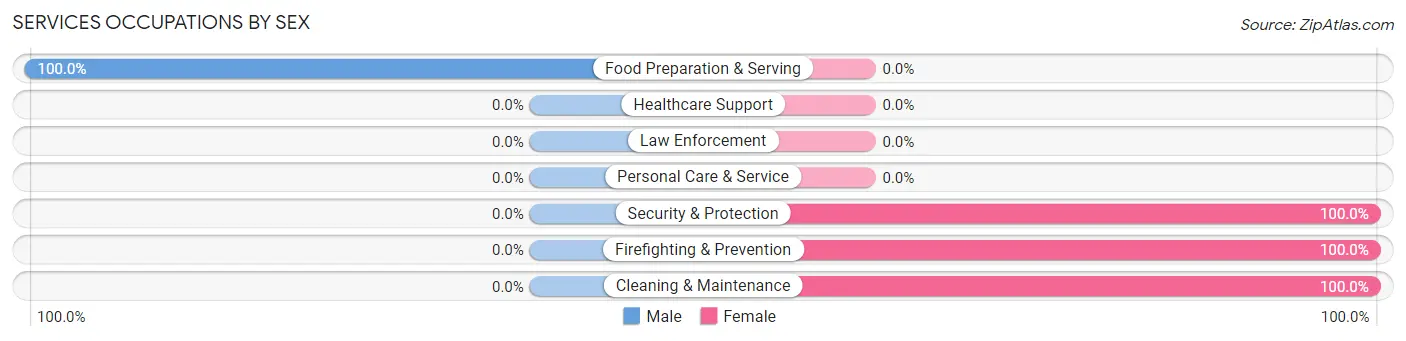
| Occupation | Male | Female |
| Healthcare Support | 0 (0.0%) | 0 (0.0%) |
| Security & Protection | 0 (0.0%) | 1 (100.0%) |
| Firefighting & Prevention | 0 (0.0%) | 1 (100.0%) |
| Law Enforcement | 0 (0.0%) | 0 (0.0%) |
| Food Preparation & Serving | 1 (100.0%) | 0 (0.0%) |
| Cleaning & Maintenance | 0 (0.0%) | 3 (100.0%) |
| Personal Care & Service | 0 (0.0%) | 0 (0.0%) |
| Total (Category) | 1 (20.0%) | 4 (80.0%) |
| Total (Overall) | 59 (67.8%) | 28 (32.2%) |
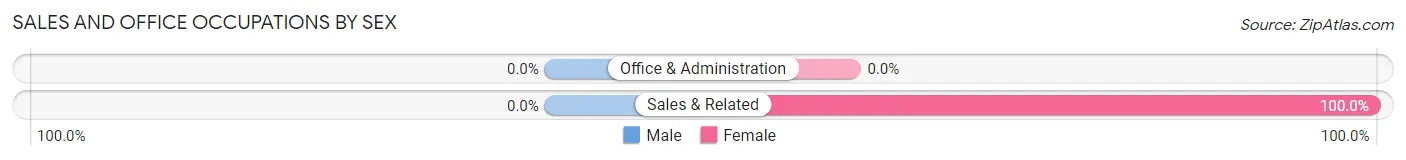
Sales and Office Occupations
The most common Sales and Office occupations in Gillham are , and Sales & Related (4 | 4.6%).
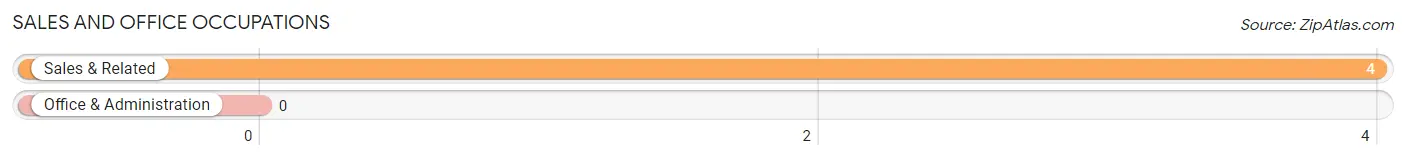
Sales and Office Occupations by Sex
| Occupation | Male | Female |
| Sales & Related | 0 (0.0%) | 4 (100.0%) |
| Office & Administration | 0 (0.0%) | 0 (0.0%) |
| Total (Category) | 0 (0.0%) | 4 (100.0%) |
| Total (Overall) | 59 (67.8%) | 28 (32.2%) |
Natural Resources, Construction and Maintenance Occupations
The most common Natural Resources, Construction and Maintenance occupations in Gillham are Construction & Extraction (16 | 18.4%), Installation, Maintenance & Repair (9 | 10.3%), and Farming, Fishing & Forestry (2 | 2.3%).
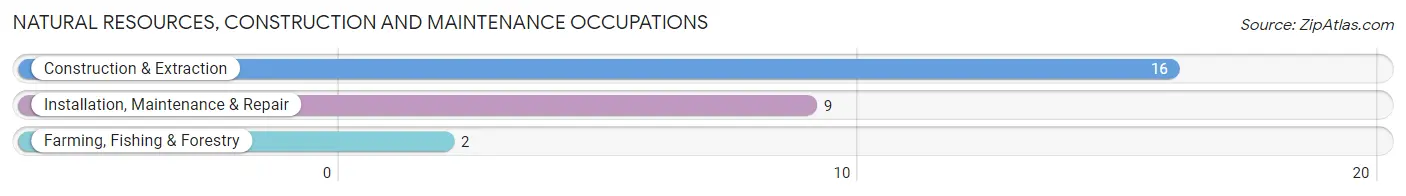
Natural Resources, Construction and Maintenance Occupations by Sex
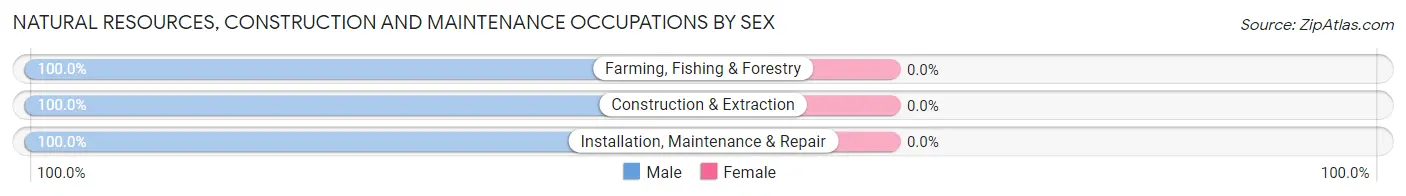
| Occupation | Male | Female |
| Farming, Fishing & Forestry | 2 (100.0%) | 0 (0.0%) |
| Construction & Extraction | 16 (100.0%) | 0 (0.0%) |
| Installation, Maintenance & Repair | 9 (100.0%) | 0 (0.0%) |
| Total (Category) | 27 (100.0%) | 0 (0.0%) |
| Total (Overall) | 59 (67.8%) | 28 (32.2%) |
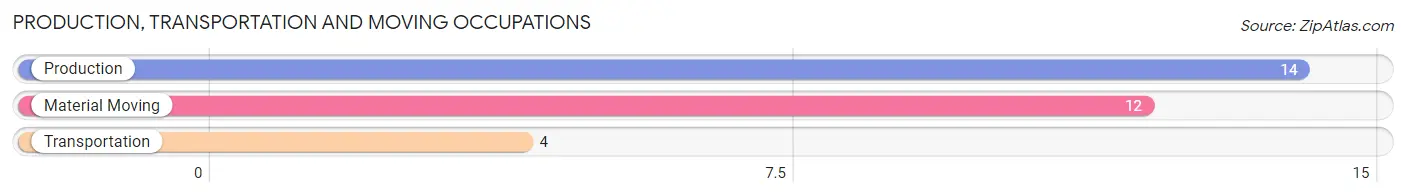
Production, Transportation and Moving Occupations
The most common Production, Transportation and Moving occupations in Gillham are Production (14 | 16.1%), Material Moving (12 | 13.8%), and Transportation (4 | 4.6%).
Production, Transportation and Moving Occupations by Sex
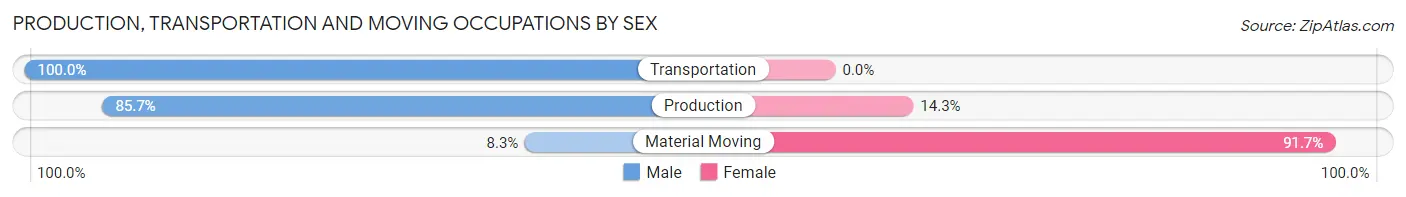
| Occupation | Male | Female |
| Production | 12 (85.7%) | 2 (14.3%) |
| Transportation | 4 (100.0%) | 0 (0.0%) |
| Material Moving | 1 (8.3%) | 11 (91.7%) |
| Total (Category) | 17 (56.7%) | 13 (43.3%) |
| Total (Overall) | 59 (67.8%) | 28 (32.2%) |
Employment Industries by Sex in Gillham
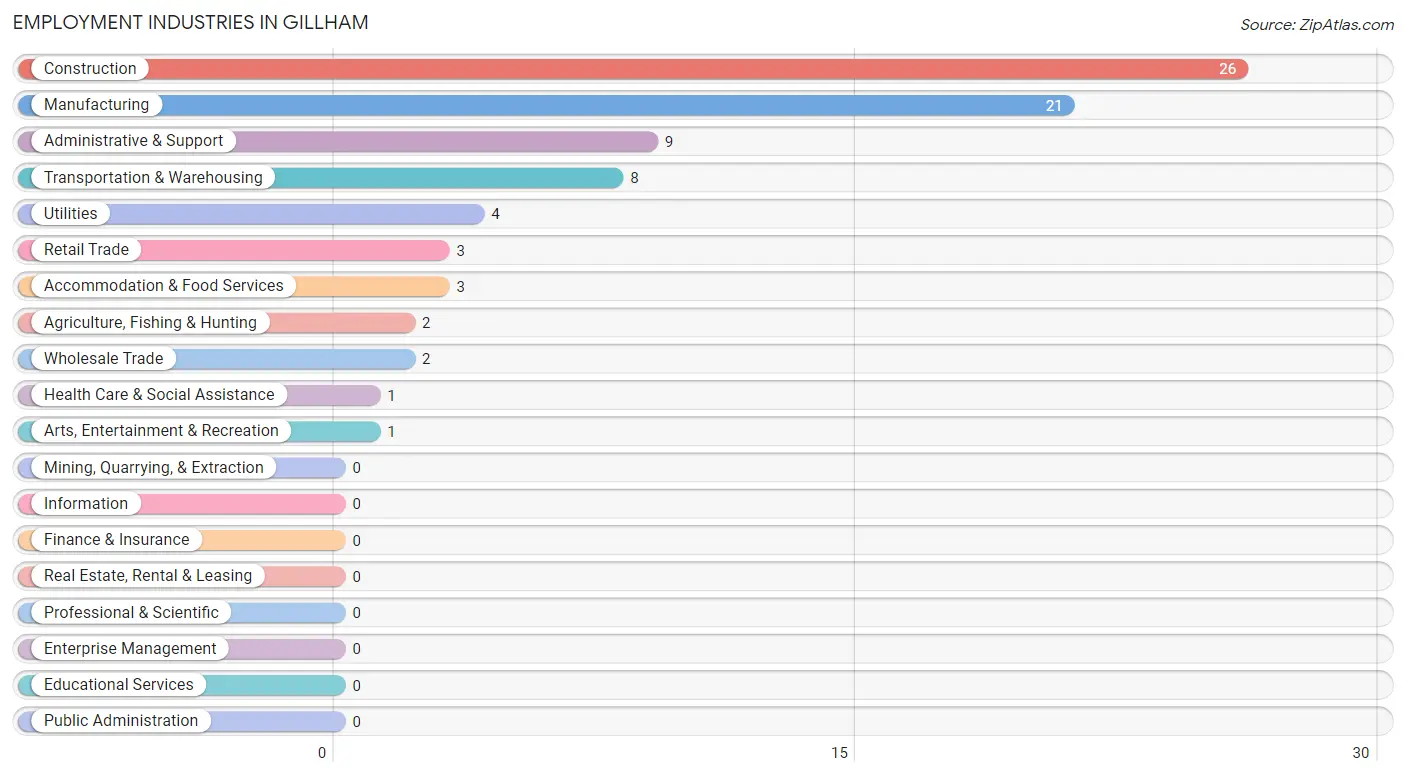
Employment Industries in Gillham
The major employment industries in Gillham include Construction (26 | 29.9%), Manufacturing (21 | 24.1%), Administrative & Support (9 | 10.3%), Transportation & Warehousing (8 | 9.2%), and Utilities (4 | 4.6%).
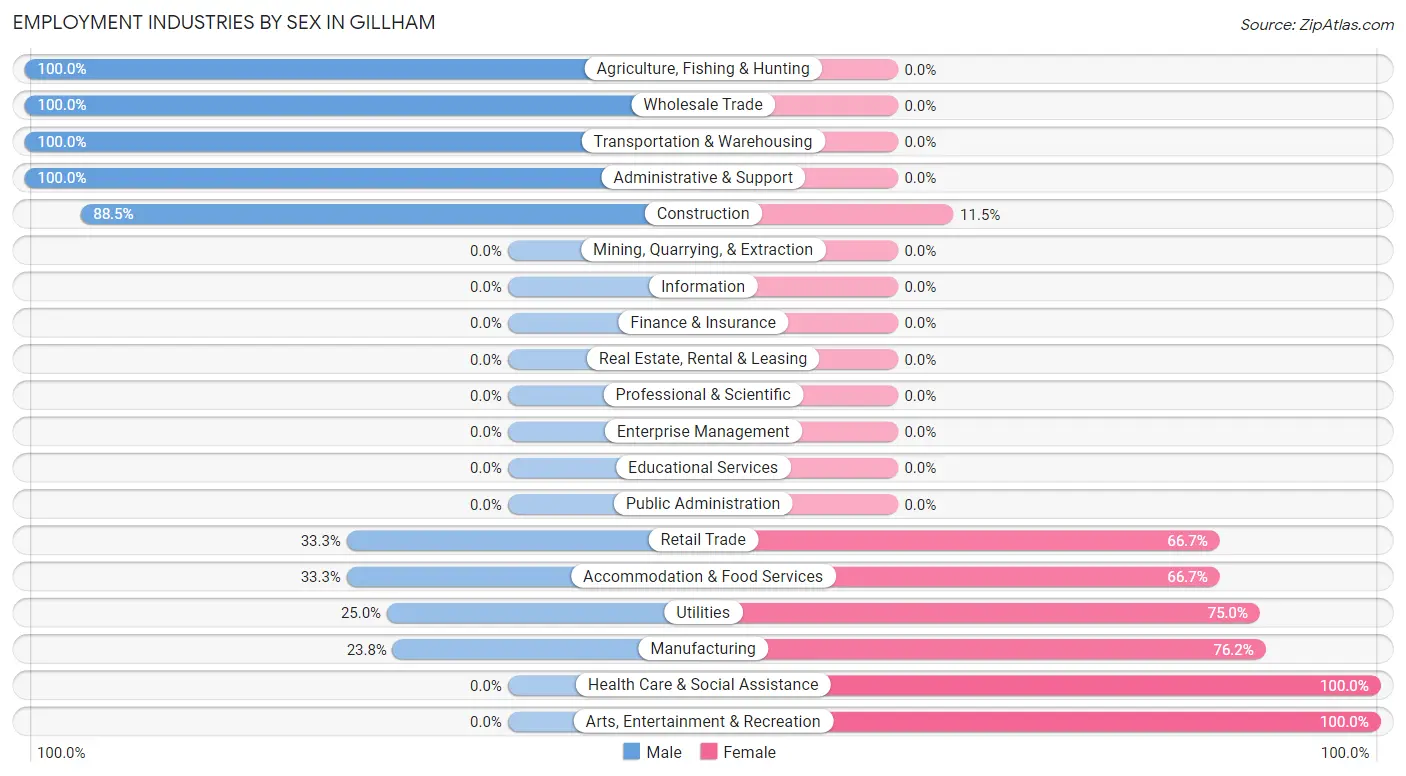
Employment Industries by Sex in Gillham
The Gillham industries that see more men than women are Agriculture, Fishing & Hunting (100.0%), Wholesale Trade (100.0%), and Transportation & Warehousing (100.0%), whereas the industries that tend to have a higher number of women are Health Care & Social Assistance (100.0%), Arts, Entertainment & Recreation (100.0%), and Manufacturing (76.2%).
| Industry | Male | Female |
| Agriculture, Fishing & Hunting | 2 (100.0%) | 0 (0.0%) |
| Mining, Quarrying, & Extraction | 0 (0.0%) | 0 (0.0%) |
| Construction | 23 (88.5%) | 3 (11.5%) |
| Manufacturing | 5 (23.8%) | 16 (76.2%) |
| Wholesale Trade | 2 (100.0%) | 0 (0.0%) |
| Retail Trade | 1 (33.3%) | 2 (66.7%) |
| Transportation & Warehousing | 8 (100.0%) | 0 (0.0%) |
| Utilities | 1 (25.0%) | 3 (75.0%) |
| Information | 0 (0.0%) | 0 (0.0%) |
| Finance & Insurance | 0 (0.0%) | 0 (0.0%) |
| Real Estate, Rental & Leasing | 0 (0.0%) | 0 (0.0%) |
| Professional & Scientific | 0 (0.0%) | 0 (0.0%) |
| Enterprise Management | 0 (0.0%) | 0 (0.0%) |
| Administrative & Support | 9 (100.0%) | 0 (0.0%) |
| Educational Services | 0 (0.0%) | 0 (0.0%) |
| Health Care & Social Assistance | 0 (0.0%) | 1 (100.0%) |
| Arts, Entertainment & Recreation | 0 (0.0%) | 1 (100.0%) |
| Accommodation & Food Services | 1 (33.3%) | 2 (66.7%) |
| Public Administration | 0 (0.0%) | 0 (0.0%) |
| Total | 59 (67.8%) | 28 (32.2%) |
Education in Gillham
School Enrollment in Gillham
The most common levels of schooling among the 47 students in Gillham are high school (15 | 31.9%), college / undergraduate (10 | 21.3%), and elementary school (9 | 19.2%).
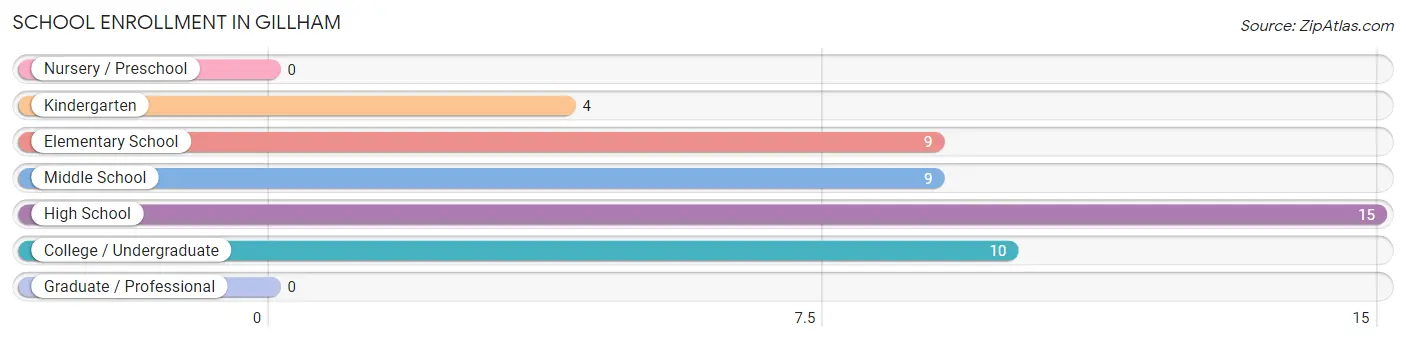
| School Level | # Students | % Students |
| Nursery / Preschool | 0 | 0.0% |
| Kindergarten | 4 | 8.5% |
| Elementary School | 9 | 19.2% |
| Middle School | 9 | 19.2% |
| High School | 15 | 31.9% |
| College / Undergraduate | 10 | 21.3% |
| Graduate / Professional | 0 | 0.0% |
| Total | 47 | 100.0% |
School Enrollment by Age by Funding Source in Gillham
Out of a total of 47 students who are enrolled in schools in Gillham, 10 (21.3%) attend a private institution, while the remaining 37 (78.7%) are enrolled in public schools. The age group of 35 years and over has the highest likelihood of being enrolled in private schools, with 4 (80.0% in the age bracket) enrolled. Conversely, the age group of 5 to 9 year old has the lowest likelihood of being enrolled in a private school, with 11 (100.0% in the age bracket) attending a public institution.
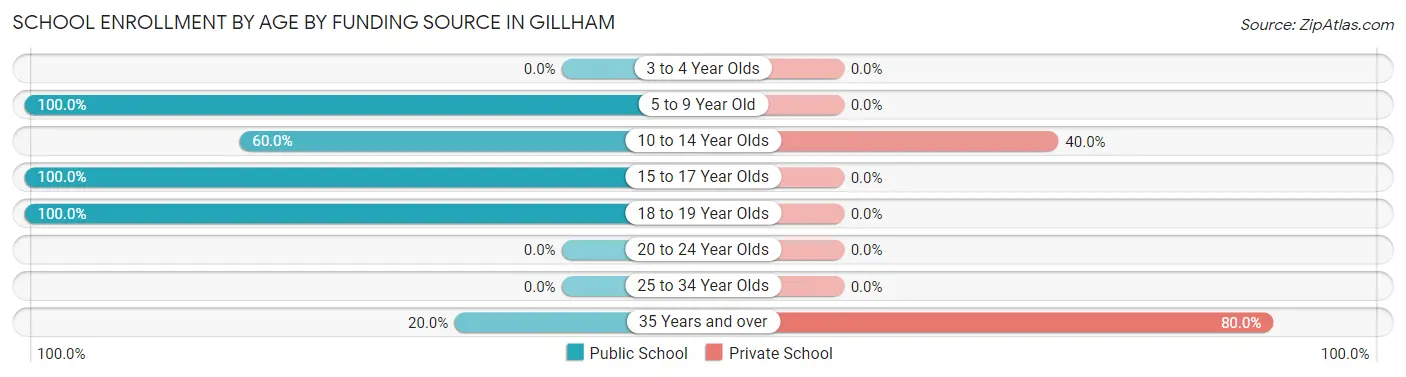
| Age Bracket | Public School | Private School |
| 3 to 4 Year Olds | 0 (0.0%) | 0 (0.0%) |
| 5 to 9 Year Old | 11 (100.0%) | 0 (0.0%) |
| 10 to 14 Year Olds | 9 (60.0%) | 6 (40.0%) |
| 15 to 17 Year Olds | 11 (100.0%) | 0 (0.0%) |
| 18 to 19 Year Olds | 5 (100.0%) | 0 (0.0%) |
| 20 to 24 Year Olds | 0 (0.0%) | 0 (0.0%) |
| 25 to 34 Year Olds | 0 (0.0%) | 0 (0.0%) |
| 35 Years and over | 1 (20.0%) | 4 (80.0%) |
| Total | 37 (78.7%) | 10 (21.3%) |
Educational Attainment by Field of Study in Gillham
Psychology (9 | 50.0%), science & technology (3 | 16.7%), education (2 | 11.1%), visual & performing arts (2 | 11.1%), and arts & humanities (2 | 11.1%) are the most common fields of study among 18 individuals in Gillham who have obtained a bachelor's degree or higher.
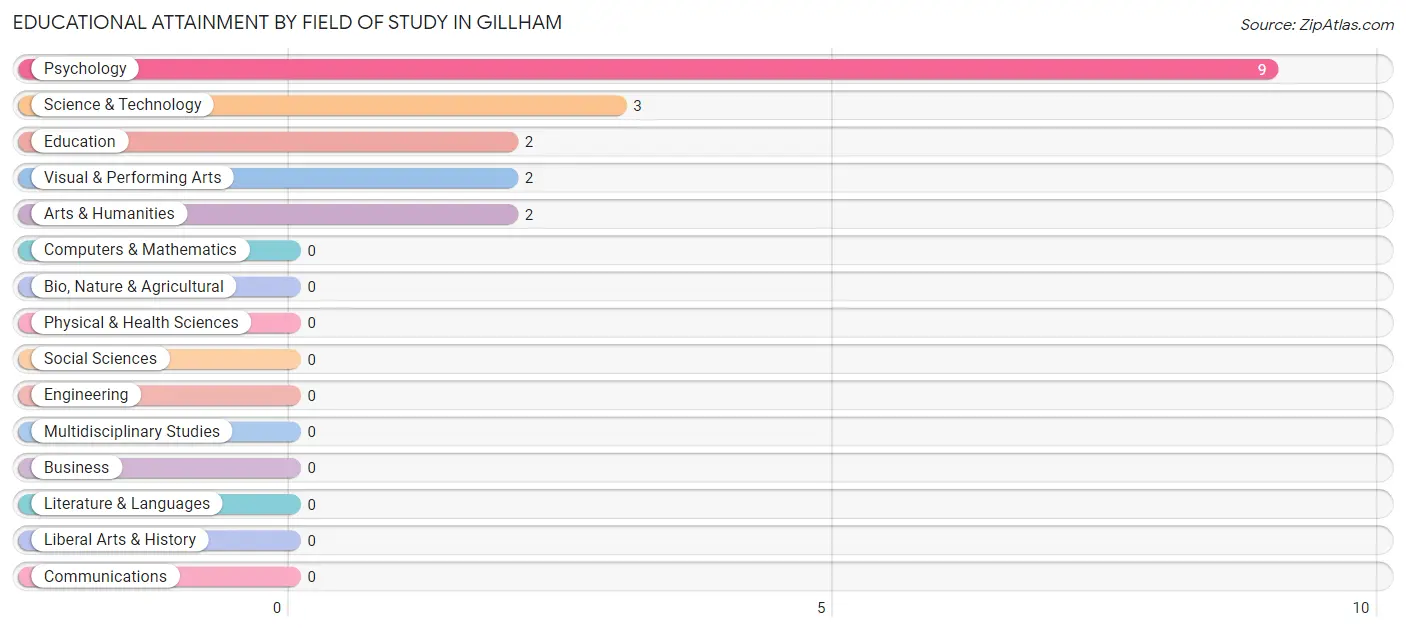
| Field of Study | # Graduates | % Graduates |
| Computers & Mathematics | 0 | 0.0% |
| Bio, Nature & Agricultural | 0 | 0.0% |
| Physical & Health Sciences | 0 | 0.0% |
| Psychology | 9 | 50.0% |
| Social Sciences | 0 | 0.0% |
| Engineering | 0 | 0.0% |
| Multidisciplinary Studies | 0 | 0.0% |
| Science & Technology | 3 | 16.7% |
| Business | 0 | 0.0% |
| Education | 2 | 11.1% |
| Literature & Languages | 0 | 0.0% |
| Liberal Arts & History | 0 | 0.0% |
| Visual & Performing Arts | 2 | 11.1% |
| Communications | 0 | 0.0% |
| Arts & Humanities | 2 | 11.1% |
| Total | 18 | 100.0% |
Transportation & Commute in Gillham
Vehicle Availability by Sex in Gillham
The most prevalent vehicle ownership categories in Gillham are males with 2 vehicles (25, accounting for 46.3%) and females with 2 vehicles (15, making up 89.3%).
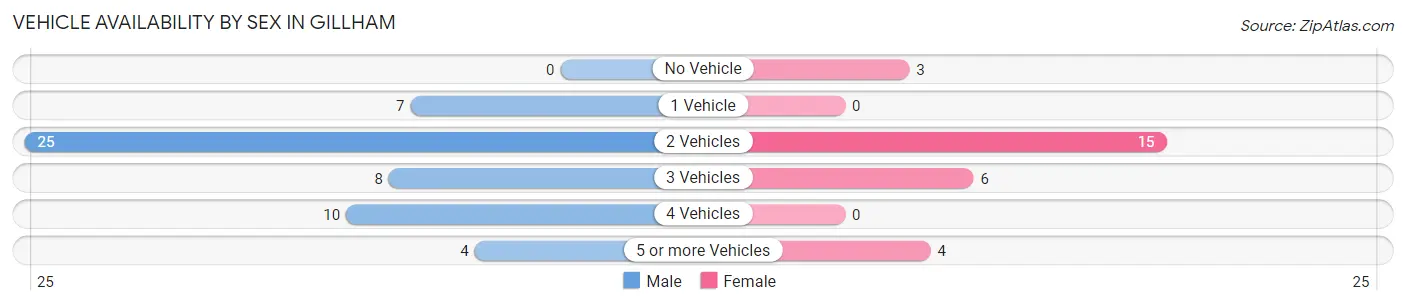
| Vehicles Available | Male | Female |
| No Vehicle | 0 (0.0%) | 3 (10.7%) |
| 1 Vehicle | 7 (13.0%) | 0 (0.0%) |
| 2 Vehicles | 25 (46.3%) | 15 (53.6%) |
| 3 Vehicles | 8 (14.8%) | 6 (21.4%) |
| 4 Vehicles | 10 (18.5%) | 0 (0.0%) |
| 5 or more Vehicles | 4 (7.4%) | 4 (14.3%) |
| Total | 54 (100.0%) | 28 (100.0%) |
Commute Time in Gillham
The most frequently occuring commute durations in Gillham are 15 to 19 minutes (28 commuters, 38.4%), 60 to 89 minutes (14 commuters, 19.2%), and 25 to 29 minutes (7 commuters, 9.6%).
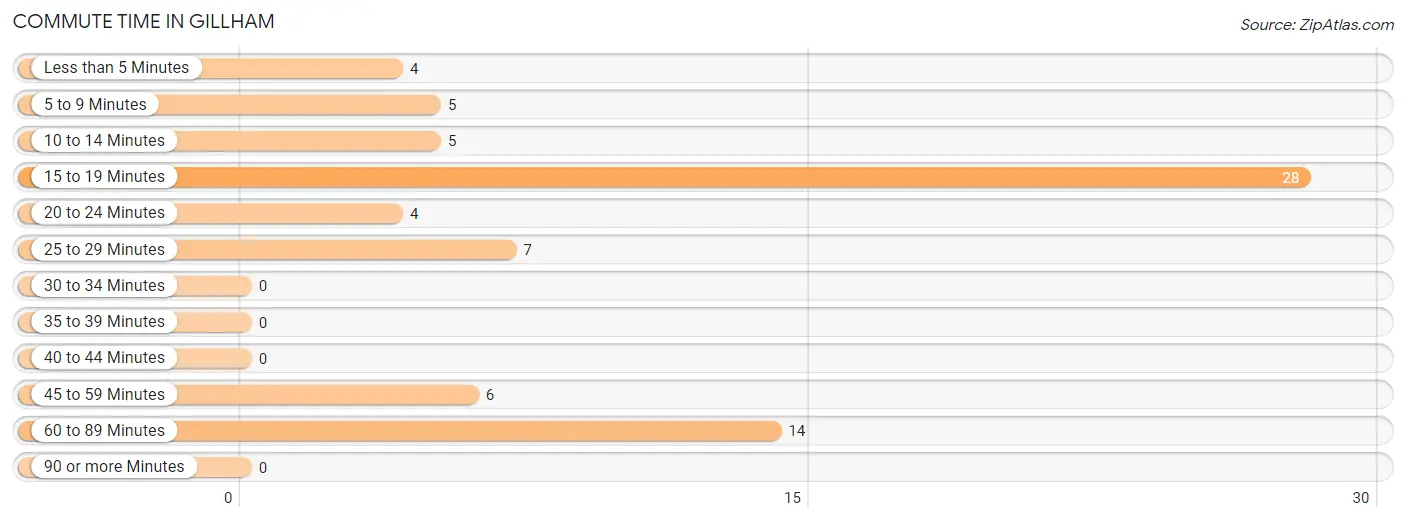
| Commute Time | # Commuters | % Commuters |
| Less than 5 Minutes | 4 | 5.5% |
| 5 to 9 Minutes | 5 | 6.9% |
| 10 to 14 Minutes | 5 | 6.9% |
| 15 to 19 Minutes | 28 | 38.4% |
| 20 to 24 Minutes | 4 | 5.5% |
| 25 to 29 Minutes | 7 | 9.6% |
| 30 to 34 Minutes | 0 | 0.0% |
| 35 to 39 Minutes | 0 | 0.0% |
| 40 to 44 Minutes | 0 | 0.0% |
| 45 to 59 Minutes | 6 | 8.2% |
| 60 to 89 Minutes | 14 | 19.2% |
| 90 or more Minutes | 0 | 0.0% |
Commute Time by Sex in Gillham
The most common commute times in Gillham are 15 to 19 minutes (26 commuters, 57.8%) for males and 25 to 29 minutes (7 commuters, 25.0%) for females.
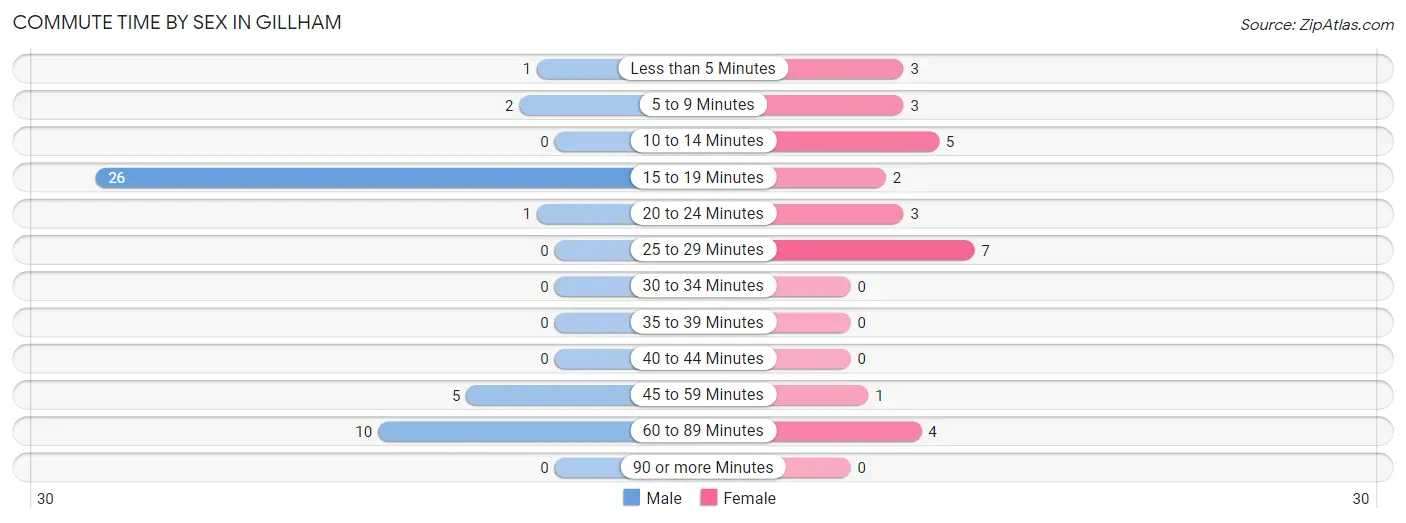
| Commute Time | Male | Female |
| Less than 5 Minutes | 1 (2.2%) | 3 (10.7%) |
| 5 to 9 Minutes | 2 (4.4%) | 3 (10.7%) |
| 10 to 14 Minutes | 0 (0.0%) | 5 (17.9%) |
| 15 to 19 Minutes | 26 (57.8%) | 2 (7.1%) |
| 20 to 24 Minutes | 1 (2.2%) | 3 (10.7%) |
| 25 to 29 Minutes | 0 (0.0%) | 7 (25.0%) |
| 30 to 34 Minutes | 0 (0.0%) | 0 (0.0%) |
| 35 to 39 Minutes | 0 (0.0%) | 0 (0.0%) |
| 40 to 44 Minutes | 0 (0.0%) | 0 (0.0%) |
| 45 to 59 Minutes | 5 (11.1%) | 1 (3.6%) |
| 60 to 89 Minutes | 10 (22.2%) | 4 (14.3%) |
| 90 or more Minutes | 0 (0.0%) | 0 (0.0%) |
Time of Departure to Work by Sex in Gillham
The most frequent times of departure to work in Gillham are 6:00 AM to 6:29 AM (15, 33.3%) for males and 6:00 AM to 6:29 AM (8, 28.6%) for females.
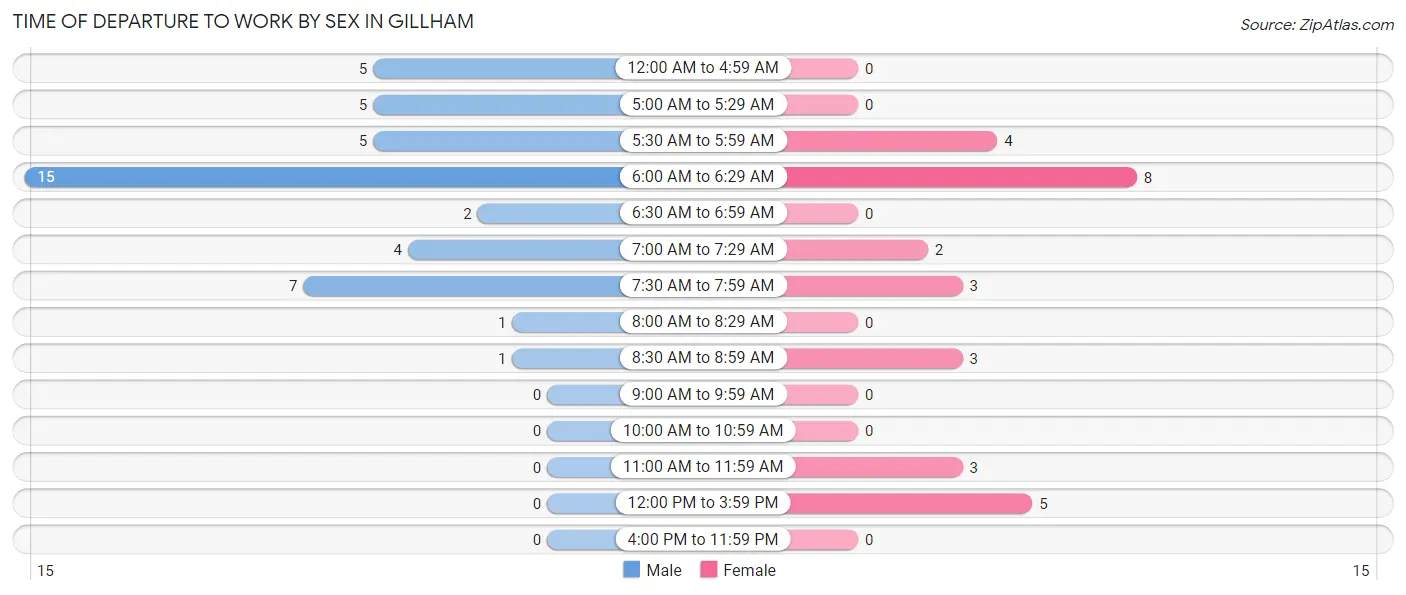
| Time of Departure | Male | Female |
| 12:00 AM to 4:59 AM | 5 (11.1%) | 0 (0.0%) |
| 5:00 AM to 5:29 AM | 5 (11.1%) | 0 (0.0%) |
| 5:30 AM to 5:59 AM | 5 (11.1%) | 4 (14.3%) |
| 6:00 AM to 6:29 AM | 15 (33.3%) | 8 (28.6%) |
| 6:30 AM to 6:59 AM | 2 (4.4%) | 0 (0.0%) |
| 7:00 AM to 7:29 AM | 4 (8.9%) | 2 (7.1%) |
| 7:30 AM to 7:59 AM | 7 (15.6%) | 3 (10.7%) |
| 8:00 AM to 8:29 AM | 1 (2.2%) | 0 (0.0%) |
| 8:30 AM to 8:59 AM | 1 (2.2%) | 3 (10.7%) |
| 9:00 AM to 9:59 AM | 0 (0.0%) | 0 (0.0%) |
| 10:00 AM to 10:59 AM | 0 (0.0%) | 0 (0.0%) |
| 11:00 AM to 11:59 AM | 0 (0.0%) | 3 (10.7%) |
| 12:00 PM to 3:59 PM | 0 (0.0%) | 5 (17.9%) |
| 4:00 PM to 11:59 PM | 0 (0.0%) | 0 (0.0%) |
| Total | 45 (100.0%) | 28 (100.0%) |
Housing Occupancy in Gillham
Occupancy by Ownership in Gillham
Of the total 77 dwellings in Gillham, owner-occupied units account for 63 (81.8%), while renter-occupied units make up 14 (18.2%).
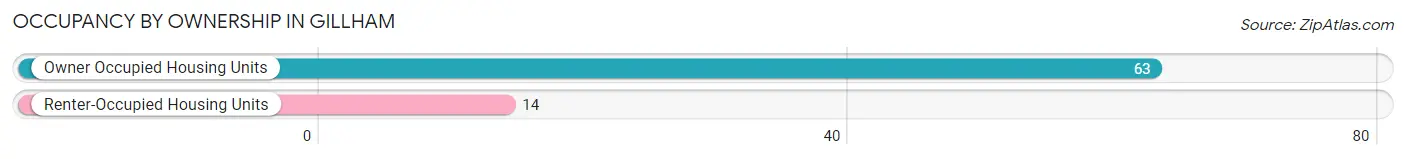
| Occupancy | # Housing Units | % Housing Units |
| Owner Occupied Housing Units | 63 | 81.8% |
| Renter-Occupied Housing Units | 14 | 18.2% |
| Total Occupied Housing Units | 77 | 100.0% |
Occupancy by Household Size in Gillham
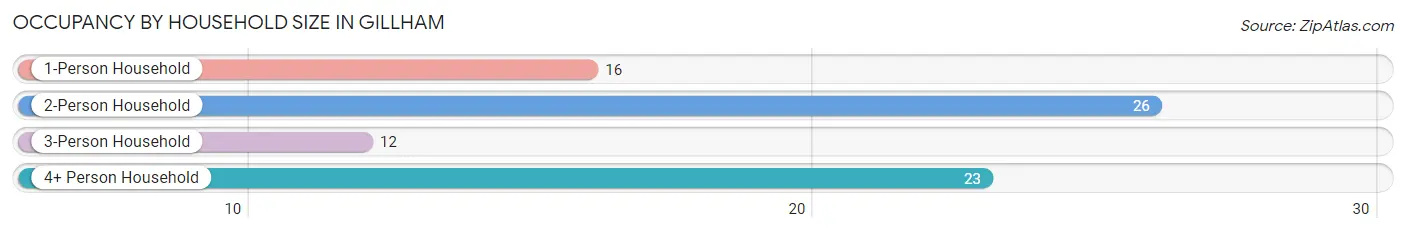
| Household Size | # Housing Units | % Housing Units |
| 1-Person Household | 16 | 20.8% |
| 2-Person Household | 26 | 33.8% |
| 3-Person Household | 12 | 15.6% |
| 4+ Person Household | 23 | 29.9% |
| Total Housing Units | 77 | 100.0% |
Occupancy by Ownership by Household Size in Gillham
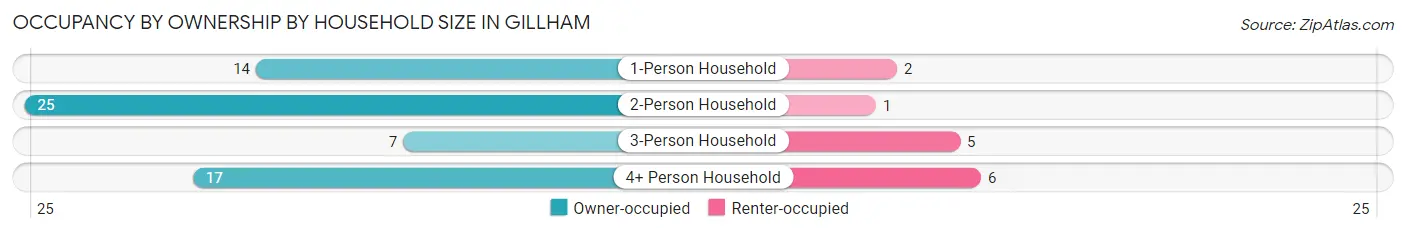
| Household Size | Owner-occupied | Renter-occupied |
| 1-Person Household | 14 (87.5%) | 2 (12.5%) |
| 2-Person Household | 25 (96.2%) | 1 (3.8%) |
| 3-Person Household | 7 (58.3%) | 5 (41.7%) |
| 4+ Person Household | 17 (73.9%) | 6 (26.1%) |
| Total Housing Units | 63 (81.8%) | 14 (18.2%) |
Occupancy by Educational Attainment in Gillham
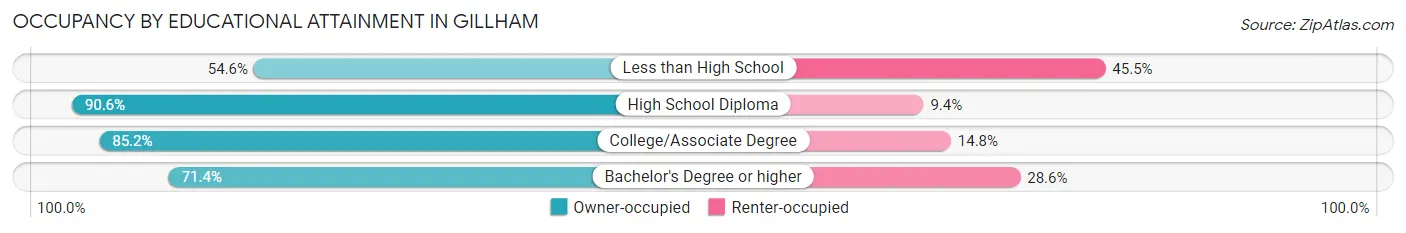
| Household Size | Owner-occupied | Renter-occupied |
| Less than High School | 6 (54.5%) | 5 (45.5%) |
| High School Diploma | 29 (90.6%) | 3 (9.4%) |
| College/Associate Degree | 23 (85.2%) | 4 (14.8%) |
| Bachelor's Degree or higher | 5 (71.4%) | 2 (28.6%) |
Occupancy by Age of Householder in Gillham
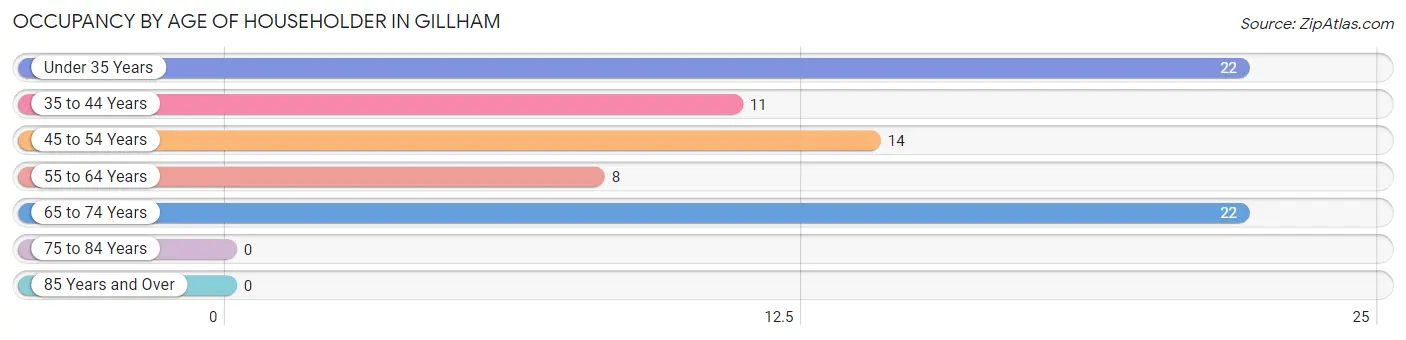
| Age Bracket | # Households | % Households |
| Under 35 Years | 22 | 28.6% |
| 35 to 44 Years | 11 | 14.3% |
| 45 to 54 Years | 14 | 18.2% |
| 55 to 64 Years | 8 | 10.4% |
| 65 to 74 Years | 22 | 28.6% |
| 75 to 84 Years | 0 | 0.0% |
| 85 Years and Over | 0 | 0.0% |
| Total | 77 | 100.0% |
Housing Finances in Gillham
Median Income by Occupancy in Gillham
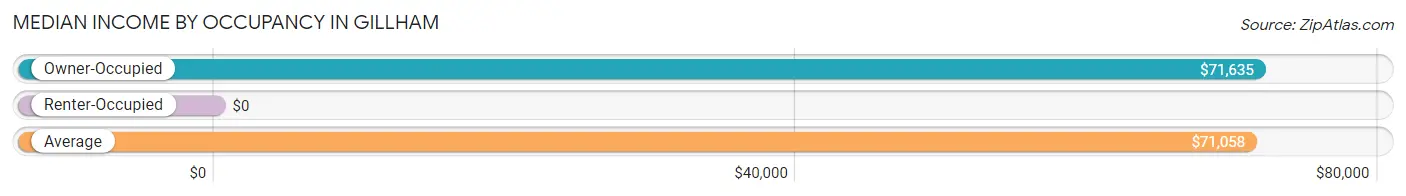
| Occupancy Type | # Households | Median Income |
| Owner-Occupied | 63 (81.8%) | $71,635 |
| Renter-Occupied | 14 (18.2%) | $0 |
| Average | 77 (100.0%) | $71,058 |
Occupancy by Householder Income Bracket in Gillham
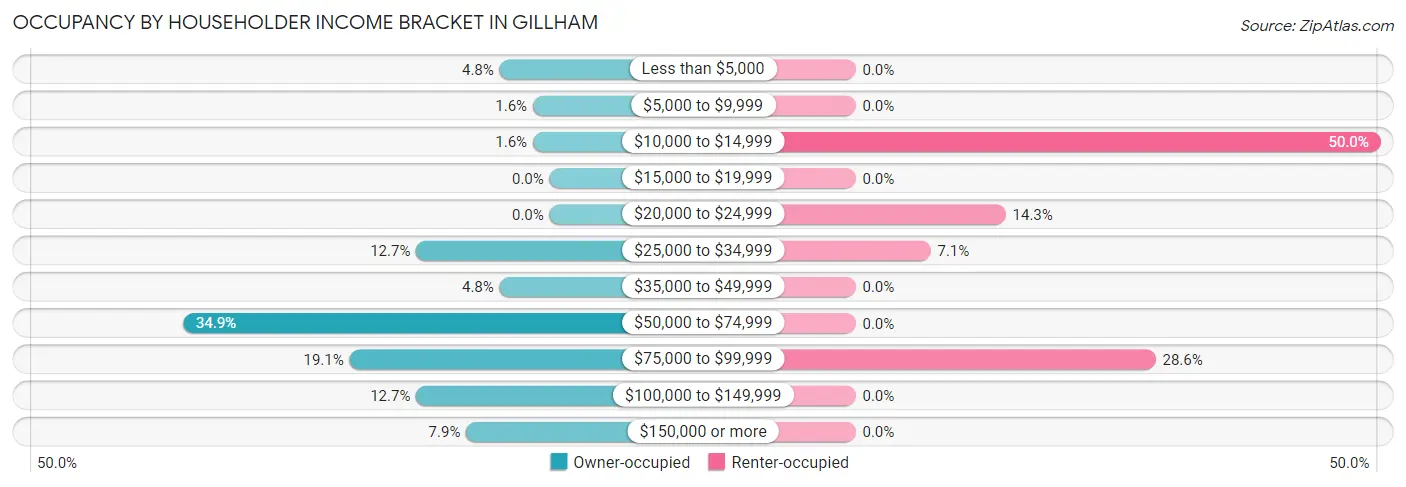
| Income Bracket | Owner-occupied | Renter-occupied |
| Less than $5,000 | 3 (4.8%) | 0 (0.0%) |
| $5,000 to $9,999 | 1 (1.6%) | 0 (0.0%) |
| $10,000 to $14,999 | 1 (1.6%) | 7 (50.0%) |
| $15,000 to $19,999 | 0 (0.0%) | 0 (0.0%) |
| $20,000 to $24,999 | 0 (0.0%) | 2 (14.3%) |
| $25,000 to $34,999 | 8 (12.7%) | 1 (7.1%) |
| $35,000 to $49,999 | 3 (4.8%) | 0 (0.0%) |
| $50,000 to $74,999 | 22 (34.9%) | 0 (0.0%) |
| $75,000 to $99,999 | 12 (19.1%) | 4 (28.6%) |
| $100,000 to $149,999 | 8 (12.7%) | 0 (0.0%) |
| $150,000 or more | 5 (7.9%) | 0 (0.0%) |
| Total | 63 (100.0%) | 14 (100.0%) |
Monthly Housing Cost Tiers in Gillham
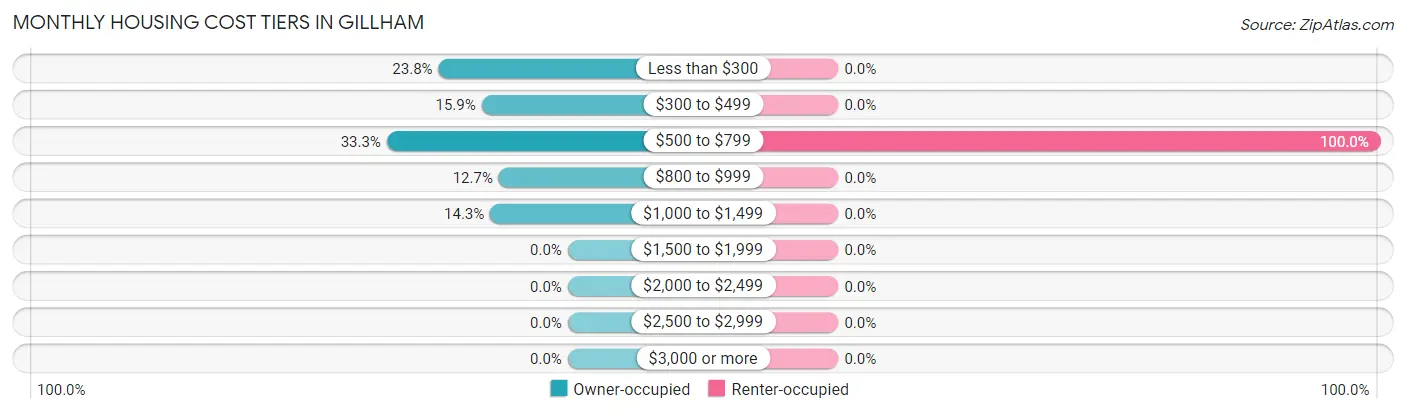
| Monthly Cost | Owner-occupied | Renter-occupied |
| Less than $300 | 15 (23.8%) | 0 (0.0%) |
| $300 to $499 | 10 (15.9%) | 0 (0.0%) |
| $500 to $799 | 21 (33.3%) | 14 (100.0%) |
| $800 to $999 | 8 (12.7%) | 0 (0.0%) |
| $1,000 to $1,499 | 9 (14.3%) | 0 (0.0%) |
| $1,500 to $1,999 | 0 (0.0%) | 0 (0.0%) |
| $2,000 to $2,499 | 0 (0.0%) | 0 (0.0%) |
| $2,500 to $2,999 | 0 (0.0%) | 0 (0.0%) |
| $3,000 or more | 0 (0.0%) | 0 (0.0%) |
| Total | 63 (100.0%) | 14 (100.0%) |
Physical Housing Characteristics in Gillham
Housing Structures in Gillham
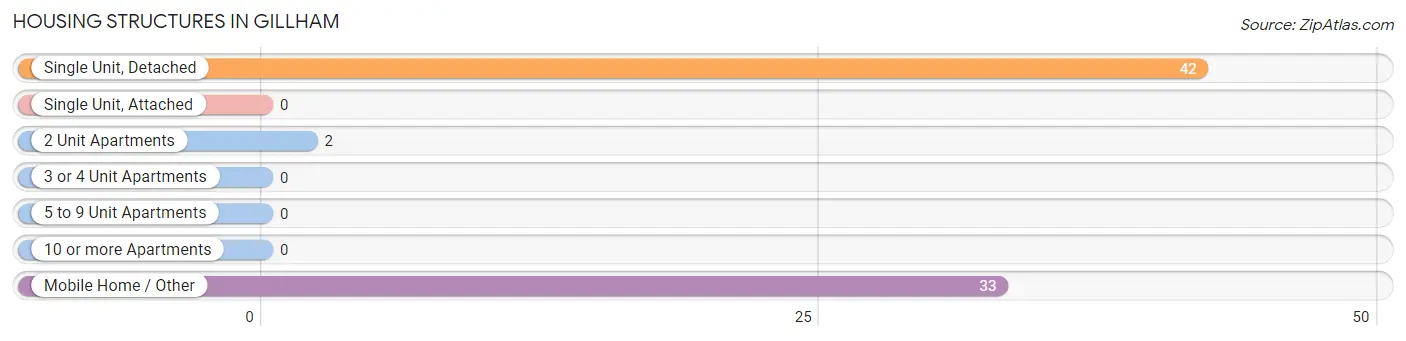
| Structure Type | # Housing Units | % Housing Units |
| Single Unit, Detached | 42 | 54.5% |
| Single Unit, Attached | 0 | 0.0% |
| 2 Unit Apartments | 2 | 2.6% |
| 3 or 4 Unit Apartments | 0 | 0.0% |
| 5 to 9 Unit Apartments | 0 | 0.0% |
| 10 or more Apartments | 0 | 0.0% |
| Mobile Home / Other | 33 | 42.9% |
| Total | 77 | 100.0% |
Housing Structures by Occupancy in Gillham
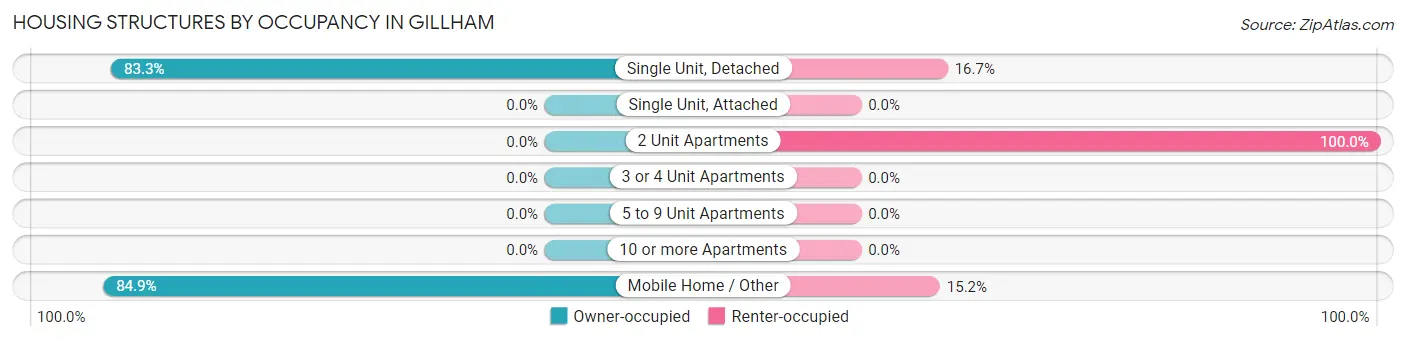
| Structure Type | Owner-occupied | Renter-occupied |
| Single Unit, Detached | 35 (83.3%) | 7 (16.7%) |
| Single Unit, Attached | 0 (0.0%) | 0 (0.0%) |
| 2 Unit Apartments | 0 (0.0%) | 2 (100.0%) |
| 3 or 4 Unit Apartments | 0 (0.0%) | 0 (0.0%) |
| 5 to 9 Unit Apartments | 0 (0.0%) | 0 (0.0%) |
| 10 or more Apartments | 0 (0.0%) | 0 (0.0%) |
| Mobile Home / Other | 28 (84.9%) | 5 (15.1%) |
| Total | 63 (81.8%) | 14 (18.2%) |
Housing Structures by Number of Rooms in Gillham
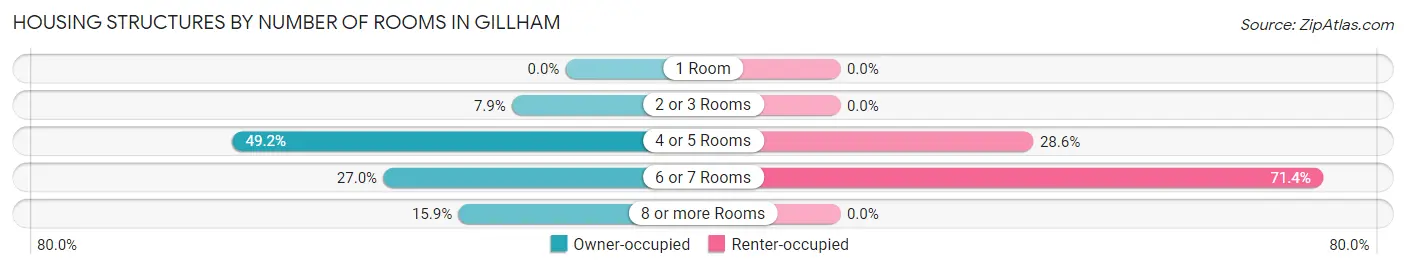
| Number of Rooms | Owner-occupied | Renter-occupied |
| 1 Room | 0 (0.0%) | 0 (0.0%) |
| 2 or 3 Rooms | 5 (7.9%) | 0 (0.0%) |
| 4 or 5 Rooms | 31 (49.2%) | 4 (28.6%) |
| 6 or 7 Rooms | 17 (27.0%) | 10 (71.4%) |
| 8 or more Rooms | 10 (15.9%) | 0 (0.0%) |
| Total | 63 (100.0%) | 14 (100.0%) |
Housing Structure by Heating Type in Gillham
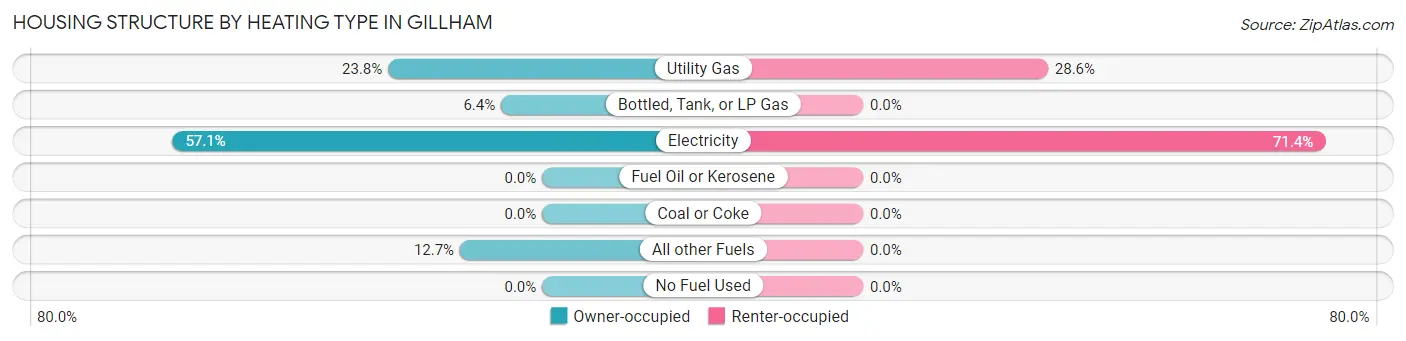
| Heating Type | Owner-occupied | Renter-occupied |
| Utility Gas | 15 (23.8%) | 4 (28.6%) |
| Bottled, Tank, or LP Gas | 4 (6.4%) | 0 (0.0%) |
| Electricity | 36 (57.1%) | 10 (71.4%) |
| Fuel Oil or Kerosene | 0 (0.0%) | 0 (0.0%) |
| Coal or Coke | 0 (0.0%) | 0 (0.0%) |
| All other Fuels | 8 (12.7%) | 0 (0.0%) |
| No Fuel Used | 0 (0.0%) | 0 (0.0%) |
| Total | 63 (100.0%) | 14 (100.0%) |
Household Vehicle Usage in Gillham
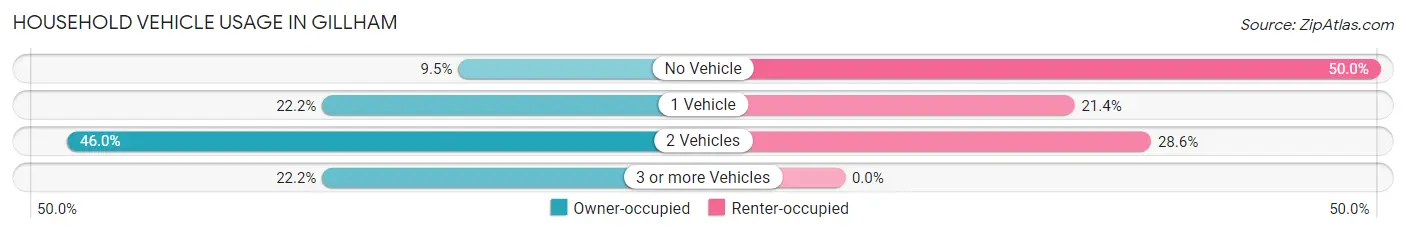
| Vehicles per Household | Owner-occupied | Renter-occupied |
| No Vehicle | 6 (9.5%) | 7 (50.0%) |
| 1 Vehicle | 14 (22.2%) | 3 (21.4%) |
| 2 Vehicles | 29 (46.0%) | 4 (28.6%) |
| 3 or more Vehicles | 14 (22.2%) | 0 (0.0%) |
| Total | 63 (100.0%) | 14 (100.0%) |
Real Estate & Mortgages in Gillham
Real Estate and Mortgage Overview in Gillham
| Characteristic | Without Mortgage | With Mortgage |
| Housing Units | 32 | 31 |
| Median Property Value | - | - |
| Median Household Income | $80,625 | $3 |
| Monthly Housing Costs | $313 | $0 |
| Real Estate Taxes | $199 | $11 |
Property Value by Mortgage Status in Gillham
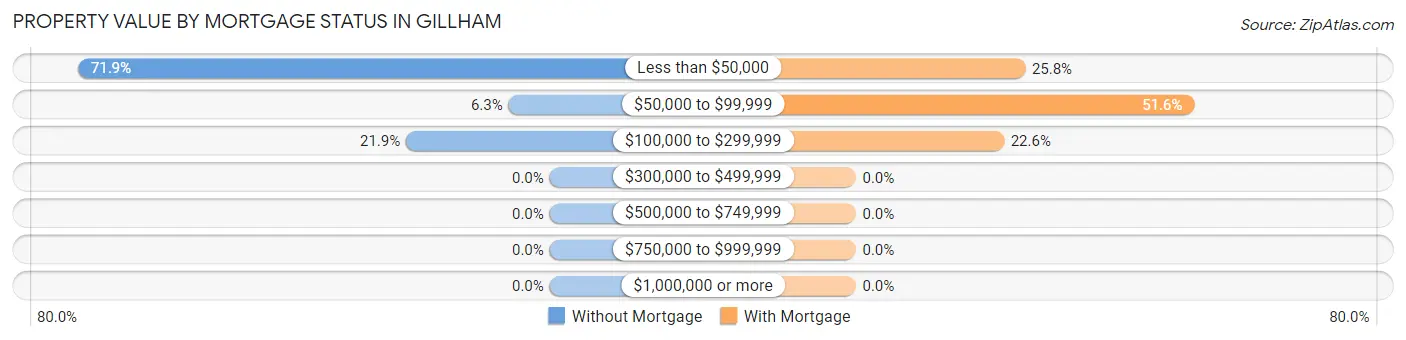
| Property Value | Without Mortgage | With Mortgage |
| Less than $50,000 | 23 (71.9%) | 8 (25.8%) |
| $50,000 to $99,999 | 2 (6.2%) | 16 (51.6%) |
| $100,000 to $299,999 | 7 (21.9%) | 7 (22.6%) |
| $300,000 to $499,999 | 0 (0.0%) | 0 (0.0%) |
| $500,000 to $749,999 | 0 (0.0%) | 0 (0.0%) |
| $750,000 to $999,999 | 0 (0.0%) | 0 (0.0%) |
| $1,000,000 or more | 0 (0.0%) | 0 (0.0%) |
| Total | 32 (100.0%) | 31 (100.0%) |
Household Income by Mortgage Status in Gillham
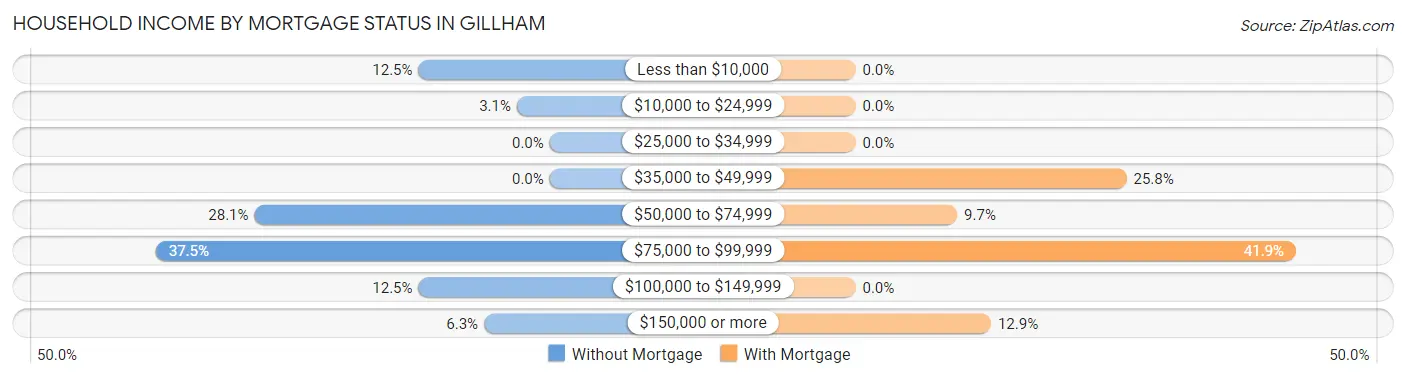
| Household Income | Without Mortgage | With Mortgage |
| Less than $10,000 | 4 (12.5%) | 0 (0.0%) |
| $10,000 to $24,999 | 1 (3.1%) | 0 (0.0%) |
| $25,000 to $34,999 | 0 (0.0%) | 0 (0.0%) |
| $35,000 to $49,999 | 0 (0.0%) | 8 (25.8%) |
| $50,000 to $74,999 | 9 (28.1%) | 3 (9.7%) |
| $75,000 to $99,999 | 12 (37.5%) | 13 (41.9%) |
| $100,000 to $149,999 | 4 (12.5%) | 0 (0.0%) |
| $150,000 or more | 2 (6.2%) | 4 (12.9%) |
| Total | 32 (100.0%) | 31 (100.0%) |
Property Value to Household Income Ratio in Gillham
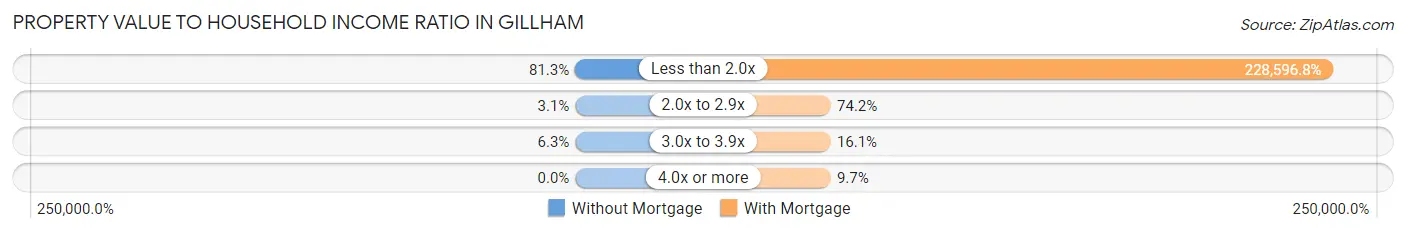
| Value-to-Income Ratio | Without Mortgage | With Mortgage |
| Less than 2.0x | 26 (81.2%) | 70,865 (228,596.8%) |
| 2.0x to 2.9x | 1 (3.1%) | 23 (74.2%) |
| 3.0x to 3.9x | 2 (6.2%) | 5 (16.1%) |
| 4.0x or more | 0 (0.0%) | 3 (9.7%) |
| Total | 32 (100.0%) | 31 (100.0%) |
Real Estate Taxes by Mortgage Status in Gillham
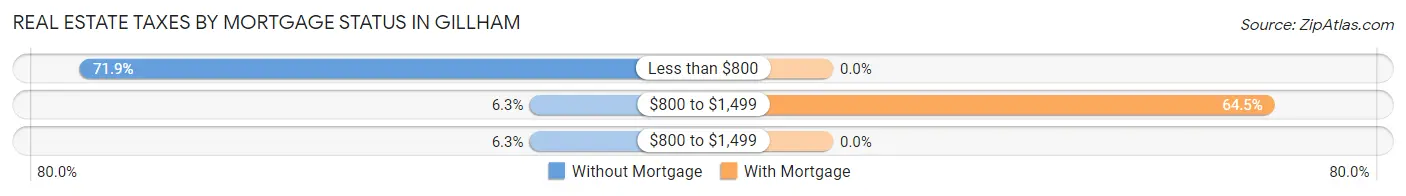
| Property Taxes | Without Mortgage | With Mortgage |
| Less than $800 | 23 (71.9%) | 0 (0.0%) |
| $800 to $1,499 | 2 (6.2%) | 20 (64.5%) |
| $800 to $1,499 | 2 (6.2%) | 0 (0.0%) |
| Total | 32 (100.0%) | 31 (100.0%) |
Health & Disability in Gillham
Health Insurance Coverage by Age in Gillham
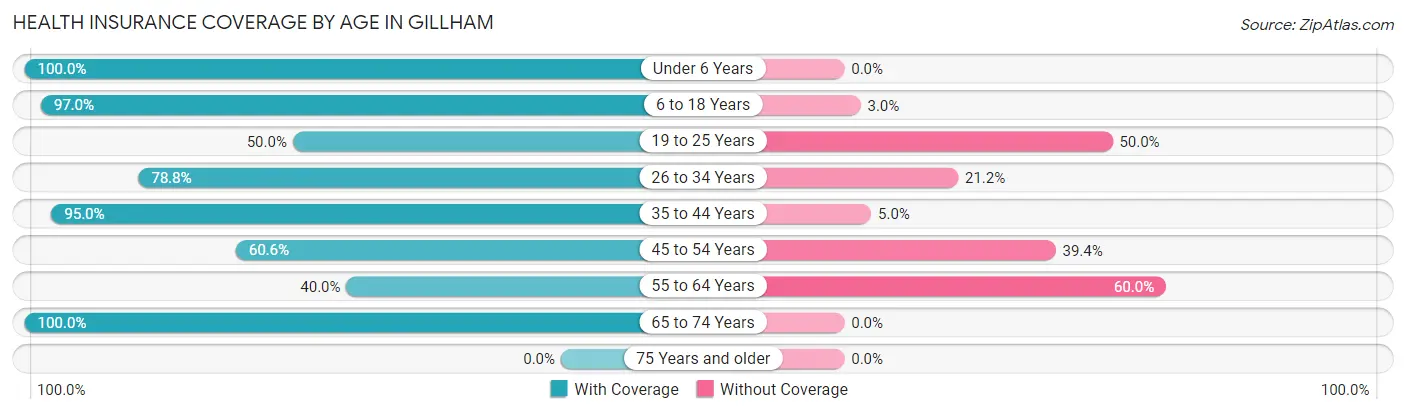
| Age Bracket | With Coverage | Without Coverage |
| Under 6 Years | 25 (100.0%) | 0 (0.0%) |
| 6 to 18 Years | 32 (97.0%) | 1 (3.0%) |
| 19 to 25 Years | 19 (50.0%) | 19 (50.0%) |
| 26 to 34 Years | 26 (78.8%) | 7 (21.2%) |
| 35 to 44 Years | 19 (95.0%) | 1 (5.0%) |
| 45 to 54 Years | 20 (60.6%) | 13 (39.4%) |
| 55 to 64 Years | 6 (40.0%) | 9 (60.0%) |
| 65 to 74 Years | 30 (100.0%) | 0 (0.0%) |
| 75 Years and older | 0 (0.0%) | 0 (0.0%) |
| Total | 177 (78.0%) | 50 (22.0%) |
Health Insurance Coverage by Citizenship Status in Gillham
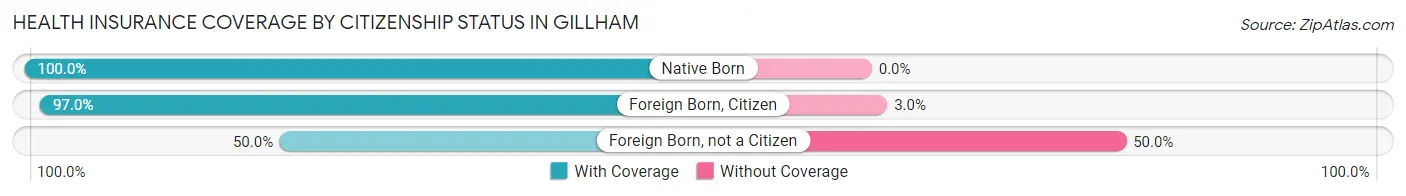
| Citizenship Status | With Coverage | Without Coverage |
| Native Born | 25 (100.0%) | 0 (0.0%) |
| Foreign Born, Citizen | 32 (97.0%) | 1 (3.0%) |
| Foreign Born, not a Citizen | 19 (50.0%) | 19 (50.0%) |
Health Insurance Coverage by Household Income in Gillham
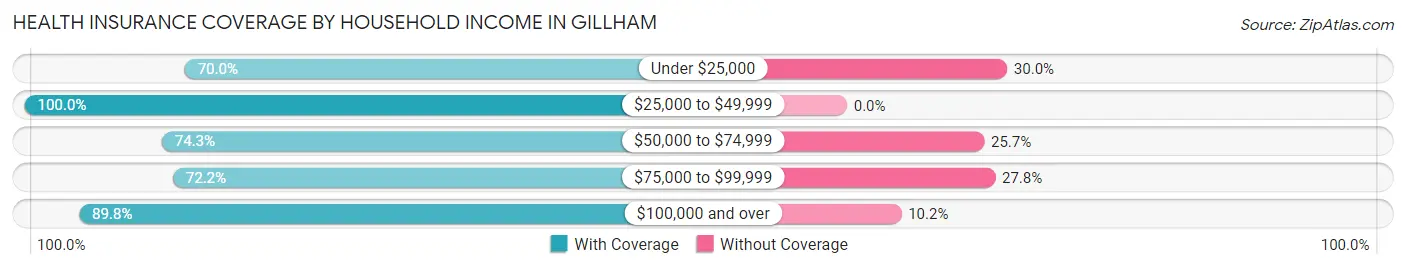
| Household Income | With Coverage | Without Coverage |
| Under $25,000 | 28 (70.0%) | 12 (30.0%) |
| $25,000 to $49,999 | 14 (100.0%) | 0 (0.0%) |
| $50,000 to $74,999 | 52 (74.3%) | 18 (25.7%) |
| $75,000 to $99,999 | 39 (72.2%) | 15 (27.8%) |
| $100,000 and over | 44 (89.8%) | 5 (10.2%) |
Public vs Private Health Insurance Coverage by Age in Gillham
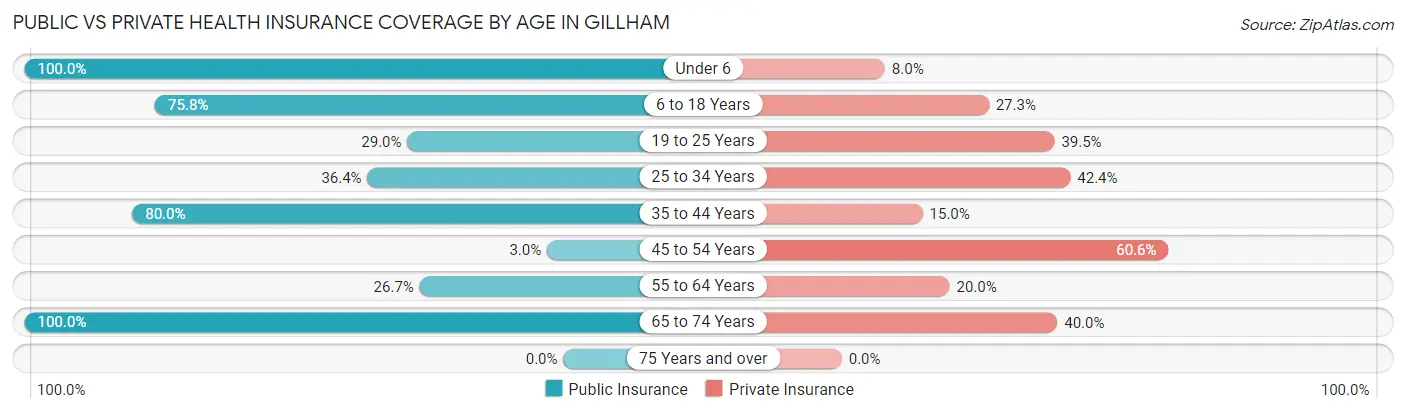
| Age Bracket | Public Insurance | Private Insurance |
| Under 6 | 25 (100.0%) | 2 (8.0%) |
| 6 to 18 Years | 25 (75.8%) | 9 (27.3%) |
| 19 to 25 Years | 11 (28.9%) | 15 (39.5%) |
| 25 to 34 Years | 12 (36.4%) | 14 (42.4%) |
| 35 to 44 Years | 16 (80.0%) | 3 (15.0%) |
| 45 to 54 Years | 1 (3.0%) | 20 (60.6%) |
| 55 to 64 Years | 4 (26.7%) | 3 (20.0%) |
| 65 to 74 Years | 30 (100.0%) | 12 (40.0%) |
| 75 Years and over | 0 (0.0%) | 0 (0.0%) |
| Total | 124 (54.6%) | 78 (34.4%) |
Disability Status by Sex by Age in Gillham
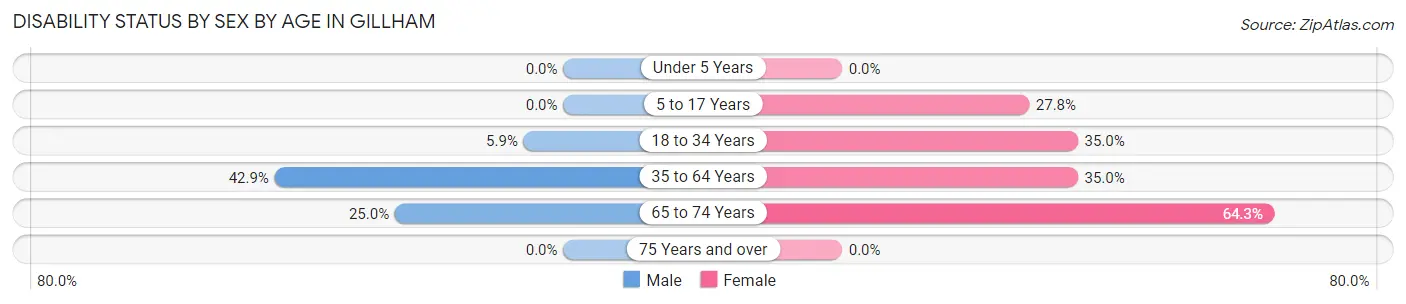
| Age Bracket | Male | Female |
| Under 5 Years | 0 (0.0%) | 0 (0.0%) |
| 5 to 17 Years | 0 (0.0%) | 5 (27.8%) |
| 18 to 34 Years | 3 (5.9%) | 7 (35.0%) |
| 35 to 64 Years | 12 (42.9%) | 14 (35.0%) |
| 65 to 74 Years | 4 (25.0%) | 9 (64.3%) |
| 75 Years and over | 0 (0.0%) | 0 (0.0%) |
Disability Class by Sex by Age in Gillham
Disability Class: Hearing Difficulty
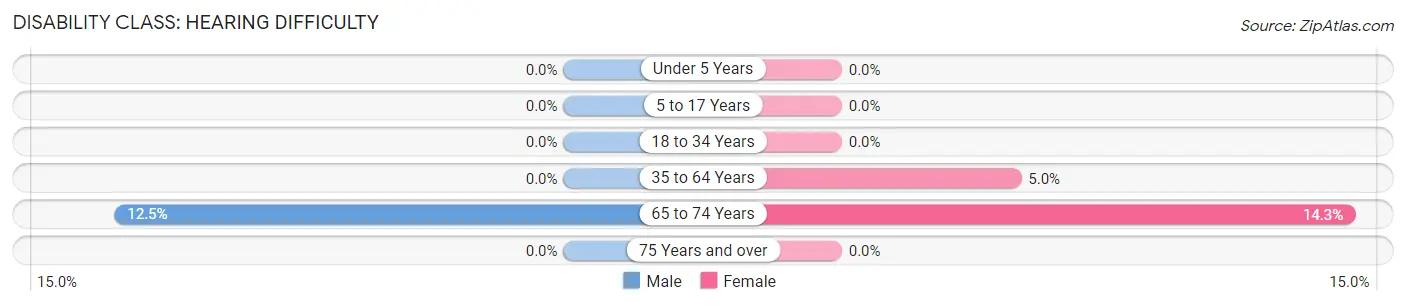
| Age Bracket | Male | Female |
| Under 5 Years | 0 (0.0%) | 0 (0.0%) |
| 5 to 17 Years | 0 (0.0%) | 0 (0.0%) |
| 18 to 34 Years | 0 (0.0%) | 0 (0.0%) |
| 35 to 64 Years | 0 (0.0%) | 2 (5.0%) |
| 65 to 74 Years | 2 (12.5%) | 2 (14.3%) |
| 75 Years and over | 0 (0.0%) | 0 (0.0%) |
Disability Class: Vision Difficulty
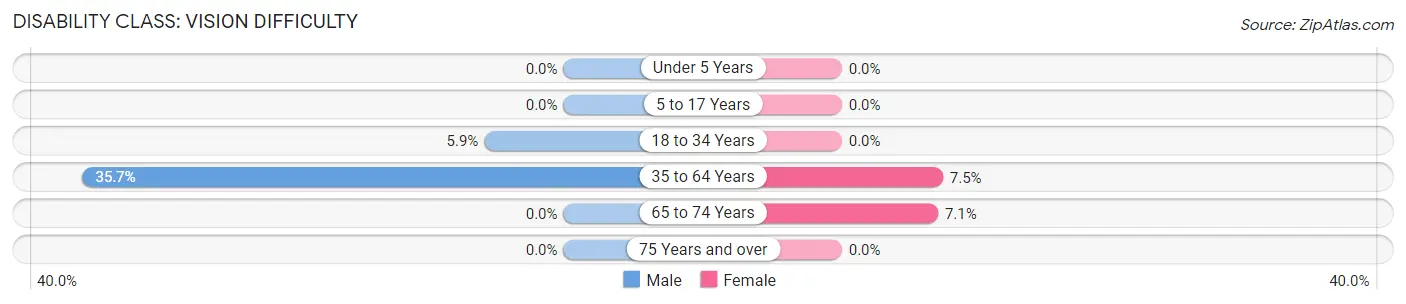
| Age Bracket | Male | Female |
| Under 5 Years | 0 (0.0%) | 0 (0.0%) |
| 5 to 17 Years | 0 (0.0%) | 0 (0.0%) |
| 18 to 34 Years | 3 (5.9%) | 0 (0.0%) |
| 35 to 64 Years | 10 (35.7%) | 3 (7.5%) |
| 65 to 74 Years | 0 (0.0%) | 1 (7.1%) |
| 75 Years and over | 0 (0.0%) | 0 (0.0%) |
Disability Class: Cognitive Difficulty
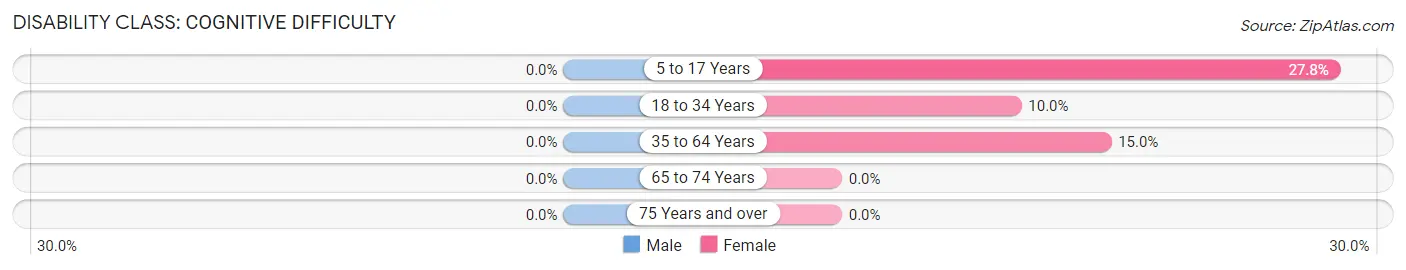
| Age Bracket | Male | Female |
| 5 to 17 Years | 0 (0.0%) | 5 (27.8%) |
| 18 to 34 Years | 0 (0.0%) | 2 (10.0%) |
| 35 to 64 Years | 0 (0.0%) | 6 (15.0%) |
| 65 to 74 Years | 0 (0.0%) | 0 (0.0%) |
| 75 Years and over | 0 (0.0%) | 0 (0.0%) |
Disability Class: Ambulatory Difficulty
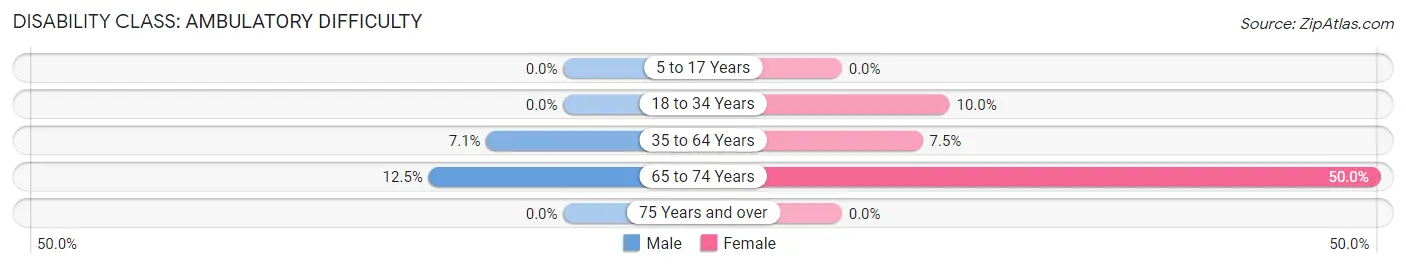
| Age Bracket | Male | Female |
| 5 to 17 Years | 0 (0.0%) | 0 (0.0%) |
| 18 to 34 Years | 0 (0.0%) | 2 (10.0%) |
| 35 to 64 Years | 2 (7.1%) | 3 (7.5%) |
| 65 to 74 Years | 2 (12.5%) | 7 (50.0%) |
| 75 Years and over | 0 (0.0%) | 0 (0.0%) |
Disability Class: Self-Care Difficulty
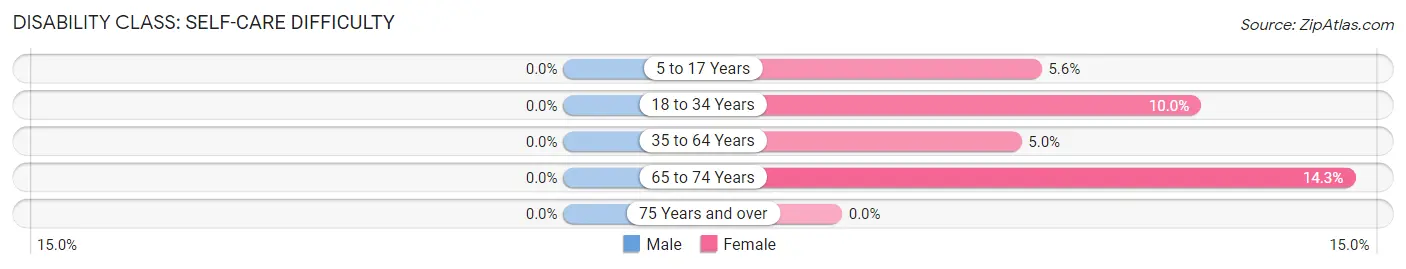
| Age Bracket | Male | Female |
| 5 to 17 Years | 0 (0.0%) | 1 (5.6%) |
| 18 to 34 Years | 0 (0.0%) | 2 (10.0%) |
| 35 to 64 Years | 0 (0.0%) | 2 (5.0%) |
| 65 to 74 Years | 0 (0.0%) | 2 (14.3%) |
| 75 Years and over | 0 (0.0%) | 0 (0.0%) |
Technology Access in Gillham
Computing Device Access in Gillham
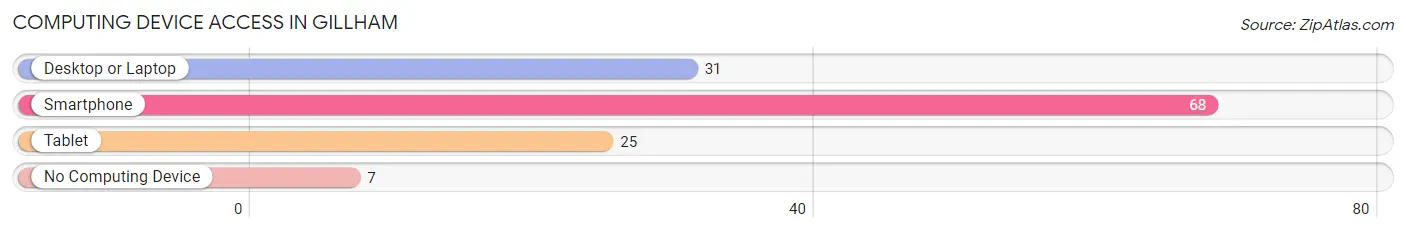
| Device Type | # Households | % Households |
| Desktop or Laptop | 31 | 40.3% |
| Smartphone | 68 | 88.3% |
| Tablet | 25 | 32.5% |
| No Computing Device | 7 | 9.1% |
| Total | 77 | 100.0% |
Internet Access in Gillham
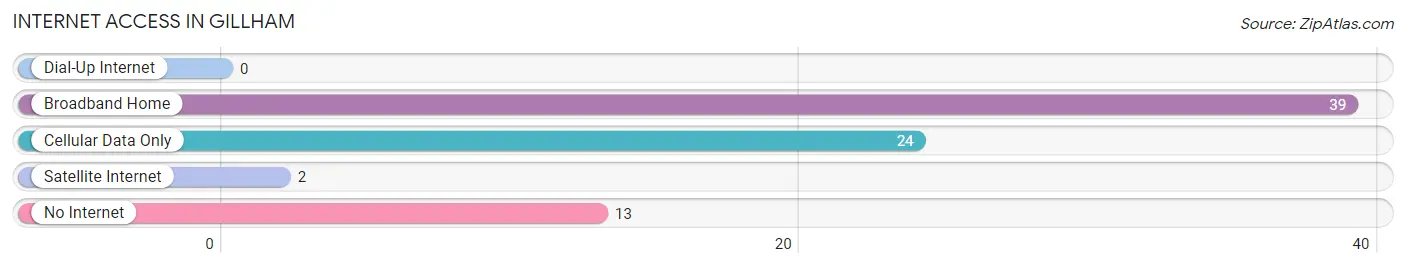
| Internet Type | # Households | % Households |
| Dial-Up Internet | 0 | 0.0% |
| Broadband Home | 39 | 50.6% |
| Cellular Data Only | 24 | 31.2% |
| Satellite Internet | 2 | 2.6% |
| No Internet | 13 | 16.9% |
| Total | 77 | 100.0% |
Gillham Summary
Gillham is a small town located in the southwestern corner of Arkansas, in the foothills of the Ouachita Mountains. It is situated in the Little River County, and is part of the Texarkana metropolitan area. The town has a population of approximately 500 people, and is known for its rural charm and friendly atmosphere.
History
Gillham was founded in 1883 by a group of settlers from Tennessee. The town was named after the first postmaster, William Gillham. The town was originally a farming community, and the main crops grown were cotton, corn, and wheat. In the early 1900s, the town began to grow and develop, and by the 1920s, it had become a thriving community.
In the 1930s, the Great Depression hit the town hard, and many of the businesses and farms closed. However, the town was able to survive, and by the 1950s, it had become a popular tourist destination. The town was known for its beautiful scenery and outdoor activities, such as fishing and hunting.
In the 1960s, the town began to decline, as many of the businesses and farms closed. However, in the 1970s, the town began to experience a resurgence, as new businesses and industries moved into the area. Today, Gillham is a small, rural town with a population of approximately 500 people.
Geography
Gillham is located in the southwestern corner of Arkansas, in the foothills of the Ouachita Mountains. The town is situated in the Little River County, and is part of the Texarkana metropolitan area. The town is located near the Arkansas-Oklahoma border, and is approximately 30 miles from the state capital of Little Rock.
The town is situated on the banks of the Little River, and is surrounded by rolling hills and forests. The town is located in a humid subtropical climate, and experiences hot, humid summers and mild winters.
Economy
Gillham’s economy is largely based on agriculture and tourism. The town is home to several farms, which produce a variety of crops, including cotton, corn, and wheat. The town is also home to several small businesses, such as restaurants, stores, and gas stations.
The town is also a popular tourist destination, and is known for its beautiful scenery and outdoor activities. The town is home to several parks, lakes, and rivers, which attract visitors from all over the state.
Demographics
Gillham has a population of approximately 500 people, and is a predominantly white town. The town has a median household income of $35,000, and the median age is 40 years old. The town is home to several churches, and the most common religion is Christianity.
Common Questions
What is Per Capita Income in Gillham?
Per Capita income in Gillham is $38,315.
What is the Median Family Income in Gillham?
Median Family Income in Gillham is $70,769.
What is the Median Household income in Gillham?
Median Household Income in Gillham is $71,058.
What is Income or Wage Gap in Gillham?
Income or Wage Gap in Gillham is 0.5%.
Women in Gillham earn 99.5 cents for every dollar earned by a man.
What is Family Income Deficit in Gillham?
Family Income Deficit in Gillham is $8,663.
Families that are below poverty line in Gillham earn $8,663 less on average than the poverty threshold level.
What is Inequality or Gini Index in Gillham?
Inequality or Gini Index in Gillham is 0.65.
What is the Total Population of Gillham?
Total Population of Gillham is 227.
What is the Total Male Population of Gillham?
Total Male Population of Gillham is 135.
What is the Total Female Population of Gillham?
Total Female Population of Gillham is 92.
What is the Ratio of Males per 100 Females in Gillham?
There are 146.74 Males per 100 Females in Gillham.
What is the Ratio of Females per 100 Males in Gillham?
There are 68.15 Females per 100 Males in Gillham.
What is the Median Population Age in Gillham?
Median Population Age in Gillham is 30.6 Years.
What is the Average Family Size in Gillham
Average Family Size in Gillham is 3.2 People.
What is the Average Household Size in Gillham
Average Household Size in Gillham is 3.0 People.
How Large is the Labor Force in Gillham?
There are 99 People in the Labor Forcein in Gillham.
What is the Percentage of People in the Labor Force in Gillham?
57.2% of People are in the Labor Force in Gillham.
What is the Unemployment Rate in Gillham?
Unemployment Rate in Gillham is 12.1%.