Datto, AR Map & Demographics
Datto Map
Datto Overview
$20,190
PER CAPITA INCOME
$25,313
AVG HOUSEHOLD INCOME
0.37
INEQUALITY / GINI INDEX
59
TOTAL POPULATION
38
MALE POPULATION
21
FEMALE POPULATION
180.95
MALES / 100 FEMALES
55.26
FEMALES / 100 MALES
51.9
MEDIAN AGE
3.1
AVG FAMILY SIZE
2.2
AVG HOUSEHOLD SIZE
23
LABOR FORCE [ PEOPLE ]
39.0%
PERCENT IN LABOR FORCE
4.3%
UNEMPLOYMENT RATE
Datto Zip Codes
Datto Area Codes
Income in Datto
Income Overview in Datto
| Characteristic | Number | Measure |
| Per Capita Income | 59 | $20,190 |
| Median Family Income | 14 | $0 |
| Mean Family Income | 14 | $54,321 |
| Median Household Income | 27 | $25,313 |
| Mean Household Income | 27 | $39,959 |
| Income Deficit | 14 | $0 |
| Wage / Income Gap (%) | 59 | 0.00% |
| Wage / Income Gap ($) | 59 | 100.00¢ per $1 |
| Gini / Inequality Index | 59 | 0.37 |
Earnings by Sex in Datto
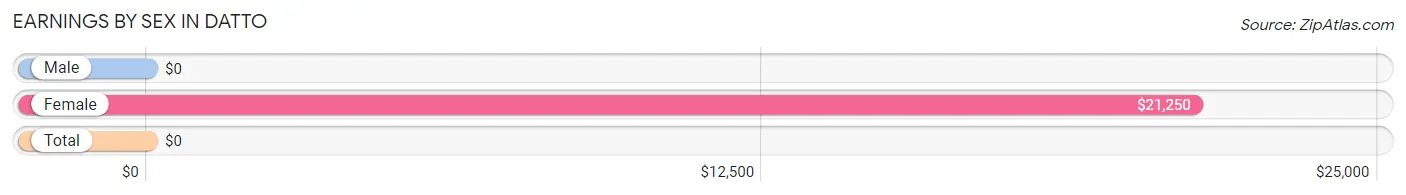
| Sex | Number | Average Earnings |
| Male | 29 (82.9%) | $0 |
| Female | 6 (17.1%) | $21,250 |
| Total | 35 (100.0%) | $0 |
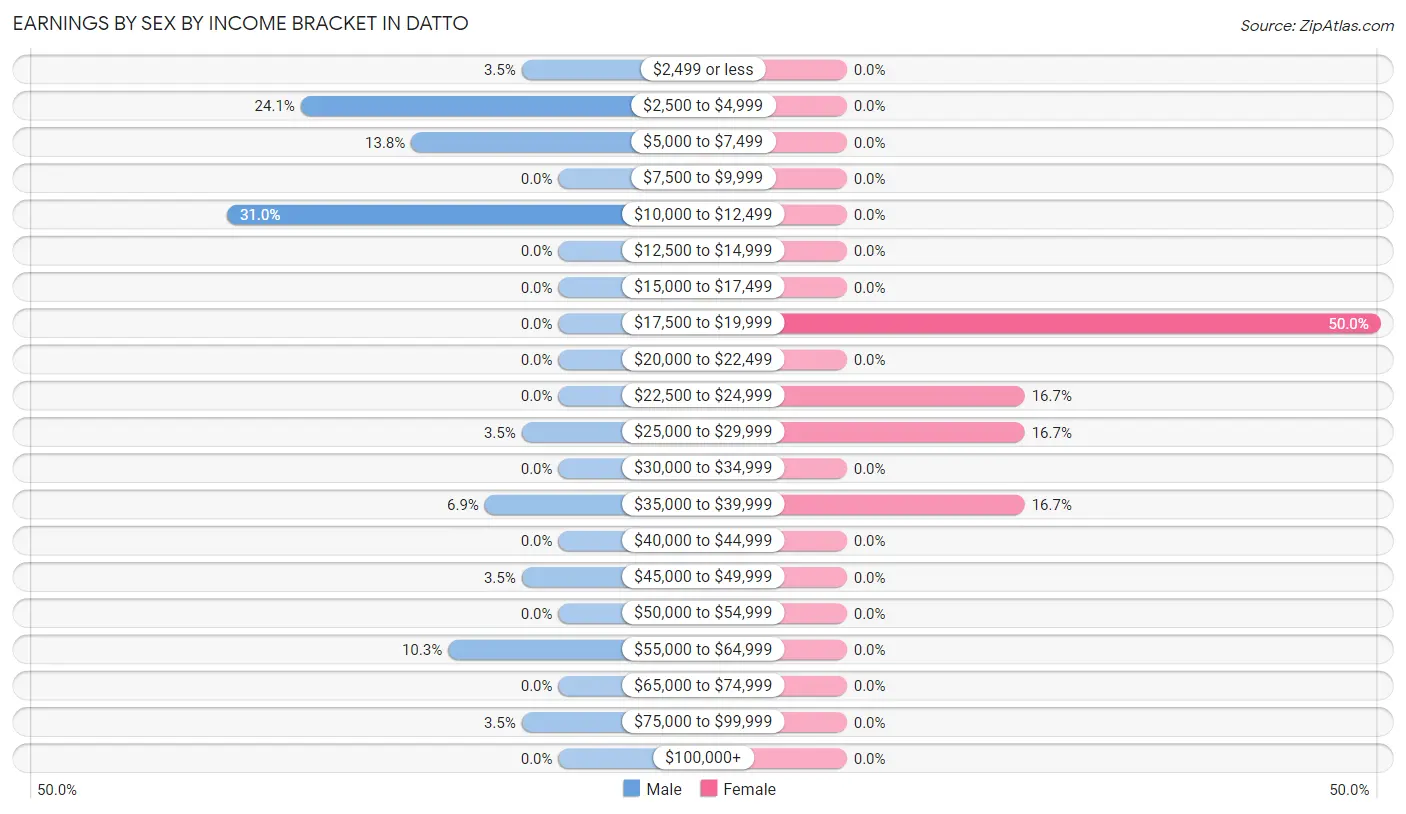
Earnings by Sex by Income Bracket in Datto
The most common earnings brackets in Datto are $10,000 to $12,499 for men (9 | 31.0%) and $17,500 to $19,999 for women (3 | 50.0%).
| Income | Male | Female |
| $2,499 or less | 1 (3.5%) | 0 (0.0%) |
| $2,500 to $4,999 | 7 (24.1%) | 0 (0.0%) |
| $5,000 to $7,499 | 4 (13.8%) | 0 (0.0%) |
| $7,500 to $9,999 | 0 (0.0%) | 0 (0.0%) |
| $10,000 to $12,499 | 9 (31.0%) | 0 (0.0%) |
| $12,500 to $14,999 | 0 (0.0%) | 0 (0.0%) |
| $15,000 to $17,499 | 0 (0.0%) | 0 (0.0%) |
| $17,500 to $19,999 | 0 (0.0%) | 3 (50.0%) |
| $20,000 to $22,499 | 0 (0.0%) | 0 (0.0%) |
| $22,500 to $24,999 | 0 (0.0%) | 1 (16.7%) |
| $25,000 to $29,999 | 1 (3.5%) | 1 (16.7%) |
| $30,000 to $34,999 | 0 (0.0%) | 0 (0.0%) |
| $35,000 to $39,999 | 2 (6.9%) | 1 (16.7%) |
| $40,000 to $44,999 | 0 (0.0%) | 0 (0.0%) |
| $45,000 to $49,999 | 1 (3.5%) | 0 (0.0%) |
| $50,000 to $54,999 | 0 (0.0%) | 0 (0.0%) |
| $55,000 to $64,999 | 3 (10.3%) | 0 (0.0%) |
| $65,000 to $74,999 | 0 (0.0%) | 0 (0.0%) |
| $75,000 to $99,999 | 1 (3.5%) | 0 (0.0%) |
| $100,000+ | 0 (0.0%) | 0 (0.0%) |
| Total | 29 (100.0%) | 6 (100.0%) |
Earnings by Sex by Educational Attainment in Datto
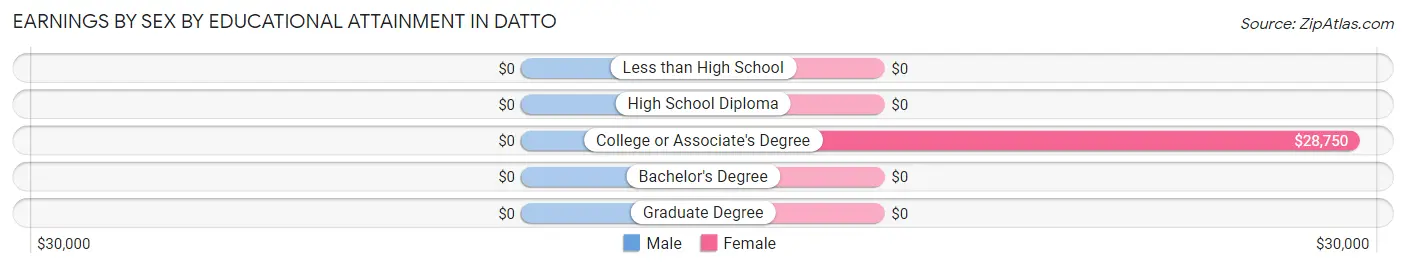
| Educational Attainment | Male Income | Female Income |
| Less than High School | - | - |
| High School Diploma | - | - |
| College or Associate's Degree | - | - |
| Bachelor's Degree | - | - |
| Graduate Degree | - | - |
| Total | - | - |
Family Income in Datto
Family Income Brackets in Datto
According to the Datto family income data, there are 4 families falling into the $25,000 to $34,999 income range, which is the most common income bracket and makes up 28.6% of all families.
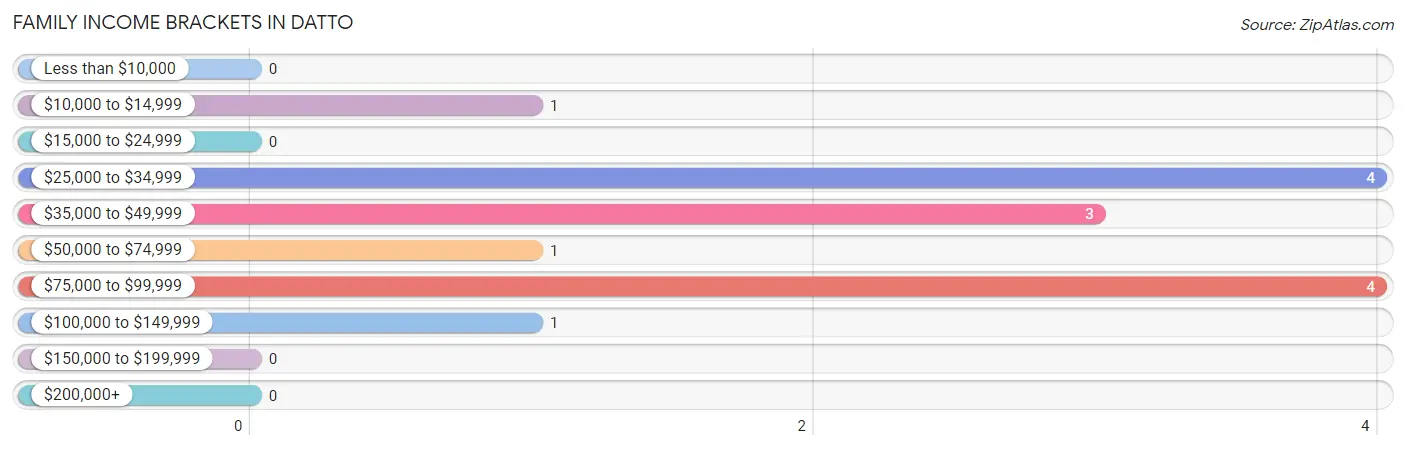
| Income Bracket | # Families | % Families |
| Less than $10,000 | 0 | 0.0% |
| $10,000 to $14,999 | 1 | 7.1% |
| $15,000 to $24,999 | 0 | 0.0% |
| $25,000 to $34,999 | 4 | 28.6% |
| $35,000 to $49,999 | 3 | 21.4% |
| $50,000 to $74,999 | 1 | 7.1% |
| $75,000 to $99,999 | 4 | 28.6% |
| $100,000 to $149,999 | 1 | 7.1% |
| $150,000 to $199,999 | 0 | 0.0% |
| $200,000+ | 0 | 0.0% |
Family Income by Famaliy Size in Datto
3-person families (6 | 42.9%) account for the highest median family income in Datto with $80,833 per family, while 3-person families (6 | 42.9%) have the highest median income of $26,944 per family member.
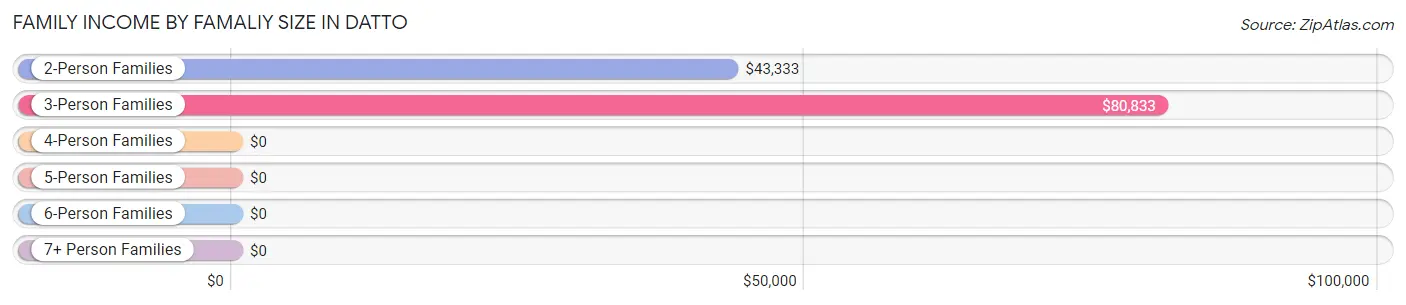
| Income Bracket | # Families | Median Income |
| 2-Person Families | 8 (57.1%) | $43,333 |
| 3-Person Families | 6 (42.9%) | $80,833 |
| 4-Person Families | 0 (0.0%) | $0 |
| 5-Person Families | 0 (0.0%) | $0 |
| 6-Person Families | 0 (0.0%) | $0 |
| 7+ Person Families | 0 (0.0%) | $0 |
| Total | 14 (100.0%) | $0 |
Family Income by Number of Earners in Datto
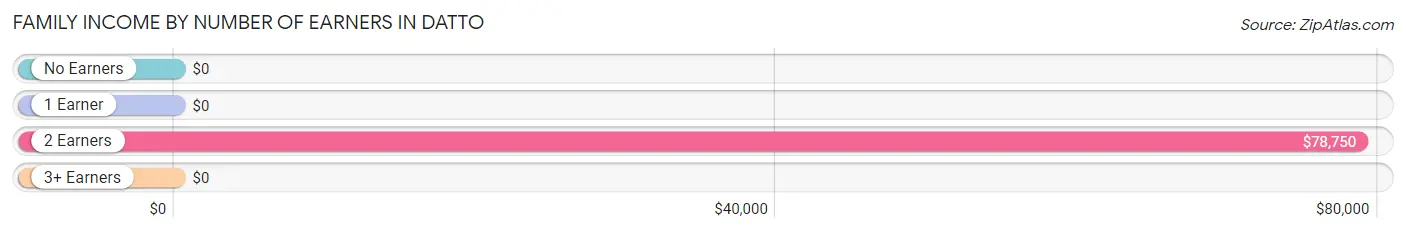
| Number of Earners | # Families | Median Income |
| No Earners | 5 (35.7%) | $0 |
| 1 Earner | 1 (7.1%) | $0 |
| 2 Earners | 7 (50.0%) | $78,750 |
| 3+ Earners | 1 (7.1%) | $0 |
| Total | 14 (100.0%) | $0 |
Household Income in Datto
Household Income Brackets in Datto
With 11 households falling in the category, the $15,000 to $24,999 income range is the most frequent in Datto, accounting for 40.7% of all households.
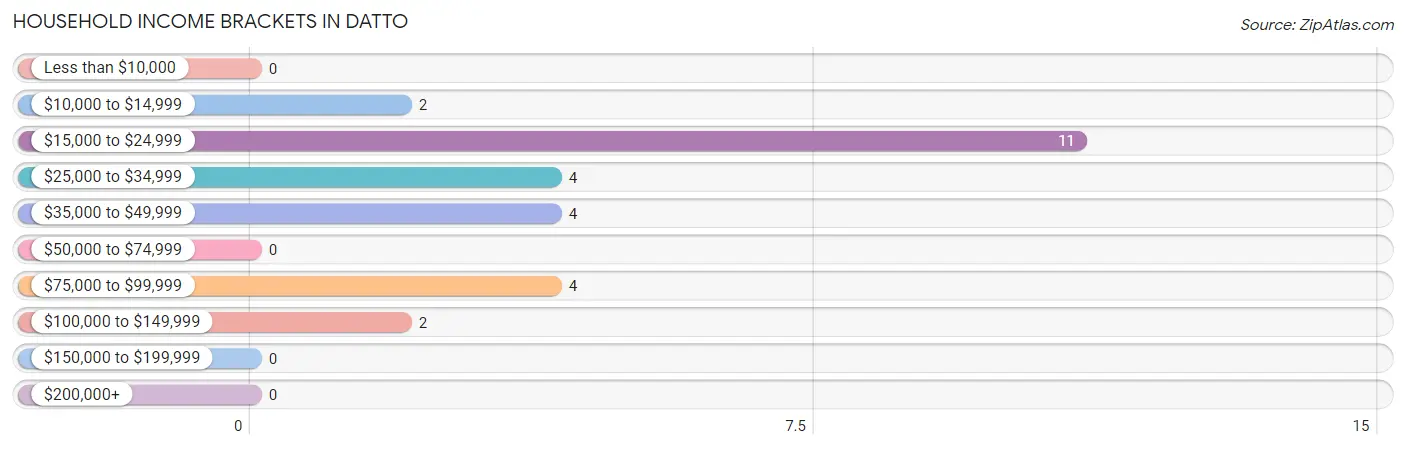
| Income Bracket | # Households | % Households |
| Less than $10,000 | 0 | 0.0% |
| $10,000 to $14,999 | 2 | 7.4% |
| $15,000 to $24,999 | 11 | 40.7% |
| $25,000 to $34,999 | 4 | 14.8% |
| $35,000 to $49,999 | 4 | 14.8% |
| $50,000 to $74,999 | 0 | 0.0% |
| $75,000 to $99,999 | 4 | 14.8% |
| $100,000 to $149,999 | 2 | 7.4% |
| $150,000 to $199,999 | 0 | 0.0% |
| $200,000+ | 0 | 0.0% |
Household Income by Householder Age in Datto
The median household income in Datto is $25,313, with the highest median household income of $81,250 found in the 25 to 44 years age bracket for the primary householder. A total of 5 households (18.5%) fall into this category.
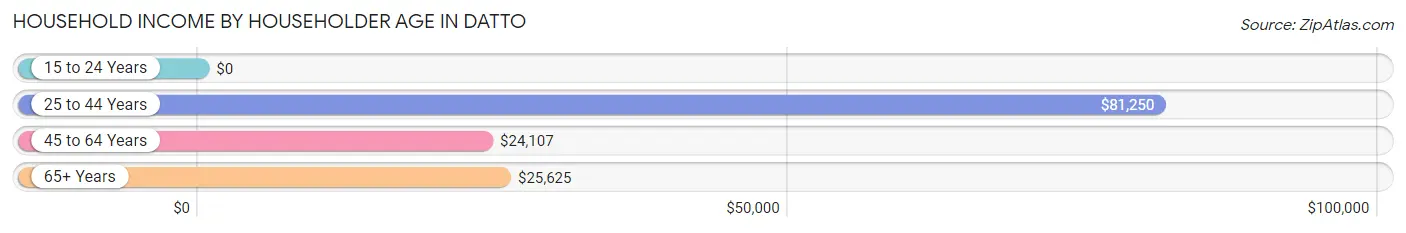
| Income Bracket | # Households | Median Income |
| 15 to 24 Years | 0 (0.0%) | $0 |
| 25 to 44 Years | 5 (18.5%) | $81,250 |
| 45 to 64 Years | 17 (63.0%) | $24,107 |
| 65+ Years | 5 (18.5%) | $25,625 |
| Total | 27 (100.0%) | $25,313 |
Poverty in Datto
Income Below Poverty by Sex and Age in Datto
With 13.2% poverty level for males and 4.8% for females among the residents of Datto, 55 to 64 year old males and 45 to 54 year old females are the most vulnerable to poverty, with 5 males (33.3%) and 1 females (25.0%) in their respective age groups living below the poverty level.
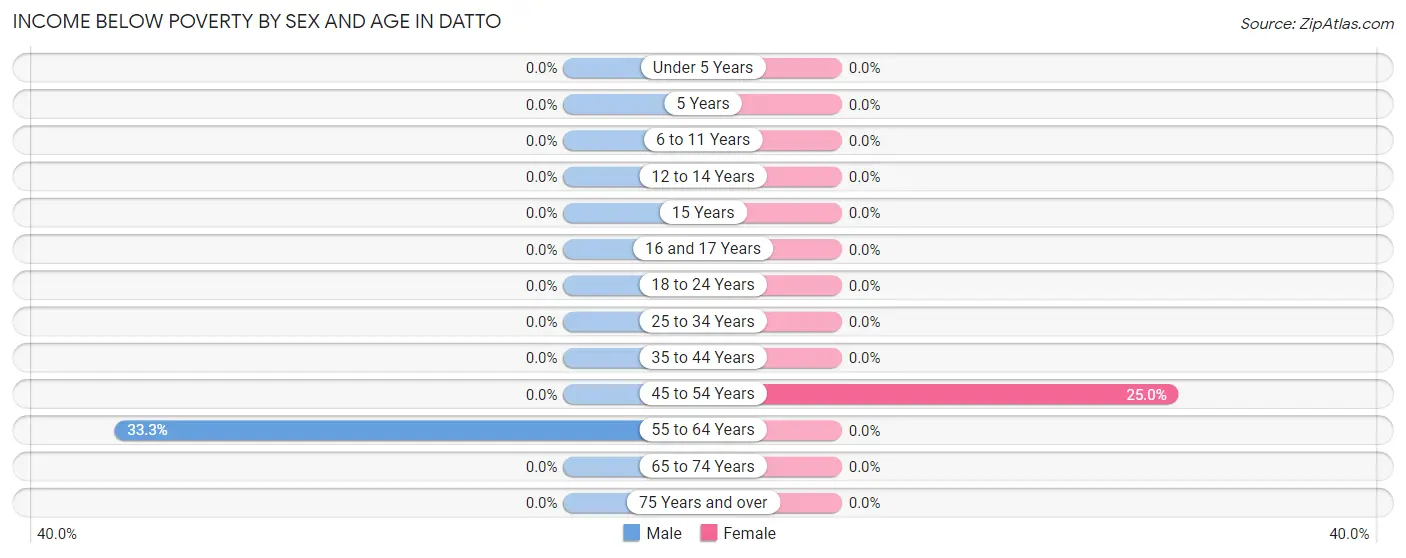
| Age Bracket | Male | Female |
| Under 5 Years | 0 (0.0%) | 0 (0.0%) |
| 5 Years | 0 (0.0%) | 0 (0.0%) |
| 6 to 11 Years | 0 (0.0%) | 0 (0.0%) |
| 12 to 14 Years | 0 (0.0%) | 0 (0.0%) |
| 15 Years | 0 (0.0%) | 0 (0.0%) |
| 16 and 17 Years | 0 (0.0%) | 0 (0.0%) |
| 18 to 24 Years | 0 (0.0%) | 0 (0.0%) |
| 25 to 34 Years | 0 (0.0%) | 0 (0.0%) |
| 35 to 44 Years | 0 (0.0%) | 0 (0.0%) |
| 45 to 54 Years | 0 (0.0%) | 1 (25.0%) |
| 55 to 64 Years | 5 (33.3%) | 0 (0.0%) |
| 65 to 74 Years | 0 (0.0%) | 0 (0.0%) |
| 75 Years and over | 0 (0.0%) | 0 (0.0%) |
| Total | 5 (13.2%) | 1 (4.8%) |
Income Above Poverty by Sex and Age in Datto
According to the poverty statistics in Datto, males aged 18 to 24 years and females aged 16 and 17 years are the age groups that are most secure financially, with 100.0% of males and 100.0% of females in these age groups living above the poverty line.
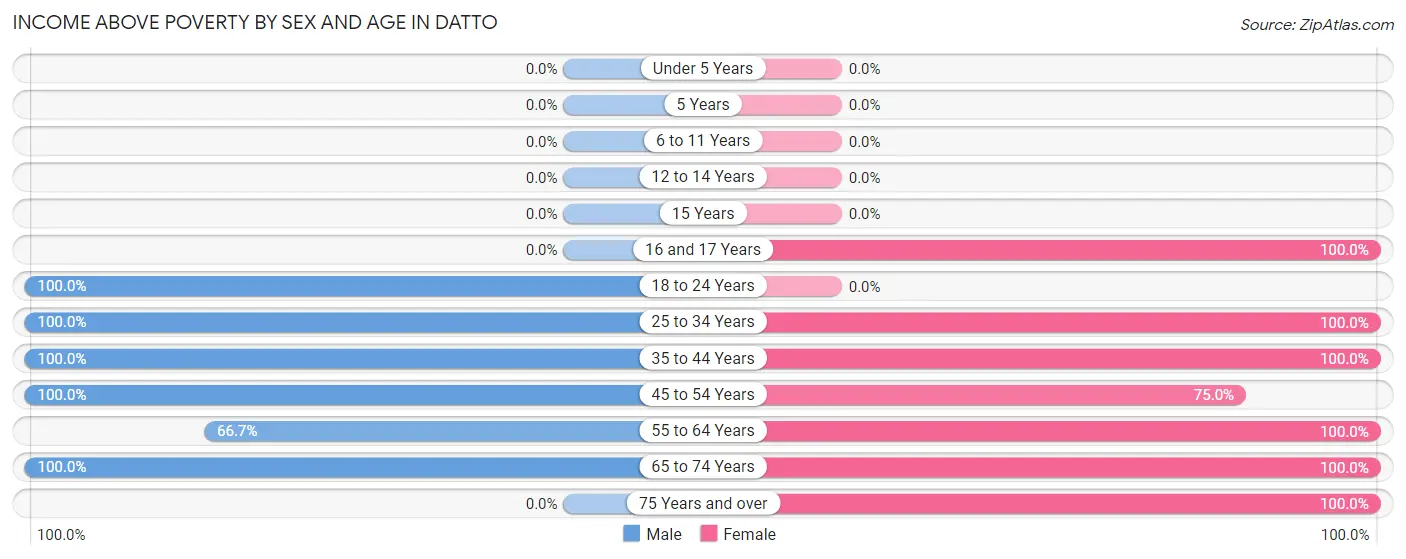
| Age Bracket | Male | Female |
| Under 5 Years | 0 (0.0%) | 0 (0.0%) |
| 5 Years | 0 (0.0%) | 0 (0.0%) |
| 6 to 11 Years | 0 (0.0%) | 0 (0.0%) |
| 12 to 14 Years | 0 (0.0%) | 0 (0.0%) |
| 15 Years | 0 (0.0%) | 0 (0.0%) |
| 16 and 17 Years | 0 (0.0%) | 5 (100.0%) |
| 18 to 24 Years | 2 (100.0%) | 0 (0.0%) |
| 25 to 34 Years | 4 (100.0%) | 1 (100.0%) |
| 35 to 44 Years | 4 (100.0%) | 4 (100.0%) |
| 45 to 54 Years | 7 (100.0%) | 3 (75.0%) |
| 55 to 64 Years | 10 (66.7%) | 3 (100.0%) |
| 65 to 74 Years | 6 (100.0%) | 3 (100.0%) |
| 75 Years and over | 0 (0.0%) | 1 (100.0%) |
| Total | 33 (86.8%) | 20 (95.2%) |
Income Below Poverty Among Married-Couple Families in Datto
The poverty statistics for married-couple families in Datto show that 7.7% or 1 of the total 13 families live below the poverty line. Families with no children have the highest poverty rate of 10.0%, comprising of 1 families. On the other hand, families with 1 or 2 children have the lowest poverty rate of 0.0%, which includes 0 families.
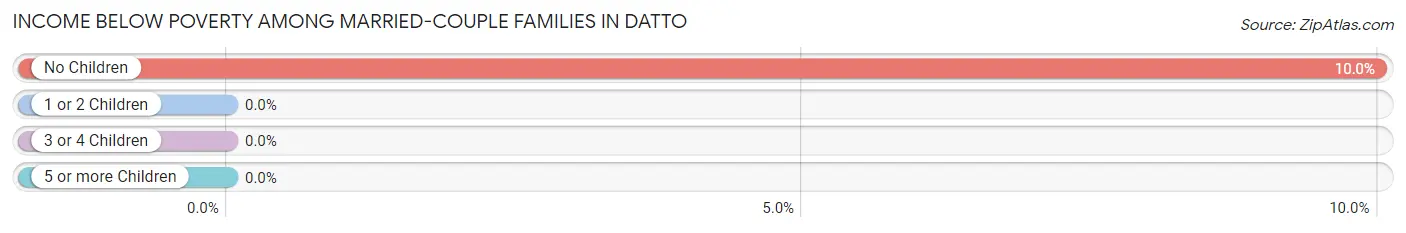
| Children | Above Poverty | Below Poverty |
| No Children | 9 (90.0%) | 1 (10.0%) |
| 1 or 2 Children | 3 (100.0%) | 0 (0.0%) |
| 3 or 4 Children | 0 (0.0%) | 0 (0.0%) |
| 5 or more Children | 0 (0.0%) | 0 (0.0%) |
| Total | 12 (92.3%) | 1 (7.7%) |
Income Below Poverty Among Single-Parent Households in Datto
| Children | Single Father | Single Mother |
| No Children | 0 (0.0%) | 0 (0.0%) |
| 1 or 2 Children | 0 (0.0%) | 0 (0.0%) |
| 3 or 4 Children | 0 (0.0%) | 0 (0.0%) |
| 5 or more Children | 0 (0.0%) | 0 (0.0%) |
| Total | 0 (0.0%) | 0 (0.0%) |
Income Below Poverty Among Married-Couple vs Single-Parent Households in Datto
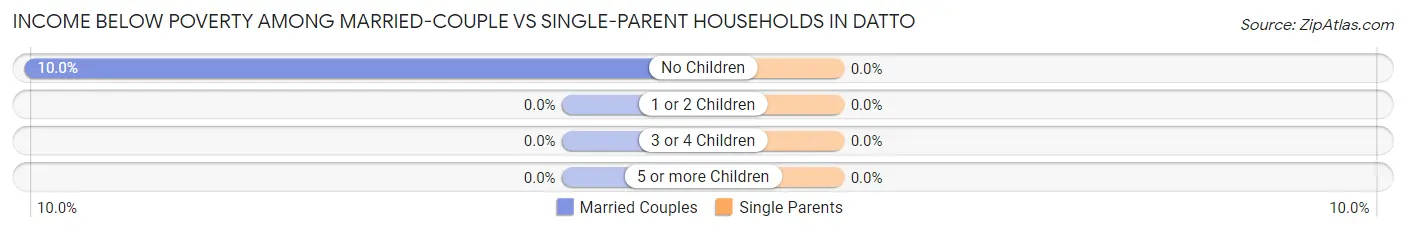
| Children | Married-Couple Families | Single-Parent Households |
| No Children | 1 (10.0%) | 0 (0.0%) |
| 1 or 2 Children | 0 (0.0%) | 0 (0.0%) |
| 3 or 4 Children | 0 (0.0%) | 0 (0.0%) |
| 5 or more Children | 0 (0.0%) | 0 (0.0%) |
| Total | 1 (7.7%) | 0 (0.0%) |
Race in Datto
The most populous races in Datto are White / Caucasian (58 | 98.3%), and Two or more Races (1 | 1.7%).
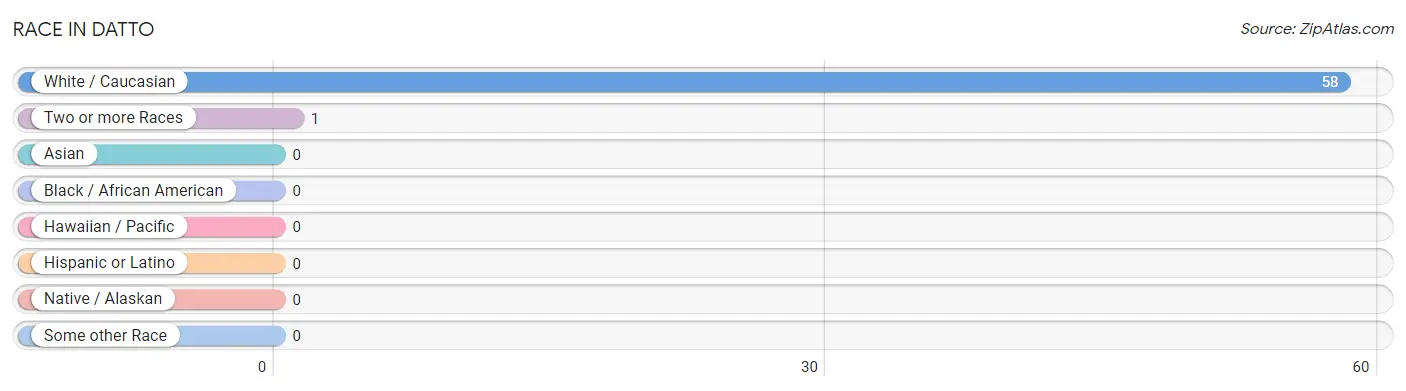
| Race | # Population | % Population |
| Asian | 0 | 0.0% |
| Black / African American | 0 | 0.0% |
| Hawaiian / Pacific | 0 | 0.0% |
| Hispanic or Latino | 0 | 0.0% |
| Native / Alaskan | 0 | 0.0% |
| White / Caucasian | 58 | 98.3% |
| Two or more Races | 1 | 1.7% |
| Some other Race | 0 | 0.0% |
| Total | 59 | 100.0% |
Ancestry in Datto
The most populous ancestries reported in Datto are Irish (12 | 20.3%), German (10 | 17.0%), American (6 | 10.2%), French Canadian (4 | 6.8%), and Czechoslovakian (3 | 5.1%), together accounting for 59.3% of all Datto residents.
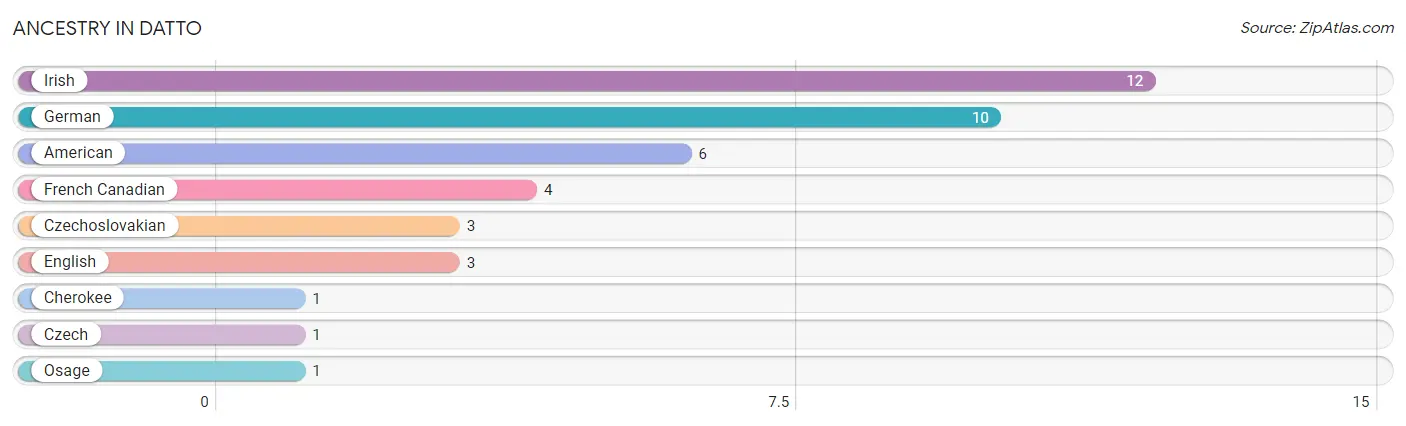
| Ancestry | # Population | % Population |
| American | 6 | 10.2% |
| Cherokee | 1 | 1.7% |
| Czech | 1 | 1.7% |
| Czechoslovakian | 3 | 5.1% |
| English | 3 | 5.1% |
| French Canadian | 4 | 6.8% |
| German | 10 | 17.0% |
| Irish | 12 | 20.3% |
| Osage | 1 | 1.7% | View All 9 Rows |
Immigrants in Datto

| Immigration Origin | # Population | % Population | View All 0 Rows |
Sex and Age in Datto
Sex and Age in Datto
The most populous age groups in Datto are 60 to 64 Years (12 | 31.6%) for men and 15 to 19 Years (5 | 23.8%) for women.
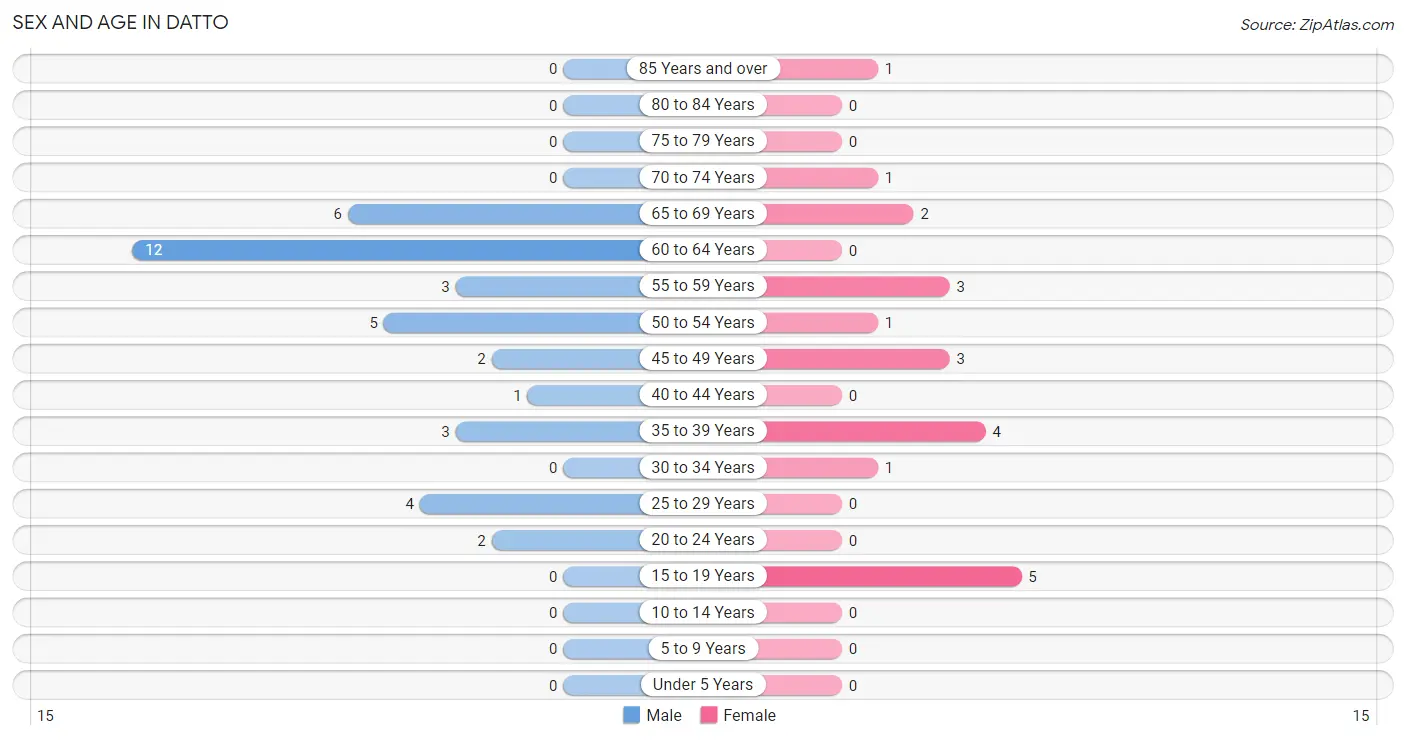
| Age Bracket | Male | Female |
| Under 5 Years | 0 (0.0%) | 0 (0.0%) |
| 5 to 9 Years | 0 (0.0%) | 0 (0.0%) |
| 10 to 14 Years | 0 (0.0%) | 0 (0.0%) |
| 15 to 19 Years | 0 (0.0%) | 5 (23.8%) |
| 20 to 24 Years | 2 (5.3%) | 0 (0.0%) |
| 25 to 29 Years | 4 (10.5%) | 0 (0.0%) |
| 30 to 34 Years | 0 (0.0%) | 1 (4.8%) |
| 35 to 39 Years | 3 (7.9%) | 4 (19.1%) |
| 40 to 44 Years | 1 (2.6%) | 0 (0.0%) |
| 45 to 49 Years | 2 (5.3%) | 3 (14.3%) |
| 50 to 54 Years | 5 (13.2%) | 1 (4.8%) |
| 55 to 59 Years | 3 (7.9%) | 3 (14.3%) |
| 60 to 64 Years | 12 (31.6%) | 0 (0.0%) |
| 65 to 69 Years | 6 (15.8%) | 2 (9.5%) |
| 70 to 74 Years | 0 (0.0%) | 1 (4.8%) |
| 75 to 79 Years | 0 (0.0%) | 0 (0.0%) |
| 80 to 84 Years | 0 (0.0%) | 0 (0.0%) |
| 85 Years and over | 0 (0.0%) | 1 (4.8%) |
| Total | 38 (100.0%) | 21 (100.0%) |
Families and Households in Datto
Median Family Size in Datto
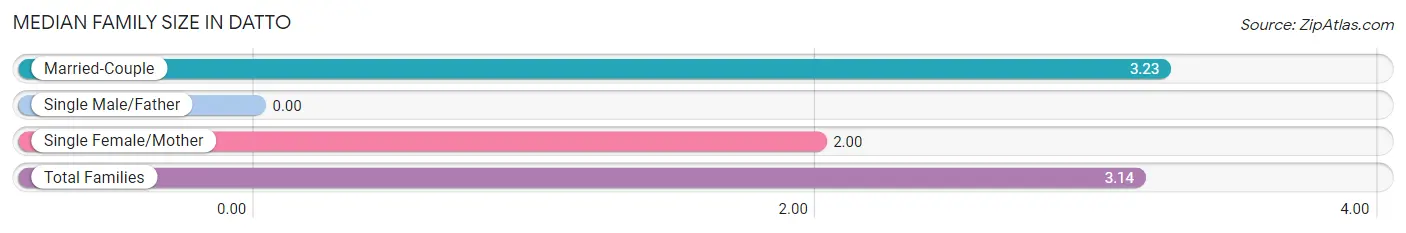
| Family Type | # Families | Family Size |
| Married-Couple | 13 (92.9%) | 3.23 |
| Single Male/Father | 0 (0.0%) | - |
| Single Female/Mother | 1 (7.1%) | 2.00 |
| Total Families | 14 (100.0%) | 3.14 |
Median Household Size in Datto
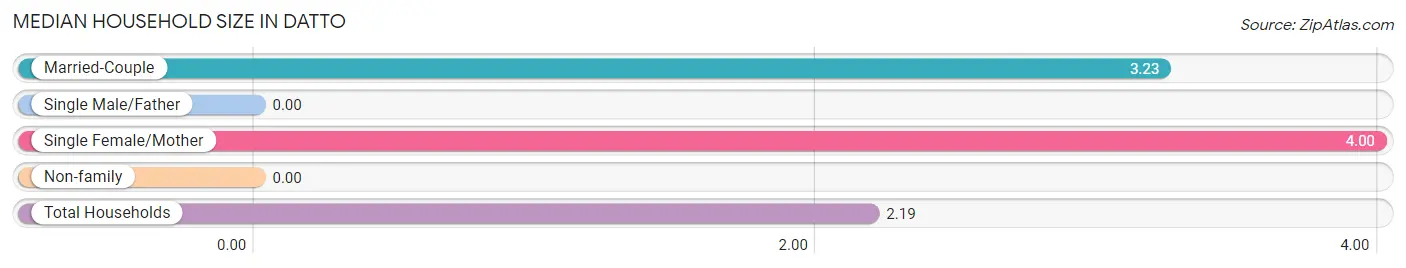
| Household Type | # Households | Household Size |
| Married-Couple | 13 (48.1%) | 3.23 |
| Single Male/Father | 0 (0.0%) | - |
| Single Female/Mother | 1 (3.7%) | 4.00 |
| Non-family | 13 (48.1%) | - |
| Total Households | 27 (100.0%) | 2.19 |
Household Size by Marriage Status in Datto
Out of a total of 27 households in Datto, 14 (51.8%) are family households, while 13 (48.1%) are nonfamily households. The most numerous type of family households are 2-person households, comprising 7, and the most common type of nonfamily households are 1-person households, comprising 13.
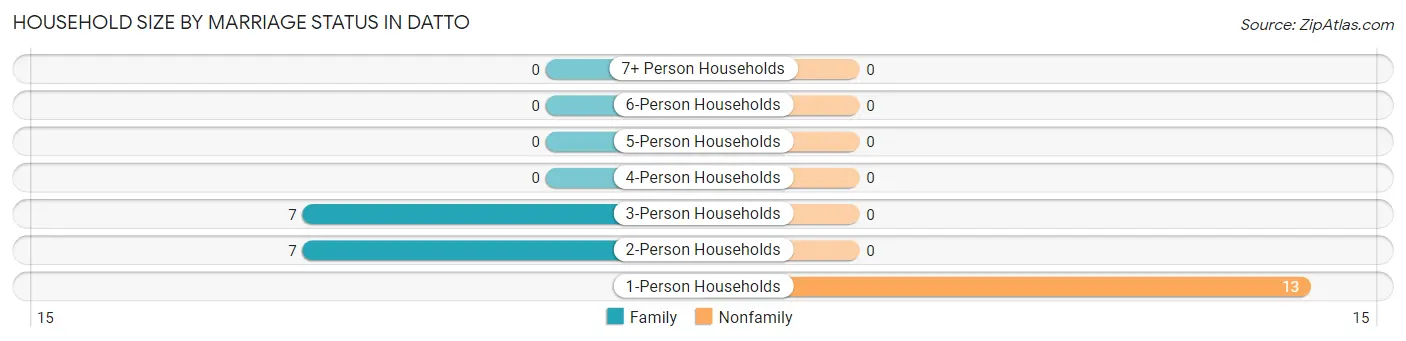
| Household Size | Family Households | Nonfamily Households |
| 1-Person Households | - | 13 (48.1%) |
| 2-Person Households | 7 (25.9%) | 0 (0.0%) |
| 3-Person Households | 7 (25.9%) | 0 (0.0%) |
| 4-Person Households | 0 (0.0%) | 0 (0.0%) |
| 5-Person Households | 0 (0.0%) | 0 (0.0%) |
| 6-Person Households | 0 (0.0%) | 0 (0.0%) |
| 7+ Person Households | 0 (0.0%) | 0 (0.0%) |
| Total | 14 (51.8%) | 13 (48.1%) |
Female Fertility in Datto
Fertility by Age in Datto
| Age Bracket | Women with Births | Births / 1,000 Women |
| 15 to 19 years | 0 (0.0%) | 0.0 |
| 20 to 34 years | 0 (0.0%) | 0.0 |
| 35 to 50 years | 0 (0.0%) | 0.0 |
| Total | 0 (0.0%) | 0.0 |
Fertility by Age by Marriage Status in Datto
| Age Bracket | Married | Unmarried |
| 15 to 19 years | 0 (0.0%) | 0 (0.0%) |
| 20 to 34 years | 0 (0.0%) | 0 (0.0%) |
| 35 to 50 years | 0 (0.0%) | 0 (0.0%) |
| Total | 0 (0.0%) | 0 (0.0%) |
Fertility by Education in Datto
| Educational Attainment | Women with Births | Births / 1,000 Women |
| Less than High School | 0 (0.0%) | 0.0 |
| High School Diploma | 0 (0.0%) | 0.0 |
| College or Associate's Degree | 0 (0.0%) | 0.0 |
| Bachelor's Degree | 0 (0.0%) | 0.0 |
| Graduate Degree | 0 (0.0%) | 0.0 |
| Total | 0 (0.0%) | 0.0 |
Fertility by Education by Marriage Status in Datto
| Educational Attainment | Married | Unmarried |
| Less than High School | 0 (0.0%) | 0 (0.0%) |
| High School Diploma | 0 (0.0%) | 0 (0.0%) |
| College or Associate's Degree | 0 (0.0%) | 0 (0.0%) |
| Bachelor's Degree | 0 (0.0%) | 0 (0.0%) |
| Graduate Degree | 0 (0.0%) | 0 (0.0%) |
| Total | 0 (0.0%) | 0 (0.0%) |
Employment Characteristics in Datto
Employment by Class of Employer in Datto
Among the 22 employed individuals in Datto, private company employees (14 | 63.6%), not-for-profit organizations (4 | 18.2%), and state government employees (3 | 13.6%) make up the most common classes of employment.
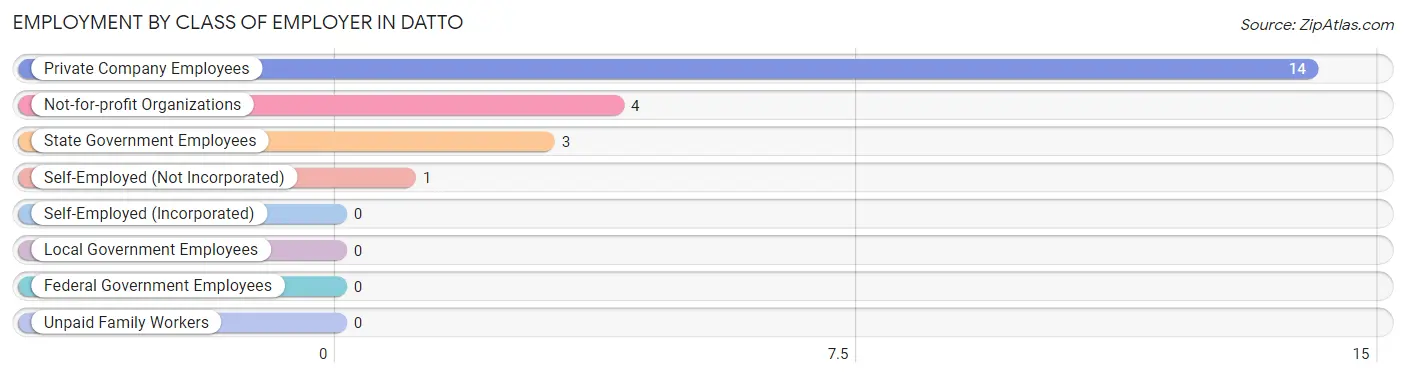
| Employer Class | # Employees | % Employees |
| Private Company Employees | 14 | 63.6% |
| Self-Employed (Incorporated) | 0 | 0.0% |
| Self-Employed (Not Incorporated) | 1 | 4.5% |
| Not-for-profit Organizations | 4 | 18.2% |
| Local Government Employees | 0 | 0.0% |
| State Government Employees | 3 | 13.6% |
| Federal Government Employees | 0 | 0.0% |
| Unpaid Family Workers | 0 | 0.0% |
| Total | 22 | 100.0% |
Employment Status by Age in Datto
According to the labor force statistics for Datto, out of the total population over 16 years of age (59), 39.0% or 23 individuals are in the labor force, with 4.3% or 1 of them unemployed. The age group with the highest labor force participation rate is 20 to 24 years, with 100.0% or 2 individuals in the labor force. Within the labor force, the 20 to 24 years age range has the highest percentage of unemployed individuals, with 50.0% or 1 of them being unemployed.
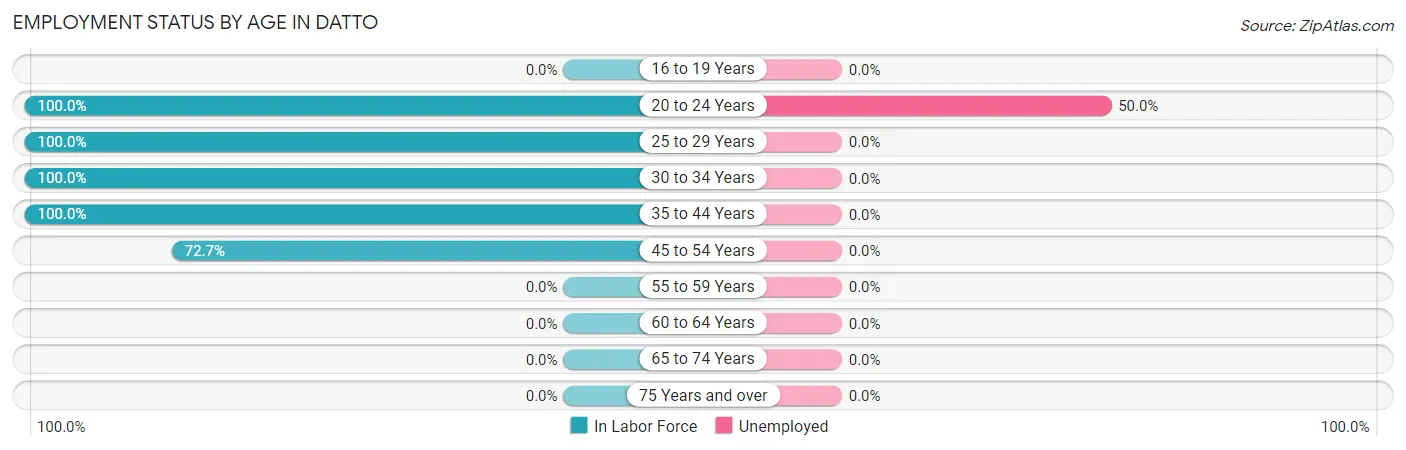
| Age Bracket | In Labor Force | Unemployed |
| 16 to 19 Years | 0 (0.0%) | 0 (0.0%) |
| 20 to 24 Years | 2 (100.0%) | 1 (50.0%) |
| 25 to 29 Years | 4 (100.0%) | 0 (0.0%) |
| 30 to 34 Years | 1 (100.0%) | 0 (0.0%) |
| 35 to 44 Years | 8 (100.0%) | 0 (0.0%) |
| 45 to 54 Years | 8 (72.7%) | 0 (0.0%) |
| 55 to 59 Years | 0 (0.0%) | 0 (0.0%) |
| 60 to 64 Years | 0 (0.0%) | 0 (0.0%) |
| 65 to 74 Years | 0 (0.0%) | 0 (0.0%) |
| 75 Years and over | 0 (0.0%) | 0 (0.0%) |
| Total | 23 (39.0%) | 1 (4.3%) |
Employment Status by Educational Attainment in Datto
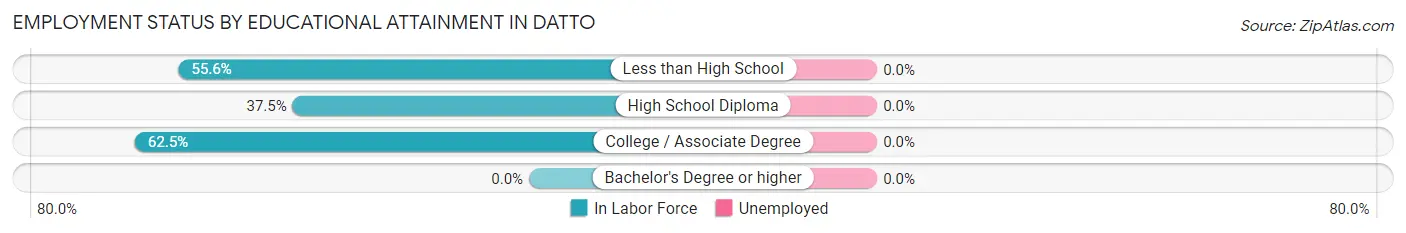
| Educational Attainment | In Labor Force | Unemployed |
| Less than High School | 10 (55.6%) | 0 (0.0%) |
| High School Diploma | 6 (37.5%) | 0 (0.0%) |
| College / Associate Degree | 5 (62.5%) | 0 (0.0%) |
| Bachelor's Degree or higher | 0 (0.0%) | 0 (0.0%) |
| Total | 21 (50.0%) | 0 (0.0%) |
Employment Occupations by Sex in Datto
Management, Business, Science and Arts Occupations
The most common Management, Business, Science and Arts occupations in Datto are , and Management (2 | 9.1%).
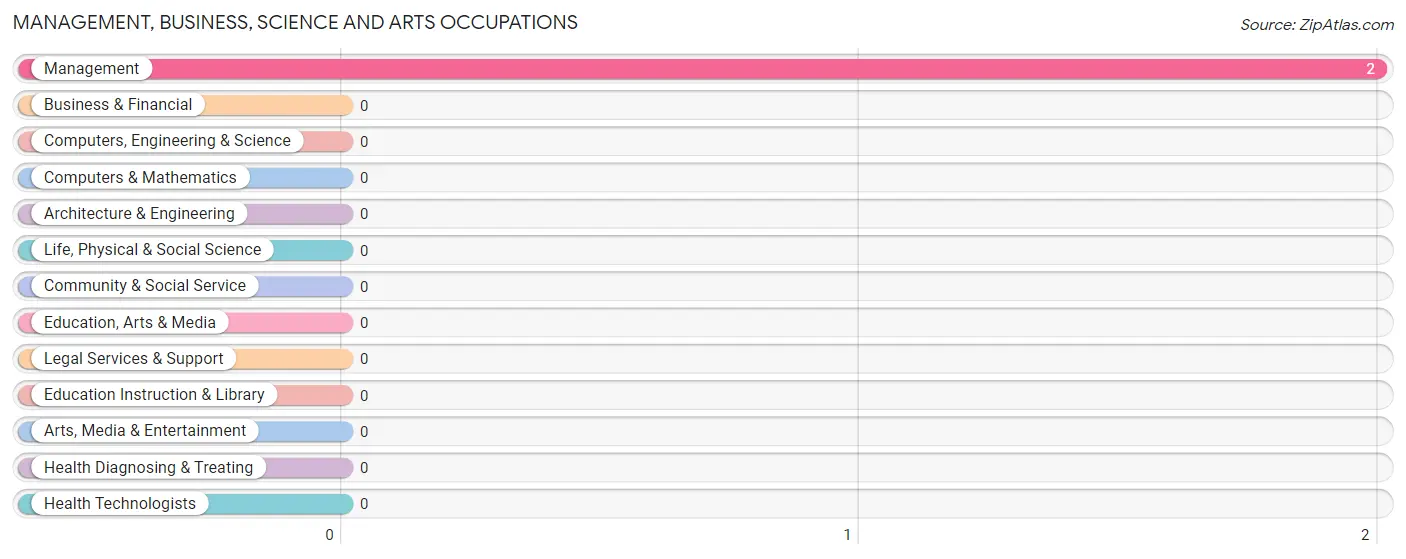
Management, Business, Science and Arts Occupations by Sex
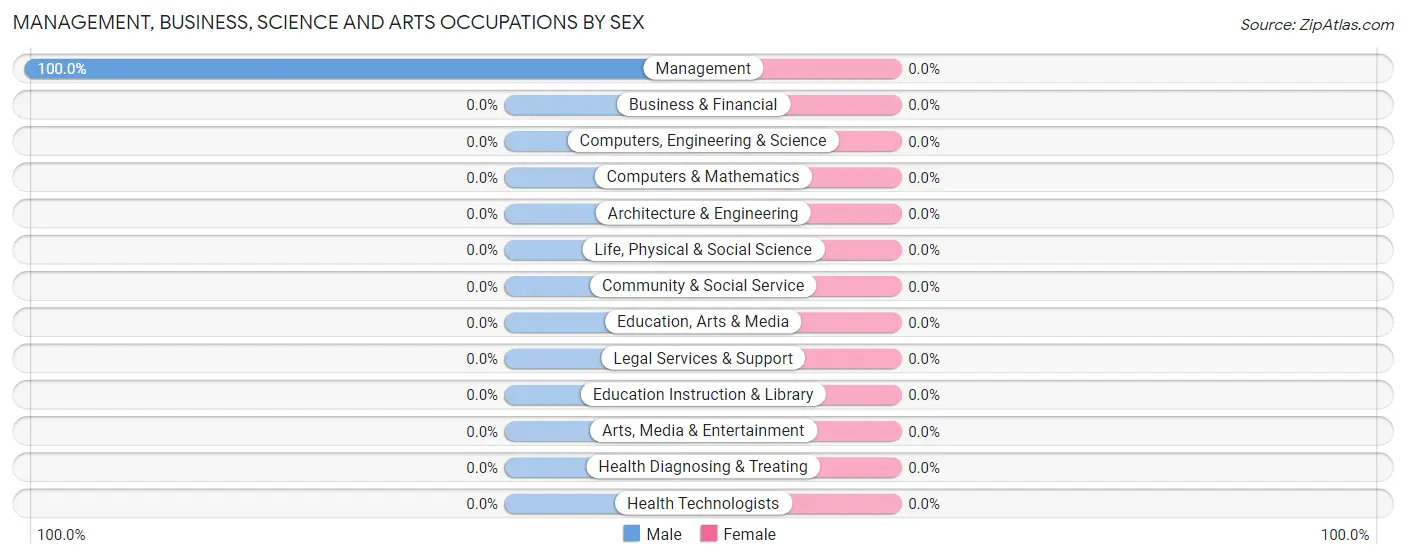
| Occupation | Male | Female |
| Management | 2 (100.0%) | 0 (0.0%) |
| Business & Financial | 0 (0.0%) | 0 (0.0%) |
| Computers, Engineering & Science | 0 (0.0%) | 0 (0.0%) |
| Computers & Mathematics | 0 (0.0%) | 0 (0.0%) |
| Architecture & Engineering | 0 (0.0%) | 0 (0.0%) |
| Life, Physical & Social Science | 0 (0.0%) | 0 (0.0%) |
| Community & Social Service | 0 (0.0%) | 0 (0.0%) |
| Education, Arts & Media | 0 (0.0%) | 0 (0.0%) |
| Legal Services & Support | 0 (0.0%) | 0 (0.0%) |
| Education Instruction & Library | 0 (0.0%) | 0 (0.0%) |
| Arts, Media & Entertainment | 0 (0.0%) | 0 (0.0%) |
| Health Diagnosing & Treating | 0 (0.0%) | 0 (0.0%) |
| Health Technologists | 0 (0.0%) | 0 (0.0%) |
| Total (Category) | 2 (100.0%) | 0 (0.0%) |
| Total (Overall) | 16 (72.7%) | 6 (27.3%) |
Services Occupations
The most common Services occupations in Datto are Food Preparation & Serving (3 | 13.6%), and Personal Care & Service (1 | 4.5%).
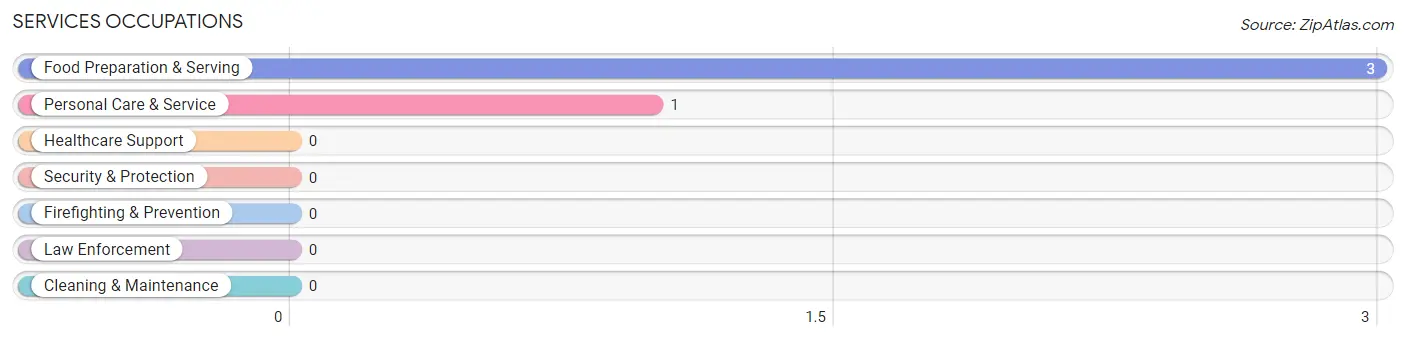
Services Occupations by Sex
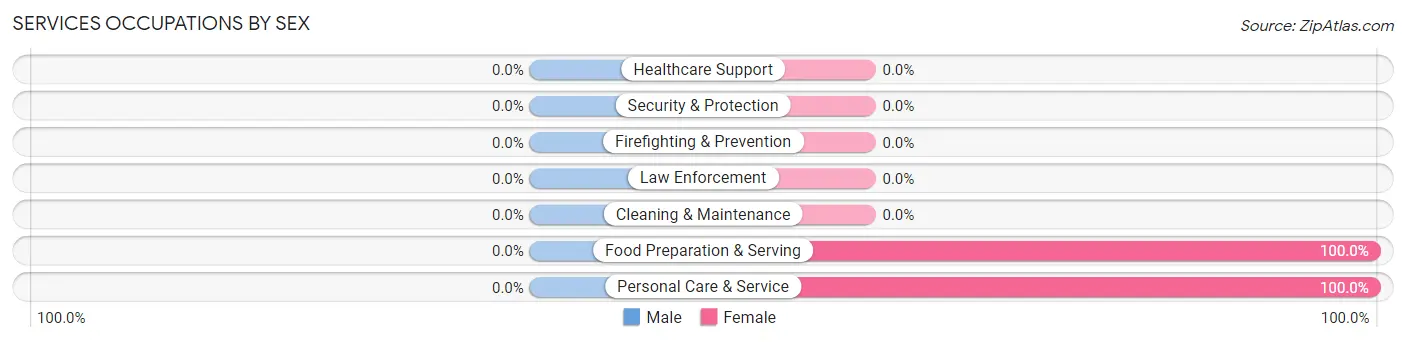
| Occupation | Male | Female |
| Healthcare Support | 0 (0.0%) | 0 (0.0%) |
| Security & Protection | 0 (0.0%) | 0 (0.0%) |
| Firefighting & Prevention | 0 (0.0%) | 0 (0.0%) |
| Law Enforcement | 0 (0.0%) | 0 (0.0%) |
| Food Preparation & Serving | 0 (0.0%) | 3 (100.0%) |
| Cleaning & Maintenance | 0 (0.0%) | 0 (0.0%) |
| Personal Care & Service | 0 (0.0%) | 1 (100.0%) |
| Total (Category) | 0 (0.0%) | 4 (100.0%) |
| Total (Overall) | 16 (72.7%) | 6 (27.3%) |
Sales and Office Occupations
The most common Sales and Office occupations in Datto are , and Office & Administration (2 | 9.1%).
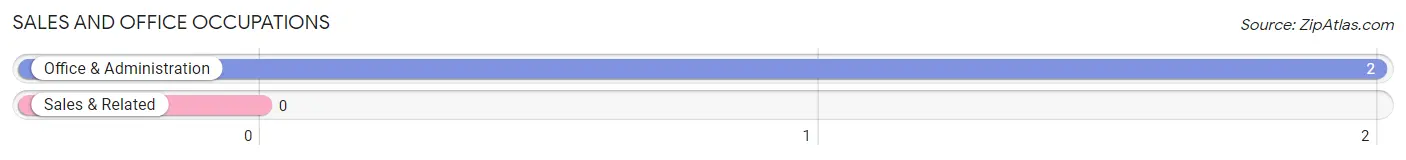
Sales and Office Occupations by Sex
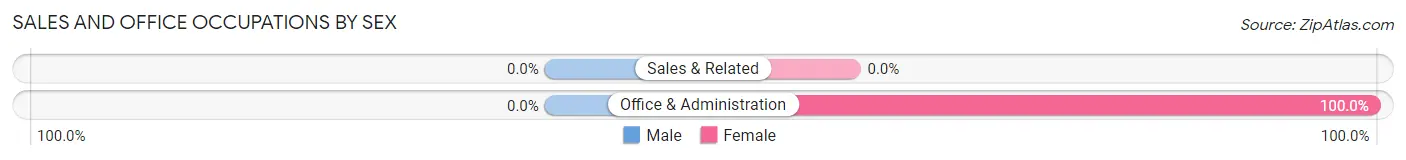
| Occupation | Male | Female |
| Sales & Related | 0 (0.0%) | 0 (0.0%) |
| Office & Administration | 0 (0.0%) | 2 (100.0%) |
| Total (Category) | 0 (0.0%) | 2 (100.0%) |
| Total (Overall) | 16 (72.7%) | 6 (27.3%) |
Natural Resources, Construction and Maintenance Occupations
The most common Natural Resources, Construction and Maintenance occupations in Datto are Construction & Extraction (4 | 18.2%), and Installation, Maintenance & Repair (3 | 13.6%).
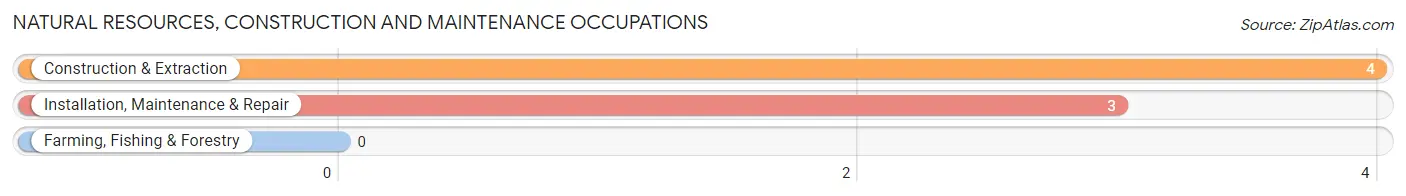
Natural Resources, Construction and Maintenance Occupations by Sex
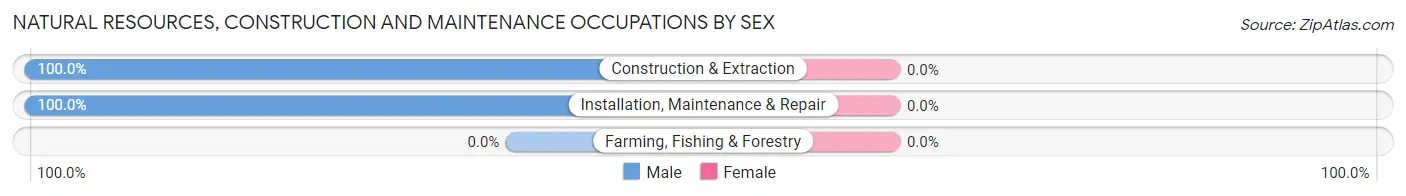
| Occupation | Male | Female |
| Farming, Fishing & Forestry | 0 (0.0%) | 0 (0.0%) |
| Construction & Extraction | 4 (100.0%) | 0 (0.0%) |
| Installation, Maintenance & Repair | 3 (100.0%) | 0 (0.0%) |
| Total (Category) | 7 (100.0%) | 0 (0.0%) |
| Total (Overall) | 16 (72.7%) | 6 (27.3%) |
Production, Transportation and Moving Occupations
The most common Production, Transportation and Moving occupations in Datto are Transportation (5 | 22.7%), and Production (2 | 9.1%).
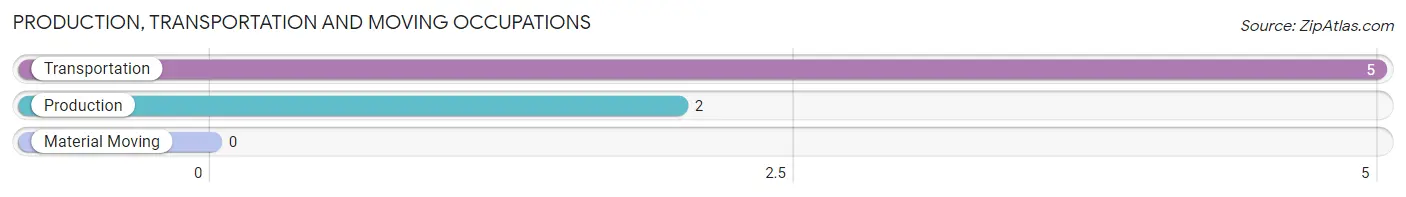
Production, Transportation and Moving Occupations by Sex
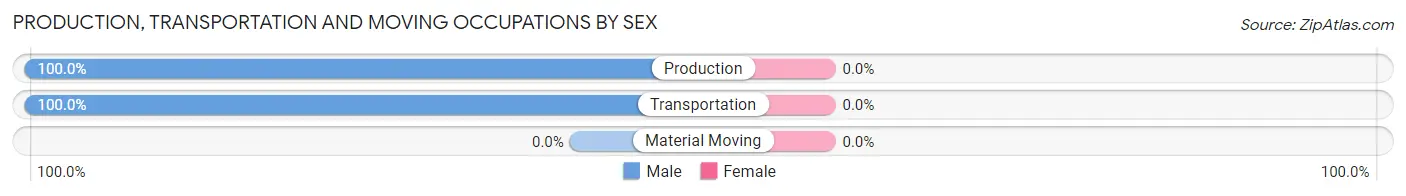
| Occupation | Male | Female |
| Production | 2 (100.0%) | 0 (0.0%) |
| Transportation | 5 (100.0%) | 0 (0.0%) |
| Material Moving | 0 (0.0%) | 0 (0.0%) |
| Total (Category) | 7 (100.0%) | 0 (0.0%) |
| Total (Overall) | 16 (72.7%) | 6 (27.3%) |
Employment Industries by Sex in Datto
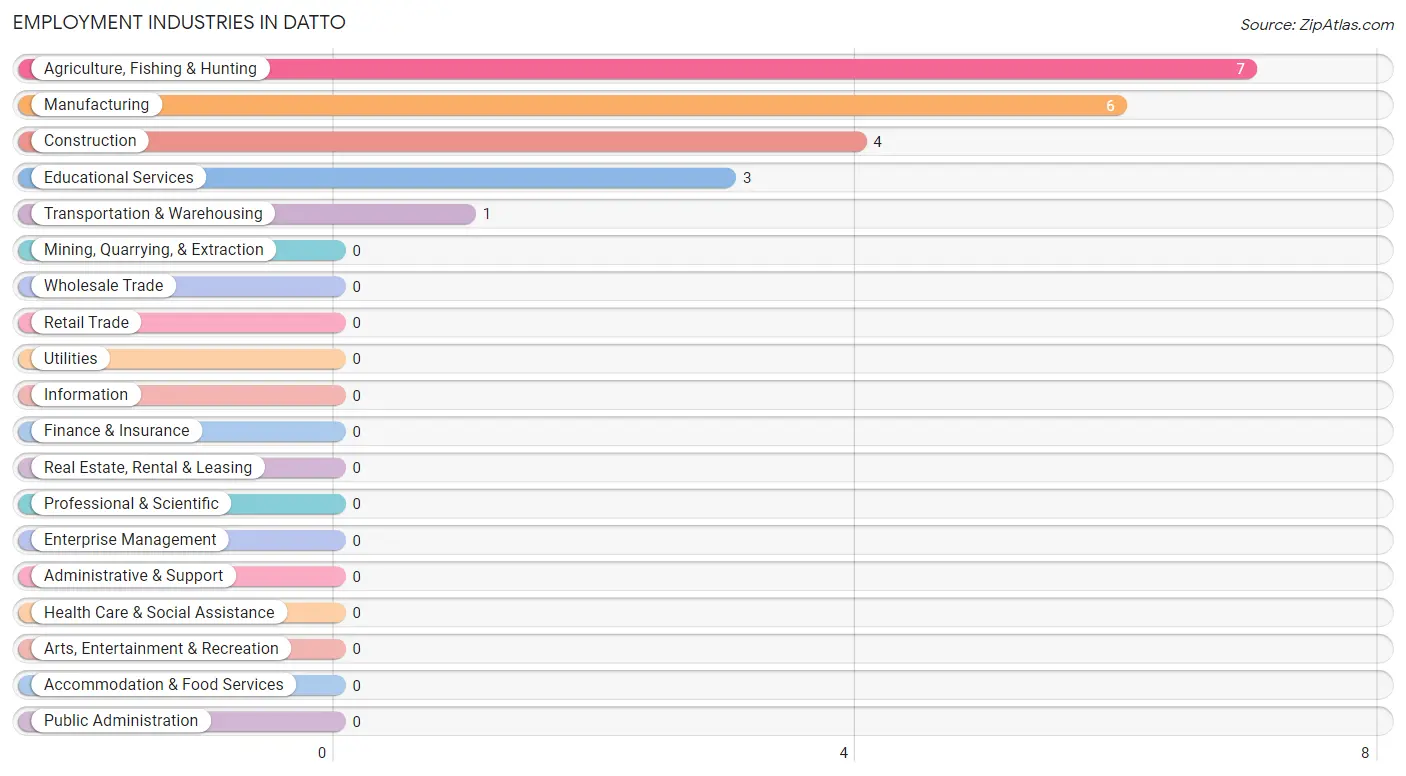
Employment Industries in Datto
The major employment industries in Datto include Agriculture, Fishing & Hunting (7 | 31.8%), Manufacturing (6 | 27.3%), Construction (4 | 18.2%), Educational Services (3 | 13.6%), and Transportation & Warehousing (1 | 4.5%).
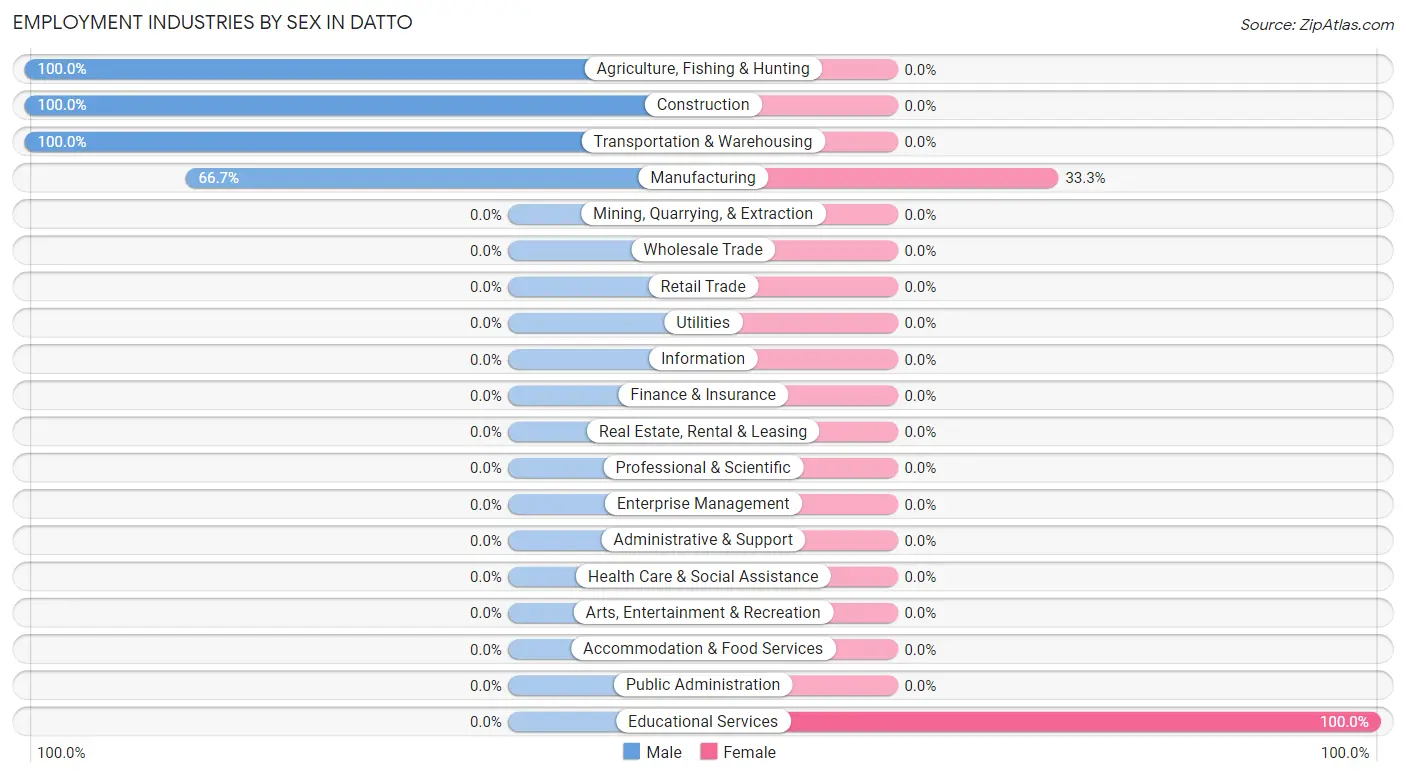
Employment Industries by Sex in Datto
The Datto industries that see more men than women are Agriculture, Fishing & Hunting (100.0%), Construction (100.0%), and Transportation & Warehousing (100.0%), whereas the industries that tend to have a higher number of women are Educational Services (100.0%), and Manufacturing (33.3%).
| Industry | Male | Female |
| Agriculture, Fishing & Hunting | 7 (100.0%) | 0 (0.0%) |
| Mining, Quarrying, & Extraction | 0 (0.0%) | 0 (0.0%) |
| Construction | 4 (100.0%) | 0 (0.0%) |
| Manufacturing | 4 (66.7%) | 2 (33.3%) |
| Wholesale Trade | 0 (0.0%) | 0 (0.0%) |
| Retail Trade | 0 (0.0%) | 0 (0.0%) |
| Transportation & Warehousing | 1 (100.0%) | 0 (0.0%) |
| Utilities | 0 (0.0%) | 0 (0.0%) |
| Information | 0 (0.0%) | 0 (0.0%) |
| Finance & Insurance | 0 (0.0%) | 0 (0.0%) |
| Real Estate, Rental & Leasing | 0 (0.0%) | 0 (0.0%) |
| Professional & Scientific | 0 (0.0%) | 0 (0.0%) |
| Enterprise Management | 0 (0.0%) | 0 (0.0%) |
| Administrative & Support | 0 (0.0%) | 0 (0.0%) |
| Educational Services | 0 (0.0%) | 3 (100.0%) |
| Health Care & Social Assistance | 0 (0.0%) | 0 (0.0%) |
| Arts, Entertainment & Recreation | 0 (0.0%) | 0 (0.0%) |
| Accommodation & Food Services | 0 (0.0%) | 0 (0.0%) |
| Public Administration | 0 (0.0%) | 0 (0.0%) |
| Total | 16 (72.7%) | 6 (27.3%) |
Education in Datto
School Enrollment in Datto
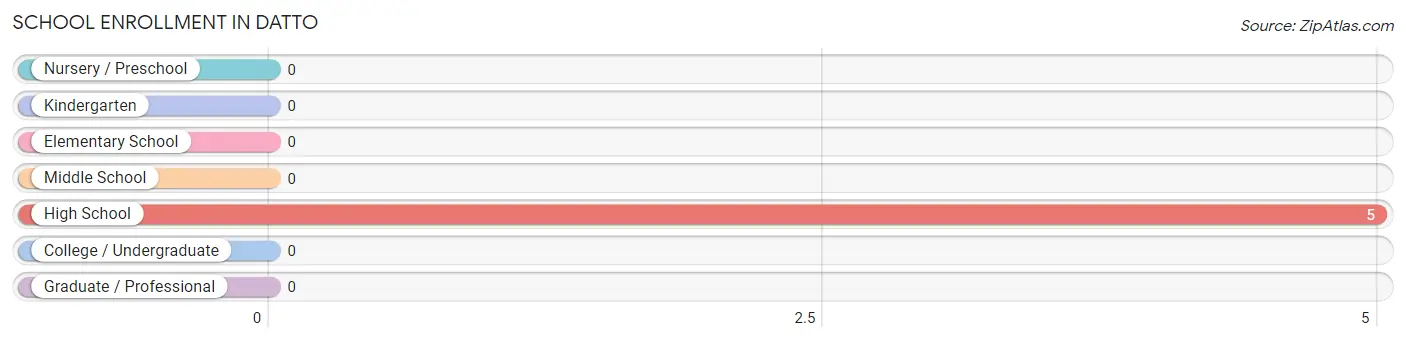
| School Level | # Students | % Students |
| Nursery / Preschool | 0 | 0.0% |
| Kindergarten | 0 | 0.0% |
| Elementary School | 0 | 0.0% |
| Middle School | 0 | 0.0% |
| High School | 5 | 100.0% |
| College / Undergraduate | 0 | 0.0% |
| Graduate / Professional | 0 | 0.0% |
| Total | 5 | 100.0% |
School Enrollment by Age by Funding Source in Datto
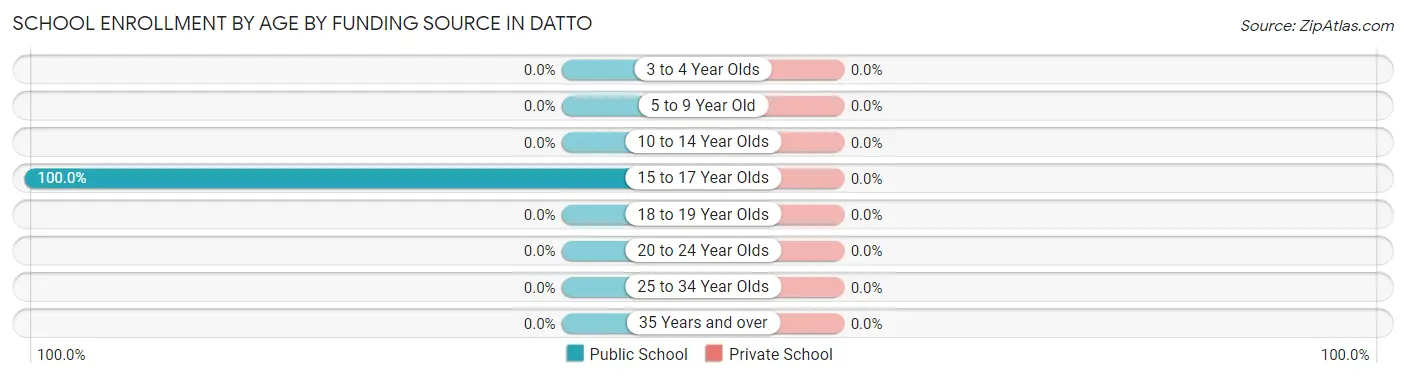
| Age Bracket | Public School | Private School |
| 3 to 4 Year Olds | 0 (0.0%) | 0 (0.0%) |
| 5 to 9 Year Old | 0 (0.0%) | 0 (0.0%) |
| 10 to 14 Year Olds | 0 (0.0%) | 0 (0.0%) |
| 15 to 17 Year Olds | 5 (100.0%) | 0 (0.0%) |
| 18 to 19 Year Olds | 0 (0.0%) | 0 (0.0%) |
| 20 to 24 Year Olds | 0 (0.0%) | 0 (0.0%) |
| 25 to 34 Year Olds | 0 (0.0%) | 0 (0.0%) |
| 35 Years and over | 0 (0.0%) | 0 (0.0%) |
| Total | 5 (100.0%) | 0 (0.0%) |
Educational Attainment by Field of Study in Datto
| Field of Study | # Graduates | % Graduates |
| Computers & Mathematics | 0 | 0.0% |
| Bio, Nature & Agricultural | 0 | 0.0% |
| Physical & Health Sciences | 0 | 0.0% |
| Psychology | 0 | 0.0% |
| Social Sciences | 0 | 0.0% |
| Engineering | 0 | 0.0% |
| Multidisciplinary Studies | 0 | 0.0% |
| Science & Technology | 0 | 0.0% |
| Business | 0 | 0.0% |
| Education | 0 | 0.0% |
| Literature & Languages | 0 | 0.0% |
| Liberal Arts & History | 0 | 0.0% |
| Visual & Performing Arts | 0 | 0.0% |
| Communications | 0 | 0.0% |
| Arts & Humanities | 0 | 0.0% |
| Total | 0 | 0.0% |
Transportation & Commute in Datto
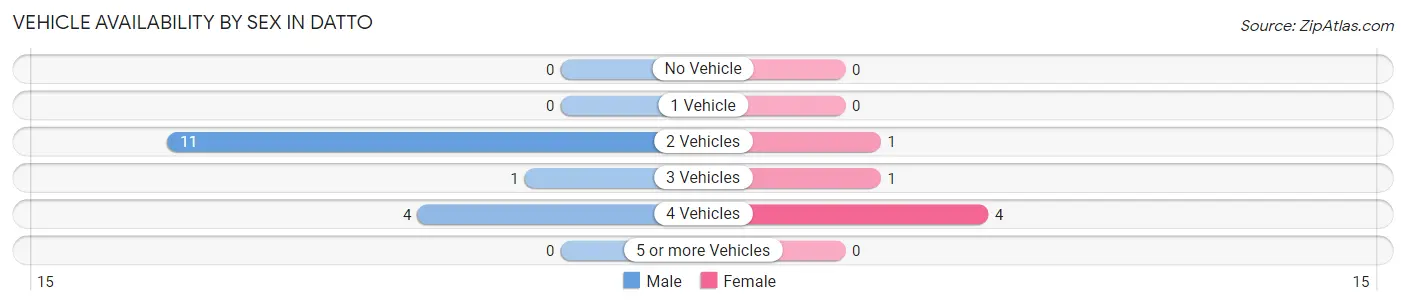
Vehicle Availability by Sex in Datto
The most prevalent vehicle ownership categories in Datto are males with 2 vehicles (11, accounting for 68.8%) and females with 2 vehicles (1, making up 183.3%).
| Vehicles Available | Male | Female |
| No Vehicle | 0 (0.0%) | 0 (0.0%) |
| 1 Vehicle | 0 (0.0%) | 0 (0.0%) |
| 2 Vehicles | 11 (68.8%) | 1 (16.7%) |
| 3 Vehicles | 1 (6.2%) | 1 (16.7%) |
| 4 Vehicles | 4 (25.0%) | 4 (66.7%) |
| 5 or more Vehicles | 0 (0.0%) | 0 (0.0%) |
| Total | 16 (100.0%) | 6 (100.0%) |
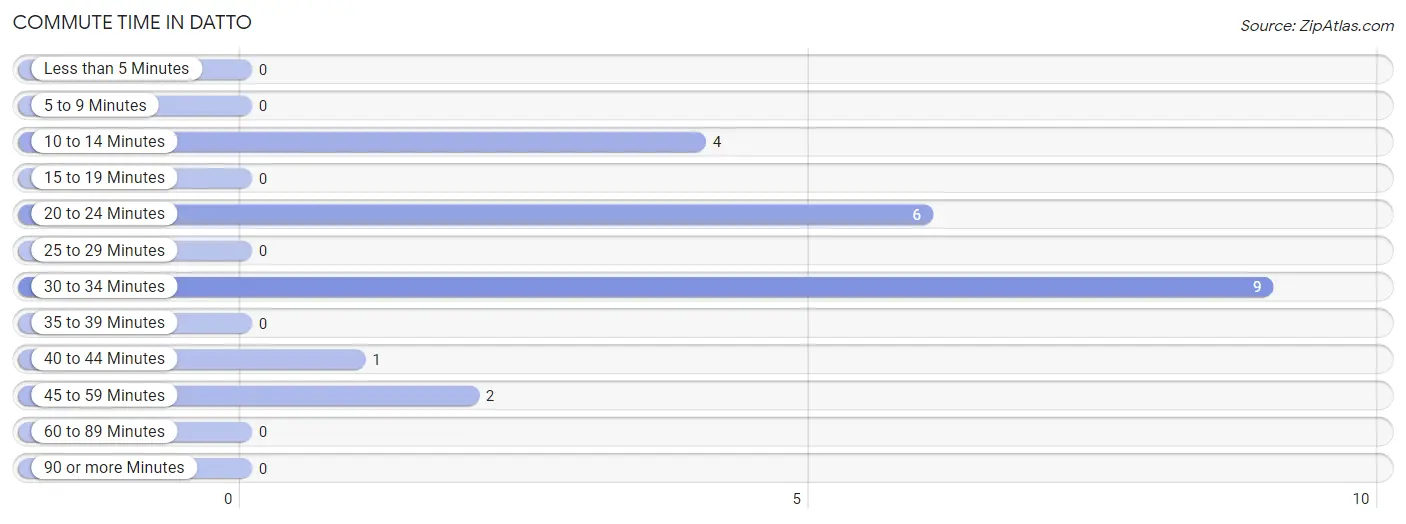
Commute Time in Datto
The most frequently occuring commute durations in Datto are 30 to 34 minutes (9 commuters, 40.9%), 20 to 24 minutes (6 commuters, 27.3%), and 10 to 14 minutes (4 commuters, 18.2%).
| Commute Time | # Commuters | % Commuters |
| Less than 5 Minutes | 0 | 0.0% |
| 5 to 9 Minutes | 0 | 0.0% |
| 10 to 14 Minutes | 4 | 18.2% |
| 15 to 19 Minutes | 0 | 0.0% |
| 20 to 24 Minutes | 6 | 27.3% |
| 25 to 29 Minutes | 0 | 0.0% |
| 30 to 34 Minutes | 9 | 40.9% |
| 35 to 39 Minutes | 0 | 0.0% |
| 40 to 44 Minutes | 1 | 4.5% |
| 45 to 59 Minutes | 2 | 9.1% |
| 60 to 89 Minutes | 0 | 0.0% |
| 90 or more Minutes | 0 | 0.0% |
Commute Time by Sex in Datto
The most common commute times in Datto are 30 to 34 minutes (8 commuters, 50.0%) for males and 10 to 14 minutes (4 commuters, 66.7%) for females.
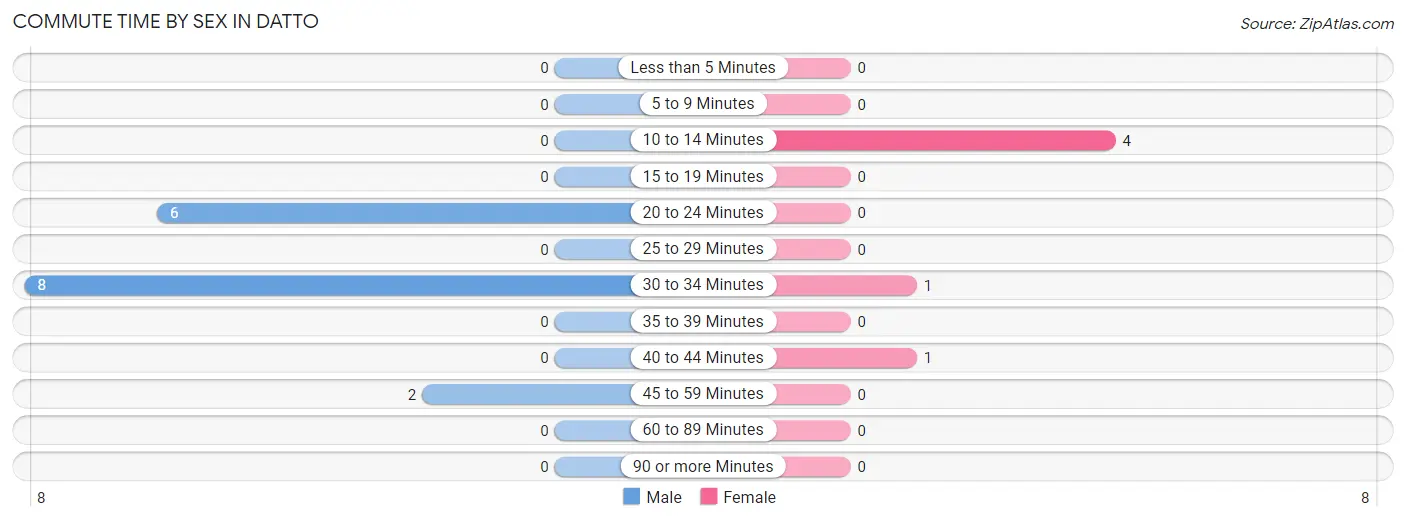
| Commute Time | Male | Female |
| Less than 5 Minutes | 0 (0.0%) | 0 (0.0%) |
| 5 to 9 Minutes | 0 (0.0%) | 0 (0.0%) |
| 10 to 14 Minutes | 0 (0.0%) | 4 (66.7%) |
| 15 to 19 Minutes | 0 (0.0%) | 0 (0.0%) |
| 20 to 24 Minutes | 6 (37.5%) | 0 (0.0%) |
| 25 to 29 Minutes | 0 (0.0%) | 0 (0.0%) |
| 30 to 34 Minutes | 8 (50.0%) | 1 (16.7%) |
| 35 to 39 Minutes | 0 (0.0%) | 0 (0.0%) |
| 40 to 44 Minutes | 0 (0.0%) | 1 (16.7%) |
| 45 to 59 Minutes | 2 (12.5%) | 0 (0.0%) |
| 60 to 89 Minutes | 0 (0.0%) | 0 (0.0%) |
| 90 or more Minutes | 0 (0.0%) | 0 (0.0%) |
Time of Departure to Work by Sex in Datto
The most frequent times of departure to work in Datto are 5:00 AM to 5:29 AM (9, 56.2%) for males and 5:00 AM to 5:29 AM (3, 50.0%) for females.
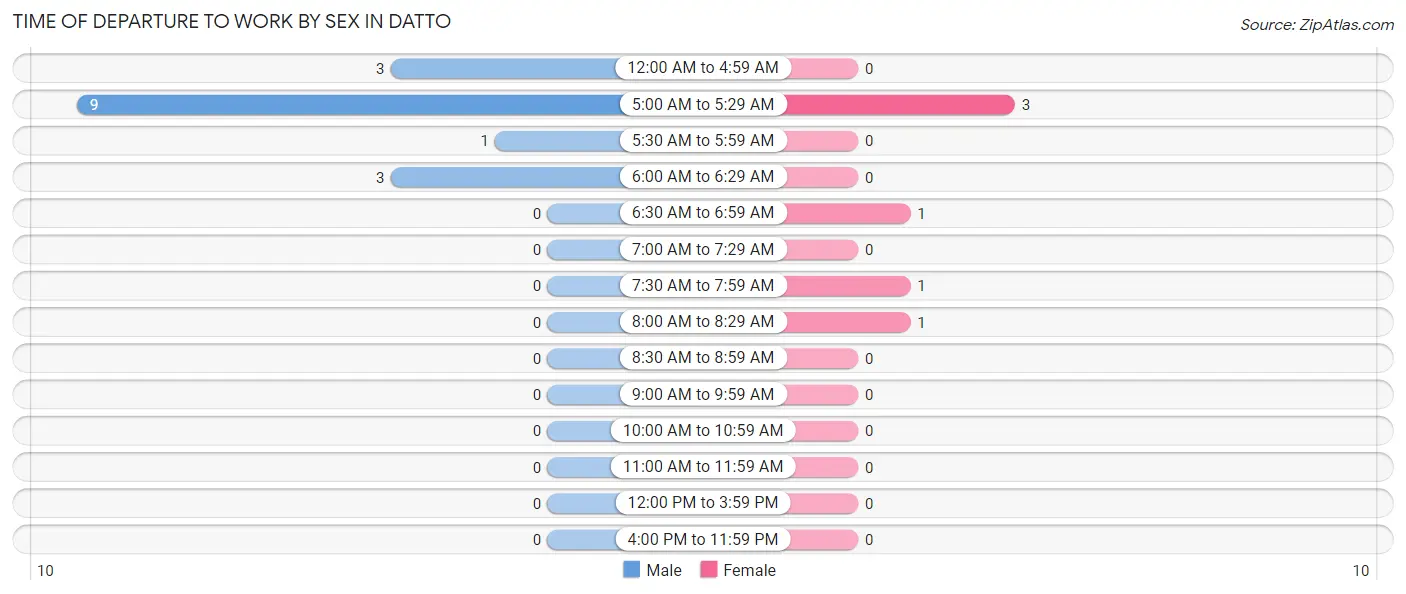
| Time of Departure | Male | Female |
| 12:00 AM to 4:59 AM | 3 (18.8%) | 0 (0.0%) |
| 5:00 AM to 5:29 AM | 9 (56.2%) | 3 (50.0%) |
| 5:30 AM to 5:59 AM | 1 (6.2%) | 0 (0.0%) |
| 6:00 AM to 6:29 AM | 3 (18.8%) | 0 (0.0%) |
| 6:30 AM to 6:59 AM | 0 (0.0%) | 1 (16.7%) |
| 7:00 AM to 7:29 AM | 0 (0.0%) | 0 (0.0%) |
| 7:30 AM to 7:59 AM | 0 (0.0%) | 1 (16.7%) |
| 8:00 AM to 8:29 AM | 0 (0.0%) | 1 (16.7%) |
| 8:30 AM to 8:59 AM | 0 (0.0%) | 0 (0.0%) |
| 9:00 AM to 9:59 AM | 0 (0.0%) | 0 (0.0%) |
| 10:00 AM to 10:59 AM | 0 (0.0%) | 0 (0.0%) |
| 11:00 AM to 11:59 AM | 0 (0.0%) | 0 (0.0%) |
| 12:00 PM to 3:59 PM | 0 (0.0%) | 0 (0.0%) |
| 4:00 PM to 11:59 PM | 0 (0.0%) | 0 (0.0%) |
| Total | 16 (100.0%) | 6 (100.0%) |
Housing Occupancy in Datto
Occupancy by Ownership in Datto
Of the total 27 dwellings in Datto, owner-occupied units account for 25 (92.6%), while renter-occupied units make up 2 (7.4%).
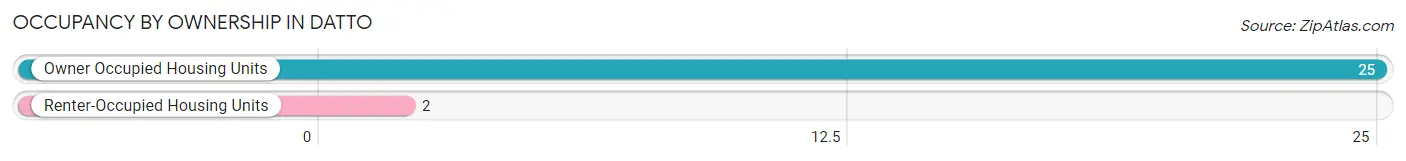
| Occupancy | # Housing Units | % Housing Units |
| Owner Occupied Housing Units | 25 | 92.6% |
| Renter-Occupied Housing Units | 2 | 7.4% |
| Total Occupied Housing Units | 27 | 100.0% |
Occupancy by Household Size in Datto
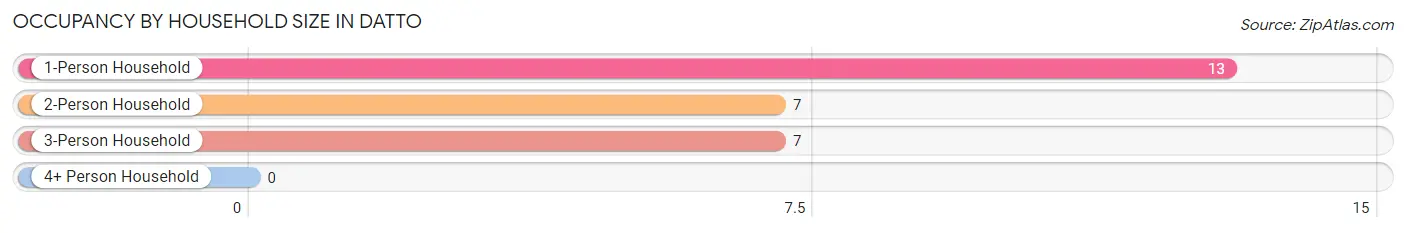
| Household Size | # Housing Units | % Housing Units |
| 1-Person Household | 13 | 48.1% |
| 2-Person Household | 7 | 25.9% |
| 3-Person Household | 7 | 25.9% |
| 4+ Person Household | 0 | 0.0% |
| Total Housing Units | 27 | 100.0% |
Occupancy by Ownership by Household Size in Datto
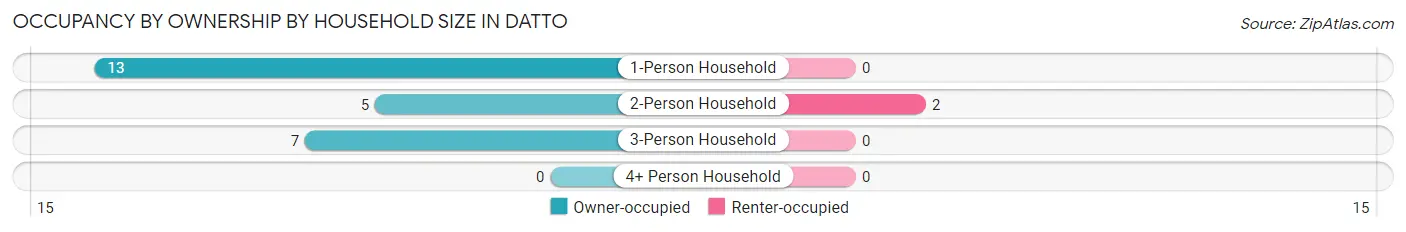
| Household Size | Owner-occupied | Renter-occupied |
| 1-Person Household | 13 (100.0%) | 0 (0.0%) |
| 2-Person Household | 5 (71.4%) | 2 (28.6%) |
| 3-Person Household | 7 (100.0%) | 0 (0.0%) |
| 4+ Person Household | 0 (0.0%) | 0 (0.0%) |
| Total Housing Units | 25 (92.6%) | 2 (7.4%) |
Occupancy by Educational Attainment in Datto
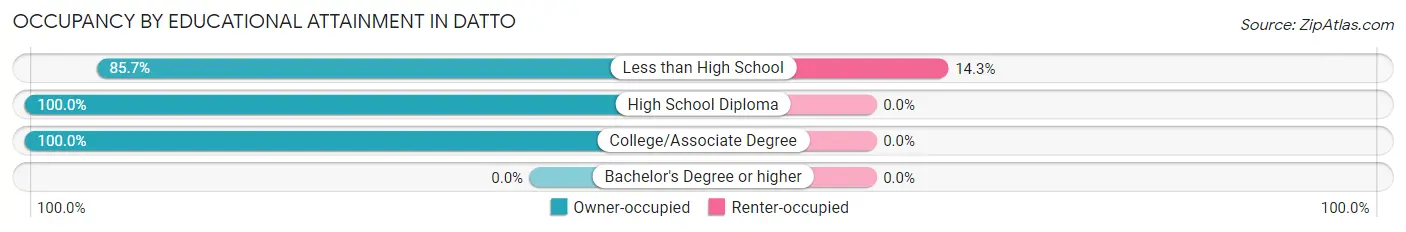
| Household Size | Owner-occupied | Renter-occupied |
| Less than High School | 12 (85.7%) | 2 (14.3%) |
| High School Diploma | 7 (100.0%) | 0 (0.0%) |
| College/Associate Degree | 6 (100.0%) | 0 (0.0%) |
| Bachelor's Degree or higher | 0 (0.0%) | 0 (0.0%) |
Occupancy by Age of Householder in Datto
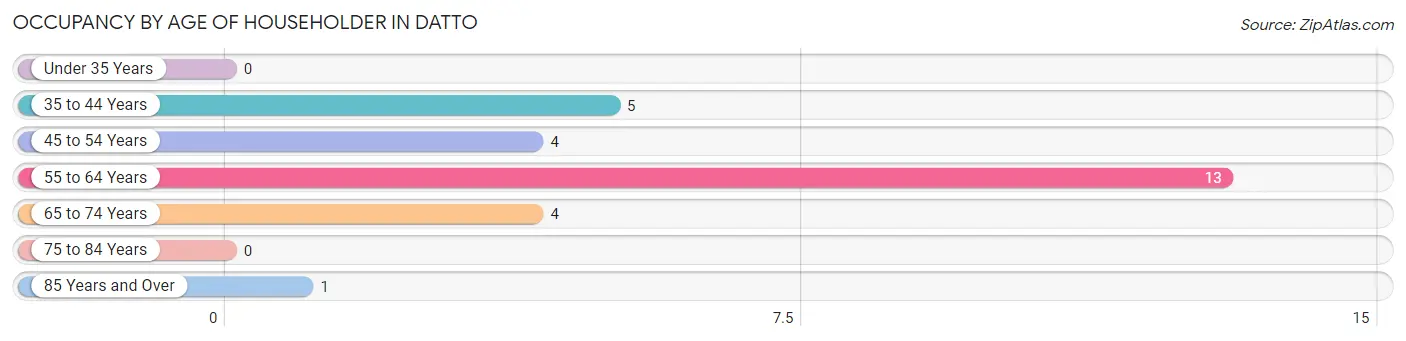
| Age Bracket | # Households | % Households |
| Under 35 Years | 0 | 0.0% |
| 35 to 44 Years | 5 | 18.5% |
| 45 to 54 Years | 4 | 14.8% |
| 55 to 64 Years | 13 | 48.1% |
| 65 to 74 Years | 4 | 14.8% |
| 75 to 84 Years | 0 | 0.0% |
| 85 Years and Over | 1 | 3.7% |
| Total | 27 | 100.0% |
Housing Finances in Datto
Median Income by Occupancy in Datto
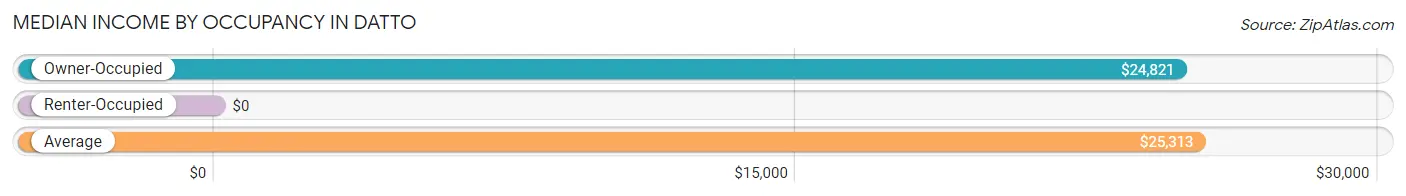
| Occupancy Type | # Households | Median Income |
| Owner-Occupied | 25 (92.6%) | $24,821 |
| Renter-Occupied | 2 (7.4%) | $0 |
| Average | 27 (100.0%) | $25,313 |
Occupancy by Householder Income Bracket in Datto
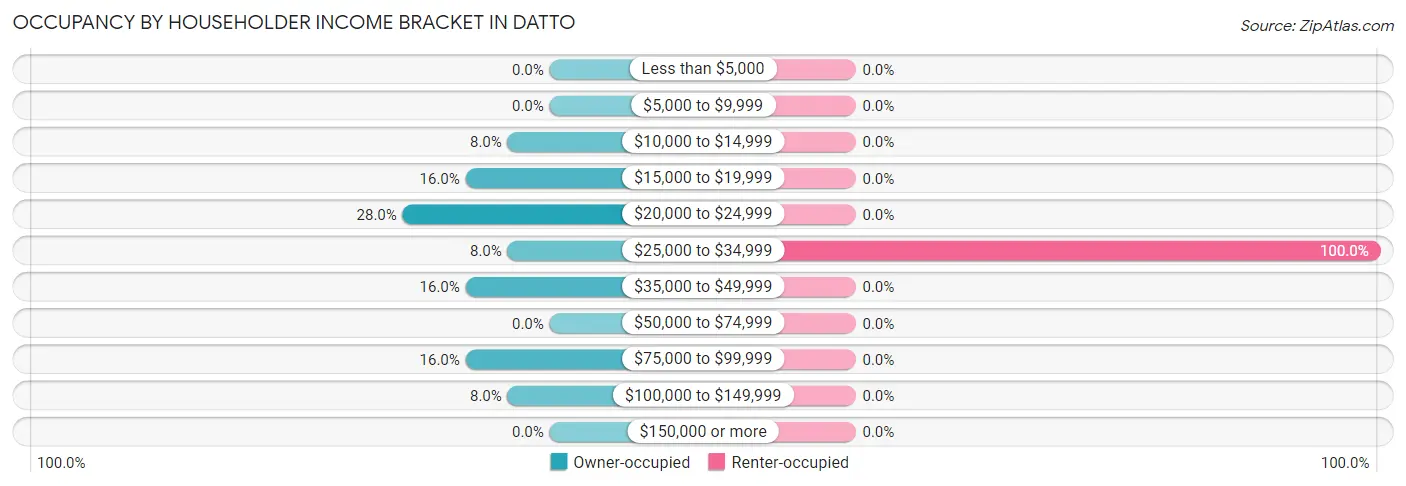
| Income Bracket | Owner-occupied | Renter-occupied |
| Less than $5,000 | 0 (0.0%) | 0 (0.0%) |
| $5,000 to $9,999 | 0 (0.0%) | 0 (0.0%) |
| $10,000 to $14,999 | 2 (8.0%) | 0 (0.0%) |
| $15,000 to $19,999 | 4 (16.0%) | 0 (0.0%) |
| $20,000 to $24,999 | 7 (28.0%) | 0 (0.0%) |
| $25,000 to $34,999 | 2 (8.0%) | 2 (100.0%) |
| $35,000 to $49,999 | 4 (16.0%) | 0 (0.0%) |
| $50,000 to $74,999 | 0 (0.0%) | 0 (0.0%) |
| $75,000 to $99,999 | 4 (16.0%) | 0 (0.0%) |
| $100,000 to $149,999 | 2 (8.0%) | 0 (0.0%) |
| $150,000 or more | 0 (0.0%) | 0 (0.0%) |
| Total | 25 (100.0%) | 2 (100.0%) |
Monthly Housing Cost Tiers in Datto
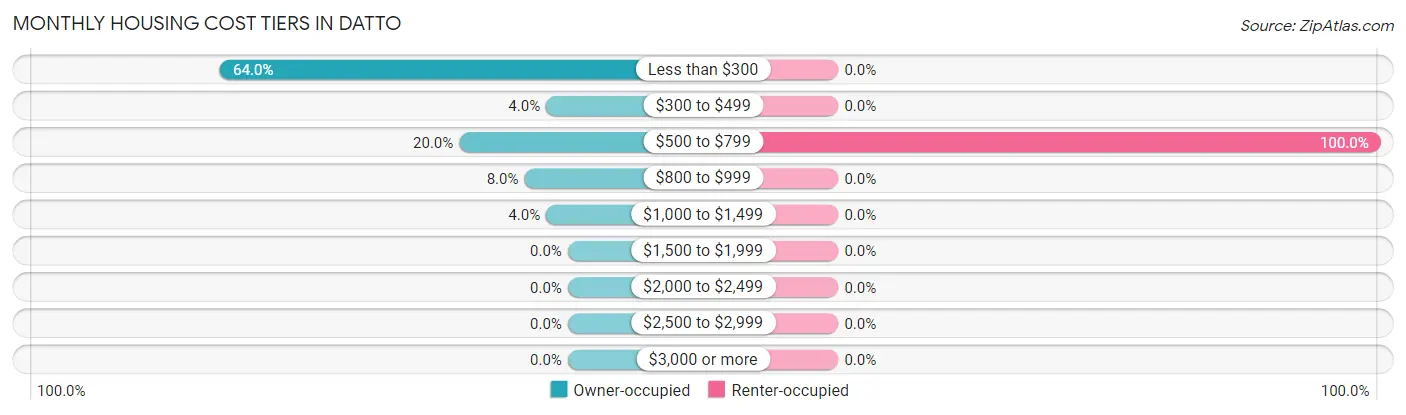
| Monthly Cost | Owner-occupied | Renter-occupied |
| Less than $300 | 16 (64.0%) | 0 (0.0%) |
| $300 to $499 | 1 (4.0%) | 0 (0.0%) |
| $500 to $799 | 5 (20.0%) | 2 (100.0%) |
| $800 to $999 | 2 (8.0%) | 0 (0.0%) |
| $1,000 to $1,499 | 1 (4.0%) | 0 (0.0%) |
| $1,500 to $1,999 | 0 (0.0%) | 0 (0.0%) |
| $2,000 to $2,499 | 0 (0.0%) | 0 (0.0%) |
| $2,500 to $2,999 | 0 (0.0%) | 0 (0.0%) |
| $3,000 or more | 0 (0.0%) | 0 (0.0%) |
| Total | 25 (100.0%) | 2 (100.0%) |
Physical Housing Characteristics in Datto
Housing Structures in Datto
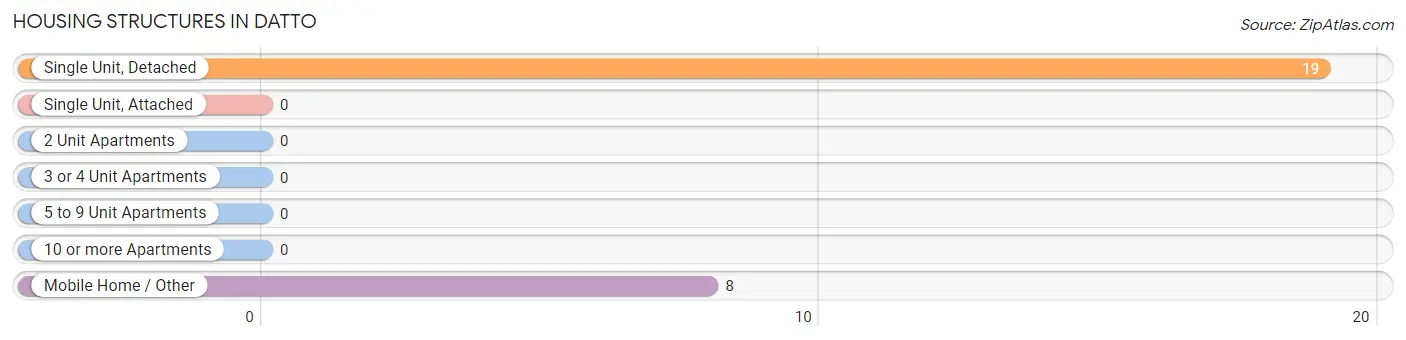
| Structure Type | # Housing Units | % Housing Units |
| Single Unit, Detached | 19 | 70.4% |
| Single Unit, Attached | 0 | 0.0% |
| 2 Unit Apartments | 0 | 0.0% |
| 3 or 4 Unit Apartments | 0 | 0.0% |
| 5 to 9 Unit Apartments | 0 | 0.0% |
| 10 or more Apartments | 0 | 0.0% |
| Mobile Home / Other | 8 | 29.6% |
| Total | 27 | 100.0% |
Housing Structures by Occupancy in Datto
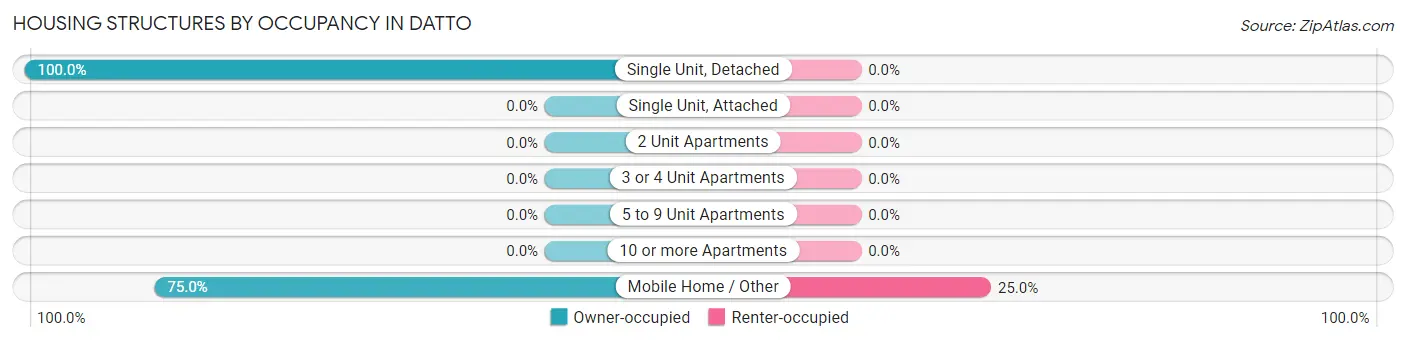
| Structure Type | Owner-occupied | Renter-occupied |
| Single Unit, Detached | 19 (100.0%) | 0 (0.0%) |
| Single Unit, Attached | 0 (0.0%) | 0 (0.0%) |
| 2 Unit Apartments | 0 (0.0%) | 0 (0.0%) |
| 3 or 4 Unit Apartments | 0 (0.0%) | 0 (0.0%) |
| 5 to 9 Unit Apartments | 0 (0.0%) | 0 (0.0%) |
| 10 or more Apartments | 0 (0.0%) | 0 (0.0%) |
| Mobile Home / Other | 6 (75.0%) | 2 (25.0%) |
| Total | 25 (92.6%) | 2 (7.4%) |
Housing Structures by Number of Rooms in Datto
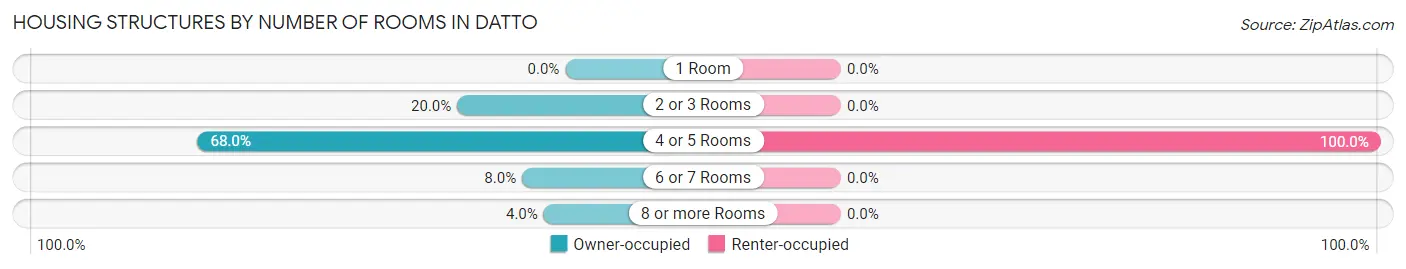
| Number of Rooms | Owner-occupied | Renter-occupied |
| 1 Room | 0 (0.0%) | 0 (0.0%) |
| 2 or 3 Rooms | 5 (20.0%) | 0 (0.0%) |
| 4 or 5 Rooms | 17 (68.0%) | 2 (100.0%) |
| 6 or 7 Rooms | 2 (8.0%) | 0 (0.0%) |
| 8 or more Rooms | 1 (4.0%) | 0 (0.0%) |
| Total | 25 (100.0%) | 2 (100.0%) |
Housing Structure by Heating Type in Datto
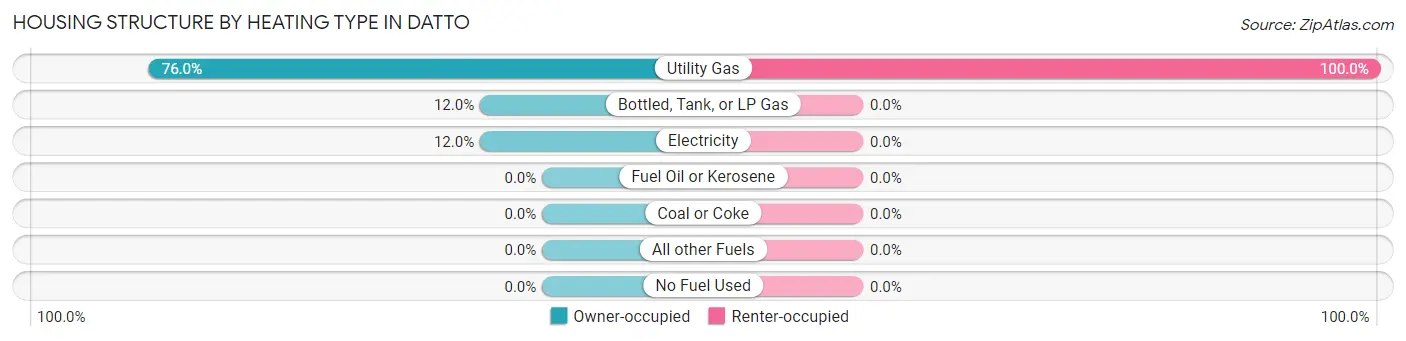
| Heating Type | Owner-occupied | Renter-occupied |
| Utility Gas | 19 (76.0%) | 2 (100.0%) |
| Bottled, Tank, or LP Gas | 3 (12.0%) | 0 (0.0%) |
| Electricity | 3 (12.0%) | 0 (0.0%) |
| Fuel Oil or Kerosene | 0 (0.0%) | 0 (0.0%) |
| Coal or Coke | 0 (0.0%) | 0 (0.0%) |
| All other Fuels | 0 (0.0%) | 0 (0.0%) |
| No Fuel Used | 0 (0.0%) | 0 (0.0%) |
| Total | 25 (100.0%) | 2 (100.0%) |
Household Vehicle Usage in Datto
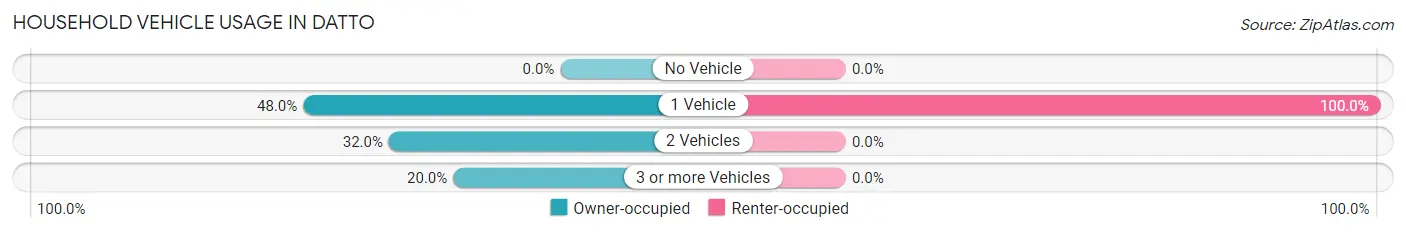
| Vehicles per Household | Owner-occupied | Renter-occupied |
| No Vehicle | 0 (0.0%) | 0 (0.0%) |
| 1 Vehicle | 12 (48.0%) | 2 (100.0%) |
| 2 Vehicles | 8 (32.0%) | 0 (0.0%) |
| 3 or more Vehicles | 5 (20.0%) | 0 (0.0%) |
| Total | 25 (100.0%) | 2 (100.0%) |
Real Estate & Mortgages in Datto
Real Estate and Mortgage Overview in Datto
| Characteristic | Without Mortgage | With Mortgage |
| Housing Units | 16 | 9 |
| Median Property Value | - | - |
| Median Household Income | $23,214 | $0 |
| Monthly Housing Costs | $158 | $0 |
| Real Estate Taxes | $199 | $1 |
Property Value by Mortgage Status in Datto
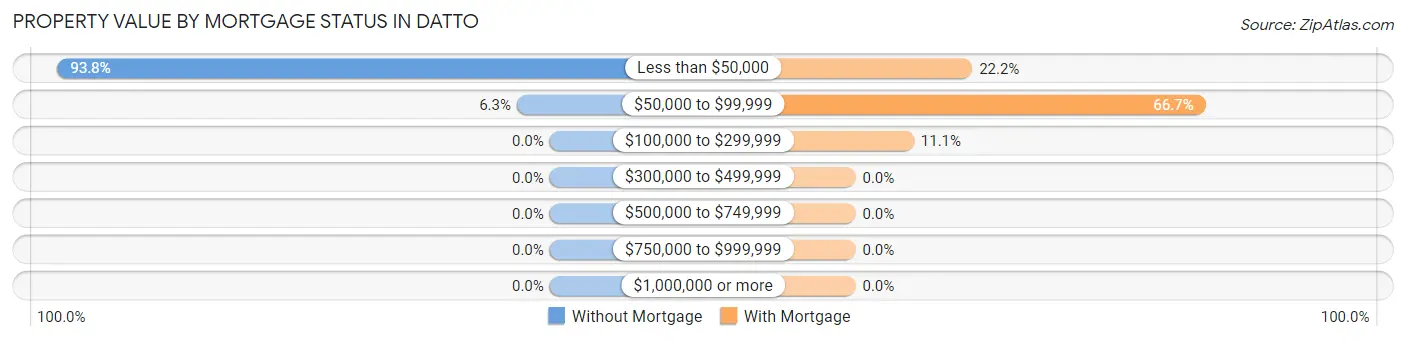
| Property Value | Without Mortgage | With Mortgage |
| Less than $50,000 | 15 (93.8%) | 2 (22.2%) |
| $50,000 to $99,999 | 1 (6.2%) | 6 (66.7%) |
| $100,000 to $299,999 | 0 (0.0%) | 1 (11.1%) |
| $300,000 to $499,999 | 0 (0.0%) | 0 (0.0%) |
| $500,000 to $749,999 | 0 (0.0%) | 0 (0.0%) |
| $750,000 to $999,999 | 0 (0.0%) | 0 (0.0%) |
| $1,000,000 or more | 0 (0.0%) | 0 (0.0%) |
| Total | 16 (100.0%) | 9 (100.0%) |
Household Income by Mortgage Status in Datto
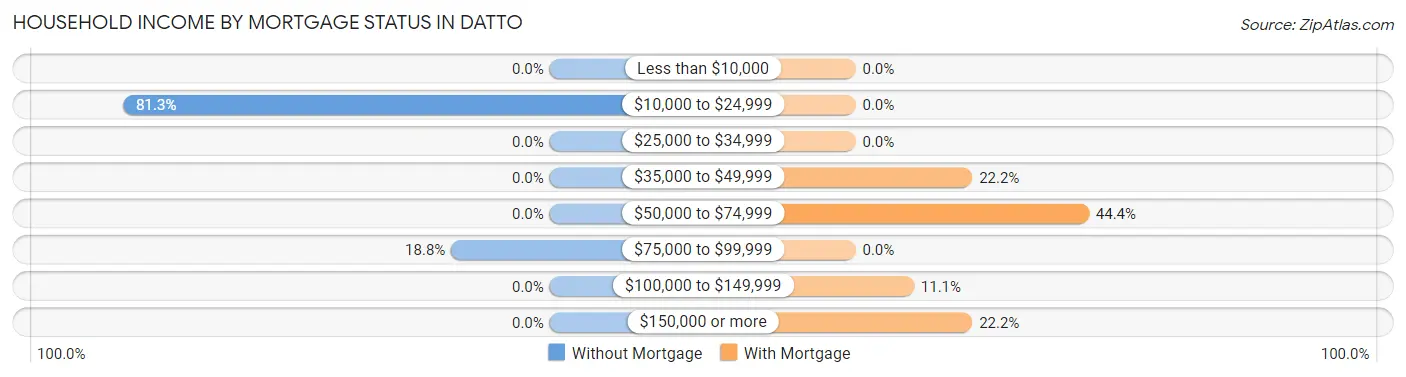
| Household Income | Without Mortgage | With Mortgage |
| Less than $10,000 | 0 (0.0%) | 0 (0.0%) |
| $10,000 to $24,999 | 13 (81.2%) | 0 (0.0%) |
| $25,000 to $34,999 | 0 (0.0%) | 0 (0.0%) |
| $35,000 to $49,999 | 0 (0.0%) | 2 (22.2%) |
| $50,000 to $74,999 | 0 (0.0%) | 4 (44.4%) |
| $75,000 to $99,999 | 3 (18.8%) | 0 (0.0%) |
| $100,000 to $149,999 | 0 (0.0%) | 1 (11.1%) |
| $150,000 or more | 0 (0.0%) | 2 (22.2%) |
| Total | 16 (100.0%) | 9 (100.0%) |
Property Value to Household Income Ratio in Datto
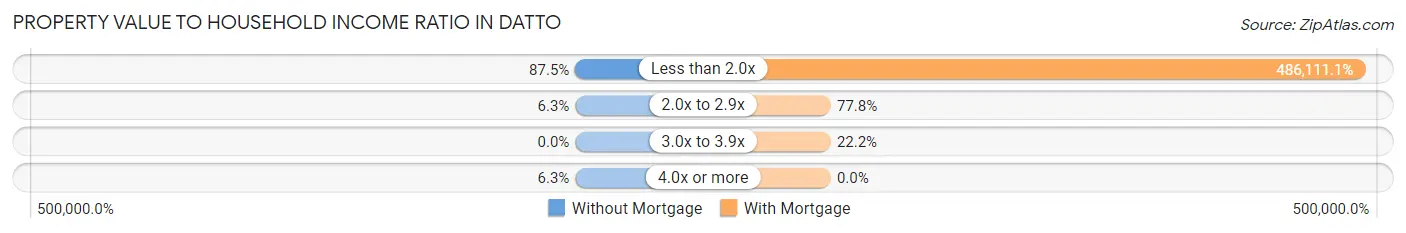
| Value-to-Income Ratio | Without Mortgage | With Mortgage |
| Less than 2.0x | 14 (87.5%) | 43,750 (486,111.1%) |
| 2.0x to 2.9x | 1 (6.2%) | 7 (77.8%) |
| 3.0x to 3.9x | 0 (0.0%) | 2 (22.2%) |
| 4.0x or more | 1 (6.2%) | 0 (0.0%) |
| Total | 16 (100.0%) | 9 (100.0%) |
Real Estate Taxes by Mortgage Status in Datto
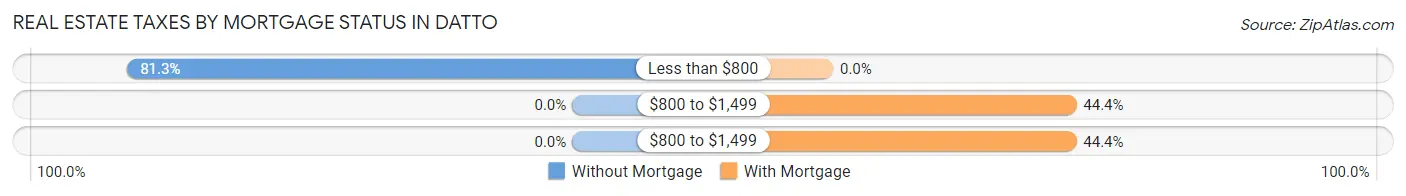
| Property Taxes | Without Mortgage | With Mortgage |
| Less than $800 | 13 (81.2%) | 0 (0.0%) |
| $800 to $1,499 | 0 (0.0%) | 4 (44.4%) |
| $800 to $1,499 | 0 (0.0%) | 4 (44.4%) |
| Total | 16 (100.0%) | 9 (100.0%) |
Health & Disability in Datto
Health Insurance Coverage by Age in Datto
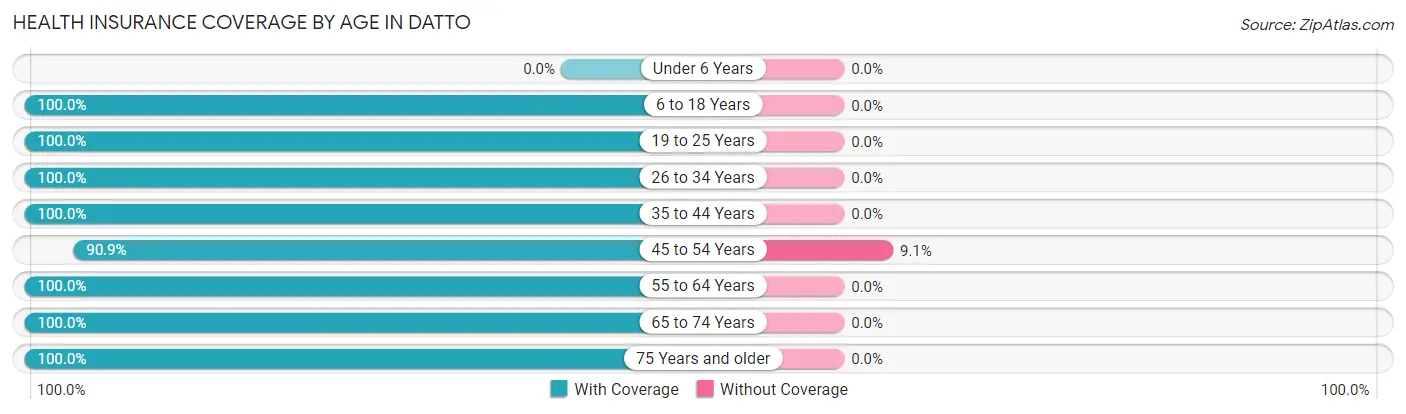
| Age Bracket | With Coverage | Without Coverage |
| Under 6 Years | 0 (0.0%) | 0 (0.0%) |
| 6 to 18 Years | 5 (100.0%) | 0 (0.0%) |
| 19 to 25 Years | 2 (100.0%) | 0 (0.0%) |
| 26 to 34 Years | 5 (100.0%) | 0 (0.0%) |
| 35 to 44 Years | 8 (100.0%) | 0 (0.0%) |
| 45 to 54 Years | 10 (90.9%) | 1 (9.1%) |
| 55 to 64 Years | 18 (100.0%) | 0 (0.0%) |
| 65 to 74 Years | 9 (100.0%) | 0 (0.0%) |
| 75 Years and older | 1 (100.0%) | 0 (0.0%) |
| Total | 58 (98.3%) | 1 (1.7%) |
Health Insurance Coverage by Citizenship Status in Datto
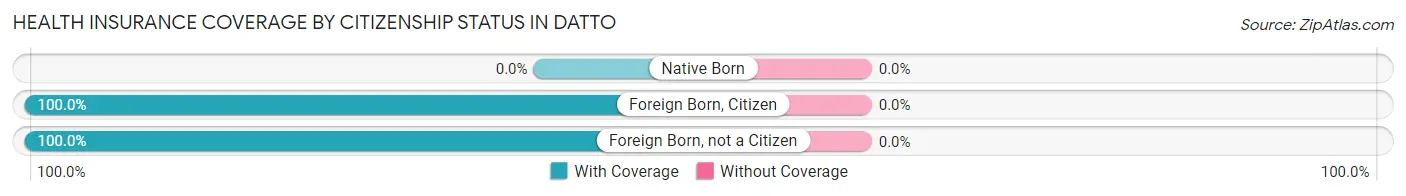
| Citizenship Status | With Coverage | Without Coverage |
| Native Born | 0 (0.0%) | 0 (0.0%) |
| Foreign Born, Citizen | 5 (100.0%) | 0 (0.0%) |
| Foreign Born, not a Citizen | 2 (100.0%) | 0 (0.0%) |
Health Insurance Coverage by Household Income in Datto
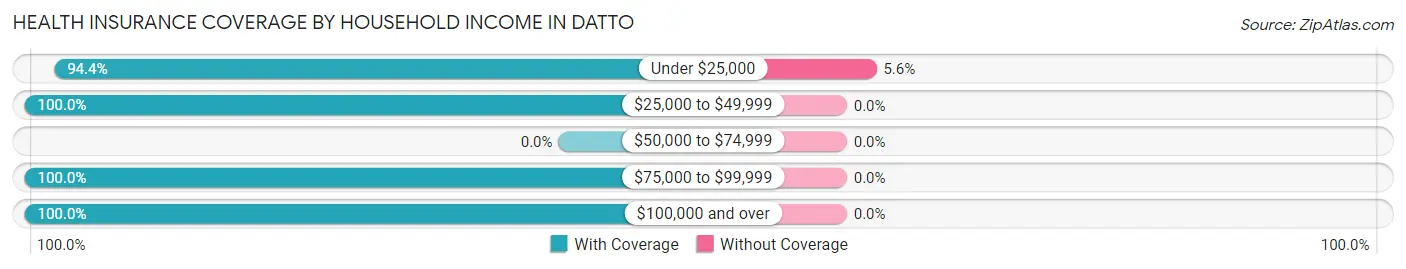
| Household Income | With Coverage | Without Coverage |
| Under $25,000 | 17 (94.4%) | 1 (5.6%) |
| $25,000 to $49,999 | 21 (100.0%) | 0 (0.0%) |
| $50,000 to $74,999 | 0 (0.0%) | 0 (0.0%) |
| $75,000 to $99,999 | 13 (100.0%) | 0 (0.0%) |
| $100,000 and over | 7 (100.0%) | 0 (0.0%) |
Public vs Private Health Insurance Coverage by Age in Datto
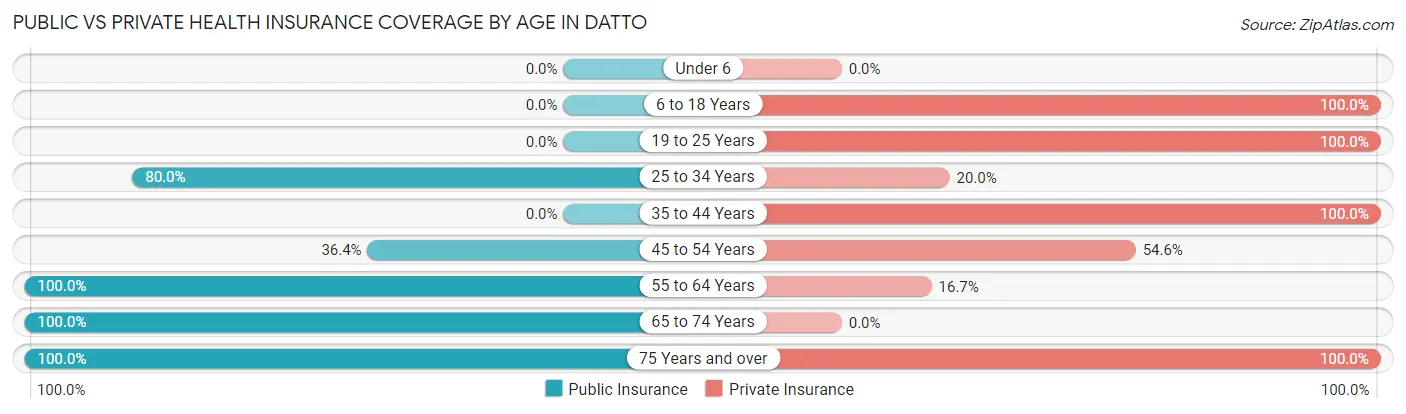
| Age Bracket | Public Insurance | Private Insurance |
| Under 6 | 0 (0.0%) | 0 (0.0%) |
| 6 to 18 Years | 0 (0.0%) | 5 (100.0%) |
| 19 to 25 Years | 0 (0.0%) | 2 (100.0%) |
| 25 to 34 Years | 4 (80.0%) | 1 (20.0%) |
| 35 to 44 Years | 0 (0.0%) | 8 (100.0%) |
| 45 to 54 Years | 4 (36.4%) | 6 (54.5%) |
| 55 to 64 Years | 18 (100.0%) | 3 (16.7%) |
| 65 to 74 Years | 9 (100.0%) | 0 (0.0%) |
| 75 Years and over | 1 (100.0%) | 1 (100.0%) |
| Total | 36 (61.0%) | 26 (44.1%) |
Disability Status by Sex by Age in Datto
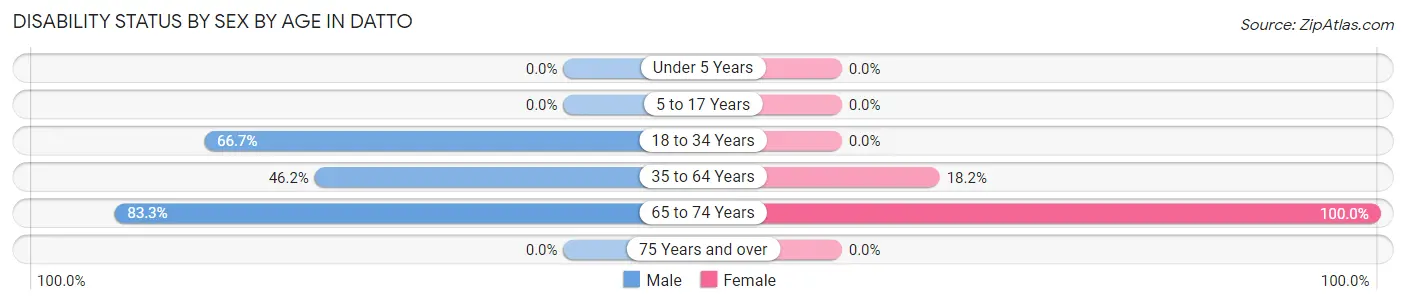
| Age Bracket | Male | Female |
| Under 5 Years | 0 (0.0%) | 0 (0.0%) |
| 5 to 17 Years | 0 (0.0%) | 0 (0.0%) |
| 18 to 34 Years | 4 (66.7%) | 0 (0.0%) |
| 35 to 64 Years | 12 (46.2%) | 2 (18.2%) |
| 65 to 74 Years | 5 (83.3%) | 3 (100.0%) |
| 75 Years and over | 0 (0.0%) | 0 (0.0%) |
Disability Class by Sex by Age in Datto
Disability Class: Hearing Difficulty
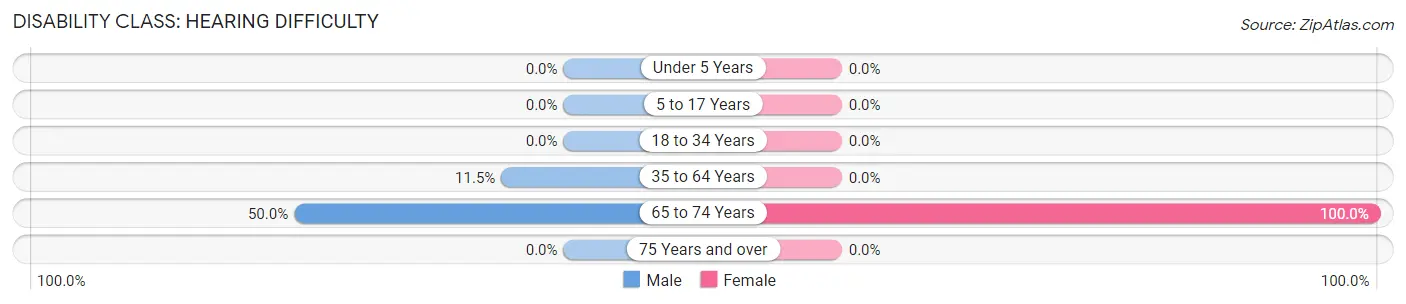
| Age Bracket | Male | Female |
| Under 5 Years | 0 (0.0%) | 0 (0.0%) |
| 5 to 17 Years | 0 (0.0%) | 0 (0.0%) |
| 18 to 34 Years | 0 (0.0%) | 0 (0.0%) |
| 35 to 64 Years | 3 (11.5%) | 0 (0.0%) |
| 65 to 74 Years | 3 (50.0%) | 3 (100.0%) |
| 75 Years and over | 0 (0.0%) | 0 (0.0%) |
Disability Class: Vision Difficulty
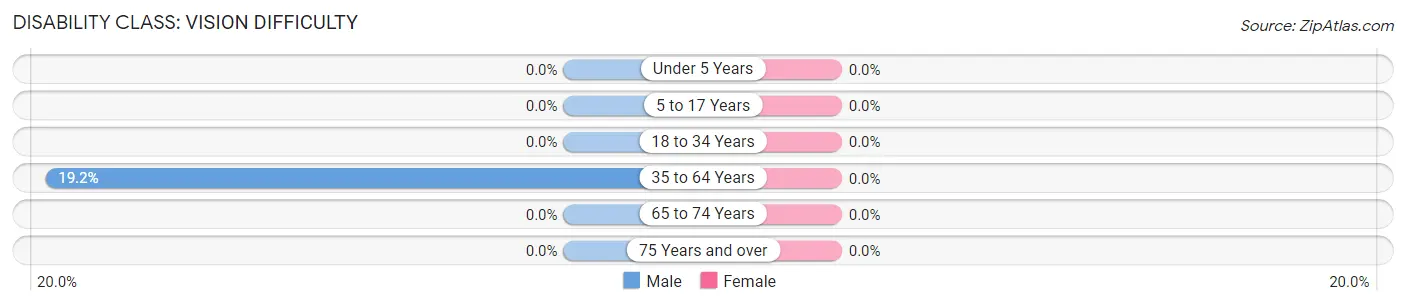
| Age Bracket | Male | Female |
| Under 5 Years | 0 (0.0%) | 0 (0.0%) |
| 5 to 17 Years | 0 (0.0%) | 0 (0.0%) |
| 18 to 34 Years | 0 (0.0%) | 0 (0.0%) |
| 35 to 64 Years | 5 (19.2%) | 0 (0.0%) |
| 65 to 74 Years | 0 (0.0%) | 0 (0.0%) |
| 75 Years and over | 0 (0.0%) | 0 (0.0%) |
Disability Class: Cognitive Difficulty
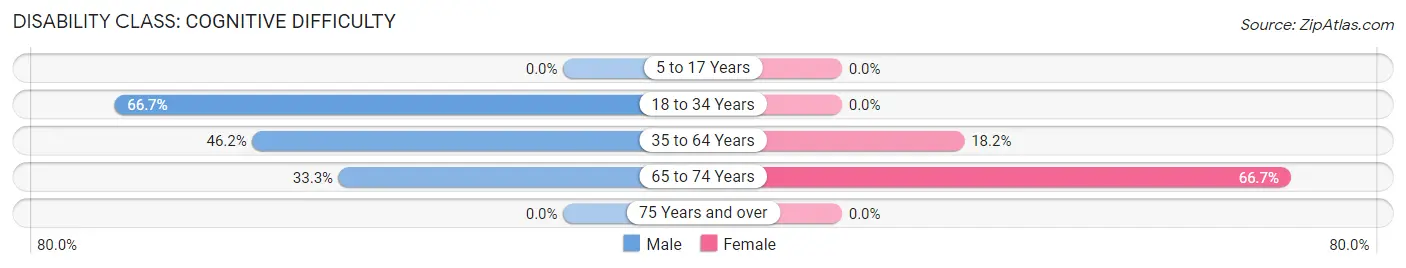
| Age Bracket | Male | Female |
| 5 to 17 Years | 0 (0.0%) | 0 (0.0%) |
| 18 to 34 Years | 4 (66.7%) | 0 (0.0%) |
| 35 to 64 Years | 12 (46.2%) | 2 (18.2%) |
| 65 to 74 Years | 2 (33.3%) | 2 (66.7%) |
| 75 Years and over | 0 (0.0%) | 0 (0.0%) |
Disability Class: Ambulatory Difficulty
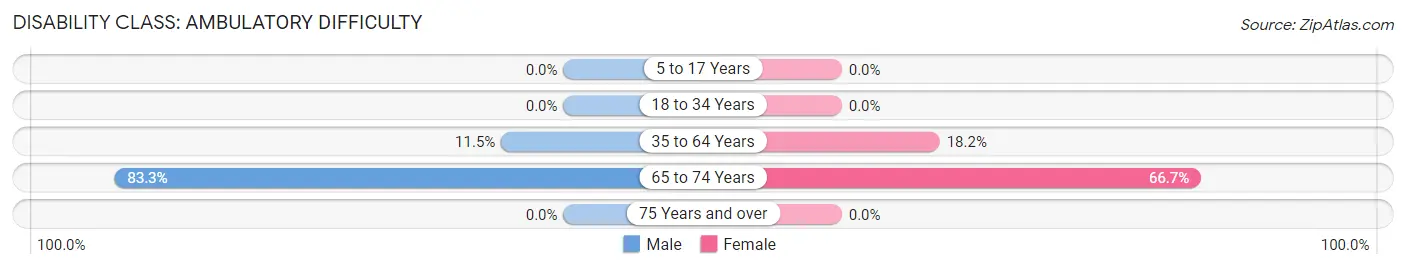
| Age Bracket | Male | Female |
| 5 to 17 Years | 0 (0.0%) | 0 (0.0%) |
| 18 to 34 Years | 0 (0.0%) | 0 (0.0%) |
| 35 to 64 Years | 3 (11.5%) | 2 (18.2%) |
| 65 to 74 Years | 5 (83.3%) | 2 (66.7%) |
| 75 Years and over | 0 (0.0%) | 0 (0.0%) |
Disability Class: Self-Care Difficulty
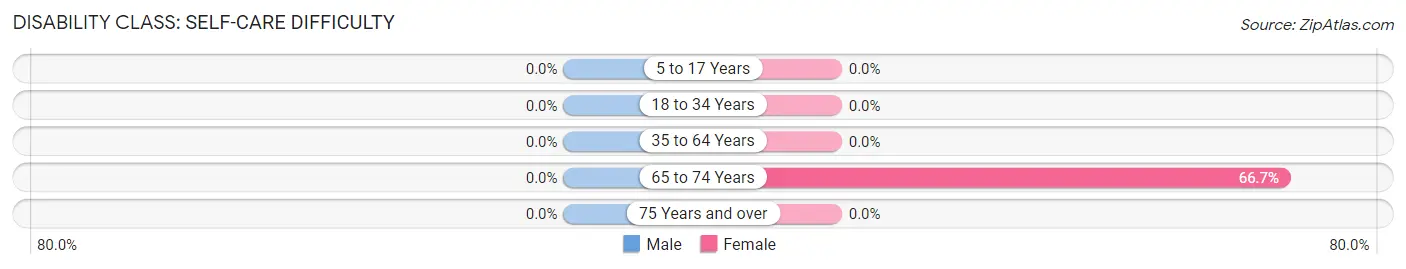
| Age Bracket | Male | Female |
| 5 to 17 Years | 0 (0.0%) | 0 (0.0%) |
| 18 to 34 Years | 0 (0.0%) | 0 (0.0%) |
| 35 to 64 Years | 0 (0.0%) | 0 (0.0%) |
| 65 to 74 Years | 0 (0.0%) | 2 (66.7%) |
| 75 Years and over | 0 (0.0%) | 0 (0.0%) |
Technology Access in Datto
Computing Device Access in Datto
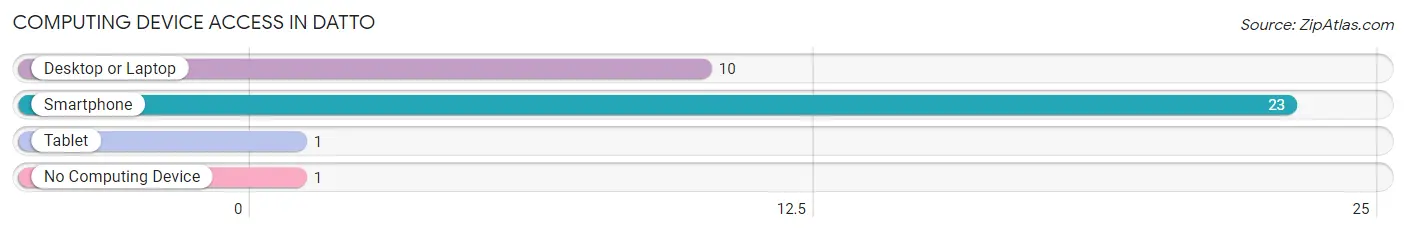
| Device Type | # Households | % Households |
| Desktop or Laptop | 10 | 37.0% |
| Smartphone | 23 | 85.2% |
| Tablet | 1 | 3.7% |
| No Computing Device | 1 | 3.7% |
| Total | 27 | 100.0% |
Internet Access in Datto
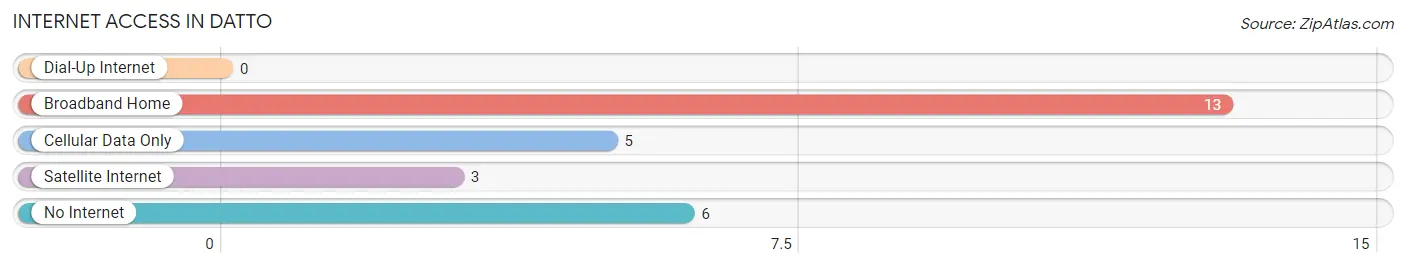
| Internet Type | # Households | % Households |
| Dial-Up Internet | 0 | 0.0% |
| Broadband Home | 13 | 48.1% |
| Cellular Data Only | 5 | 18.5% |
| Satellite Internet | 3 | 11.1% |
| No Internet | 6 | 22.2% |
| Total | 27 | 100.0% |
Datto Summary
AR History
Arkansas is a state located in the Southern United States. It is bordered by Missouri to the north, Tennessee and Mississippi to the east, Louisiana to the south, and Texas and Oklahoma to the west. Arkansas was admitted to the Union as the 25th state on June 15, 1836.
The first inhabitants of Arkansas were Native American tribes, including the Caddo, Osage, Quapaw, and Cherokee. The first Europeans to explore the area were the Spanish in the 16th century. The French established the first permanent settlement in Arkansas in 1686. The French and Spanish both had a significant influence on the culture and history of Arkansas.
In 1803, the United States acquired Arkansas as part of the Louisiana Purchase. Arkansas was initially part of the Missouri Territory, but it was later organized as the Territory of Arkansas in 1819. Arkansas became a state in 1836, and it was the first state to be formed from the Louisiana Purchase.
During the Civil War, Arkansas was a Confederate state. The state was the site of several battles, including the Battle of Pea Ridge and the Battle of Prairie Grove. After the war, Arkansas was readmitted to the Union in 1868.
In the late 19th century, Arkansas experienced a period of economic growth and development. The state was a major producer of cotton, timber, and other agricultural products. The state also experienced a period of industrialization, with the development of railroads and other infrastructure.
In the 20th century, Arkansas experienced a period of political and social change. The state was the site of the Little Rock Nine, a group of African-American students who were the first to attend a previously all-white high school in 1957. In the 1960s, Arkansas was the site of the civil rights movement, with protests and demonstrations against segregation.
Geography
Arkansas is located in the south-central United States. It is bordered by Missouri to the north, Tennessee and Mississippi to the east, Louisiana to the south, and Texas and Oklahoma to the west. Arkansas is the 29th largest state in the United States, with an area of 53,179 square miles.
The landscape of Arkansas is diverse, with mountains, hills, valleys, and plains. The Ozark Mountains are located in the northwest corner of the state, while the Ouachita Mountains are located in the southwest. The Arkansas River flows through the center of the state, and the Mississippi River forms the eastern border.
Economy
Arkansas has a diverse economy, with a mix of agriculture, manufacturing, and services. The state is a major producer of cotton, rice, soybeans, and other agricultural products. The state is also a major producer of timber and other forest products.
Manufacturing is an important part of the Arkansas economy. The state is a major producer of automobiles, chemicals, and food products. The state is also a major producer of steel and other metals.
The service sector is an important part of the Arkansas economy. The state is home to a number of universities and colleges, as well as a number of hospitals and other healthcare facilities. Tourism is also an important part of the Arkansas economy, with visitors coming to the state to enjoy its natural beauty and outdoor activities.
Demographics
As of 2019, Arkansas had an estimated population of 3,017,804. The state has a population density of 56.3 people per square mile. The largest city in Arkansas is Little Rock, with an estimated population of 197,312.
The racial makeup of Arkansas is 73.2% White, 15.4% Black or African American, 0.8% Native American, 1.7% Asian, 0.1% Pacific Islander, 5.3% from other races, and 3.5% from two or more races. The state has a large Hispanic or Latino population, with 10.3% of the population identifying as Hispanic or Latino.
The median household income in Arkansas is $45,869, and the median per capita income is $25,845. The state has a poverty rate of 17.2%. The largest industries in Arkansas are manufacturing, healthcare, and retail trade.
Common Questions
What is Per Capita Income in Datto?
Per Capita income in Datto is $20,190.
What is the Median Household income in Datto?
Median Household Income in Datto is $25,313.
What is Inequality or Gini Index in Datto?
Inequality or Gini Index in Datto is 0.37.
What is the Total Population of Datto?
Total Population of Datto is 59.
What is the Total Male Population of Datto?
Total Male Population of Datto is 38.
What is the Total Female Population of Datto?
Total Female Population of Datto is 21.
What is the Ratio of Males per 100 Females in Datto?
There are 180.95 Males per 100 Females in Datto.
What is the Ratio of Females per 100 Males in Datto?
There are 55.26 Females per 100 Males in Datto.
What is the Median Population Age in Datto?
Median Population Age in Datto is 51.9 Years.
What is the Average Family Size in Datto
Average Family Size in Datto is 3.1 People.
What is the Average Household Size in Datto
Average Household Size in Datto is 2.2 People.
How Large is the Labor Force in Datto?
There are 23 People in the Labor Forcein in Datto.
What is the Percentage of People in the Labor Force in Datto?
39.0% of People are in the Labor Force in Datto.
What is the Unemployment Rate in Datto?
Unemployment Rate in Datto is 4.3%.