Cash, AR Map & Demographics
Cash Map
Cash Overview
$15,299
PER CAPITA INCOME
$27,163
AVG FAMILY INCOME
$27,130
AVG HOUSEHOLD INCOME
41.7%
WAGE / INCOME GAP [ % ]
58.3¢/ $1
WAGE / INCOME GAP [ $ ]
0.43
INEQUALITY / GINI INDEX
285
TOTAL POPULATION
151
MALE POPULATION
134
FEMALE POPULATION
112.69
MALES / 100 FEMALES
88.74
FEMALES / 100 MALES
34.2
MEDIAN AGE
3.6
AVG FAMILY SIZE
2.9
AVG HOUSEHOLD SIZE
97
LABOR FORCE [ PEOPLE ]
47.8%
PERCENT IN LABOR FORCE
4.1%
UNEMPLOYMENT RATE
Cash Zip Codes
Cash Area Codes
Income in Cash
Income Overview in Cash
Per Capita Income in Cash is $15,299, while median incomes of families and households are $27,163 and $27,130 respectively.
| Characteristic | Number | Measure |
| Per Capita Income | 285 | $15,299 |
| Median Family Income | 69 | $27,163 |
| Mean Family Income | 69 | $52,283 |
| Median Household Income | 98 | $27,130 |
| Mean Household Income | 98 | $45,866 |
| Income Deficit | 69 | $0 |
| Wage / Income Gap (%) | 285 | 41.74% |
| Wage / Income Gap ($) | 285 | 58.26¢ per $1 |
| Gini / Inequality Index | 285 | 0.43 |
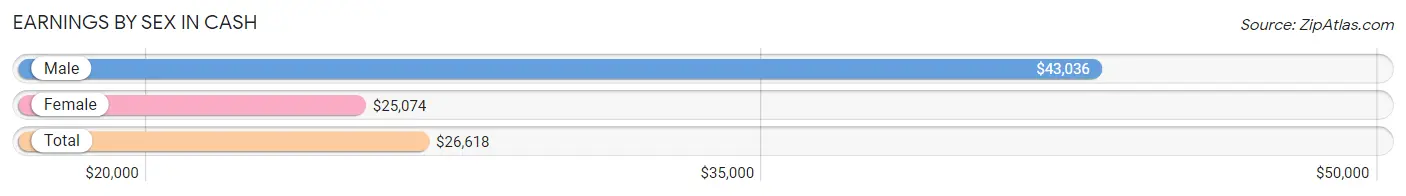
Earnings by Sex in Cash
Average Earnings in Cash are $26,618, $43,036 for men and $25,074 for women, a difference of 41.7%.
| Sex | Number | Average Earnings |
| Male | 51 (50.0%) | $43,036 |
| Female | 51 (50.0%) | $25,074 |
| Total | 102 (100.0%) | $26,618 |
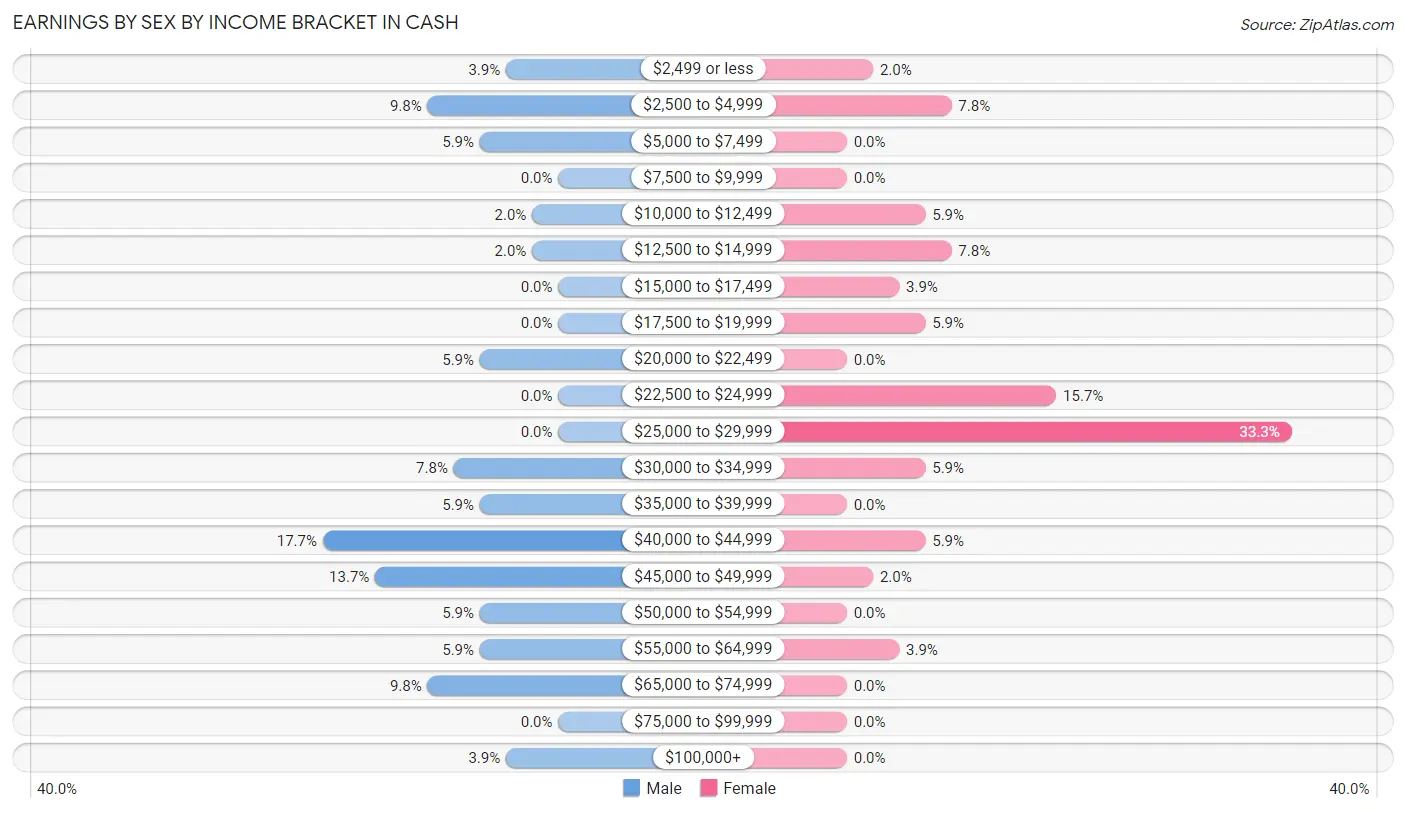
Earnings by Sex by Income Bracket in Cash
The most common earnings brackets in Cash are $40,000 to $44,999 for men (9 | 17.6%) and $25,000 to $29,999 for women (17 | 33.3%).
| Income | Male | Female |
| $2,499 or less | 2 (3.9%) | 1 (2.0%) |
| $2,500 to $4,999 | 5 (9.8%) | 4 (7.8%) |
| $5,000 to $7,499 | 3 (5.9%) | 0 (0.0%) |
| $7,500 to $9,999 | 0 (0.0%) | 0 (0.0%) |
| $10,000 to $12,499 | 1 (2.0%) | 3 (5.9%) |
| $12,500 to $14,999 | 1 (2.0%) | 4 (7.8%) |
| $15,000 to $17,499 | 0 (0.0%) | 2 (3.9%) |
| $17,500 to $19,999 | 0 (0.0%) | 3 (5.9%) |
| $20,000 to $22,499 | 3 (5.9%) | 0 (0.0%) |
| $22,500 to $24,999 | 0 (0.0%) | 8 (15.7%) |
| $25,000 to $29,999 | 0 (0.0%) | 17 (33.3%) |
| $30,000 to $34,999 | 4 (7.8%) | 3 (5.9%) |
| $35,000 to $39,999 | 3 (5.9%) | 0 (0.0%) |
| $40,000 to $44,999 | 9 (17.6%) | 3 (5.9%) |
| $45,000 to $49,999 | 7 (13.7%) | 1 (2.0%) |
| $50,000 to $54,999 | 3 (5.9%) | 0 (0.0%) |
| $55,000 to $64,999 | 3 (5.9%) | 2 (3.9%) |
| $65,000 to $74,999 | 5 (9.8%) | 0 (0.0%) |
| $75,000 to $99,999 | 0 (0.0%) | 0 (0.0%) |
| $100,000+ | 2 (3.9%) | 0 (0.0%) |
| Total | 51 (100.0%) | 51 (100.0%) |
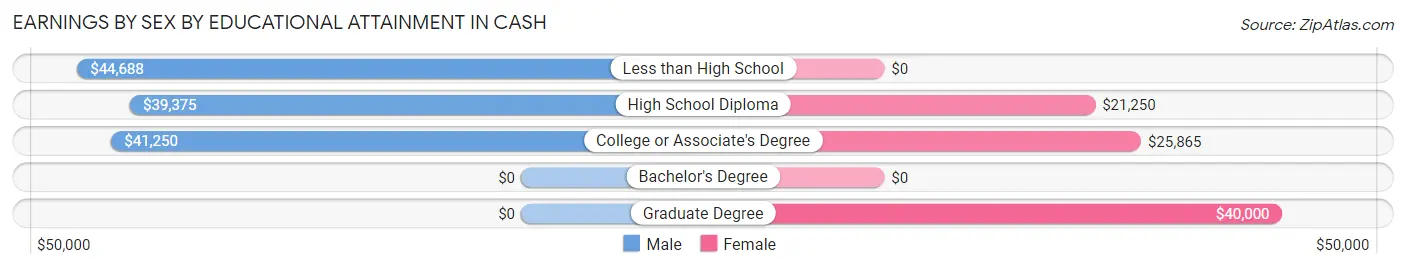
Earnings by Sex by Educational Attainment in Cash
Average earnings in Cash are $43,214 for men and $25,368 for women, a difference of 41.3%. Men with an educational attainment of less than high school enjoy the highest average annual earnings of $44,688, while those with high school diploma education earn the least with $39,375. Women with an educational attainment of graduate degree earn the most with the average annual earnings of $40,000, while those with high school diploma education have the smallest earnings of $21,250.
| Educational Attainment | Male Income | Female Income |
| Less than High School | $44,688 | $0 |
| High School Diploma | $39,375 | $21,250 |
| College or Associate's Degree | $41,250 | $25,865 |
| Bachelor's Degree | - | - |
| Graduate Degree | - | - |
| Total | $43,214 | $25,368 |
Family Income in Cash
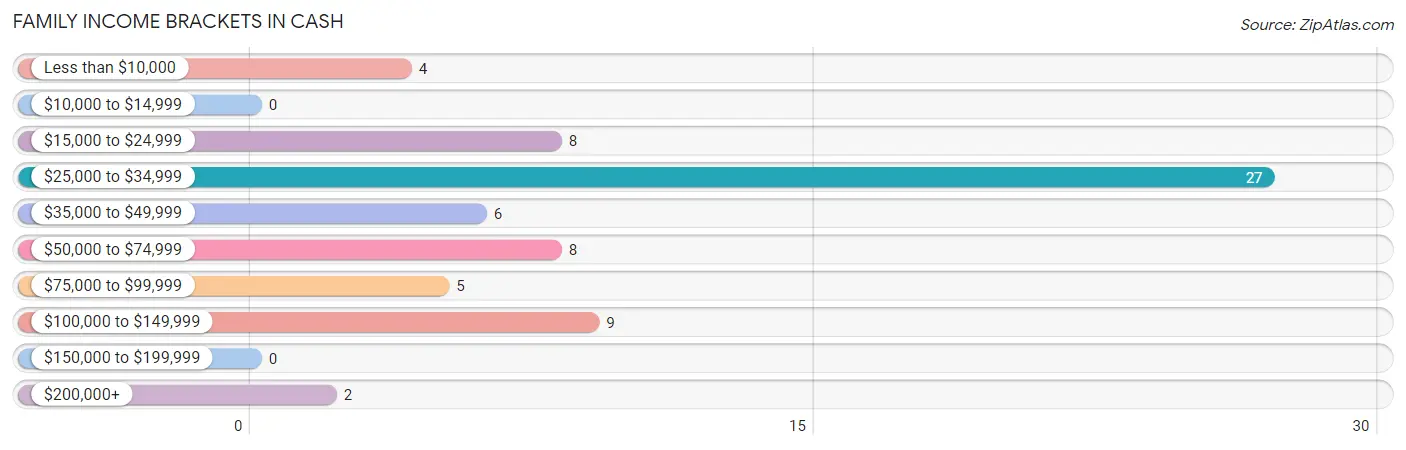
Family Income Brackets in Cash
According to the Cash family income data, there are 27 families falling into the $25,000 to $34,999 income range, which is the most common income bracket and makes up 39.1% of all families.
| Income Bracket | # Families | % Families |
| Less than $10,000 | 4 | 5.8% |
| $10,000 to $14,999 | 0 | 0.0% |
| $15,000 to $24,999 | 8 | 11.6% |
| $25,000 to $34,999 | 27 | 39.1% |
| $35,000 to $49,999 | 6 | 8.7% |
| $50,000 to $74,999 | 8 | 11.6% |
| $75,000 to $99,999 | 5 | 7.2% |
| $100,000 to $149,999 | 9 | 13.0% |
| $150,000 to $199,999 | 0 | 0.0% |
| $200,000+ | 2 | 2.9% |
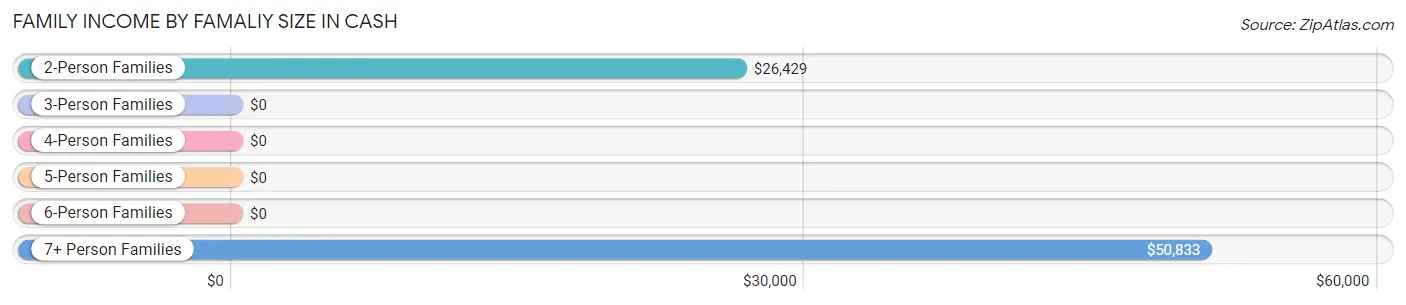
Family Income by Famaliy Size in Cash
7+ person families (6 | 8.7%) account for the highest median family income in Cash with $50,833 per family, while 2-person families (22 | 31.9%) have the highest median income of $13,214 per family member.
| Income Bracket | # Families | Median Income |
| 2-Person Families | 22 (31.9%) | $26,429 |
| 3-Person Families | 9 (13.0%) | $0 |
| 4-Person Families | 25 (36.2%) | $0 |
| 5-Person Families | 7 (10.1%) | $0 |
| 6-Person Families | 0 (0.0%) | $0 |
| 7+ Person Families | 6 (8.7%) | $50,833 |
| Total | 69 (100.0%) | $27,163 |
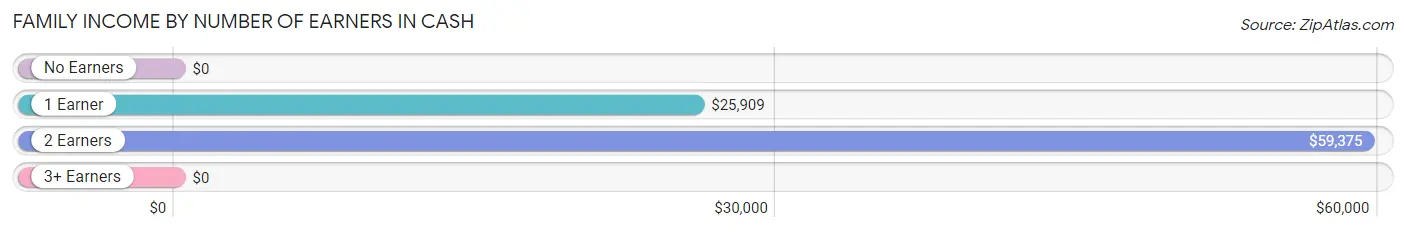
Family Income by Number of Earners in Cash
| Number of Earners | # Families | Median Income |
| No Earners | 11 (15.9%) | $0 |
| 1 Earner | 32 (46.4%) | $25,909 |
| 2 Earners | 21 (30.4%) | $59,375 |
| 3+ Earners | 5 (7.2%) | $0 |
| Total | 69 (100.0%) | $27,163 |
Household Income in Cash
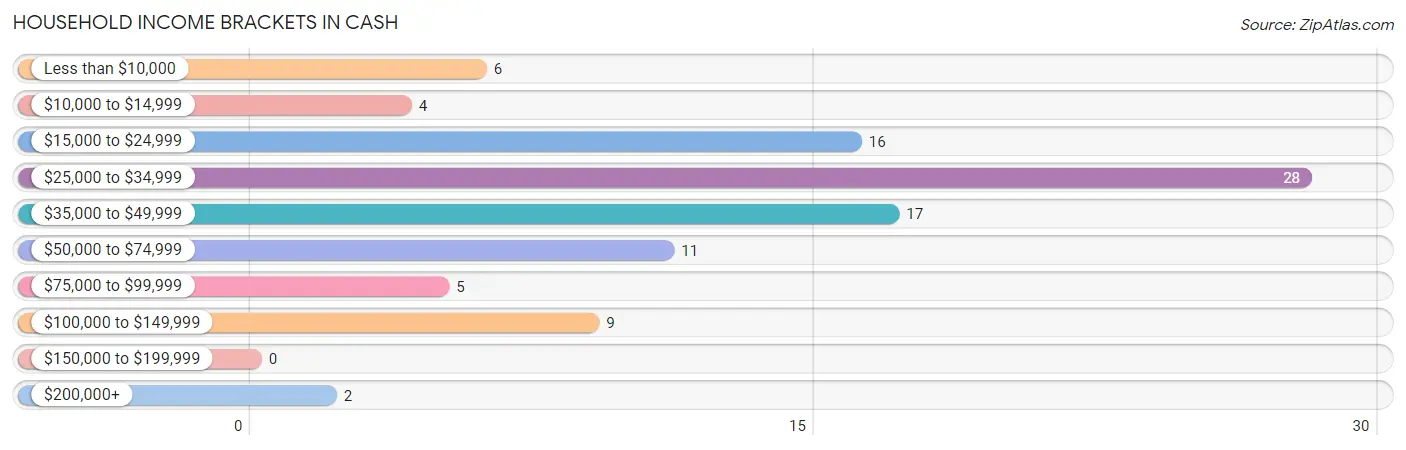
Household Income Brackets in Cash
With 28 households falling in the category, the $25,000 to $34,999 income range is the most frequent in Cash, accounting for 28.6% of all households.
| Income Bracket | # Households | % Households |
| Less than $10,000 | 6 | 6.1% |
| $10,000 to $14,999 | 4 | 4.1% |
| $15,000 to $24,999 | 16 | 16.3% |
| $25,000 to $34,999 | 28 | 28.6% |
| $35,000 to $49,999 | 17 | 17.3% |
| $50,000 to $74,999 | 11 | 11.2% |
| $75,000 to $99,999 | 5 | 5.1% |
| $100,000 to $149,999 | 9 | 9.2% |
| $150,000 to $199,999 | 0 | 0.0% |
| $200,000+ | 2 | 2.0% |
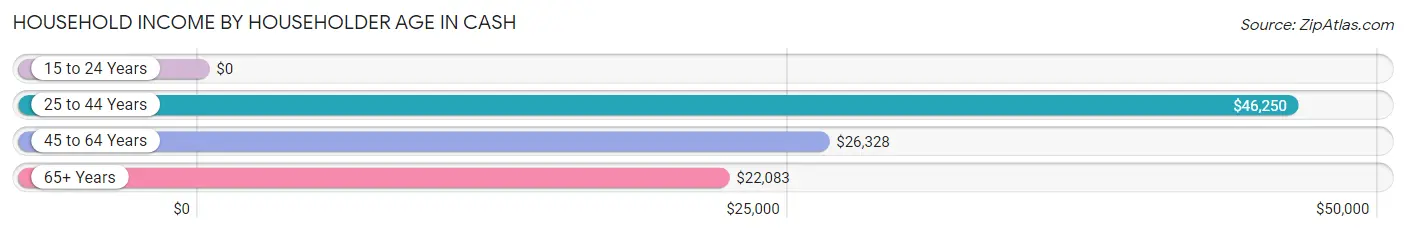
Household Income by Householder Age in Cash
The median household income in Cash is $27,130, with the highest median household income of $46,250 found in the 25 to 44 years age bracket for the primary householder. A total of 41 households (41.8%) fall into this category.
| Income Bracket | # Households | Median Income |
| 15 to 24 Years | 0 (0.0%) | $0 |
| 25 to 44 Years | 41 (41.8%) | $46,250 |
| 45 to 64 Years | 31 (31.6%) | $26,328 |
| 65+ Years | 26 (26.5%) | $22,083 |
| Total | 98 (100.0%) | $27,130 |
Poverty in Cash
Income Below Poverty by Sex and Age in Cash
With 51.0% poverty level for males and 35.3% for females among the residents of Cash, 15 year old males and 5 year old females are the most vulnerable to poverty, with 6 males (100.0%) and 1 females (100.0%) in their respective age groups living below the poverty level.
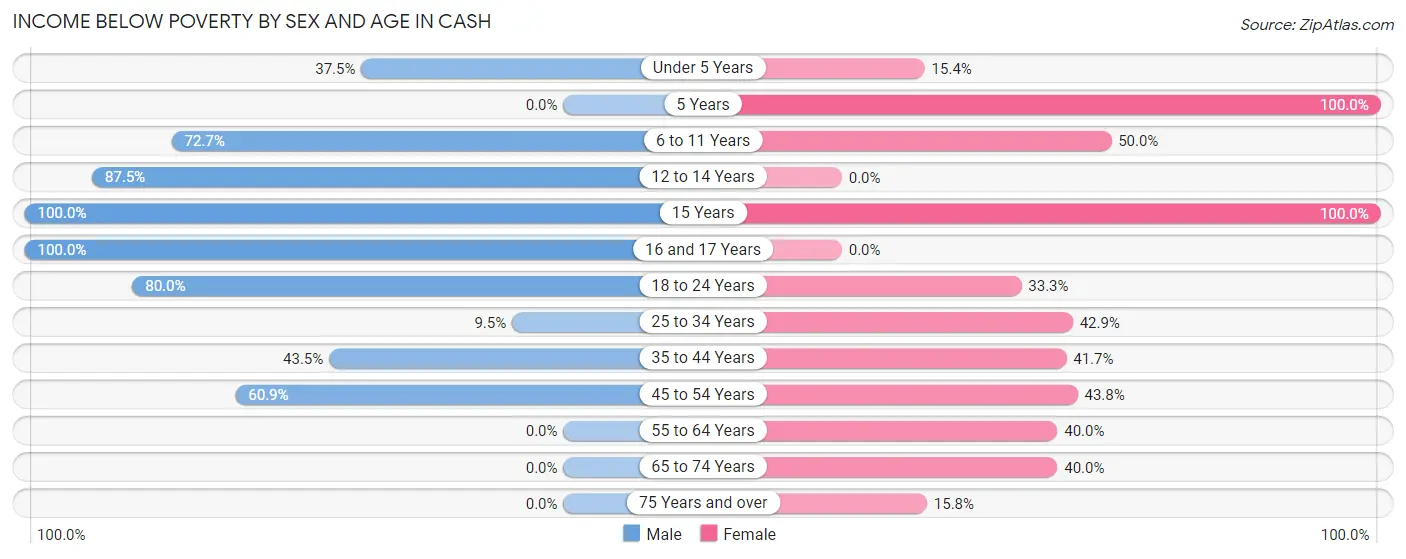
| Age Bracket | Male | Female |
| Under 5 Years | 3 (37.5%) | 2 (15.4%) |
| 5 Years | 0 (0.0%) | 1 (100.0%) |
| 6 to 11 Years | 8 (72.7%) | 4 (50.0%) |
| 12 to 14 Years | 21 (87.5%) | 0 (0.0%) |
| 15 Years | 6 (100.0%) | 3 (100.0%) |
| 16 and 17 Years | 1 (100.0%) | 0 (0.0%) |
| 18 to 24 Years | 12 (80.0%) | 3 (33.3%) |
| 25 to 34 Years | 2 (9.5%) | 6 (42.9%) |
| 35 to 44 Years | 10 (43.5%) | 10 (41.7%) |
| 45 to 54 Years | 14 (60.9%) | 7 (43.8%) |
| 55 to 64 Years | 0 (0.0%) | 6 (40.0%) |
| 65 to 74 Years | 0 (0.0%) | 2 (40.0%) |
| 75 Years and over | 0 (0.0%) | 3 (15.8%) |
| Total | 77 (51.0%) | 47 (35.3%) |
Income Above Poverty by Sex and Age in Cash
According to the poverty statistics in Cash, males aged 5 years and females aged 12 to 14 years are the age groups that are most secure financially, with 100.0% of males and 100.0% of females in these age groups living above the poverty line.
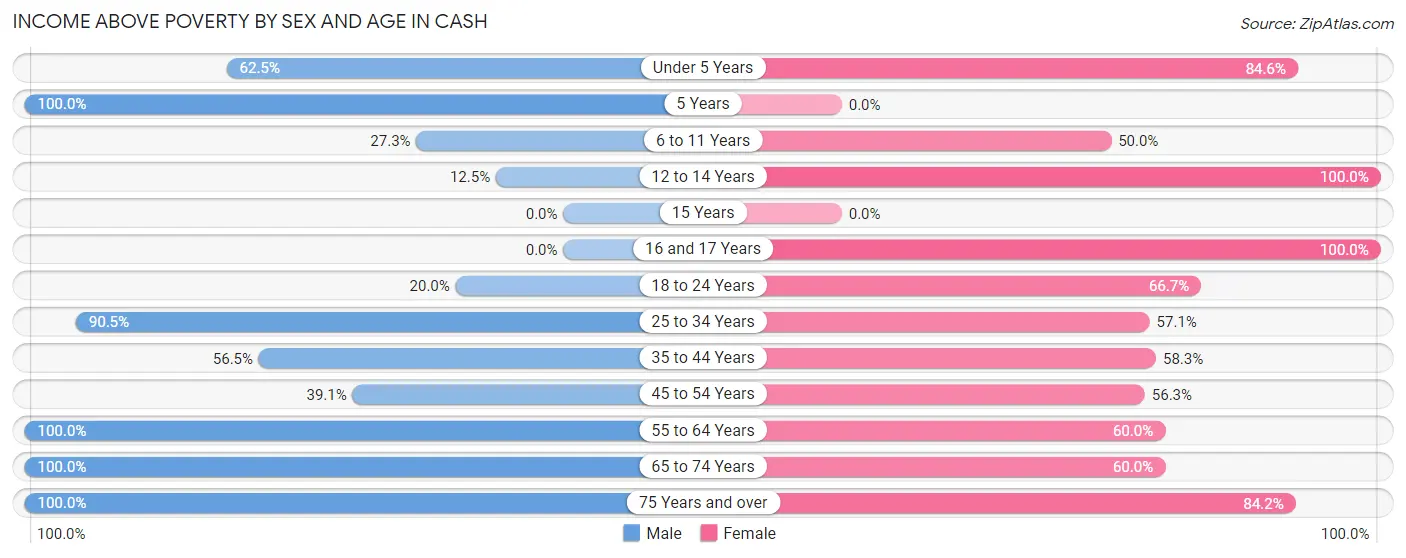
| Age Bracket | Male | Female |
| Under 5 Years | 5 (62.5%) | 11 (84.6%) |
| 5 Years | 4 (100.0%) | 0 (0.0%) |
| 6 to 11 Years | 3 (27.3%) | 4 (50.0%) |
| 12 to 14 Years | 3 (12.5%) | 3 (100.0%) |
| 15 Years | 0 (0.0%) | 0 (0.0%) |
| 16 and 17 Years | 0 (0.0%) | 3 (100.0%) |
| 18 to 24 Years | 3 (20.0%) | 6 (66.7%) |
| 25 to 34 Years | 19 (90.5%) | 8 (57.1%) |
| 35 to 44 Years | 13 (56.5%) | 14 (58.3%) |
| 45 to 54 Years | 9 (39.1%) | 9 (56.2%) |
| 55 to 64 Years | 4 (100.0%) | 9 (60.0%) |
| 65 to 74 Years | 4 (100.0%) | 3 (60.0%) |
| 75 Years and over | 7 (100.0%) | 16 (84.2%) |
| Total | 74 (49.0%) | 86 (64.7%) |
Income Below Poverty Among Married-Couple Families in Cash
The poverty statistics for married-couple families in Cash show that 39.7% or 23 of the total 58 families live below the poverty line. Families with 5 or more children have the highest poverty rate of 100.0%, comprising of 2 families. On the other hand, families with no children have the lowest poverty rate of 0.0%, which includes 0 families.
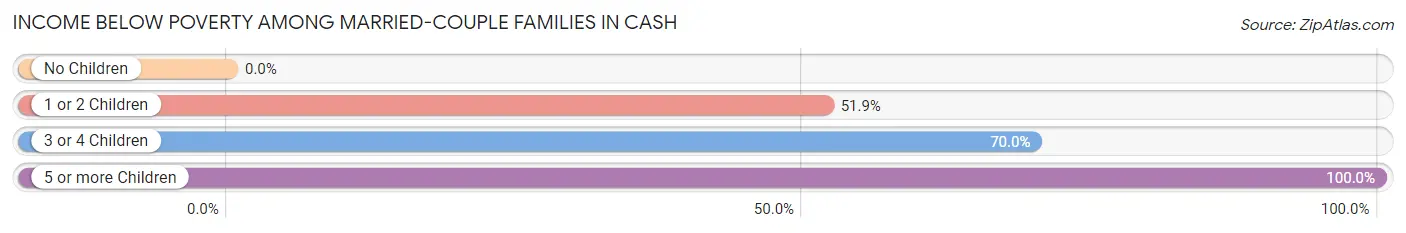
| Children | Above Poverty | Below Poverty |
| No Children | 19 (100.0%) | 0 (0.0%) |
| 1 or 2 Children | 13 (48.1%) | 14 (51.8%) |
| 3 or 4 Children | 3 (30.0%) | 7 (70.0%) |
| 5 or more Children | 0 (0.0%) | 2 (100.0%) |
| Total | 35 (60.3%) | 23 (39.7%) |
Income Below Poverty Among Single-Parent Households in Cash
According to the poverty data in Cash, 100.0% or 2 single-father households and 44.4% or 4 single-mother households are living below the poverty line. Among single-father households, those with 1 or 2 children have the highest poverty rate, with 2 households (100.0%) experiencing poverty. Likewise, among single-mother households, those with 1 or 2 children have the highest poverty rate, with 4 households (100.0%) falling below the poverty line.
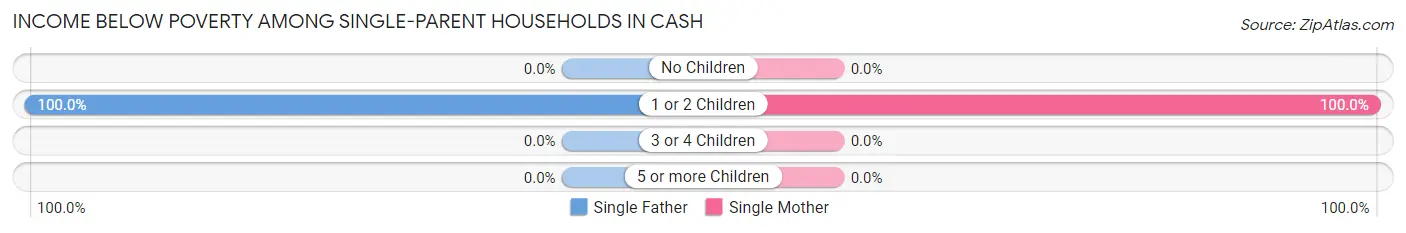
| Children | Single Father | Single Mother |
| No Children | 0 (0.0%) | 0 (0.0%) |
| 1 or 2 Children | 2 (100.0%) | 4 (100.0%) |
| 3 or 4 Children | 0 (0.0%) | 0 (0.0%) |
| 5 or more Children | 0 (0.0%) | 0 (0.0%) |
| Total | 2 (100.0%) | 4 (44.4%) |
Income Below Poverty Among Married-Couple vs Single-Parent Households in Cash
The poverty data for Cash shows that 23 of the married-couple family households (39.7%) and 6 of the single-parent households (54.5%) are living below the poverty level. Within the married-couple family households, those with 5 or more children have the highest poverty rate, with 2 households (100.0%) falling below the poverty line. Among the single-parent households, those with 1 or 2 children have the highest poverty rate, with 6 household (100.0%) living below poverty.
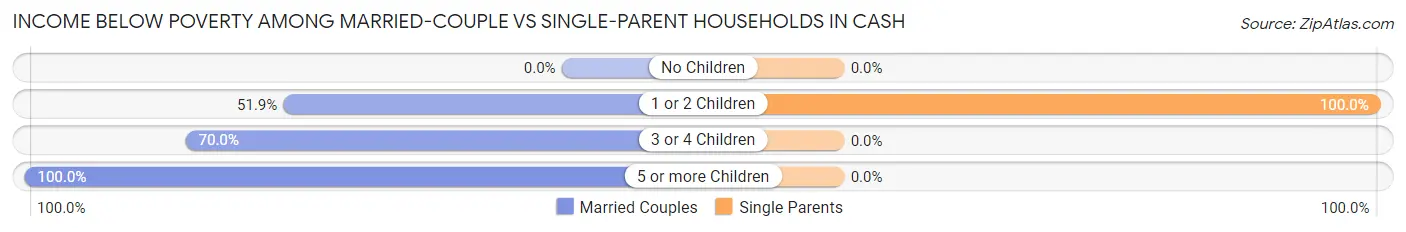
| Children | Married-Couple Families | Single-Parent Households |
| No Children | 0 (0.0%) | 0 (0.0%) |
| 1 or 2 Children | 14 (51.8%) | 6 (100.0%) |
| 3 or 4 Children | 7 (70.0%) | 0 (0.0%) |
| 5 or more Children | 2 (100.0%) | 0 (0.0%) |
| Total | 23 (39.7%) | 6 (54.5%) |
Race in Cash
The most populous races in Cash are White / Caucasian (277 | 97.2%), Two or more Races (4 | 1.4%), and Some other Race (4 | 1.4%).
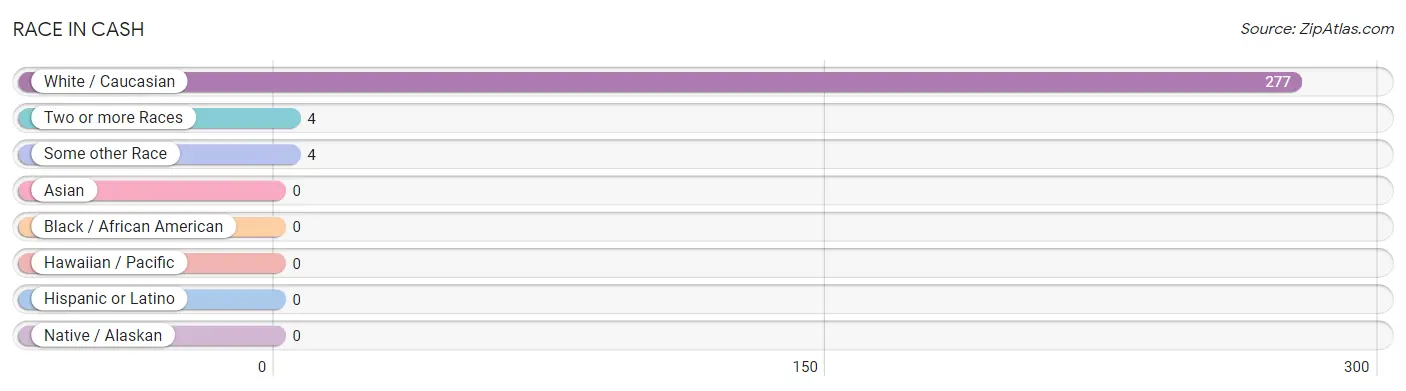
| Race | # Population | % Population |
| Asian | 0 | 0.0% |
| Black / African American | 0 | 0.0% |
| Hawaiian / Pacific | 0 | 0.0% |
| Hispanic or Latino | 0 | 0.0% |
| Native / Alaskan | 0 | 0.0% |
| White / Caucasian | 277 | 97.2% |
| Two or more Races | 4 | 1.4% |
| Some other Race | 4 | 1.4% |
| Total | 285 | 100.0% |
Ancestry in Cash
The most populous ancestries reported in Cash are American (52 | 18.2%), Irish (44 | 15.4%), German (42 | 14.7%), English (5 | 1.8%), and Bhutanese (4 | 1.4%), together accounting for 51.6% of all Cash residents.
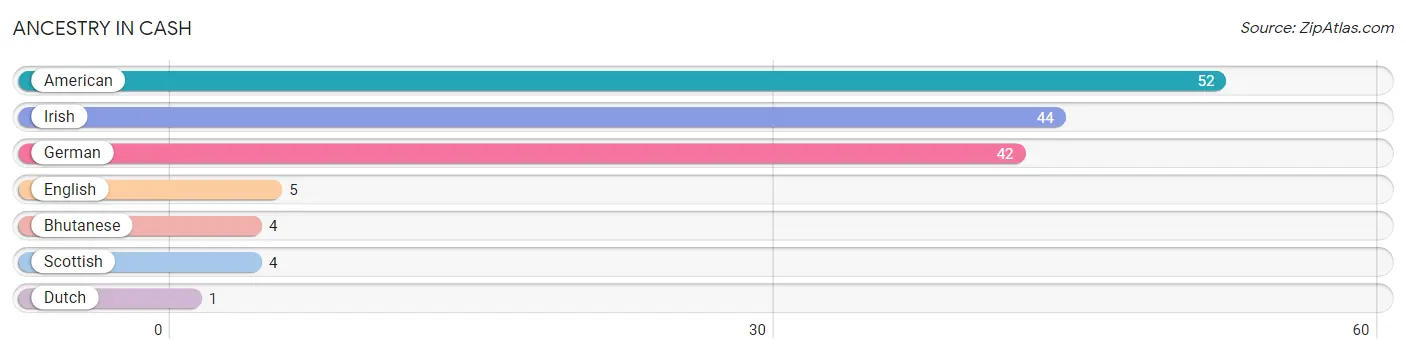
| Ancestry | # Population | % Population |
| American | 52 | 18.2% |
| Bhutanese | 4 | 1.4% |
| Dutch | 1 | 0.4% |
| English | 5 | 1.8% |
| German | 42 | 14.7% |
| Irish | 44 | 15.4% |
| Scottish | 4 | 1.4% | View All 7 Rows |
Immigrants in Cash

| Immigration Origin | # Population | % Population | View All 0 Rows |
Sex and Age in Cash
Sex and Age in Cash
The most populous age groups in Cash are 10 to 14 Years (26 | 17.2%) for men and 35 to 39 Years (19 | 14.2%) for women.
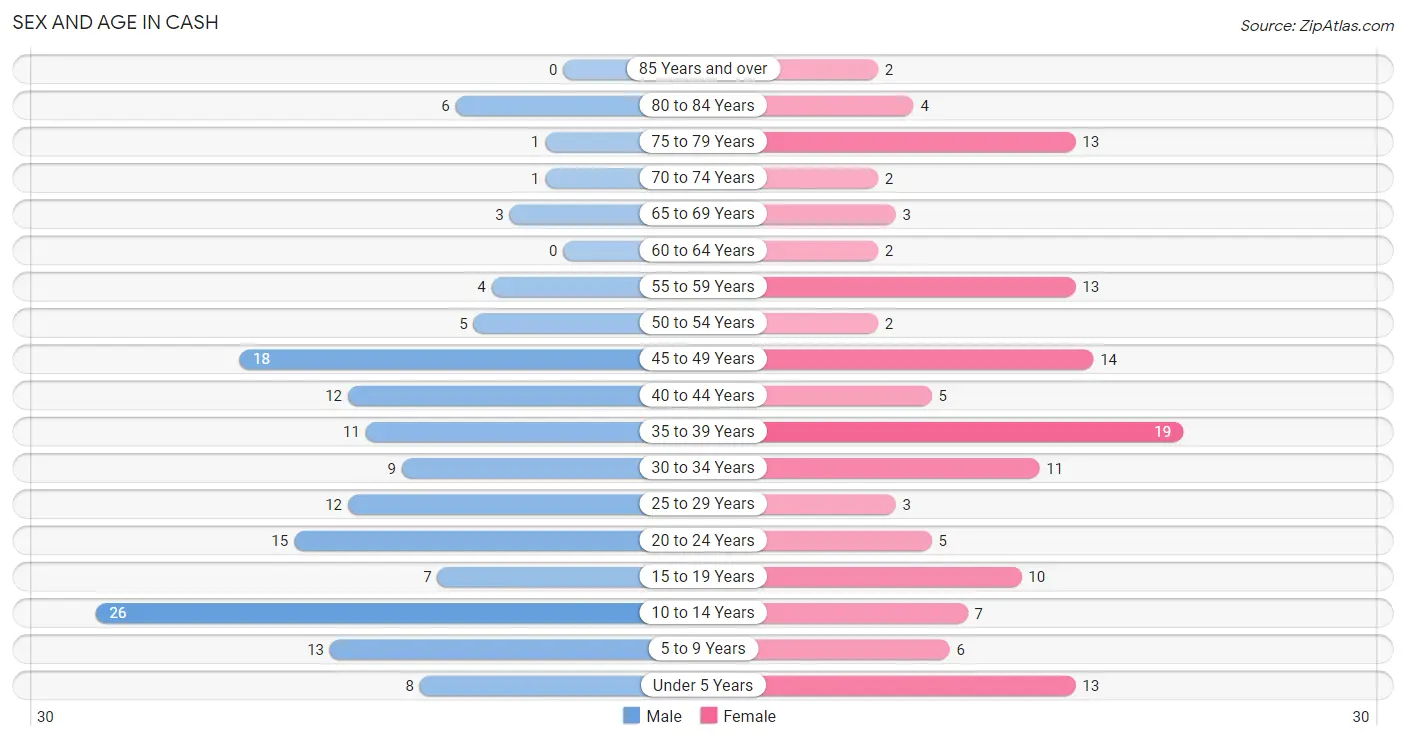
| Age Bracket | Male | Female |
| Under 5 Years | 8 (5.3%) | 13 (9.7%) |
| 5 to 9 Years | 13 (8.6%) | 6 (4.5%) |
| 10 to 14 Years | 26 (17.2%) | 7 (5.2%) |
| 15 to 19 Years | 7 (4.6%) | 10 (7.5%) |
| 20 to 24 Years | 15 (9.9%) | 5 (3.7%) |
| 25 to 29 Years | 12 (8.0%) | 3 (2.2%) |
| 30 to 34 Years | 9 (6.0%) | 11 (8.2%) |
| 35 to 39 Years | 11 (7.3%) | 19 (14.2%) |
| 40 to 44 Years | 12 (8.0%) | 5 (3.7%) |
| 45 to 49 Years | 18 (11.9%) | 14 (10.4%) |
| 50 to 54 Years | 5 (3.3%) | 2 (1.5%) |
| 55 to 59 Years | 4 (2.6%) | 13 (9.7%) |
| 60 to 64 Years | 0 (0.0%) | 2 (1.5%) |
| 65 to 69 Years | 3 (2.0%) | 3 (2.2%) |
| 70 to 74 Years | 1 (0.7%) | 2 (1.5%) |
| 75 to 79 Years | 1 (0.7%) | 13 (9.7%) |
| 80 to 84 Years | 6 (4.0%) | 4 (3.0%) |
| 85 Years and over | 0 (0.0%) | 2 (1.5%) |
| Total | 151 (100.0%) | 134 (100.0%) |
Families and Households in Cash
Median Family Size in Cash
The median family size in Cash is 3.58 persons per family, with married-couple families (58 | 84.1%) accounting for the largest median family size of 3.76 persons per family. On the other hand, single male/father families (2 | 2.9%) represent the smallest median family size with 2.00 persons per family.
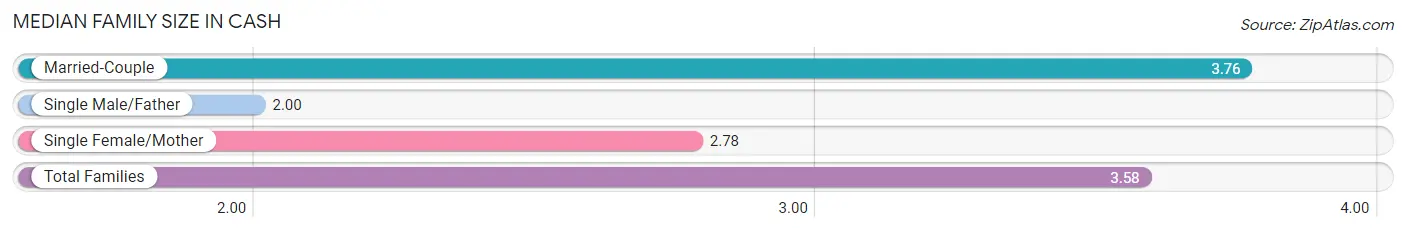
| Family Type | # Families | Family Size |
| Married-Couple | 58 (84.1%) | 3.76 |
| Single Male/Father | 2 (2.9%) | 2.00 |
| Single Female/Mother | 9 (13.0%) | 2.78 |
| Total Families | 69 (100.0%) | 3.58 |
Median Household Size in Cash
The median household size in Cash is 2.91 persons per household, with married-couple households (58 | 59.2%) accounting for the largest median household size of 3.76 persons per household. non-family households (29 | 29.6%) represent the smallest median household size with 1.10 persons per household.
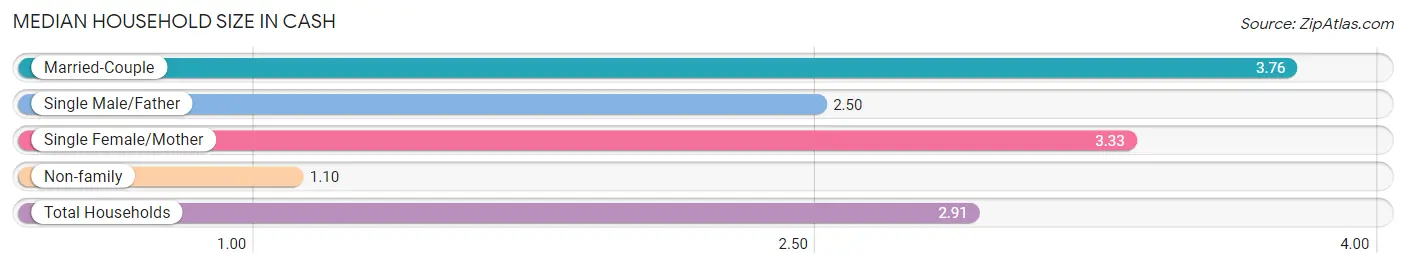
| Household Type | # Households | Household Size |
| Married-Couple | 58 (59.2%) | 3.76 |
| Single Male/Father | 2 (2.0%) | 2.50 |
| Single Female/Mother | 9 (9.2%) | 3.33 |
| Non-family | 29 (29.6%) | 1.10 |
| Total Households | 98 (100.0%) | 2.91 |
Household Size by Marriage Status in Cash
Out of a total of 98 households in Cash, 69 (70.4%) are family households, while 29 (29.6%) are nonfamily households. The most numerous type of family households are 4-person households, comprising 28, and the most common type of nonfamily households are 1-person households, comprising 28.
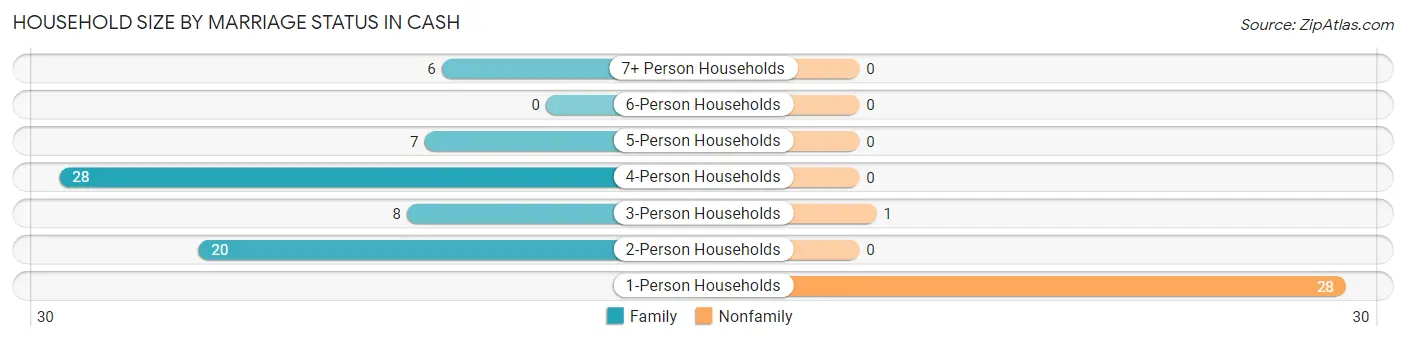
| Household Size | Family Households | Nonfamily Households |
| 1-Person Households | - | 28 (28.6%) |
| 2-Person Households | 20 (20.4%) | 0 (0.0%) |
| 3-Person Households | 8 (8.2%) | 1 (1.0%) |
| 4-Person Households | 28 (28.6%) | 0 (0.0%) |
| 5-Person Households | 7 (7.1%) | 0 (0.0%) |
| 6-Person Households | 0 (0.0%) | 0 (0.0%) |
| 7+ Person Households | 6 (6.1%) | 0 (0.0%) |
| Total | 69 (70.4%) | 29 (29.6%) |
Female Fertility in Cash
Fertility by Age in Cash
Average fertility rate in Cash is 30.0 births per 1,000 women. Women in the age bracket of 20 to 34 years have the highest fertility rate with 105.0 births per 1,000 women. Women in the age bracket of 20 to 34 years acount for 100.0% of all women with births.
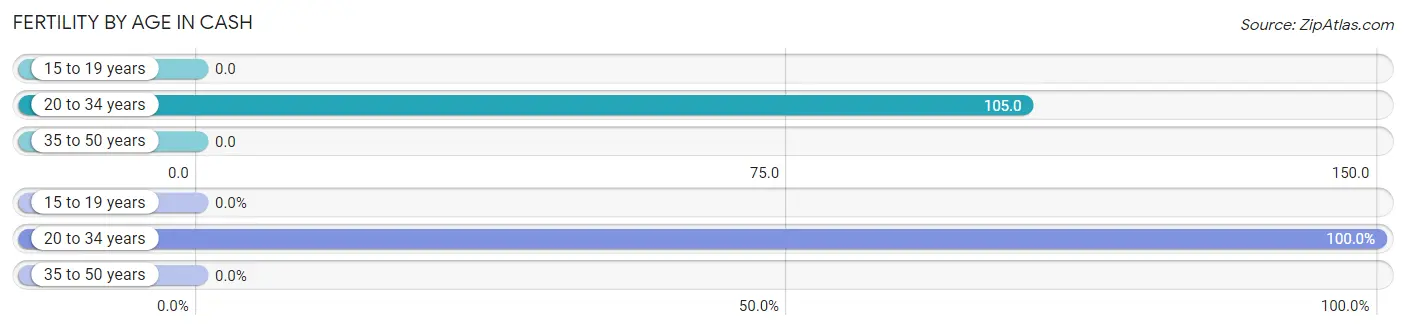
| Age Bracket | Women with Births | Births / 1,000 Women |
| 15 to 19 years | 0 (0.0%) | 0.0 |
| 20 to 34 years | 2 (100.0%) | 105.0 |
| 35 to 50 years | 0 (0.0%) | 0.0 |
| Total | 2 (100.0%) | 30.0 |
Fertility by Age by Marriage Status in Cash
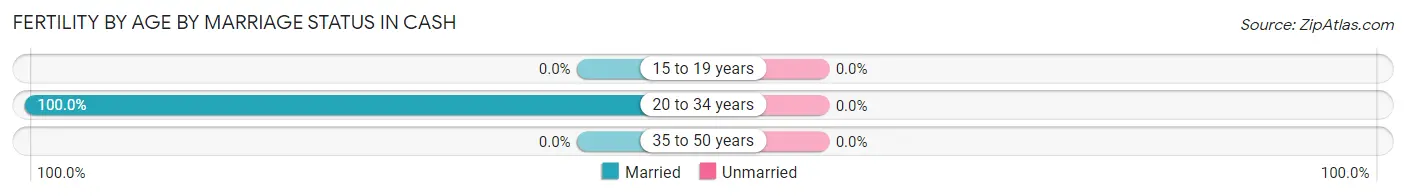
| Age Bracket | Married | Unmarried |
| 15 to 19 years | 0 (0.0%) | 0 (0.0%) |
| 20 to 34 years | 2 (100.0%) | 0 (0.0%) |
| 35 to 50 years | 0 (0.0%) | 0 (0.0%) |
| Total | 2 (100.0%) | 0 (0.0%) |
Fertility by Education in Cash
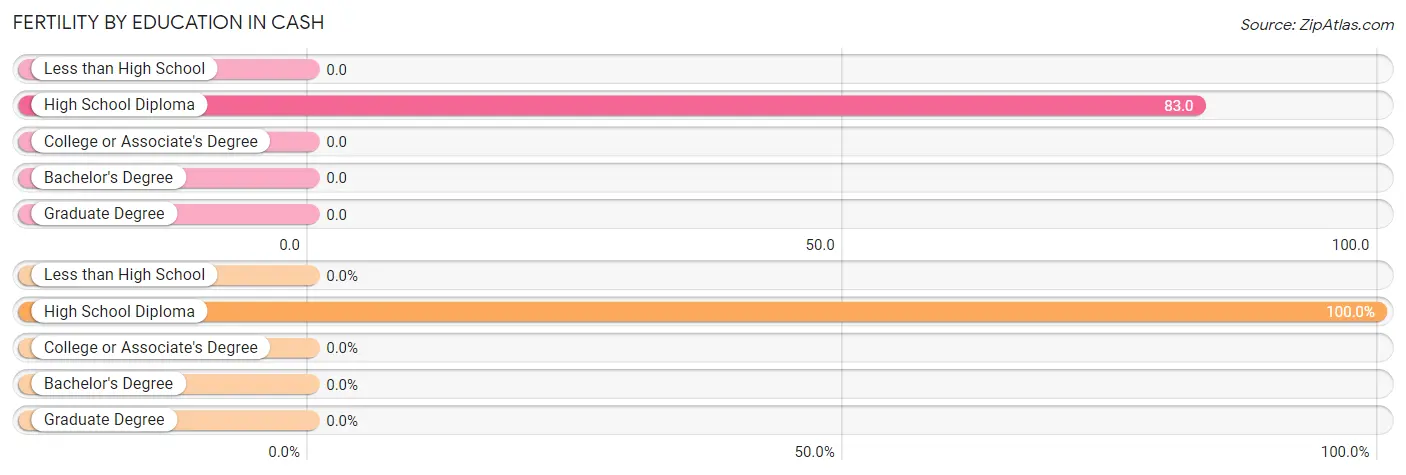
| Educational Attainment | Women with Births | Births / 1,000 Women |
| Less than High School | 0 (0.0%) | 0.0 |
| High School Diploma | 2 (100.0%) | 83.0 |
| College or Associate's Degree | 0 (0.0%) | 0.0 |
| Bachelor's Degree | 0 (0.0%) | 0.0 |
| Graduate Degree | 0 (0.0%) | 0.0 |
| Total | 2 (100.0%) | 30.0 |
Fertility by Education by Marriage Status in Cash
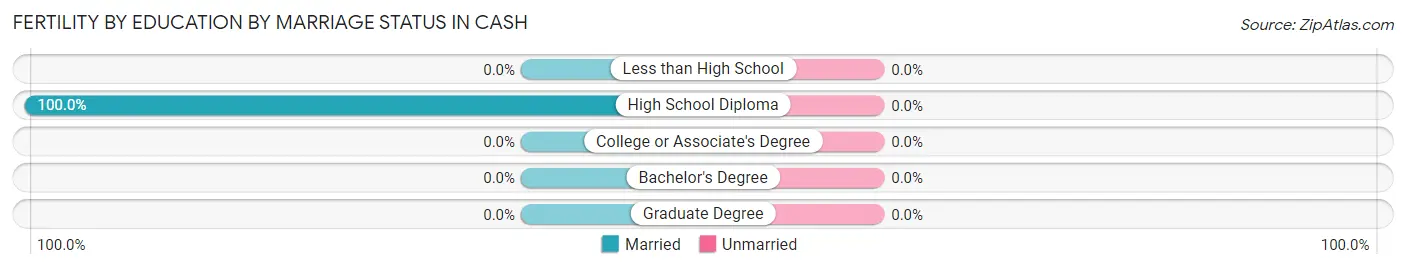
| Educational Attainment | Married | Unmarried |
| Less than High School | 0 (0.0%) | 0 (0.0%) |
| High School Diploma | 2 (100.0%) | 0 (0.0%) |
| College or Associate's Degree | 0 (0.0%) | 0 (0.0%) |
| Bachelor's Degree | 0 (0.0%) | 0 (0.0%) |
| Graduate Degree | 0 (0.0%) | 0 (0.0%) |
| Total | 2 (100.0%) | 0 (0.0%) |
Employment Characteristics in Cash
Employment by Class of Employer in Cash
Among the 93 employed individuals in Cash, private company employees (62 | 66.7%), self-employed (not incorporated) (15 | 16.1%), and not-for-profit organizations (8 | 8.6%) make up the most common classes of employment.
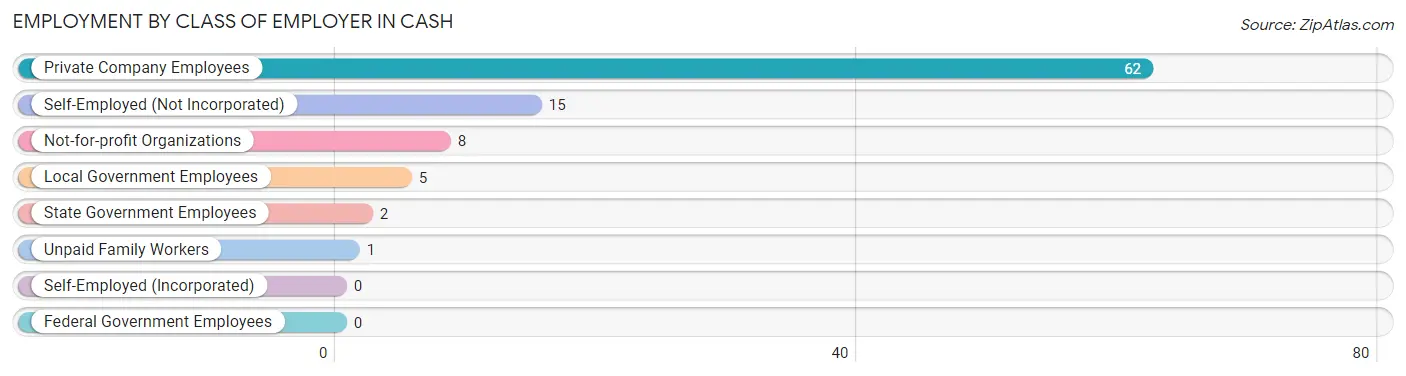
| Employer Class | # Employees | % Employees |
| Private Company Employees | 62 | 66.7% |
| Self-Employed (Incorporated) | 0 | 0.0% |
| Self-Employed (Not Incorporated) | 15 | 16.1% |
| Not-for-profit Organizations | 8 | 8.6% |
| Local Government Employees | 5 | 5.4% |
| State Government Employees | 2 | 2.1% |
| Federal Government Employees | 0 | 0.0% |
| Unpaid Family Workers | 1 | 1.1% |
| Total | 93 | 100.0% |
Employment Status by Age in Cash
According to the labor force statistics for Cash, out of the total population over 16 years of age (203), 47.8% or 97 individuals are in the labor force, with 4.1% or 4 of them unemployed. The age group with the highest labor force participation rate is 25 to 29 years, with 80.0% or 12 individuals in the labor force. Within the labor force, the 20 to 24 years age range has the highest percentage of unemployed individuals, with 75.0% or 3 of them being unemployed.
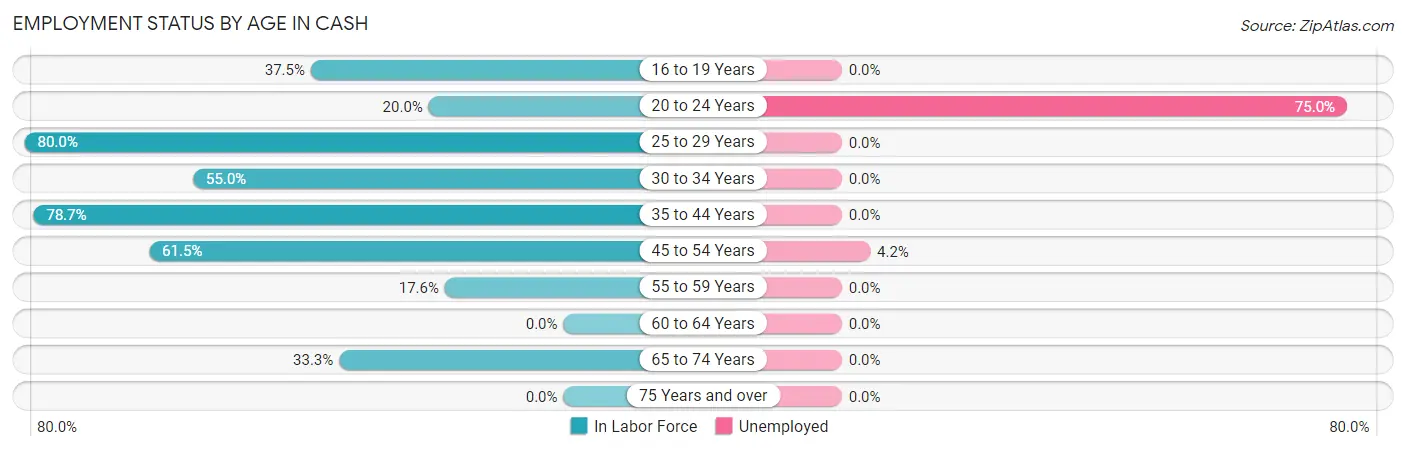
| Age Bracket | In Labor Force | Unemployed |
| 16 to 19 Years | 3 (37.5%) | 0 (0.0%) |
| 20 to 24 Years | 4 (20.0%) | 3 (75.0%) |
| 25 to 29 Years | 12 (80.0%) | 0 (0.0%) |
| 30 to 34 Years | 11 (55.0%) | 0 (0.0%) |
| 35 to 44 Years | 37 (78.7%) | 0 (0.0%) |
| 45 to 54 Years | 24 (61.5%) | 1 (4.2%) |
| 55 to 59 Years | 3 (17.6%) | 0 (0.0%) |
| 60 to 64 Years | 0 (0.0%) | 0 (0.0%) |
| 65 to 74 Years | 3 (33.3%) | 0 (0.0%) |
| 75 Years and over | 0 (0.0%) | 0 (0.0%) |
| Total | 97 (47.8%) | 4 (4.1%) |
Employment Status by Educational Attainment in Cash
According to labor force statistics for Cash, 62.1% of individuals (87) out of the total population between 25 and 64 years of age (140) are in the labor force, with 1.1% or 1 of them being unemployed. The group with the highest labor force participation rate are those with the educational attainment of college / associate degree, with 92.7% or 38 individuals in the labor force. Within the labor force, individuals with high school diploma education have the highest percentage of unemployment, with 3.6% or 1 of them being unemployed.
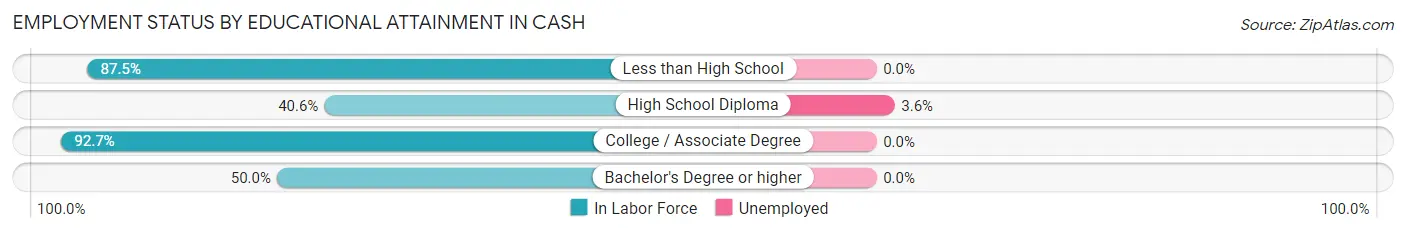
| Educational Attainment | In Labor Force | Unemployed |
| Less than High School | 14 (87.5%) | 0 (0.0%) |
| High School Diploma | 28 (40.6%) | 2 (3.6%) |
| College / Associate Degree | 38 (92.7%) | 0 (0.0%) |
| Bachelor's Degree or higher | 7 (50.0%) | 0 (0.0%) |
| Total | 87 (62.1%) | 2 (1.1%) |
Employment Occupations by Sex in Cash
Management, Business, Science and Arts Occupations
The most common Management, Business, Science and Arts occupations in Cash are Management (4 | 4.3%), Community & Social Service (4 | 4.3%), Education Instruction & Library (4 | 4.3%), and Health Diagnosing & Treating (1 | 1.1%).
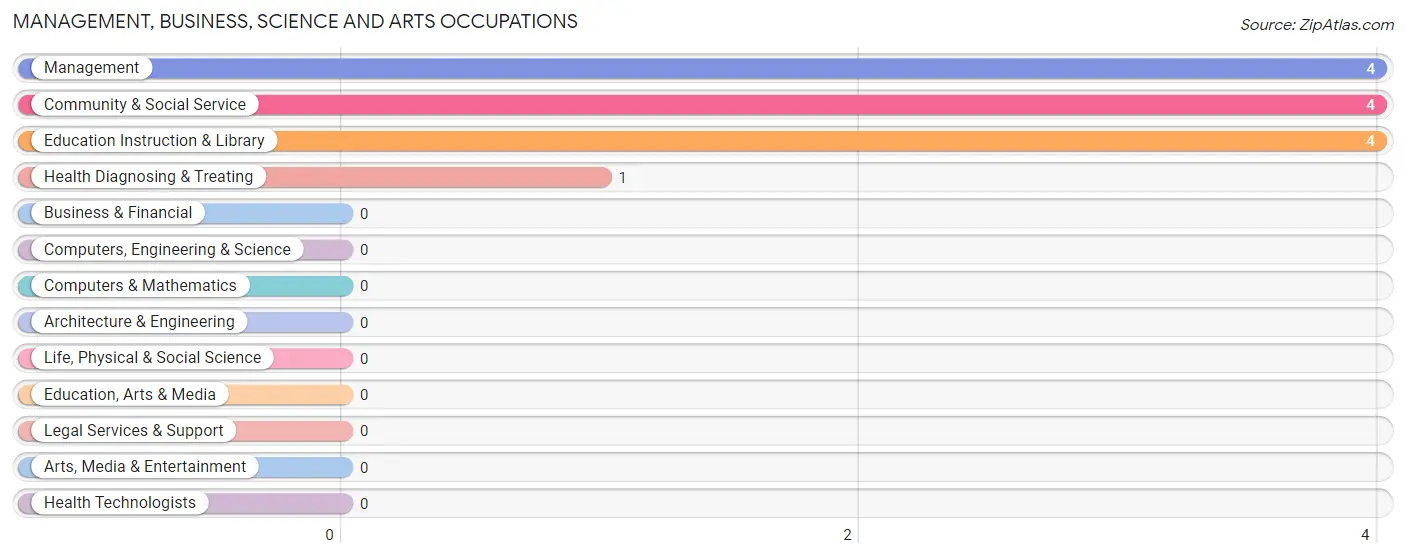
Management, Business, Science and Arts Occupations by Sex
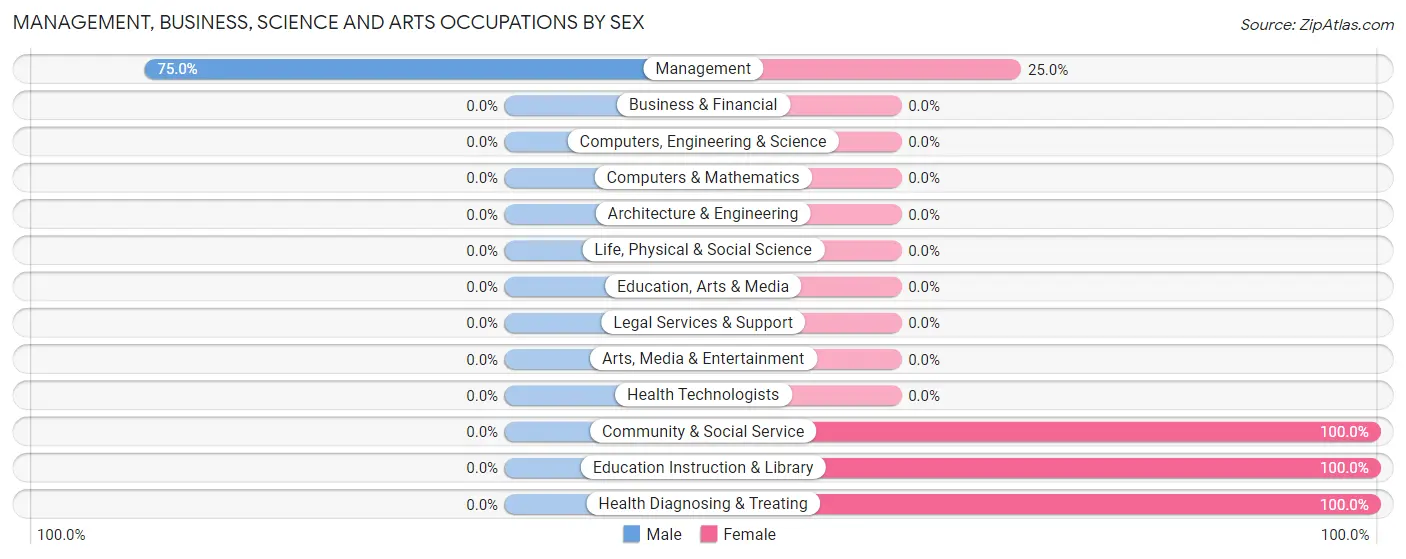
| Occupation | Male | Female |
| Management | 3 (75.0%) | 1 (25.0%) |
| Business & Financial | 0 (0.0%) | 0 (0.0%) |
| Computers, Engineering & Science | 0 (0.0%) | 0 (0.0%) |
| Computers & Mathematics | 0 (0.0%) | 0 (0.0%) |
| Architecture & Engineering | 0 (0.0%) | 0 (0.0%) |
| Life, Physical & Social Science | 0 (0.0%) | 0 (0.0%) |
| Community & Social Service | 0 (0.0%) | 4 (100.0%) |
| Education, Arts & Media | 0 (0.0%) | 0 (0.0%) |
| Legal Services & Support | 0 (0.0%) | 0 (0.0%) |
| Education Instruction & Library | 0 (0.0%) | 4 (100.0%) |
| Arts, Media & Entertainment | 0 (0.0%) | 0 (0.0%) |
| Health Diagnosing & Treating | 0 (0.0%) | 1 (100.0%) |
| Health Technologists | 0 (0.0%) | 0 (0.0%) |
| Total (Category) | 3 (33.3%) | 6 (66.7%) |
| Total (Overall) | 48 (51.6%) | 45 (48.4%) |
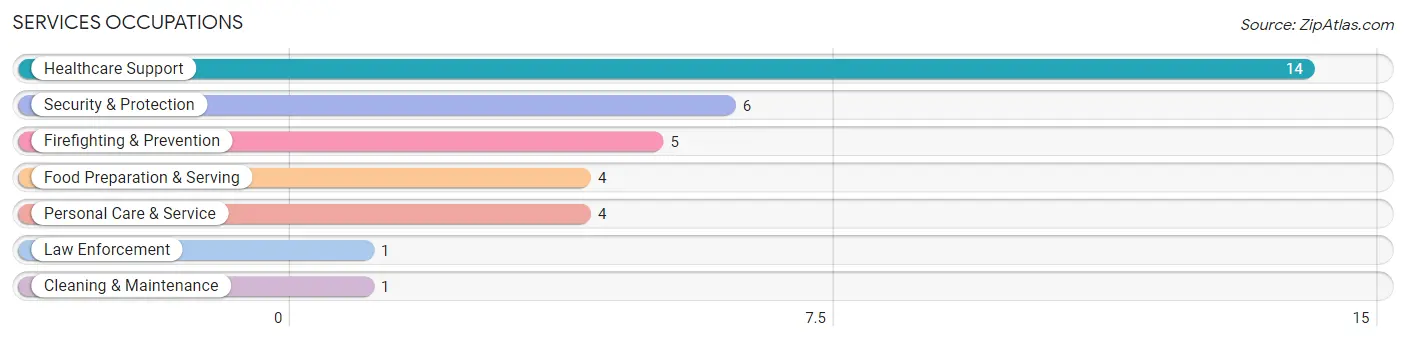
Services Occupations
The most common Services occupations in Cash are Healthcare Support (14 | 15.0%), Security & Protection (6 | 6.5%), Firefighting & Prevention (5 | 5.4%), Food Preparation & Serving (4 | 4.3%), and Personal Care & Service (4 | 4.3%).
Services Occupations by Sex
Within the Services occupations in Cash, the most male-oriented occupations are Firefighting & Prevention (100.0%), Security & Protection (83.3%), and Food Preparation & Serving (25.0%), while the most female-oriented occupations are Healthcare Support (100.0%), Law Enforcement (100.0%), and Cleaning & Maintenance (100.0%).
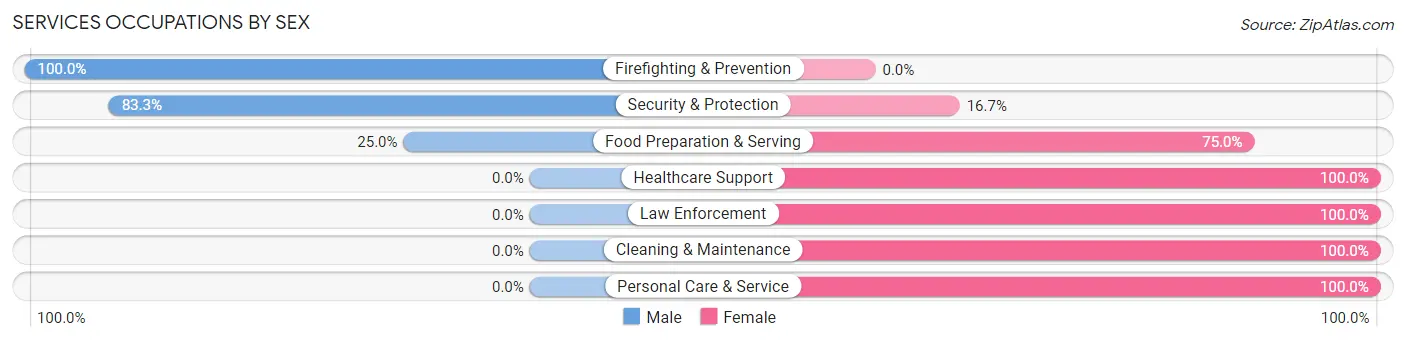
| Occupation | Male | Female |
| Healthcare Support | 0 (0.0%) | 14 (100.0%) |
| Security & Protection | 5 (83.3%) | 1 (16.7%) |
| Firefighting & Prevention | 5 (100.0%) | 0 (0.0%) |
| Law Enforcement | 0 (0.0%) | 1 (100.0%) |
| Food Preparation & Serving | 1 (25.0%) | 3 (75.0%) |
| Cleaning & Maintenance | 0 (0.0%) | 1 (100.0%) |
| Personal Care & Service | 0 (0.0%) | 4 (100.0%) |
| Total (Category) | 6 (20.7%) | 23 (79.3%) |
| Total (Overall) | 48 (51.6%) | 45 (48.4%) |
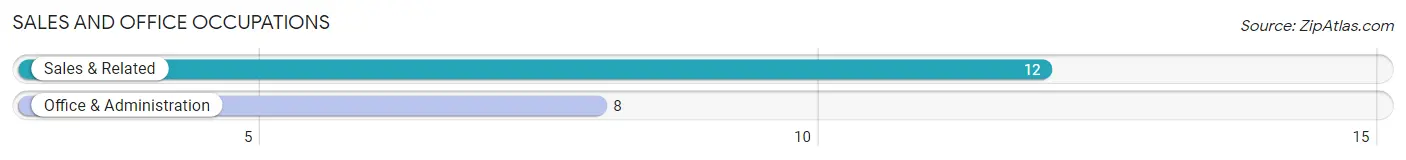
Sales and Office Occupations
The most common Sales and Office occupations in Cash are Sales & Related (12 | 12.9%), and Office & Administration (8 | 8.6%).
Sales and Office Occupations by Sex
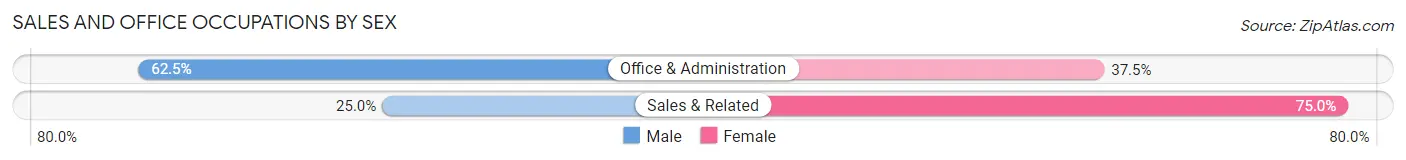
| Occupation | Male | Female |
| Sales & Related | 3 (25.0%) | 9 (75.0%) |
| Office & Administration | 5 (62.5%) | 3 (37.5%) |
| Total (Category) | 8 (40.0%) | 12 (60.0%) |
| Total (Overall) | 48 (51.6%) | 45 (48.4%) |
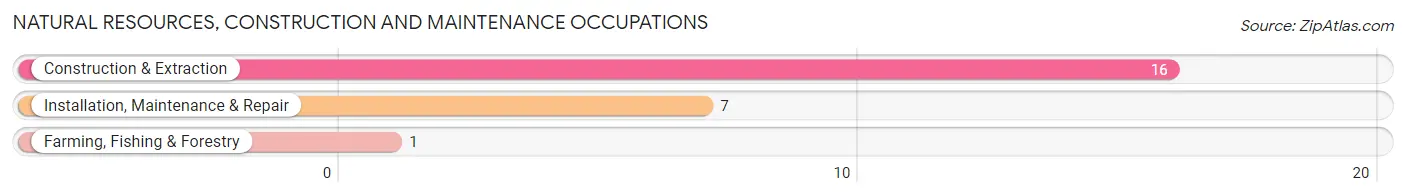
Natural Resources, Construction and Maintenance Occupations
The most common Natural Resources, Construction and Maintenance occupations in Cash are Construction & Extraction (16 | 17.2%), Installation, Maintenance & Repair (7 | 7.5%), and Farming, Fishing & Forestry (1 | 1.1%).
Natural Resources, Construction and Maintenance Occupations by Sex
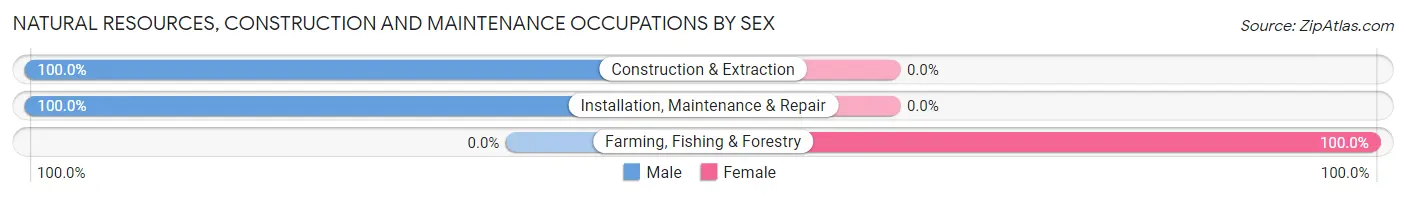
| Occupation | Male | Female |
| Farming, Fishing & Forestry | 0 (0.0%) | 1 (100.0%) |
| Construction & Extraction | 16 (100.0%) | 0 (0.0%) |
| Installation, Maintenance & Repair | 7 (100.0%) | 0 (0.0%) |
| Total (Category) | 23 (95.8%) | 1 (4.2%) |
| Total (Overall) | 48 (51.6%) | 45 (48.4%) |
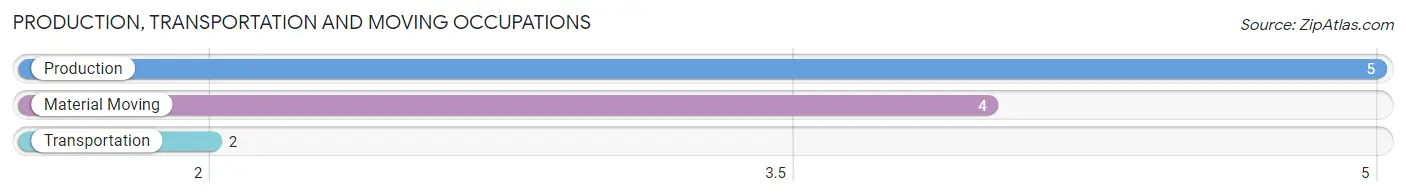
Production, Transportation and Moving Occupations
The most common Production, Transportation and Moving occupations in Cash are Production (5 | 5.4%), Material Moving (4 | 4.3%), and Transportation (2 | 2.1%).
Production, Transportation and Moving Occupations by Sex
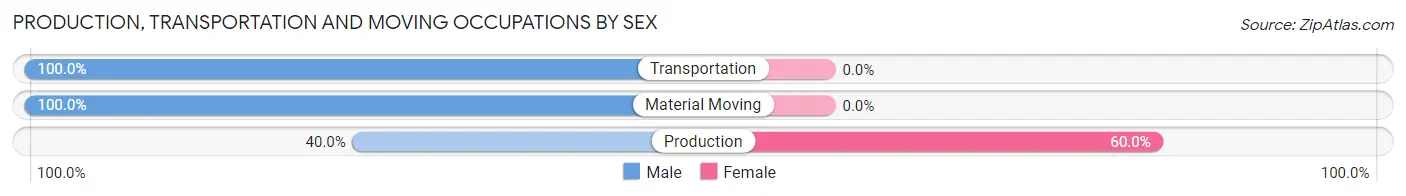
| Occupation | Male | Female |
| Production | 2 (40.0%) | 3 (60.0%) |
| Transportation | 2 (100.0%) | 0 (0.0%) |
| Material Moving | 4 (100.0%) | 0 (0.0%) |
| Total (Category) | 8 (72.7%) | 3 (27.3%) |
| Total (Overall) | 48 (51.6%) | 45 (48.4%) |
Employment Industries by Sex in Cash
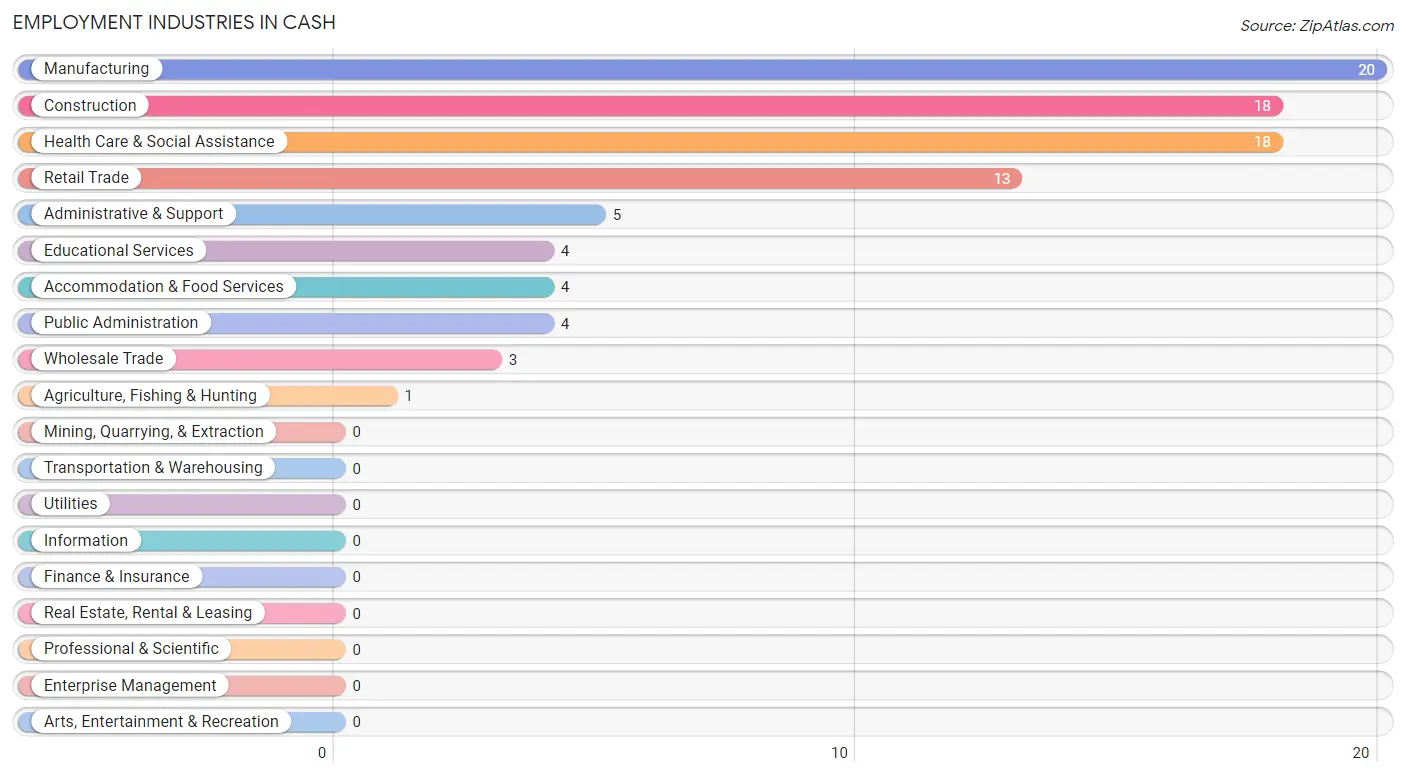
Employment Industries in Cash
The major employment industries in Cash include Manufacturing (20 | 21.5%), Construction (18 | 19.4%), Health Care & Social Assistance (18 | 19.4%), Retail Trade (13 | 14.0%), and Administrative & Support (5 | 5.4%).
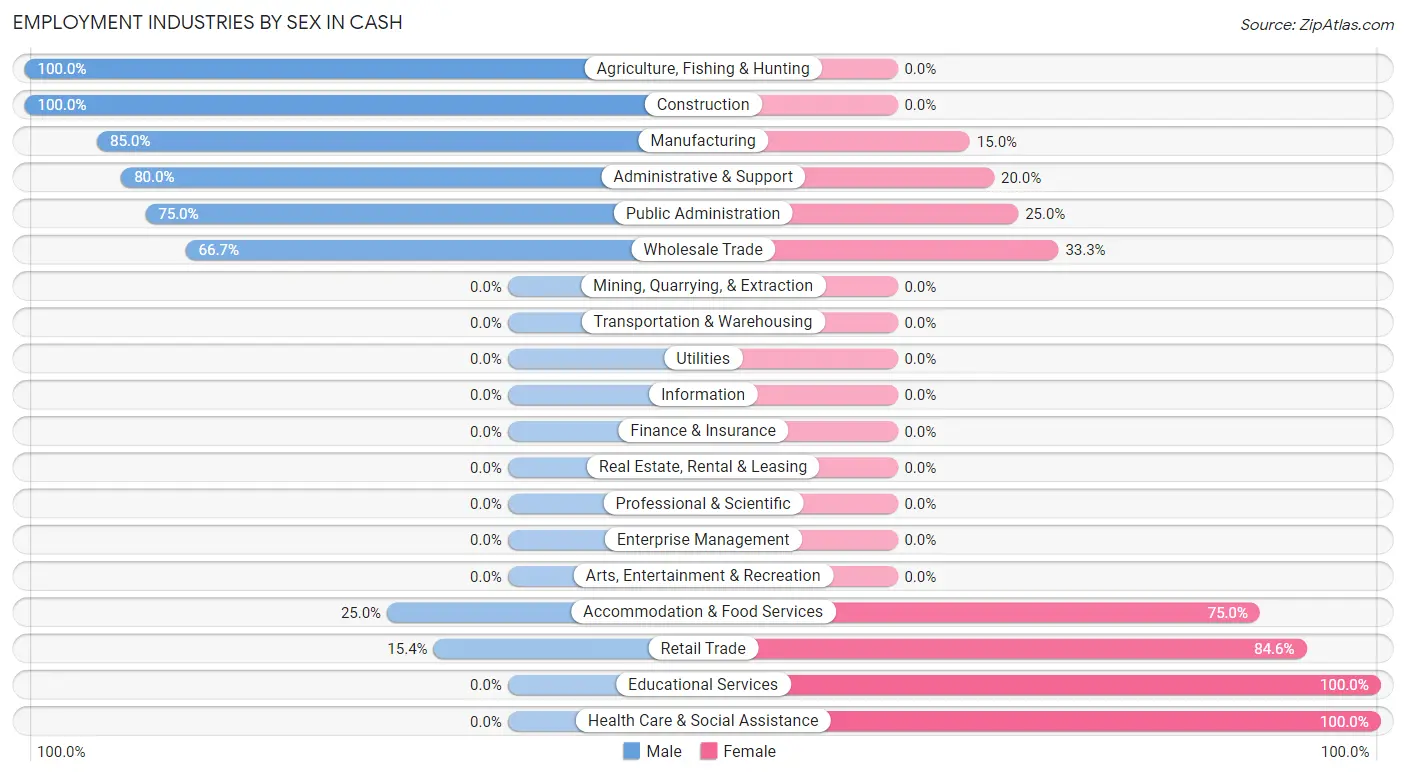
Employment Industries by Sex in Cash
The Cash industries that see more men than women are Agriculture, Fishing & Hunting (100.0%), Construction (100.0%), and Manufacturing (85.0%), whereas the industries that tend to have a higher number of women are Educational Services (100.0%), Health Care & Social Assistance (100.0%), and Retail Trade (84.6%).
| Industry | Male | Female |
| Agriculture, Fishing & Hunting | 1 (100.0%) | 0 (0.0%) |
| Mining, Quarrying, & Extraction | 0 (0.0%) | 0 (0.0%) |
| Construction | 18 (100.0%) | 0 (0.0%) |
| Manufacturing | 17 (85.0%) | 3 (15.0%) |
| Wholesale Trade | 2 (66.7%) | 1 (33.3%) |
| Retail Trade | 2 (15.4%) | 11 (84.6%) |
| Transportation & Warehousing | 0 (0.0%) | 0 (0.0%) |
| Utilities | 0 (0.0%) | 0 (0.0%) |
| Information | 0 (0.0%) | 0 (0.0%) |
| Finance & Insurance | 0 (0.0%) | 0 (0.0%) |
| Real Estate, Rental & Leasing | 0 (0.0%) | 0 (0.0%) |
| Professional & Scientific | 0 (0.0%) | 0 (0.0%) |
| Enterprise Management | 0 (0.0%) | 0 (0.0%) |
| Administrative & Support | 4 (80.0%) | 1 (20.0%) |
| Educational Services | 0 (0.0%) | 4 (100.0%) |
| Health Care & Social Assistance | 0 (0.0%) | 18 (100.0%) |
| Arts, Entertainment & Recreation | 0 (0.0%) | 0 (0.0%) |
| Accommodation & Food Services | 1 (25.0%) | 3 (75.0%) |
| Public Administration | 3 (75.0%) | 1 (25.0%) |
| Total | 48 (51.6%) | 45 (48.4%) |
Education in Cash
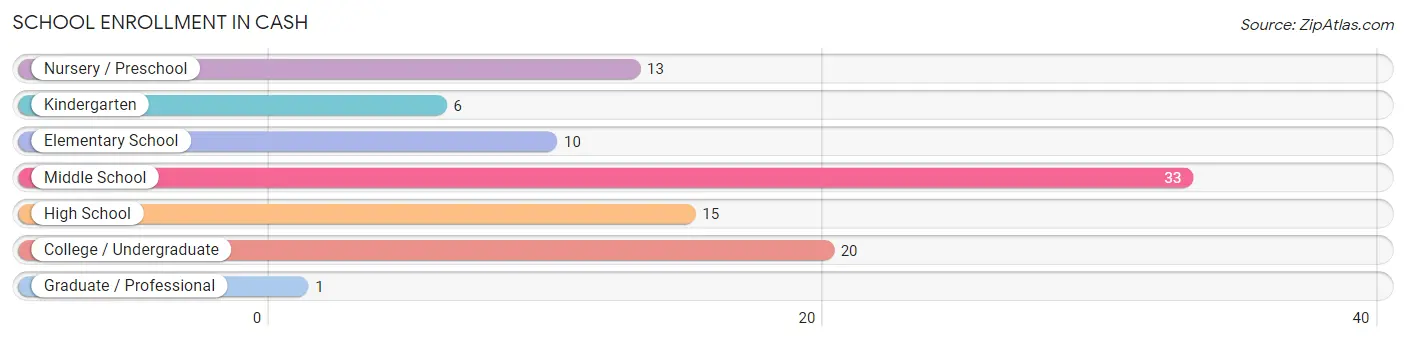
School Enrollment in Cash
The most common levels of schooling among the 98 students in Cash are middle school (33 | 33.7%), college / undergraduate (20 | 20.4%), and high school (15 | 15.3%).
| School Level | # Students | % Students |
| Nursery / Preschool | 13 | 13.3% |
| Kindergarten | 6 | 6.1% |
| Elementary School | 10 | 10.2% |
| Middle School | 33 | 33.7% |
| High School | 15 | 15.3% |
| College / Undergraduate | 20 | 20.4% |
| Graduate / Professional | 1 | 1.0% |
| Total | 98 | 100.0% |
School Enrollment by Age by Funding Source in Cash
Out of a total of 98 students who are enrolled in schools in Cash, 3 (3.1%) attend a private institution, while the remaining 95 (96.9%) are enrolled in public schools. The age group of 25 to 34 year olds has the highest likelihood of being enrolled in private schools, with 2 (50.0% in the age bracket) enrolled. Conversely, the age group of 3 to 4 year olds has the lowest likelihood of being enrolled in a private school, with 10 (100.0% in the age bracket) attending a public institution.
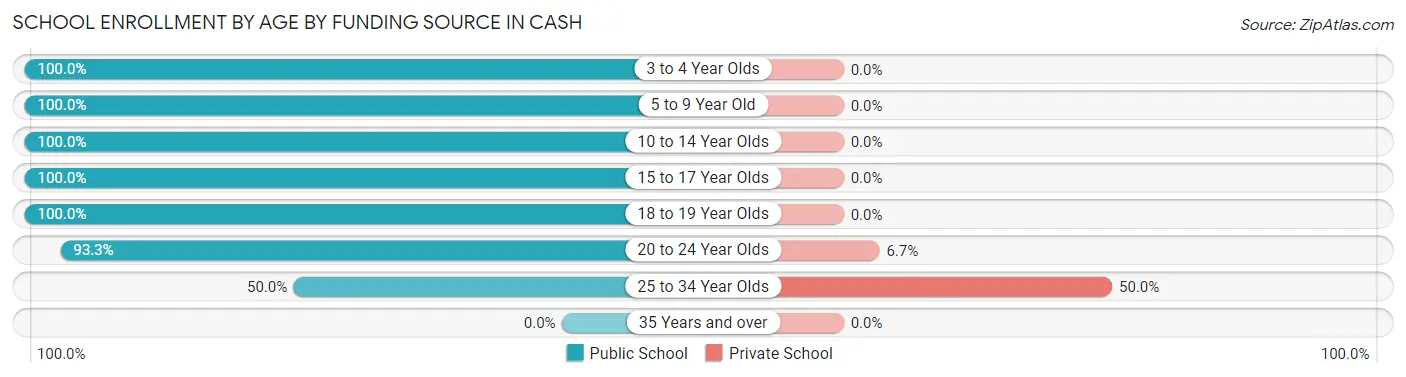
| Age Bracket | Public School | Private School |
| 3 to 4 Year Olds | 10 (100.0%) | 0 (0.0%) |
| 5 to 9 Year Old | 19 (100.0%) | 0 (0.0%) |
| 10 to 14 Year Olds | 33 (100.0%) | 0 (0.0%) |
| 15 to 17 Year Olds | 13 (100.0%) | 0 (0.0%) |
| 18 to 19 Year Olds | 4 (100.0%) | 0 (0.0%) |
| 20 to 24 Year Olds | 14 (93.3%) | 1 (6.7%) |
| 25 to 34 Year Olds | 2 (50.0%) | 2 (50.0%) |
| 35 Years and over | 0 (0.0%) | 0 (0.0%) |
| Total | 95 (96.9%) | 3 (3.1%) |
Educational Attainment by Field of Study in Cash
Education (8 | 40.0%), science & technology (6 | 30.0%), social sciences (3 | 15.0%), business (2 | 10.0%), and arts & humanities (1 | 5.0%) are the most common fields of study among 20 individuals in Cash who have obtained a bachelor's degree or higher.
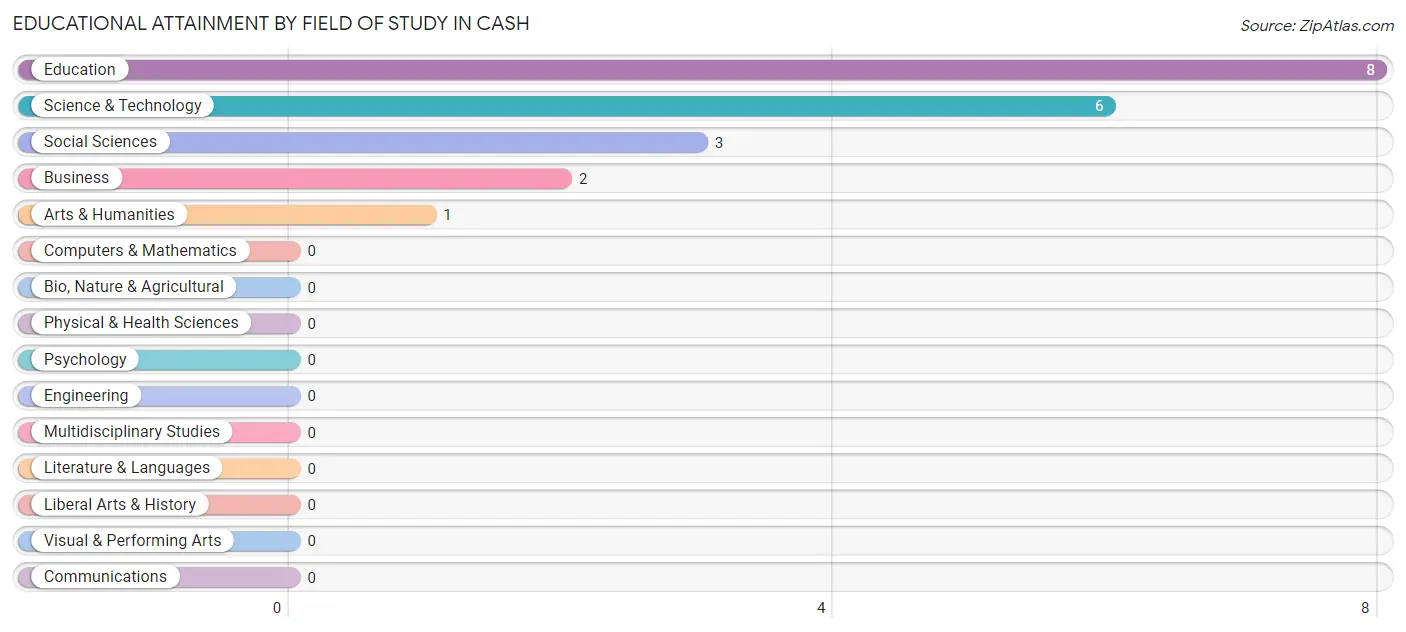
| Field of Study | # Graduates | % Graduates |
| Computers & Mathematics | 0 | 0.0% |
| Bio, Nature & Agricultural | 0 | 0.0% |
| Physical & Health Sciences | 0 | 0.0% |
| Psychology | 0 | 0.0% |
| Social Sciences | 3 | 15.0% |
| Engineering | 0 | 0.0% |
| Multidisciplinary Studies | 0 | 0.0% |
| Science & Technology | 6 | 30.0% |
| Business | 2 | 10.0% |
| Education | 8 | 40.0% |
| Literature & Languages | 0 | 0.0% |
| Liberal Arts & History | 0 | 0.0% |
| Visual & Performing Arts | 0 | 0.0% |
| Communications | 0 | 0.0% |
| Arts & Humanities | 1 | 5.0% |
| Total | 20 | 100.0% |
Transportation & Commute in Cash
Vehicle Availability by Sex in Cash
The most prevalent vehicle ownership categories in Cash are males with 3 vehicles (18, accounting for 37.5%) and females with 3 vehicles (17, making up 40.0%).
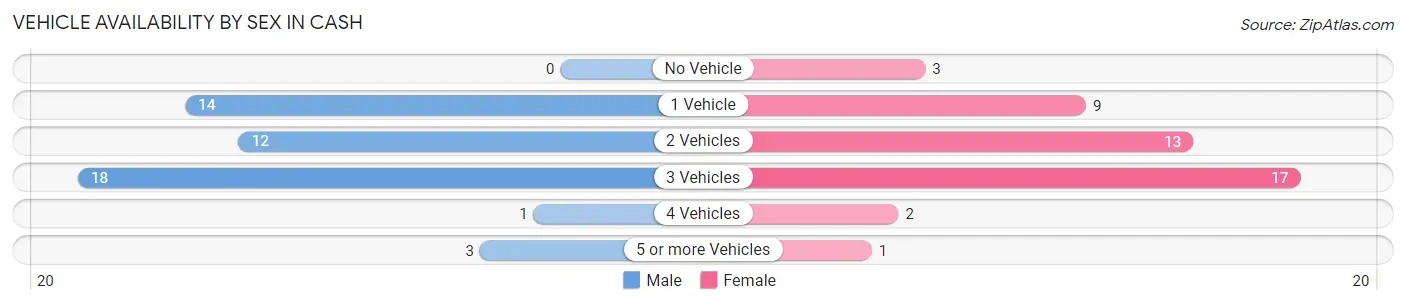
| Vehicles Available | Male | Female |
| No Vehicle | 0 (0.0%) | 3 (6.7%) |
| 1 Vehicle | 14 (29.2%) | 9 (20.0%) |
| 2 Vehicles | 12 (25.0%) | 13 (28.9%) |
| 3 Vehicles | 18 (37.5%) | 17 (37.8%) |
| 4 Vehicles | 1 (2.1%) | 2 (4.4%) |
| 5 or more Vehicles | 3 (6.2%) | 1 (2.2%) |
| Total | 48 (100.0%) | 45 (100.0%) |
Commute Time in Cash
The most frequently occuring commute durations in Cash are 30 to 34 minutes (39 commuters, 41.9%), 25 to 29 minutes (26 commuters, 28.0%), and 20 to 24 minutes (16 commuters, 17.2%).
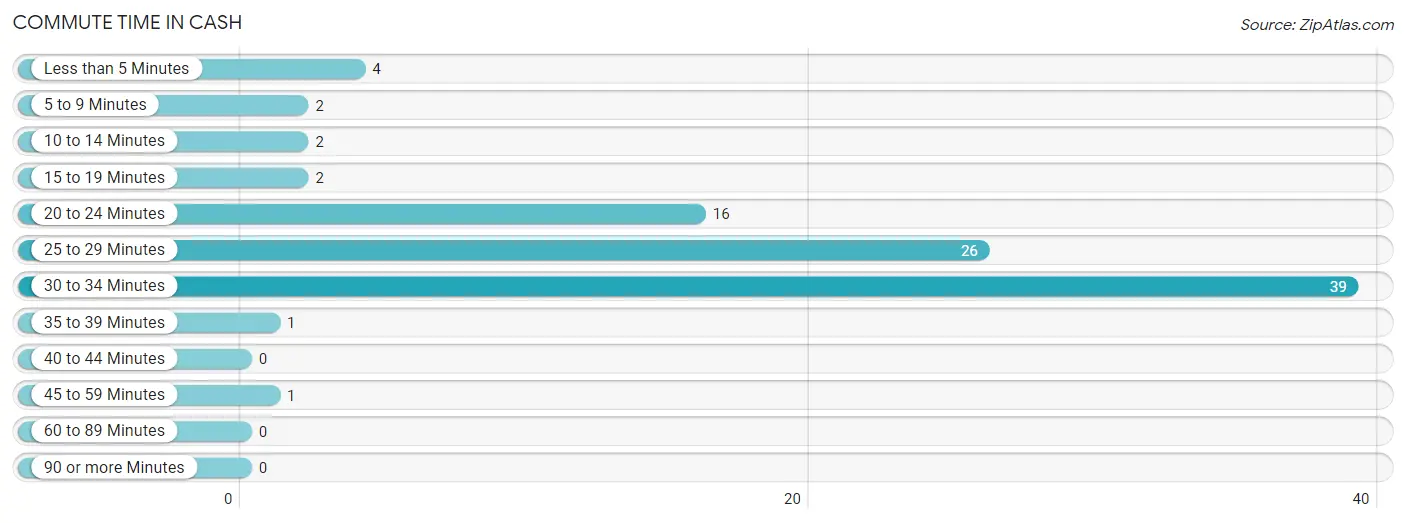
| Commute Time | # Commuters | % Commuters |
| Less than 5 Minutes | 4 | 4.3% |
| 5 to 9 Minutes | 2 | 2.1% |
| 10 to 14 Minutes | 2 | 2.1% |
| 15 to 19 Minutes | 2 | 2.1% |
| 20 to 24 Minutes | 16 | 17.2% |
| 25 to 29 Minutes | 26 | 28.0% |
| 30 to 34 Minutes | 39 | 41.9% |
| 35 to 39 Minutes | 1 | 1.1% |
| 40 to 44 Minutes | 0 | 0.0% |
| 45 to 59 Minutes | 1 | 1.1% |
| 60 to 89 Minutes | 0 | 0.0% |
| 90 or more Minutes | 0 | 0.0% |
Commute Time by Sex in Cash
The most common commute times in Cash are 30 to 34 minutes (23 commuters, 47.9%) for males and 25 to 29 minutes (16 commuters, 35.6%) for females.
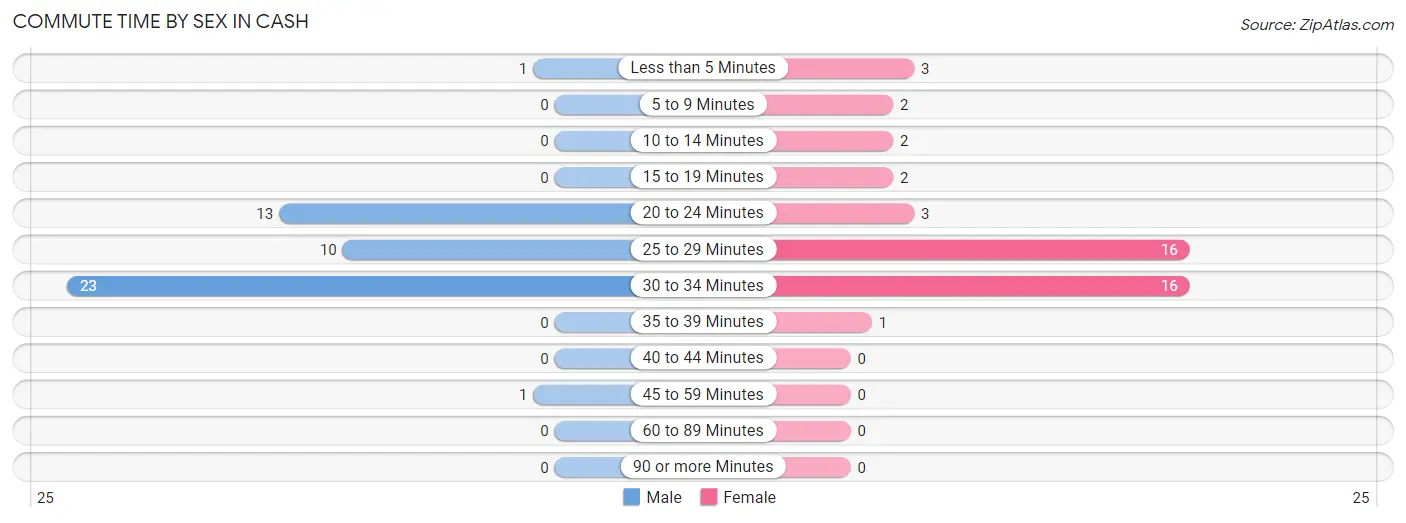
| Commute Time | Male | Female |
| Less than 5 Minutes | 1 (2.1%) | 3 (6.7%) |
| 5 to 9 Minutes | 0 (0.0%) | 2 (4.4%) |
| 10 to 14 Minutes | 0 (0.0%) | 2 (4.4%) |
| 15 to 19 Minutes | 0 (0.0%) | 2 (4.4%) |
| 20 to 24 Minutes | 13 (27.1%) | 3 (6.7%) |
| 25 to 29 Minutes | 10 (20.8%) | 16 (35.6%) |
| 30 to 34 Minutes | 23 (47.9%) | 16 (35.6%) |
| 35 to 39 Minutes | 0 (0.0%) | 1 (2.2%) |
| 40 to 44 Minutes | 0 (0.0%) | 0 (0.0%) |
| 45 to 59 Minutes | 1 (2.1%) | 0 (0.0%) |
| 60 to 89 Minutes | 0 (0.0%) | 0 (0.0%) |
| 90 or more Minutes | 0 (0.0%) | 0 (0.0%) |
Time of Departure to Work by Sex in Cash
The most frequent times of departure to work in Cash are 7:00 AM to 7:29 AM (11, 22.9%) for males and 7:00 AM to 7:29 AM (14, 31.1%) for females.
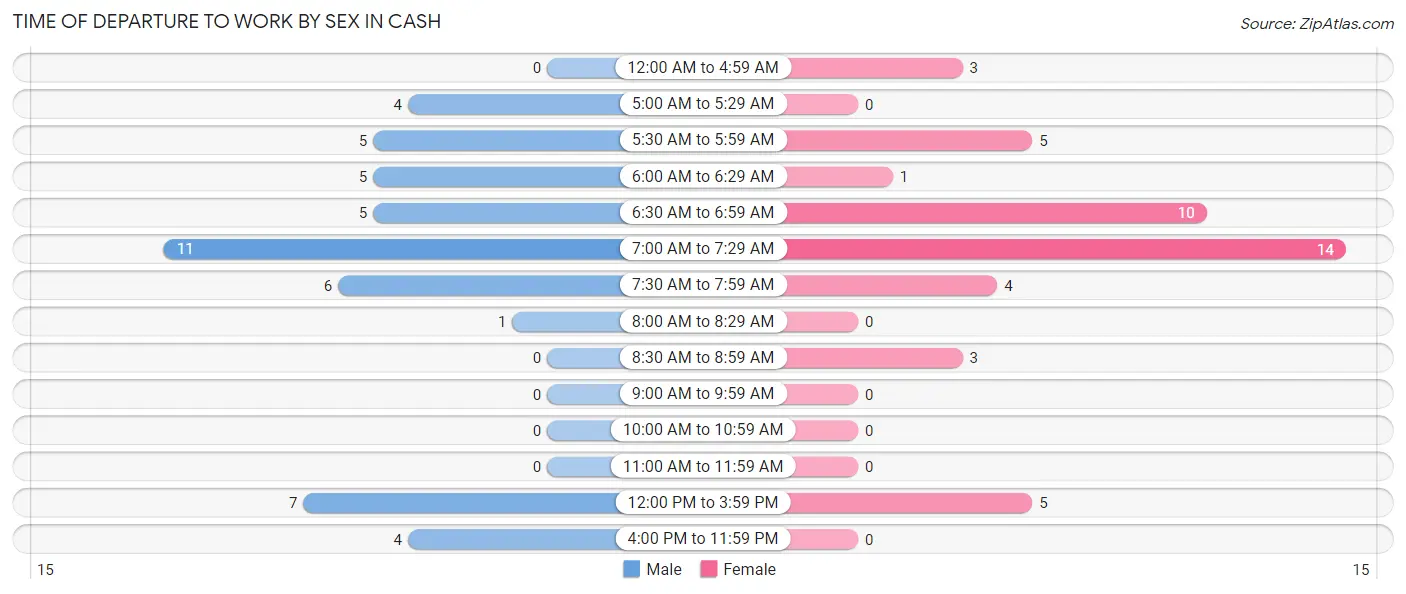
| Time of Departure | Male | Female |
| 12:00 AM to 4:59 AM | 0 (0.0%) | 3 (6.7%) |
| 5:00 AM to 5:29 AM | 4 (8.3%) | 0 (0.0%) |
| 5:30 AM to 5:59 AM | 5 (10.4%) | 5 (11.1%) |
| 6:00 AM to 6:29 AM | 5 (10.4%) | 1 (2.2%) |
| 6:30 AM to 6:59 AM | 5 (10.4%) | 10 (22.2%) |
| 7:00 AM to 7:29 AM | 11 (22.9%) | 14 (31.1%) |
| 7:30 AM to 7:59 AM | 6 (12.5%) | 4 (8.9%) |
| 8:00 AM to 8:29 AM | 1 (2.1%) | 0 (0.0%) |
| 8:30 AM to 8:59 AM | 0 (0.0%) | 3 (6.7%) |
| 9:00 AM to 9:59 AM | 0 (0.0%) | 0 (0.0%) |
| 10:00 AM to 10:59 AM | 0 (0.0%) | 0 (0.0%) |
| 11:00 AM to 11:59 AM | 0 (0.0%) | 0 (0.0%) |
| 12:00 PM to 3:59 PM | 7 (14.6%) | 5 (11.1%) |
| 4:00 PM to 11:59 PM | 4 (8.3%) | 0 (0.0%) |
| Total | 48 (100.0%) | 45 (100.0%) |
Housing Occupancy in Cash
Occupancy by Ownership in Cash
Of the total 98 dwellings in Cash, owner-occupied units account for 49 (50.0%), while renter-occupied units make up 49 (50.0%).
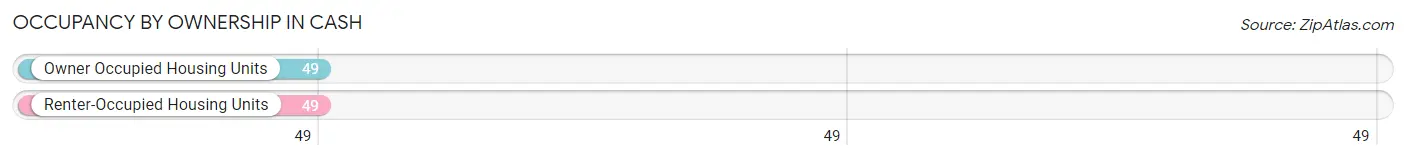
| Occupancy | # Housing Units | % Housing Units |
| Owner Occupied Housing Units | 49 | 50.0% |
| Renter-Occupied Housing Units | 49 | 50.0% |
| Total Occupied Housing Units | 98 | 100.0% |
Occupancy by Household Size in Cash
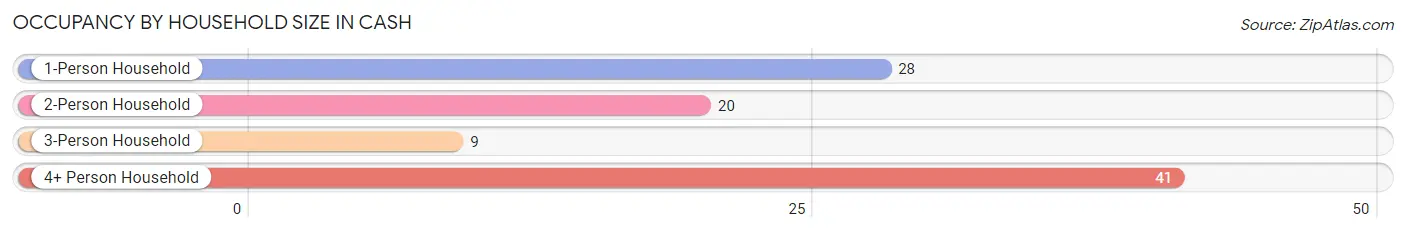
| Household Size | # Housing Units | % Housing Units |
| 1-Person Household | 28 | 28.6% |
| 2-Person Household | 20 | 20.4% |
| 3-Person Household | 9 | 9.2% |
| 4+ Person Household | 41 | 41.8% |
| Total Housing Units | 98 | 100.0% |
Occupancy by Ownership by Household Size in Cash
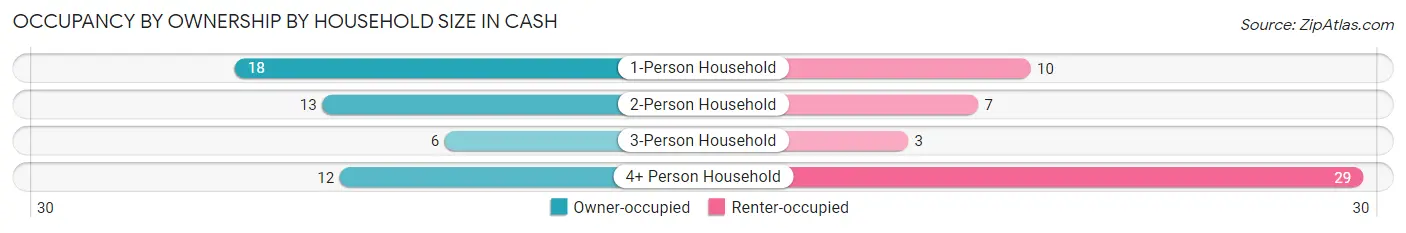
| Household Size | Owner-occupied | Renter-occupied |
| 1-Person Household | 18 (64.3%) | 10 (35.7%) |
| 2-Person Household | 13 (65.0%) | 7 (35.0%) |
| 3-Person Household | 6 (66.7%) | 3 (33.3%) |
| 4+ Person Household | 12 (29.3%) | 29 (70.7%) |
| Total Housing Units | 49 (50.0%) | 49 (50.0%) |
Occupancy by Educational Attainment in Cash
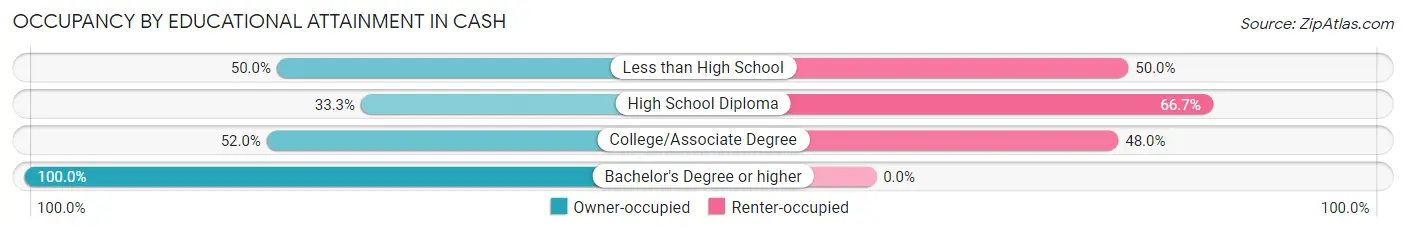
| Household Size | Owner-occupied | Renter-occupied |
| Less than High School | 11 (50.0%) | 11 (50.0%) |
| High School Diploma | 13 (33.3%) | 26 (66.7%) |
| College/Associate Degree | 13 (52.0%) | 12 (48.0%) |
| Bachelor's Degree or higher | 12 (100.0%) | 0 (0.0%) |
Occupancy by Age of Householder in Cash
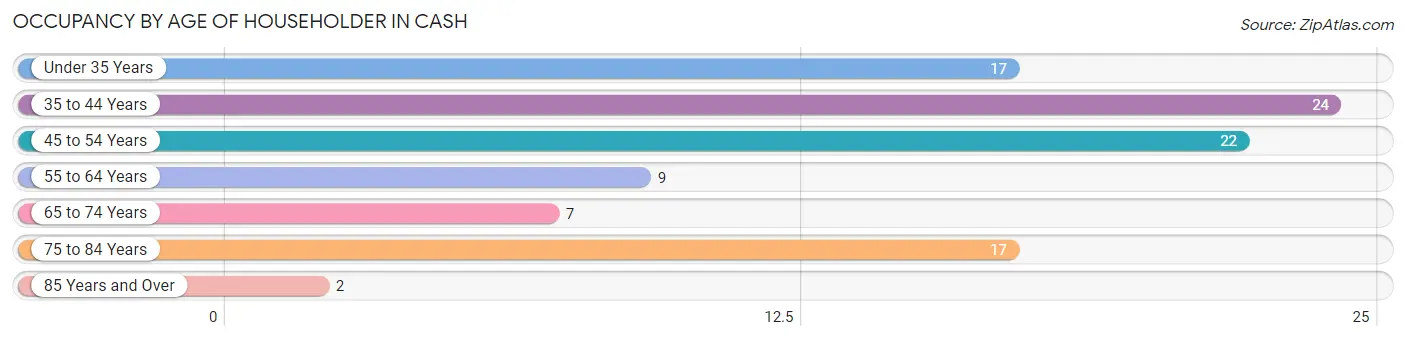
| Age Bracket | # Households | % Households |
| Under 35 Years | 17 | 17.3% |
| 35 to 44 Years | 24 | 24.5% |
| 45 to 54 Years | 22 | 22.5% |
| 55 to 64 Years | 9 | 9.2% |
| 65 to 74 Years | 7 | 7.1% |
| 75 to 84 Years | 17 | 17.3% |
| 85 Years and Over | 2 | 2.0% |
| Total | 98 | 100.0% |
Housing Finances in Cash
Median Income by Occupancy in Cash
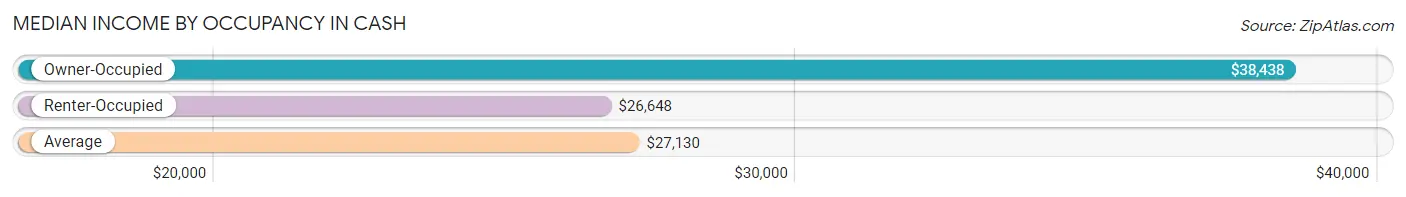
| Occupancy Type | # Households | Median Income |
| Owner-Occupied | 49 (50.0%) | $38,438 |
| Renter-Occupied | 49 (50.0%) | $26,648 |
| Average | 98 (100.0%) | $27,130 |
Occupancy by Householder Income Bracket in Cash
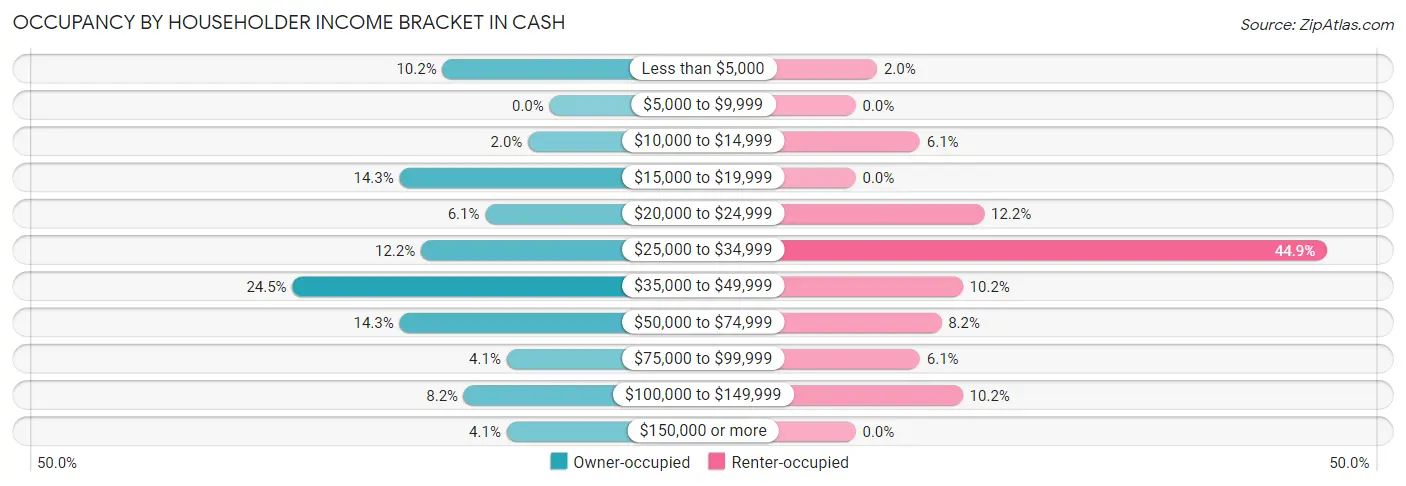
| Income Bracket | Owner-occupied | Renter-occupied |
| Less than $5,000 | 5 (10.2%) | 1 (2.0%) |
| $5,000 to $9,999 | 0 (0.0%) | 0 (0.0%) |
| $10,000 to $14,999 | 1 (2.0%) | 3 (6.1%) |
| $15,000 to $19,999 | 7 (14.3%) | 0 (0.0%) |
| $20,000 to $24,999 | 3 (6.1%) | 6 (12.2%) |
| $25,000 to $34,999 | 6 (12.2%) | 22 (44.9%) |
| $35,000 to $49,999 | 12 (24.5%) | 5 (10.2%) |
| $50,000 to $74,999 | 7 (14.3%) | 4 (8.2%) |
| $75,000 to $99,999 | 2 (4.1%) | 3 (6.1%) |
| $100,000 to $149,999 | 4 (8.2%) | 5 (10.2%) |
| $150,000 or more | 2 (4.1%) | 0 (0.0%) |
| Total | 49 (100.0%) | 49 (100.0%) |
Monthly Housing Cost Tiers in Cash
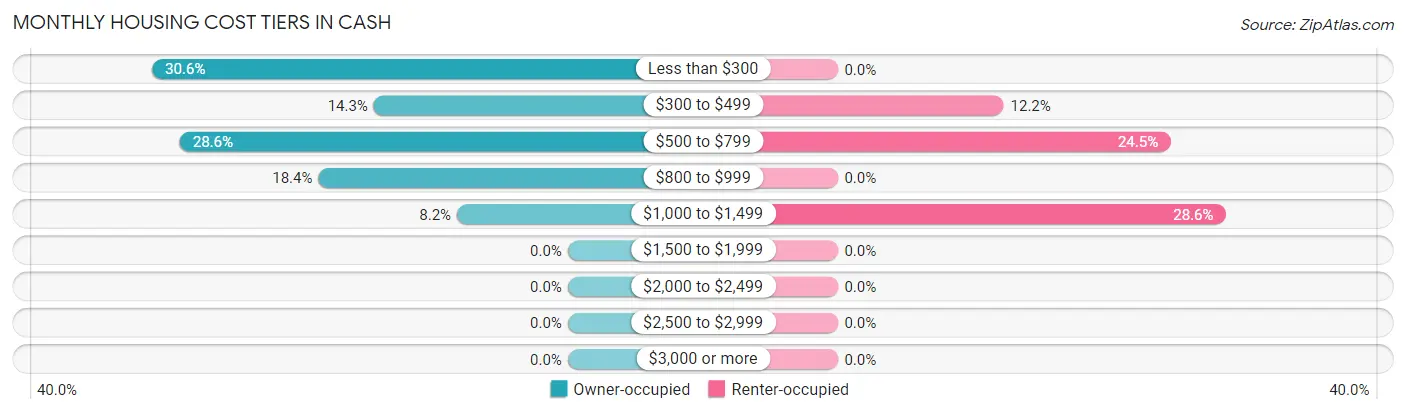
| Monthly Cost | Owner-occupied | Renter-occupied |
| Less than $300 | 15 (30.6%) | 0 (0.0%) |
| $300 to $499 | 7 (14.3%) | 6 (12.2%) |
| $500 to $799 | 14 (28.6%) | 12 (24.5%) |
| $800 to $999 | 9 (18.4%) | 0 (0.0%) |
| $1,000 to $1,499 | 4 (8.2%) | 14 (28.6%) |
| $1,500 to $1,999 | 0 (0.0%) | 0 (0.0%) |
| $2,000 to $2,499 | 0 (0.0%) | 0 (0.0%) |
| $2,500 to $2,999 | 0 (0.0%) | 0 (0.0%) |
| $3,000 or more | 0 (0.0%) | 0 (0.0%) |
| Total | 49 (100.0%) | 49 (100.0%) |
Physical Housing Characteristics in Cash
Housing Structures in Cash
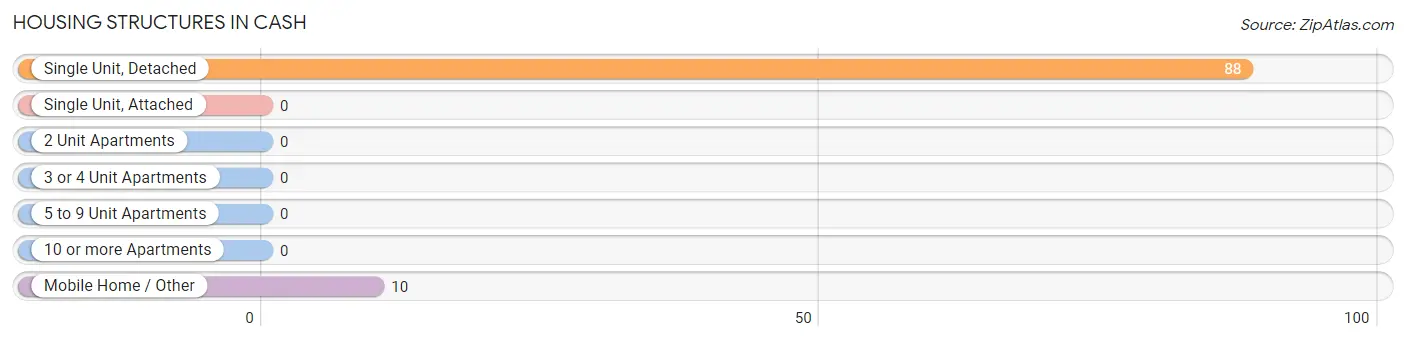
| Structure Type | # Housing Units | % Housing Units |
| Single Unit, Detached | 88 | 89.8% |
| Single Unit, Attached | 0 | 0.0% |
| 2 Unit Apartments | 0 | 0.0% |
| 3 or 4 Unit Apartments | 0 | 0.0% |
| 5 to 9 Unit Apartments | 0 | 0.0% |
| 10 or more Apartments | 0 | 0.0% |
| Mobile Home / Other | 10 | 10.2% |
| Total | 98 | 100.0% |
Housing Structures by Occupancy in Cash
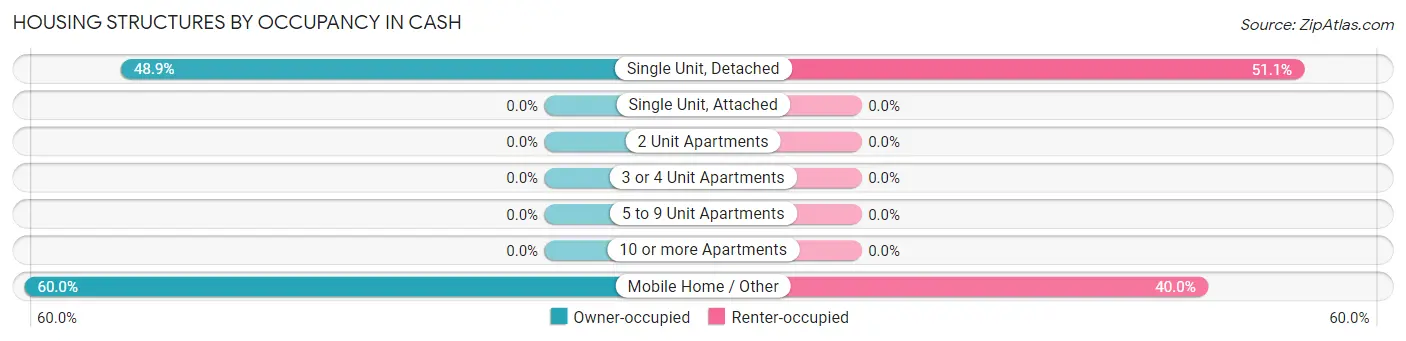
| Structure Type | Owner-occupied | Renter-occupied |
| Single Unit, Detached | 43 (48.9%) | 45 (51.1%) |
| Single Unit, Attached | 0 (0.0%) | 0 (0.0%) |
| 2 Unit Apartments | 0 (0.0%) | 0 (0.0%) |
| 3 or 4 Unit Apartments | 0 (0.0%) | 0 (0.0%) |
| 5 to 9 Unit Apartments | 0 (0.0%) | 0 (0.0%) |
| 10 or more Apartments | 0 (0.0%) | 0 (0.0%) |
| Mobile Home / Other | 6 (60.0%) | 4 (40.0%) |
| Total | 49 (50.0%) | 49 (50.0%) |
Housing Structures by Number of Rooms in Cash
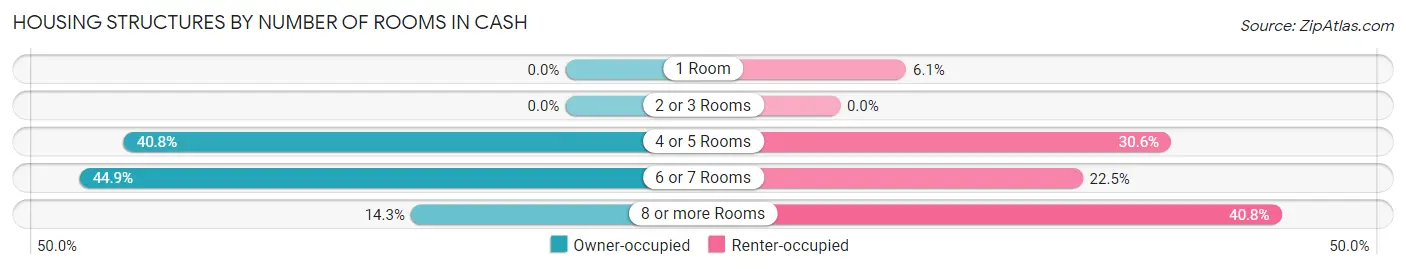
| Number of Rooms | Owner-occupied | Renter-occupied |
| 1 Room | 0 (0.0%) | 3 (6.1%) |
| 2 or 3 Rooms | 0 (0.0%) | 0 (0.0%) |
| 4 or 5 Rooms | 20 (40.8%) | 15 (30.6%) |
| 6 or 7 Rooms | 22 (44.9%) | 11 (22.5%) |
| 8 or more Rooms | 7 (14.3%) | 20 (40.8%) |
| Total | 49 (100.0%) | 49 (100.0%) |
Housing Structure by Heating Type in Cash
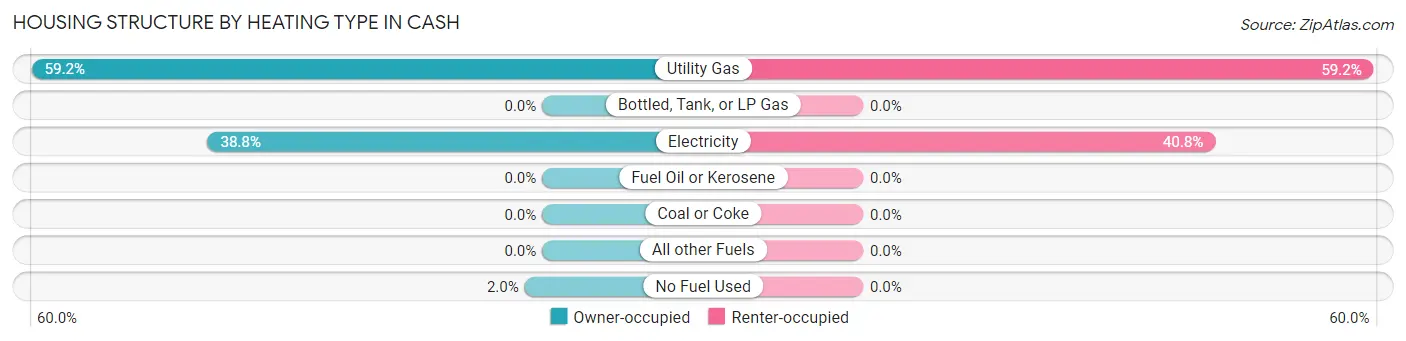
| Heating Type | Owner-occupied | Renter-occupied |
| Utility Gas | 29 (59.2%) | 29 (59.2%) |
| Bottled, Tank, or LP Gas | 0 (0.0%) | 0 (0.0%) |
| Electricity | 19 (38.8%) | 20 (40.8%) |
| Fuel Oil or Kerosene | 0 (0.0%) | 0 (0.0%) |
| Coal or Coke | 0 (0.0%) | 0 (0.0%) |
| All other Fuels | 0 (0.0%) | 0 (0.0%) |
| No Fuel Used | 1 (2.0%) | 0 (0.0%) |
| Total | 49 (100.0%) | 49 (100.0%) |
Household Vehicle Usage in Cash
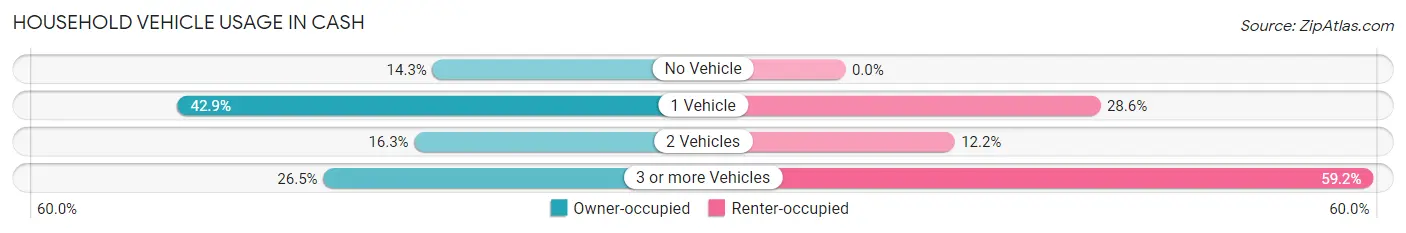
| Vehicles per Household | Owner-occupied | Renter-occupied |
| No Vehicle | 7 (14.3%) | 0 (0.0%) |
| 1 Vehicle | 21 (42.9%) | 14 (28.6%) |
| 2 Vehicles | 8 (16.3%) | 6 (12.2%) |
| 3 or more Vehicles | 13 (26.5%) | 29 (59.2%) |
| Total | 49 (100.0%) | 49 (100.0%) |
Real Estate & Mortgages in Cash
Real Estate and Mortgage Overview in Cash
| Characteristic | Without Mortgage | With Mortgage |
| Housing Units | 29 | 20 |
| Median Property Value | - | - |
| Median Household Income | $27,250 | $2 |
| Monthly Housing Costs | $296 | $0 |
| Real Estate Taxes | $199 | $0 |
Property Value by Mortgage Status in Cash
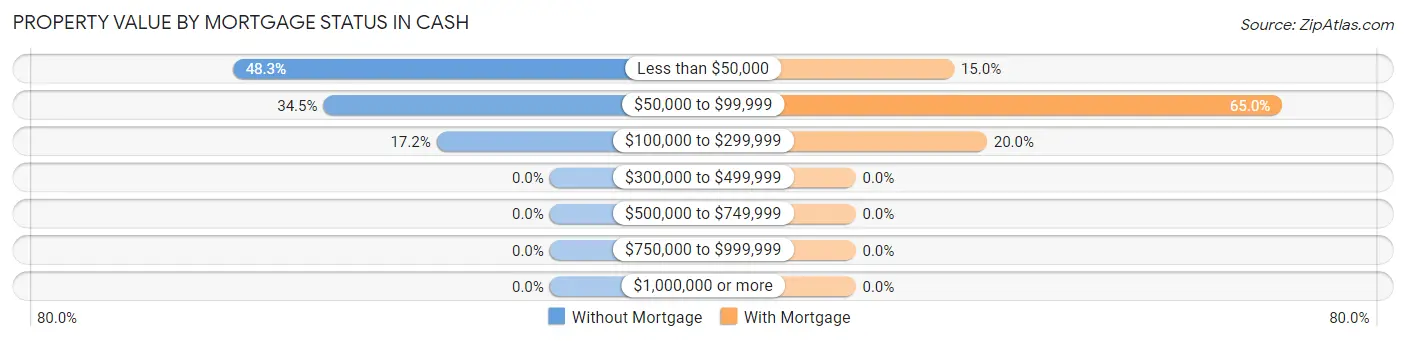
| Property Value | Without Mortgage | With Mortgage |
| Less than $50,000 | 14 (48.3%) | 3 (15.0%) |
| $50,000 to $99,999 | 10 (34.5%) | 13 (65.0%) |
| $100,000 to $299,999 | 5 (17.2%) | 4 (20.0%) |
| $300,000 to $499,999 | 0 (0.0%) | 0 (0.0%) |
| $500,000 to $749,999 | 0 (0.0%) | 0 (0.0%) |
| $750,000 to $999,999 | 0 (0.0%) | 0 (0.0%) |
| $1,000,000 or more | 0 (0.0%) | 0 (0.0%) |
| Total | 29 (100.0%) | 20 (100.0%) |
Household Income by Mortgage Status in Cash
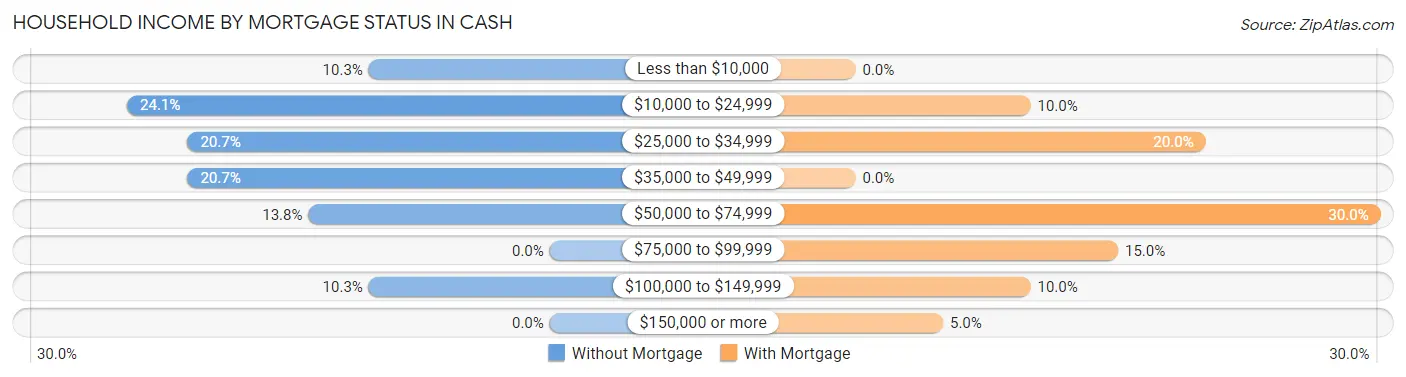
| Household Income | Without Mortgage | With Mortgage |
| Less than $10,000 | 3 (10.3%) | 0 (0.0%) |
| $10,000 to $24,999 | 7 (24.1%) | 2 (10.0%) |
| $25,000 to $34,999 | 6 (20.7%) | 4 (20.0%) |
| $35,000 to $49,999 | 6 (20.7%) | 0 (0.0%) |
| $50,000 to $74,999 | 4 (13.8%) | 6 (30.0%) |
| $75,000 to $99,999 | 0 (0.0%) | 3 (15.0%) |
| $100,000 to $149,999 | 3 (10.3%) | 2 (10.0%) |
| $150,000 or more | 0 (0.0%) | 1 (5.0%) |
| Total | 29 (100.0%) | 20 (100.0%) |
Property Value to Household Income Ratio in Cash
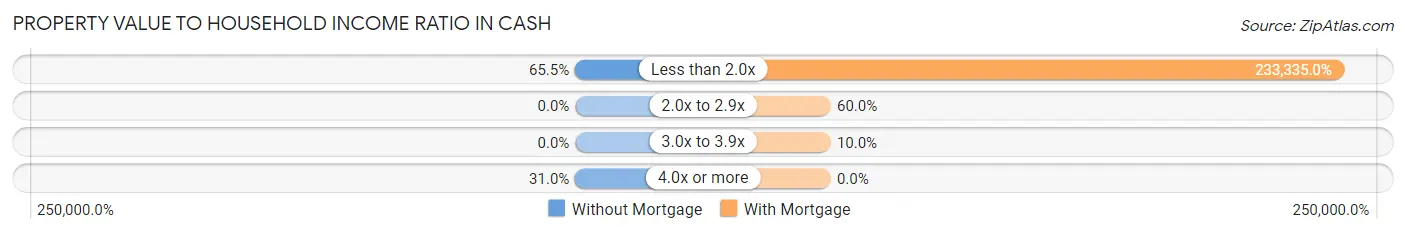
| Value-to-Income Ratio | Without Mortgage | With Mortgage |
| Less than 2.0x | 19 (65.5%) | 46,667 (233,335.0%) |
| 2.0x to 2.9x | 0 (0.0%) | 12 (60.0%) |
| 3.0x to 3.9x | 0 (0.0%) | 2 (10.0%) |
| 4.0x or more | 9 (31.0%) | 0 (0.0%) |
| Total | 29 (100.0%) | 20 (100.0%) |
Real Estate Taxes by Mortgage Status in Cash
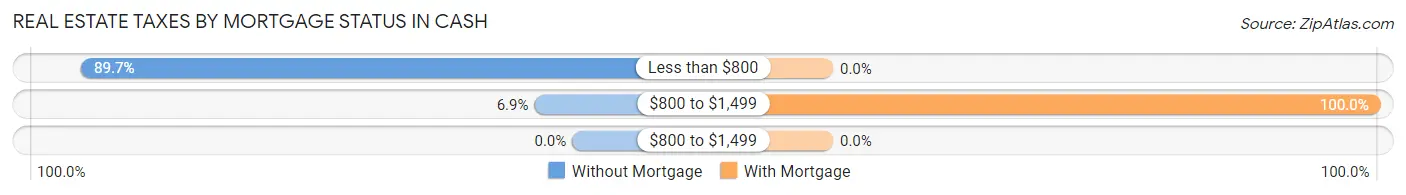
| Property Taxes | Without Mortgage | With Mortgage |
| Less than $800 | 26 (89.7%) | 0 (0.0%) |
| $800 to $1,499 | 2 (6.9%) | 20 (100.0%) |
| $800 to $1,499 | 0 (0.0%) | 0 (0.0%) |
| Total | 29 (100.0%) | 20 (100.0%) |
Health & Disability in Cash
Health Insurance Coverage by Age in Cash
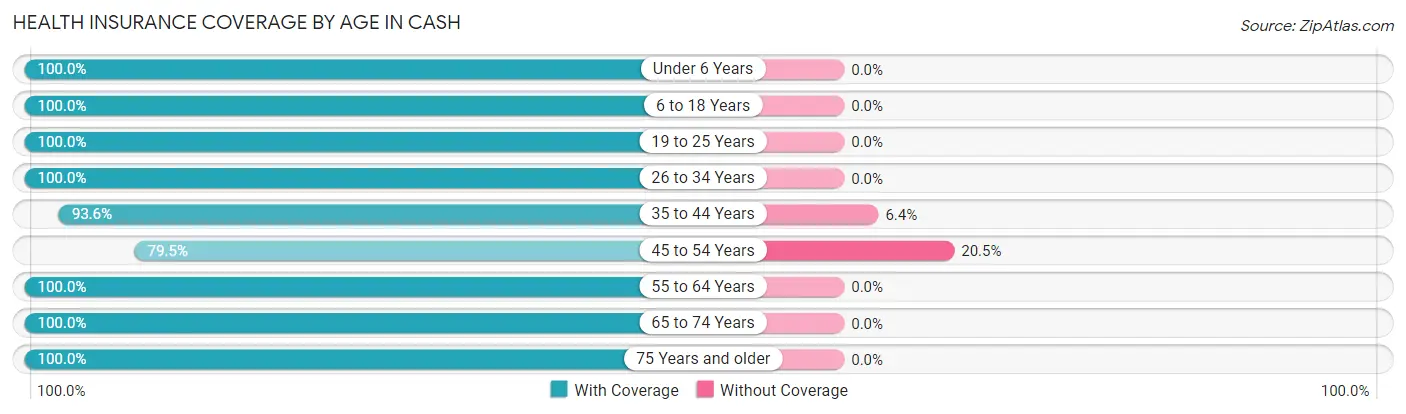
| Age Bracket | With Coverage | Without Coverage |
| Under 6 Years | 26 (100.0%) | 0 (0.0%) |
| 6 to 18 Years | 62 (100.0%) | 0 (0.0%) |
| 19 to 25 Years | 24 (100.0%) | 0 (0.0%) |
| 26 to 34 Years | 33 (100.0%) | 0 (0.0%) |
| 35 to 44 Years | 44 (93.6%) | 3 (6.4%) |
| 45 to 54 Years | 31 (79.5%) | 8 (20.5%) |
| 55 to 64 Years | 19 (100.0%) | 0 (0.0%) |
| 65 to 74 Years | 9 (100.0%) | 0 (0.0%) |
| 75 Years and older | 26 (100.0%) | 0 (0.0%) |
| Total | 274 (96.1%) | 11 (3.9%) |
Health Insurance Coverage by Citizenship Status in Cash
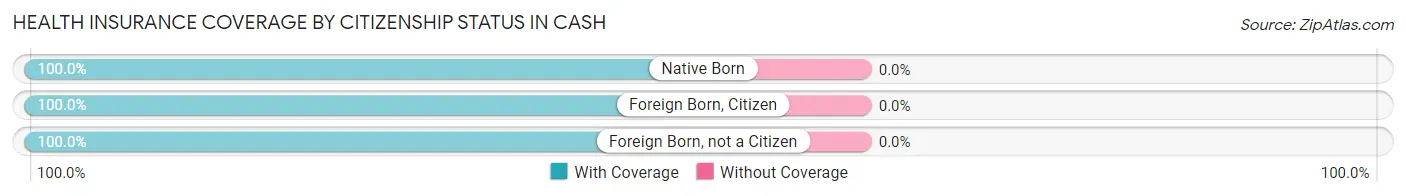
| Citizenship Status | With Coverage | Without Coverage |
| Native Born | 26 (100.0%) | 0 (0.0%) |
| Foreign Born, Citizen | 62 (100.0%) | 0 (0.0%) |
| Foreign Born, not a Citizen | 24 (100.0%) | 0 (0.0%) |
Health Insurance Coverage by Household Income in Cash
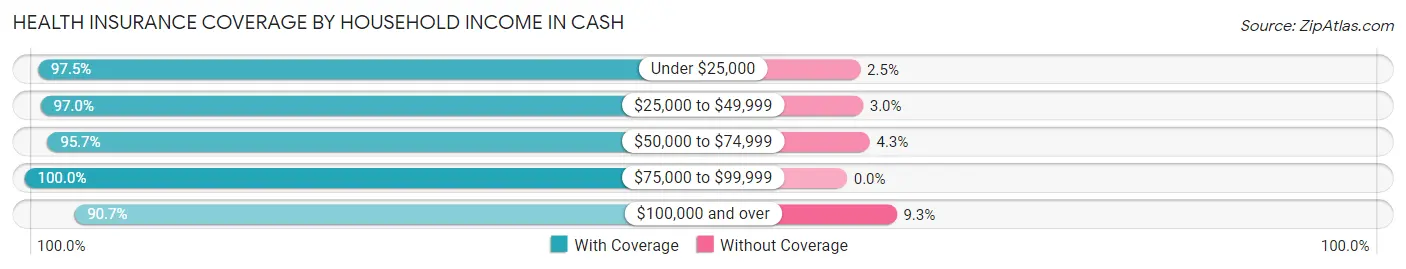
| Household Income | With Coverage | Without Coverage |
| Under $25,000 | 39 (97.5%) | 1 (2.5%) |
| $25,000 to $49,999 | 130 (97.0%) | 4 (3.0%) |
| $50,000 to $74,999 | 45 (95.7%) | 2 (4.3%) |
| $75,000 to $99,999 | 21 (100.0%) | 0 (0.0%) |
| $100,000 and over | 39 (90.7%) | 4 (9.3%) |
Public vs Private Health Insurance Coverage by Age in Cash
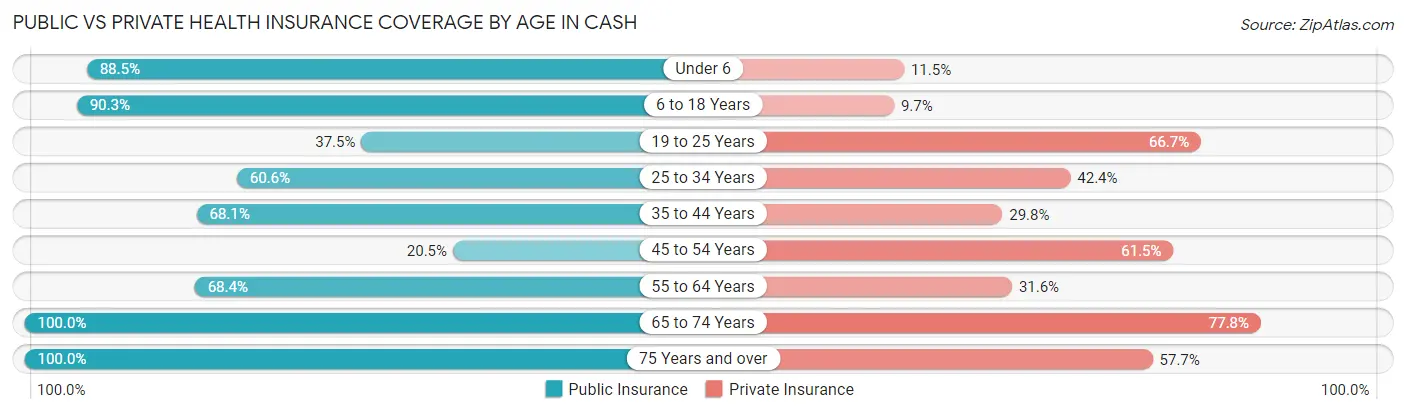
| Age Bracket | Public Insurance | Private Insurance |
| Under 6 | 23 (88.5%) | 3 (11.5%) |
| 6 to 18 Years | 56 (90.3%) | 6 (9.7%) |
| 19 to 25 Years | 9 (37.5%) | 16 (66.7%) |
| 25 to 34 Years | 20 (60.6%) | 14 (42.4%) |
| 35 to 44 Years | 32 (68.1%) | 14 (29.8%) |
| 45 to 54 Years | 8 (20.5%) | 24 (61.5%) |
| 55 to 64 Years | 13 (68.4%) | 6 (31.6%) |
| 65 to 74 Years | 9 (100.0%) | 7 (77.8%) |
| 75 Years and over | 26 (100.0%) | 15 (57.7%) |
| Total | 196 (68.8%) | 105 (36.8%) |
Disability Status by Sex by Age in Cash
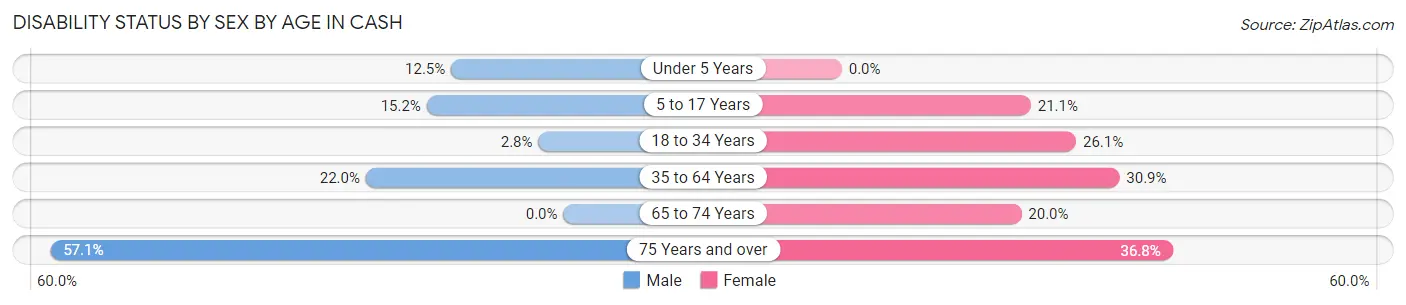
| Age Bracket | Male | Female |
| Under 5 Years | 1 (12.5%) | 0 (0.0%) |
| 5 to 17 Years | 7 (15.2%) | 4 (21.0%) |
| 18 to 34 Years | 1 (2.8%) | 6 (26.1%) |
| 35 to 64 Years | 11 (22.0%) | 17 (30.9%) |
| 65 to 74 Years | 0 (0.0%) | 1 (20.0%) |
| 75 Years and over | 4 (57.1%) | 7 (36.8%) |
Disability Class by Sex by Age in Cash
Disability Class: Hearing Difficulty
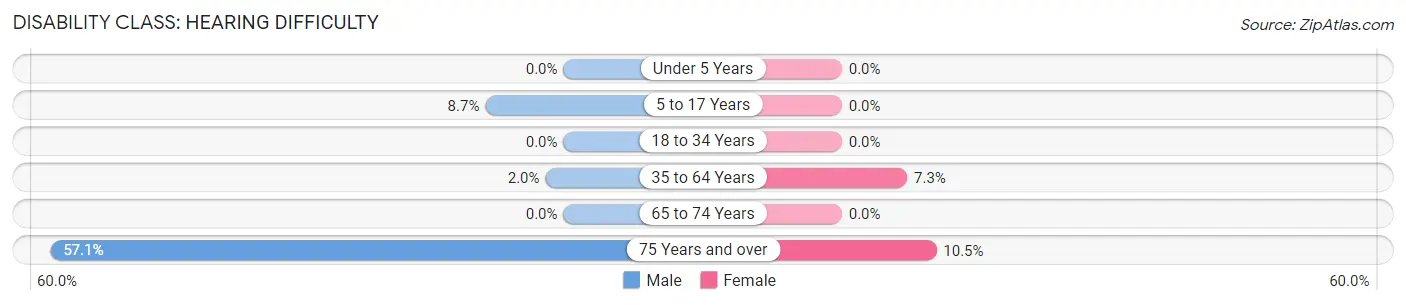
| Age Bracket | Male | Female |
| Under 5 Years | 0 (0.0%) | 0 (0.0%) |
| 5 to 17 Years | 4 (8.7%) | 0 (0.0%) |
| 18 to 34 Years | 0 (0.0%) | 0 (0.0%) |
| 35 to 64 Years | 1 (2.0%) | 4 (7.3%) |
| 65 to 74 Years | 0 (0.0%) | 0 (0.0%) |
| 75 Years and over | 4 (57.1%) | 2 (10.5%) |
Disability Class: Vision Difficulty
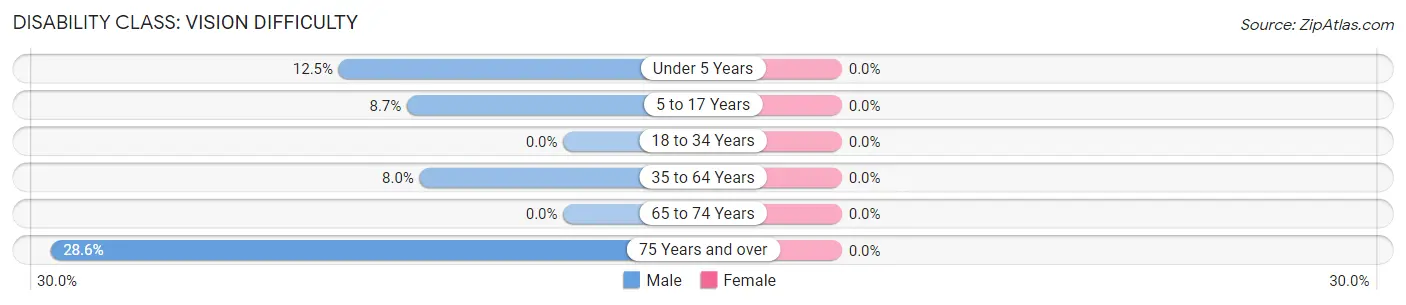
| Age Bracket | Male | Female |
| Under 5 Years | 1 (12.5%) | 0 (0.0%) |
| 5 to 17 Years | 4 (8.7%) | 0 (0.0%) |
| 18 to 34 Years | 0 (0.0%) | 0 (0.0%) |
| 35 to 64 Years | 4 (8.0%) | 0 (0.0%) |
| 65 to 74 Years | 0 (0.0%) | 0 (0.0%) |
| 75 Years and over | 2 (28.6%) | 0 (0.0%) |
Disability Class: Cognitive Difficulty
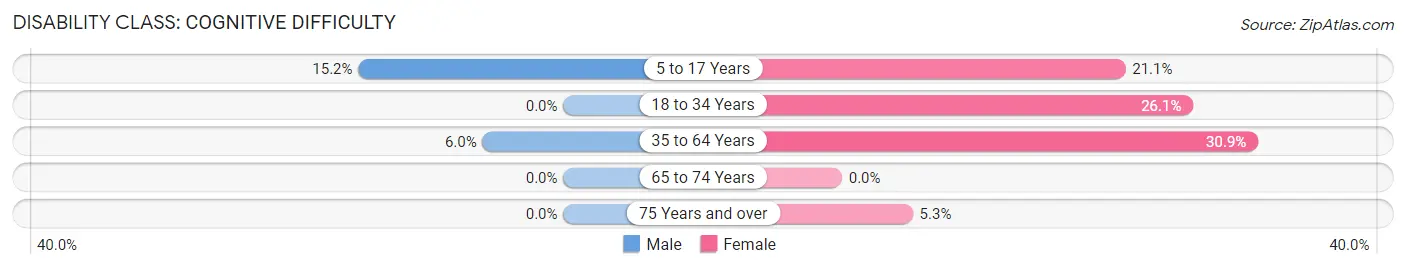
| Age Bracket | Male | Female |
| 5 to 17 Years | 7 (15.2%) | 4 (21.0%) |
| 18 to 34 Years | 0 (0.0%) | 6 (26.1%) |
| 35 to 64 Years | 3 (6.0%) | 17 (30.9%) |
| 65 to 74 Years | 0 (0.0%) | 0 (0.0%) |
| 75 Years and over | 0 (0.0%) | 1 (5.3%) |
Disability Class: Ambulatory Difficulty
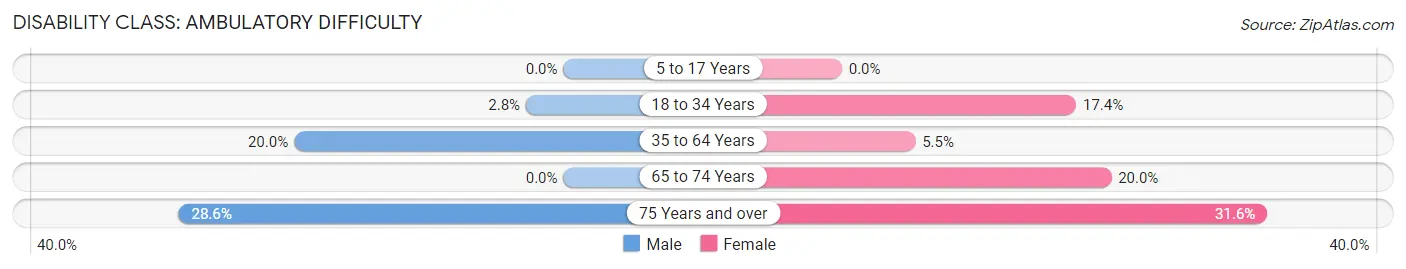
| Age Bracket | Male | Female |
| 5 to 17 Years | 0 (0.0%) | 0 (0.0%) |
| 18 to 34 Years | 1 (2.8%) | 4 (17.4%) |
| 35 to 64 Years | 10 (20.0%) | 3 (5.4%) |
| 65 to 74 Years | 0 (0.0%) | 1 (20.0%) |
| 75 Years and over | 2 (28.6%) | 6 (31.6%) |
Disability Class: Self-Care Difficulty
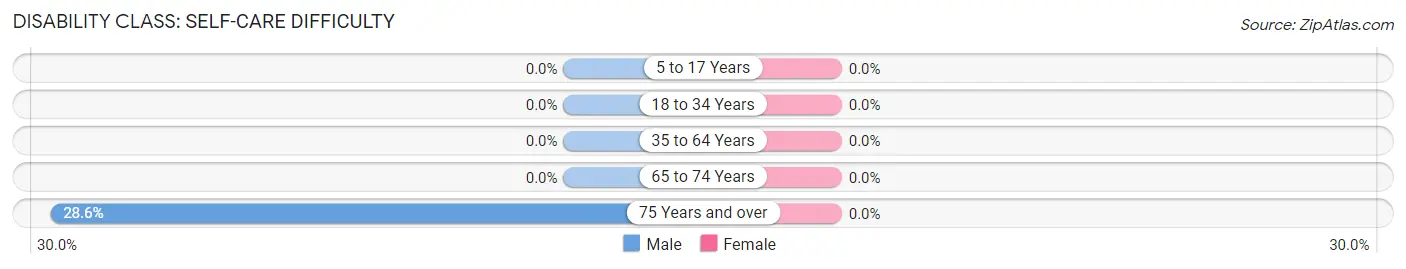
| Age Bracket | Male | Female |
| 5 to 17 Years | 0 (0.0%) | 0 (0.0%) |
| 18 to 34 Years | 0 (0.0%) | 0 (0.0%) |
| 35 to 64 Years | 0 (0.0%) | 0 (0.0%) |
| 65 to 74 Years | 0 (0.0%) | 0 (0.0%) |
| 75 Years and over | 2 (28.6%) | 0 (0.0%) |
Technology Access in Cash
Computing Device Access in Cash
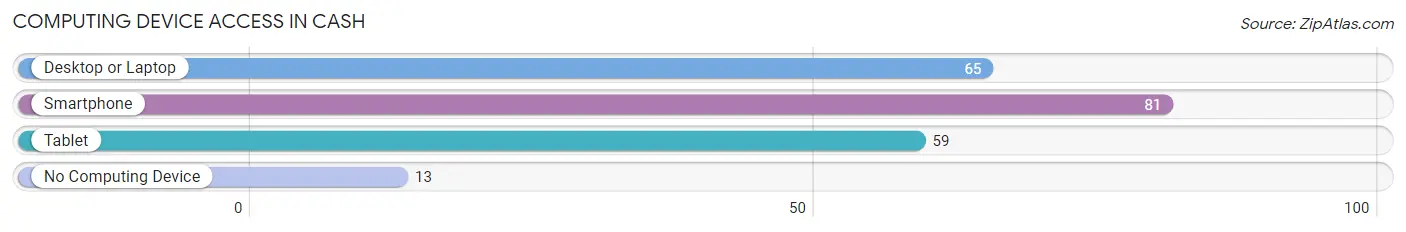
| Device Type | # Households | % Households |
| Desktop or Laptop | 65 | 66.3% |
| Smartphone | 81 | 82.7% |
| Tablet | 59 | 60.2% |
| No Computing Device | 13 | 13.3% |
| Total | 98 | 100.0% |
Internet Access in Cash
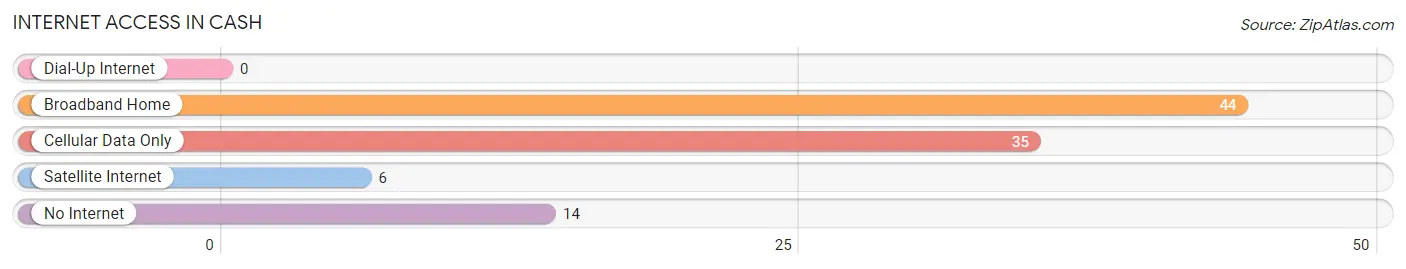
| Internet Type | # Households | % Households |
| Dial-Up Internet | 0 | 0.0% |
| Broadband Home | 44 | 44.9% |
| Cellular Data Only | 35 | 35.7% |
| Satellite Internet | 6 | 6.1% |
| No Internet | 14 | 14.3% |
| Total | 98 | 100.0% |
Cash Summary
Cash
Cash is a medium of exchange that is used to purchase goods and services. It is a physical form of money, such as coins and paper notes, that is accepted by most businesses and individuals. Cash is the most widely used form of payment in the world, and it is the most liquid form of money. Cash is also the most anonymous form of payment, as it does not require any personal information to be exchanged.
AR History
The history of Arkansas dates back to the early 19th century, when the area was part of the Louisiana Purchase. The first Europeans to explore the area were the Spanish, who arrived in the late 17th century. The French also explored the area, and in 1803, the United States acquired the area as part of the Louisiana Purchase. Arkansas became a state in 1836, and it was the 25th state to join the Union.
Arkansas has a rich history of agriculture, industry, and politics. During the Civil War, Arkansas was a Confederate state, and it was the site of several battles. After the war, the state experienced a period of economic growth, and it became a major producer of cotton, timber, and other agricultural products. In the 20th century, Arkansas became a major center for the poultry industry, and it is now one of the leading producers of poultry in the United States.
Geography
Arkansas is located in the south-central United States, and it is bordered by six states: Missouri, Tennessee, Mississippi, Louisiana, Texas, and Oklahoma. The state is divided into 75 counties, and it has a total area of 53,179 square miles. Arkansas is home to the Ozark Mountains, which are located in the northwest corner of the state. The highest point in the state is Mount Magazine, which is located in the Ozark Mountains and has an elevation of 2,753 feet.
The climate of Arkansas is generally humid and subtropical, with hot summers and mild winters. The state receives an average of 50 inches of precipitation per year, and it is prone to severe weather, such as tornadoes and floods.
Economy
The economy of Arkansas is largely based on agriculture, manufacturing, and services. The state is a major producer of poultry, soybeans, cotton, rice, and timber. Arkansas is also home to several large companies, such as Walmart, Tyson Foods, and J.B. Hunt.
The state’s economy has experienced steady growth in recent years, and it has a low unemployment rate. The state’s gross domestic product (GDP) was estimated to be $125.3 billion in 2019.
Demographics
As of 2019, the population of Arkansas was estimated to be 3.017 million. The state has a population density of 56.3 people per square mile, and it is the 32nd most populous state in the United States.
The largest racial group in Arkansas is white, which makes up 77.2% of the population. The second largest racial group is African American, which makes up 15.4% of the population. Other racial groups include Hispanic (5.3%), Asian (1.3%), and Native American (0.7%).
The median household income in Arkansas is $45,869, and the poverty rate is 17.2%. The state’s largest cities are Little Rock, Fort Smith, Fayetteville, and Springdale.
Common Questions
What is Per Capita Income in Cash?
Per Capita income in Cash is $15,299.
What is the Median Family Income in Cash?
Median Family Income in Cash is $27,163.
What is the Median Household income in Cash?
Median Household Income in Cash is $27,130.
What is Income or Wage Gap in Cash?
Income or Wage Gap in Cash is 41.7%.
Women in Cash earn 58.3 cents for every dollar earned by a man.
What is Inequality or Gini Index in Cash?
Inequality or Gini Index in Cash is 0.43.
What is the Total Population of Cash?
Total Population of Cash is 285.
What is the Total Male Population of Cash?
Total Male Population of Cash is 151.
What is the Total Female Population of Cash?
Total Female Population of Cash is 134.
What is the Ratio of Males per 100 Females in Cash?
There are 112.69 Males per 100 Females in Cash.
What is the Ratio of Females per 100 Males in Cash?
There are 88.74 Females per 100 Males in Cash.
What is the Median Population Age in Cash?
Median Population Age in Cash is 34.2 Years.
What is the Average Family Size in Cash
Average Family Size in Cash is 3.6 People.
What is the Average Household Size in Cash
Average Household Size in Cash is 2.9 People.
How Large is the Labor Force in Cash?
There are 97 People in the Labor Forcein in Cash.
What is the Percentage of People in the Labor Force in Cash?
47.8% of People are in the Labor Force in Cash.
What is the Unemployment Rate in Cash?
Unemployment Rate in Cash is 4.1%.