Turrell, AR Map & Demographics
Turrell Map
Turrell Overview
$15,479
PER CAPITA INCOME
$51,719
AVG FAMILY INCOME
$36,111
AVG HOUSEHOLD INCOME
38.9%
WAGE / INCOME GAP [ % ]
61.1¢/ $1
WAGE / INCOME GAP [ $ ]
0.45
INEQUALITY / GINI INDEX
484
TOTAL POPULATION
258
MALE POPULATION
226
FEMALE POPULATION
114.16
MALES / 100 FEMALES
87.60
FEMALES / 100 MALES
35.2
MEDIAN AGE
4.2
AVG FAMILY SIZE
3.2
AVG HOUSEHOLD SIZE
185
LABOR FORCE [ PEOPLE ]
50.0%
PERCENT IN LABOR FORCE
29.2%
UNEMPLOYMENT RATE
Turrell Zip Codes
Turrell Area Codes
Income in Turrell
Income Overview in Turrell
Per Capita Income in Turrell is $15,479, while median incomes of families and households are $51,719 and $36,111 respectively.
| Characteristic | Number | Measure |
| Per Capita Income | 484 | $15,479 |
| Median Family Income | 102 | $51,719 |
| Mean Family Income | 102 | $62,801 |
| Median Household Income | 152 | $36,111 |
| Mean Household Income | 152 | $49,093 |
| Income Deficit | 102 | $0 |
| Wage / Income Gap (%) | 484 | 38.91% |
| Wage / Income Gap ($) | 484 | 61.09¢ per $1 |
| Gini / Inequality Index | 484 | 0.45 |
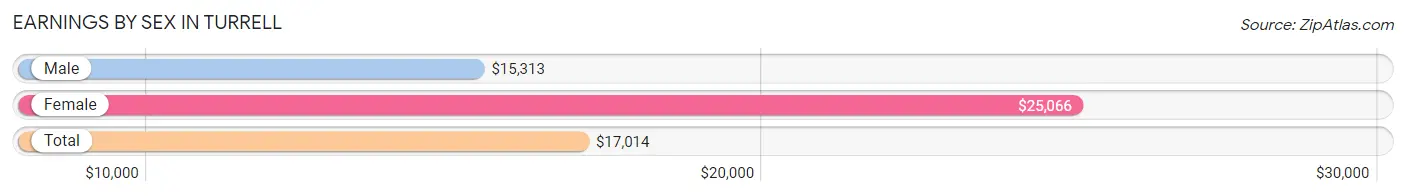
Earnings by Sex in Turrell
Average Earnings in Turrell are $17,014, $15,313 for men and $25,066 for women, a difference of 38.9%.
| Sex | Number | Average Earnings |
| Male | 108 (53.2%) | $15,313 |
| Female | 95 (46.8%) | $25,066 |
| Total | 203 (100.0%) | $17,014 |
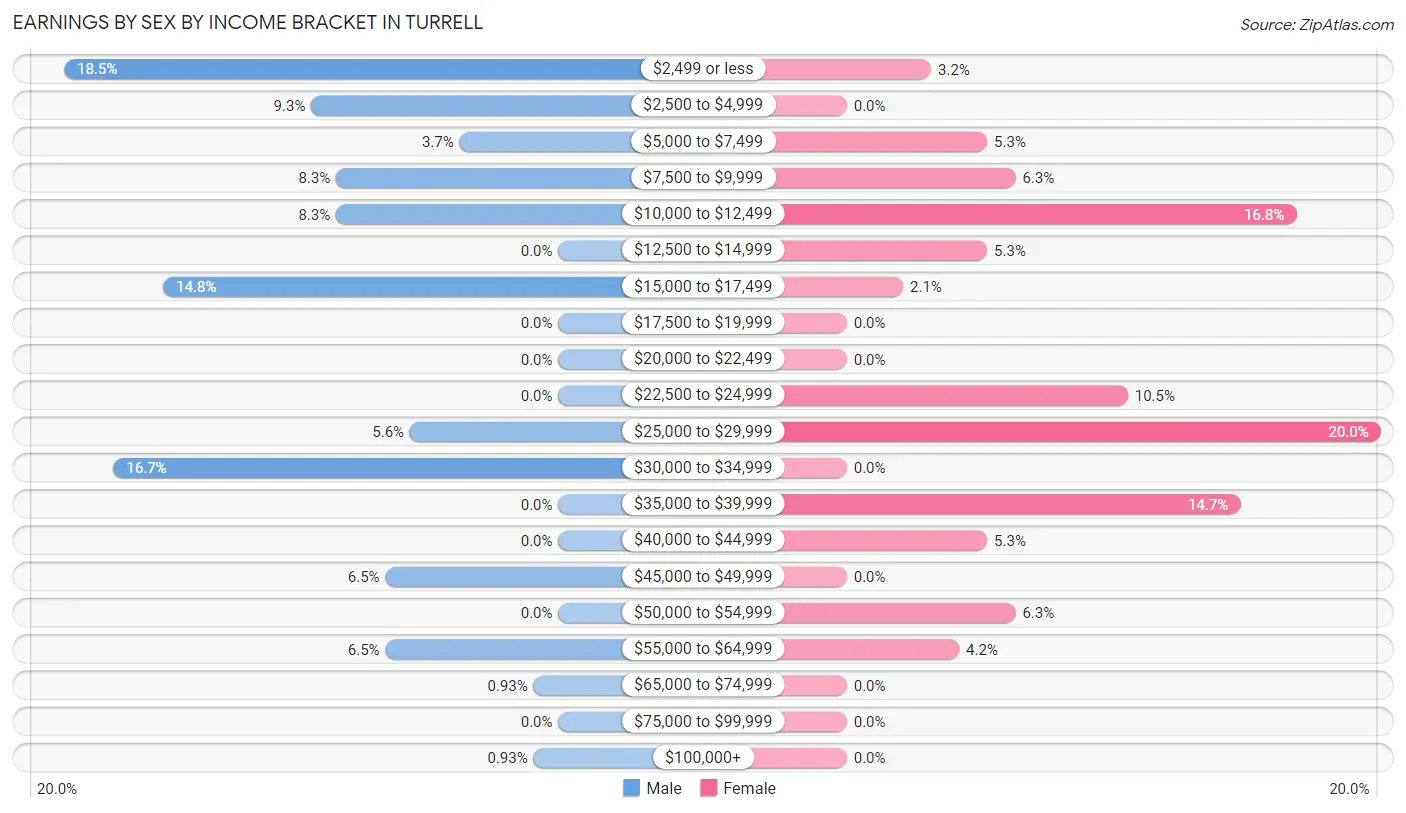
Earnings by Sex by Income Bracket in Turrell
The most common earnings brackets in Turrell are $2,499 or less for men (20 | 18.5%) and $25,000 to $29,999 for women (19 | 20.0%).
| Income | Male | Female |
| $2,499 or less | 20 (18.5%) | 3 (3.2%) |
| $2,500 to $4,999 | 10 (9.3%) | 0 (0.0%) |
| $5,000 to $7,499 | 4 (3.7%) | 5 (5.3%) |
| $7,500 to $9,999 | 9 (8.3%) | 6 (6.3%) |
| $10,000 to $12,499 | 9 (8.3%) | 16 (16.8%) |
| $12,500 to $14,999 | 0 (0.0%) | 5 (5.3%) |
| $15,000 to $17,499 | 16 (14.8%) | 2 (2.1%) |
| $17,500 to $19,999 | 0 (0.0%) | 0 (0.0%) |
| $20,000 to $22,499 | 0 (0.0%) | 0 (0.0%) |
| $22,500 to $24,999 | 0 (0.0%) | 10 (10.5%) |
| $25,000 to $29,999 | 6 (5.6%) | 19 (20.0%) |
| $30,000 to $34,999 | 18 (16.7%) | 0 (0.0%) |
| $35,000 to $39,999 | 0 (0.0%) | 14 (14.7%) |
| $40,000 to $44,999 | 0 (0.0%) | 5 (5.3%) |
| $45,000 to $49,999 | 7 (6.5%) | 0 (0.0%) |
| $50,000 to $54,999 | 0 (0.0%) | 6 (6.3%) |
| $55,000 to $64,999 | 7 (6.5%) | 4 (4.2%) |
| $65,000 to $74,999 | 1 (0.9%) | 0 (0.0%) |
| $75,000 to $99,999 | 0 (0.0%) | 0 (0.0%) |
| $100,000+ | 1 (0.9%) | 0 (0.0%) |
| Total | 108 (100.0%) | 95 (100.0%) |
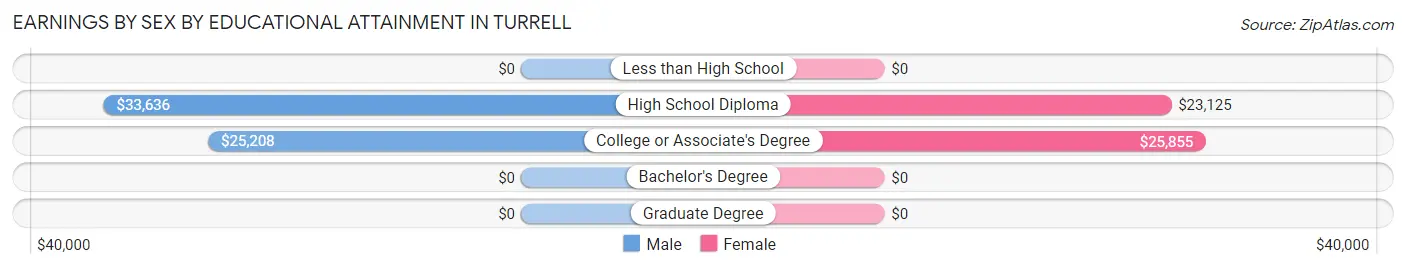
Earnings by Sex by Educational Attainment in Turrell
Average earnings in Turrell are $27,083 for men and $25,263 for women, a difference of 6.7%. Men with an educational attainment of high school diploma enjoy the highest average annual earnings of $33,636, while those with college or associate's degree education earn the least with $25,208. Women with an educational attainment of college or associate's degree earn the most with the average annual earnings of $25,855, while those with high school diploma education have the smallest earnings of $23,125.
| Educational Attainment | Male Income | Female Income |
| Less than High School | - | - |
| High School Diploma | $33,636 | $23,125 |
| College or Associate's Degree | $25,208 | $25,855 |
| Bachelor's Degree | - | - |
| Graduate Degree | - | - |
| Total | $27,083 | $25,263 |
Family Income in Turrell
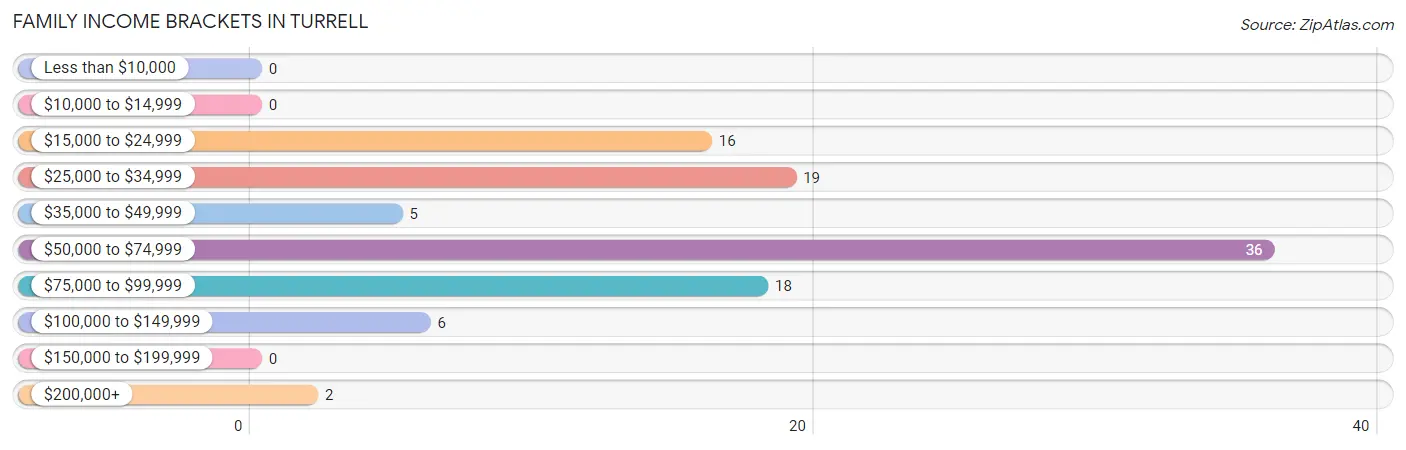
Family Income Brackets in Turrell
According to the Turrell family income data, there are 36 families falling into the $50,000 to $74,999 income range, which is the most common income bracket and makes up 35.3% of all families.
| Income Bracket | # Families | % Families |
| Less than $10,000 | 0 | 0.0% |
| $10,000 to $14,999 | 0 | 0.0% |
| $15,000 to $24,999 | 16 | 15.7% |
| $25,000 to $34,999 | 19 | 18.6% |
| $35,000 to $49,999 | 5 | 4.9% |
| $50,000 to $74,999 | 36 | 35.3% |
| $75,000 to $99,999 | 18 | 17.6% |
| $100,000 to $149,999 | 6 | 5.9% |
| $150,000 to $199,999 | 0 | 0.0% |
| $200,000+ | 2 | 2.0% |
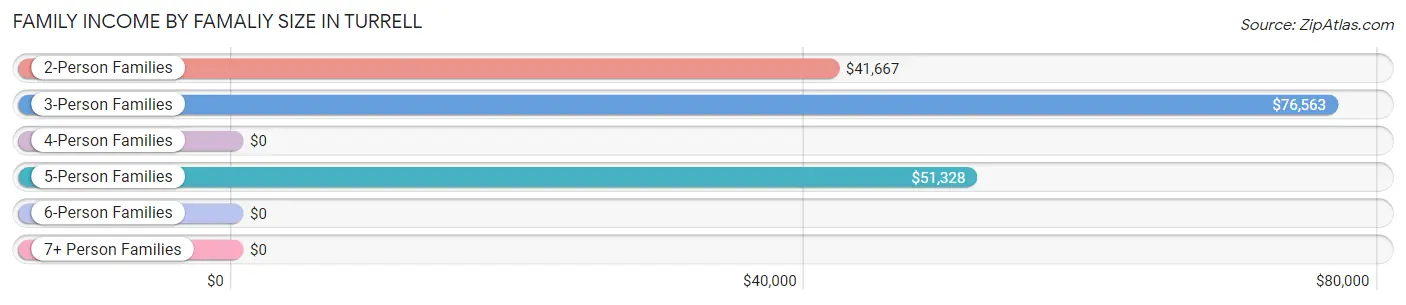
Family Income by Famaliy Size in Turrell
3-person families (17 | 16.7%) account for the highest median family income in Turrell with $76,563 per family, while 3-person families (17 | 16.7%) have the highest median income of $25,521 per family member.
| Income Bracket | # Families | Median Income |
| 2-Person Families | 28 (27.5%) | $41,667 |
| 3-Person Families | 17 (16.7%) | $76,563 |
| 4-Person Families | 5 (4.9%) | $0 |
| 5-Person Families | 49 (48.0%) | $51,328 |
| 6-Person Families | 3 (2.9%) | $0 |
| 7+ Person Families | 0 (0.0%) | $0 |
| Total | 102 (100.0%) | $51,719 |
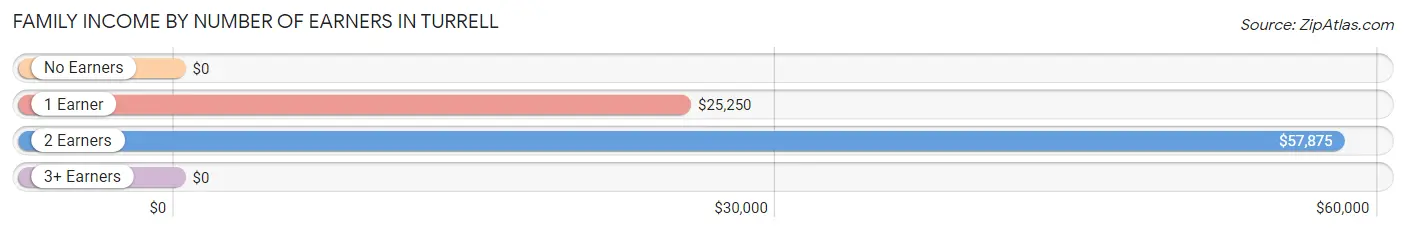
Family Income by Number of Earners in Turrell
| Number of Earners | # Families | Median Income |
| No Earners | 20 (19.6%) | $0 |
| 1 Earner | 13 (12.8%) | $25,250 |
| 2 Earners | 63 (61.8%) | $57,875 |
| 3+ Earners | 6 (5.9%) | $0 |
| Total | 102 (100.0%) | $51,719 |
Household Income in Turrell
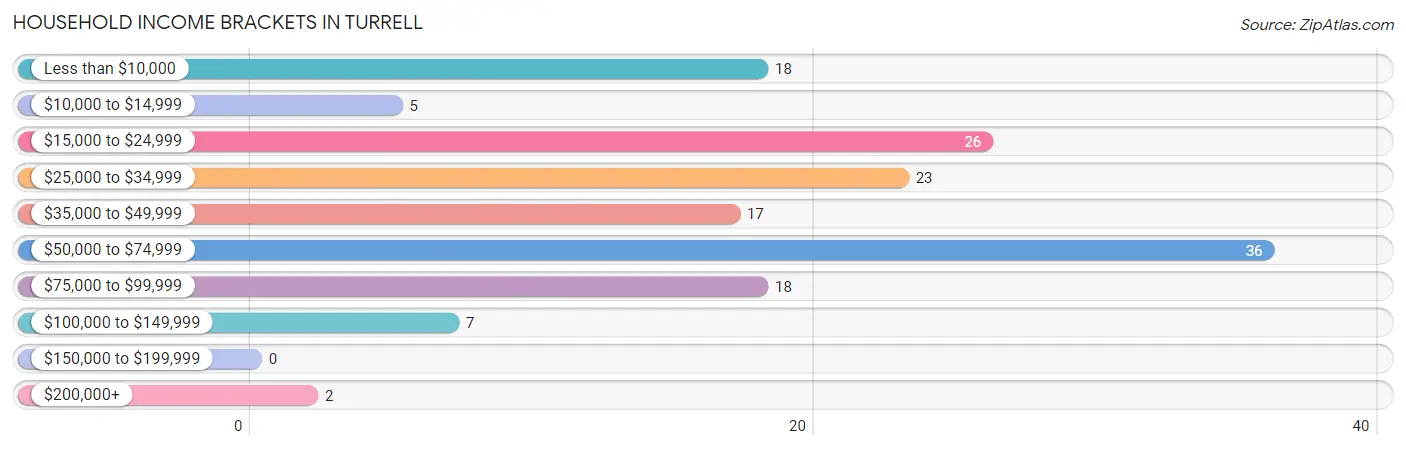
Household Income Brackets in Turrell
With 36 households falling in the category, the $50,000 to $74,999 income range is the most frequent in Turrell, accounting for 23.7% of all households.
| Income Bracket | # Households | % Households |
| Less than $10,000 | 18 | 11.8% |
| $10,000 to $14,999 | 5 | 3.3% |
| $15,000 to $24,999 | 26 | 17.1% |
| $25,000 to $34,999 | 23 | 15.1% |
| $35,000 to $49,999 | 17 | 11.2% |
| $50,000 to $74,999 | 36 | 23.7% |
| $75,000 to $99,999 | 18 | 11.8% |
| $100,000 to $149,999 | 7 | 4.6% |
| $150,000 to $199,999 | 0 | 0.0% |
| $200,000+ | 2 | 1.3% |
Household Income by Householder Age in Turrell
The median household income in Turrell is $36,111, with the highest median household income of $62,778 found in the 25 to 44 years age bracket for the primary householder. A total of 18 households (11.8%) fall into this category.
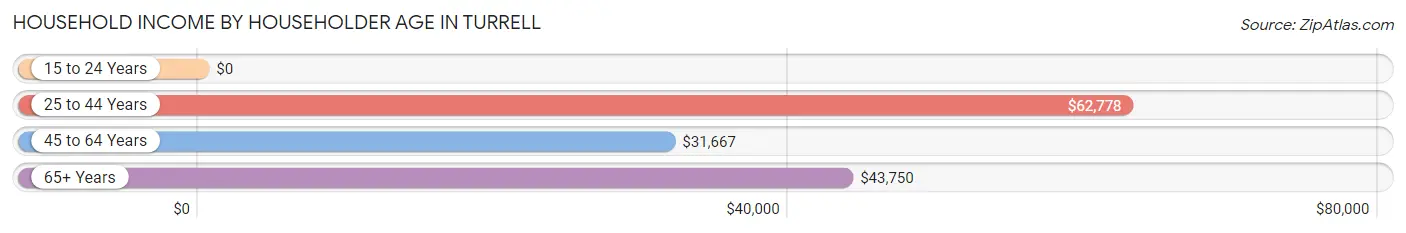
| Income Bracket | # Households | Median Income |
| 15 to 24 Years | 0 (0.0%) | $0 |
| 25 to 44 Years | 18 (11.8%) | $62,778 |
| 45 to 64 Years | 82 (53.9%) | $31,667 |
| 65+ Years | 52 (34.2%) | $43,750 |
| Total | 152 (100.0%) | $36,111 |
Poverty in Turrell
Income Below Poverty by Sex and Age in Turrell
With 33.3% poverty level for males and 31.9% for females among the residents of Turrell, 75 year old and over males and 16 and 17 year old females are the most vulnerable to poverty, with 5 males (100.0%) and 4 females (100.0%) in their respective age groups living below the poverty level.
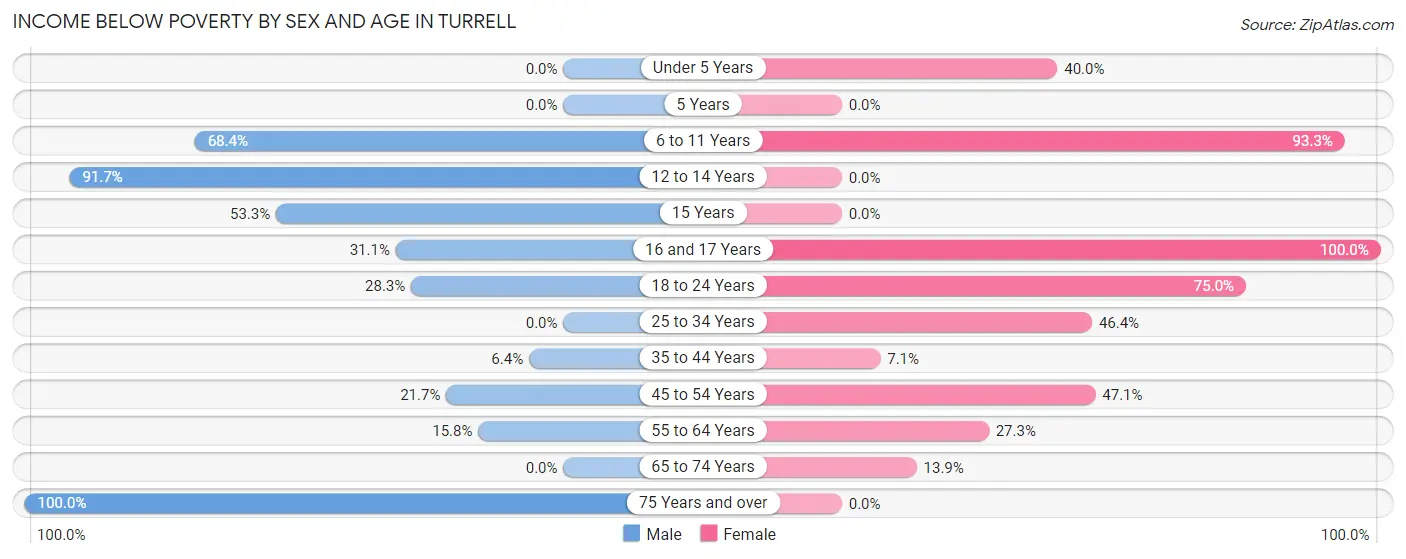
| Age Bracket | Male | Female |
| Under 5 Years | 0 (0.0%) | 6 (40.0%) |
| 5 Years | 0 (0.0%) | 0 (0.0%) |
| 6 to 11 Years | 13 (68.4%) | 14 (93.3%) |
| 12 to 14 Years | 22 (91.7%) | 0 (0.0%) |
| 15 Years | 8 (53.3%) | 0 (0.0%) |
| 16 and 17 Years | 14 (31.1%) | 4 (100.0%) |
| 18 to 24 Years | 13 (28.3%) | 3 (75.0%) |
| 25 to 34 Years | 0 (0.0%) | 13 (46.4%) |
| 35 to 44 Years | 3 (6.4%) | 2 (7.1%) |
| 45 to 54 Years | 5 (21.7%) | 16 (47.1%) |
| 55 to 64 Years | 3 (15.8%) | 9 (27.3%) |
| 65 to 74 Years | 0 (0.0%) | 5 (13.9%) |
| 75 Years and over | 5 (100.0%) | 0 (0.0%) |
| Total | 86 (33.3%) | 72 (31.9%) |
Income Above Poverty by Sex and Age in Turrell
According to the poverty statistics in Turrell, males aged under 5 years and females aged 12 to 14 years are the age groups that are most secure financially, with 100.0% of males and 100.0% of females in these age groups living above the poverty line.
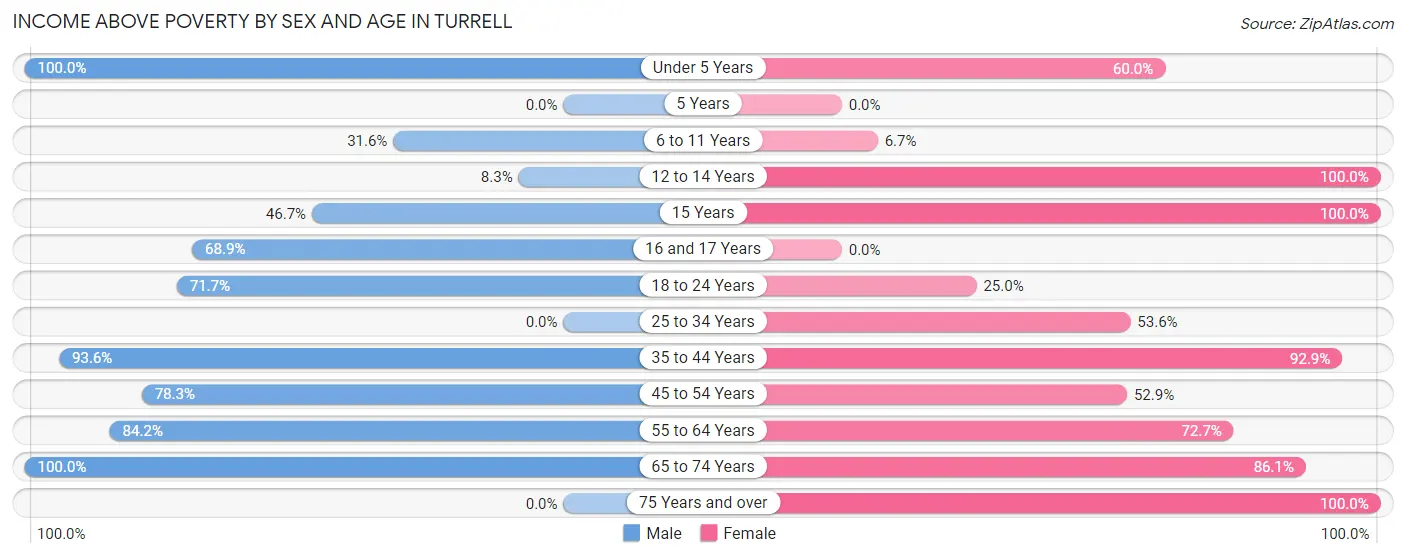
| Age Bracket | Male | Female |
| Under 5 Years | 7 (100.0%) | 9 (60.0%) |
| 5 Years | 0 (0.0%) | 0 (0.0%) |
| 6 to 11 Years | 6 (31.6%) | 1 (6.7%) |
| 12 to 14 Years | 2 (8.3%) | 9 (100.0%) |
| 15 Years | 7 (46.7%) | 10 (100.0%) |
| 16 and 17 Years | 31 (68.9%) | 0 (0.0%) |
| 18 to 24 Years | 33 (71.7%) | 1 (25.0%) |
| 25 to 34 Years | 0 (0.0%) | 15 (53.6%) |
| 35 to 44 Years | 44 (93.6%) | 26 (92.9%) |
| 45 to 54 Years | 18 (78.3%) | 18 (52.9%) |
| 55 to 64 Years | 16 (84.2%) | 24 (72.7%) |
| 65 to 74 Years | 8 (100.0%) | 31 (86.1%) |
| 75 Years and over | 0 (0.0%) | 10 (100.0%) |
| Total | 172 (66.7%) | 154 (68.1%) |
Income Below Poverty Among Married-Couple Families in Turrell
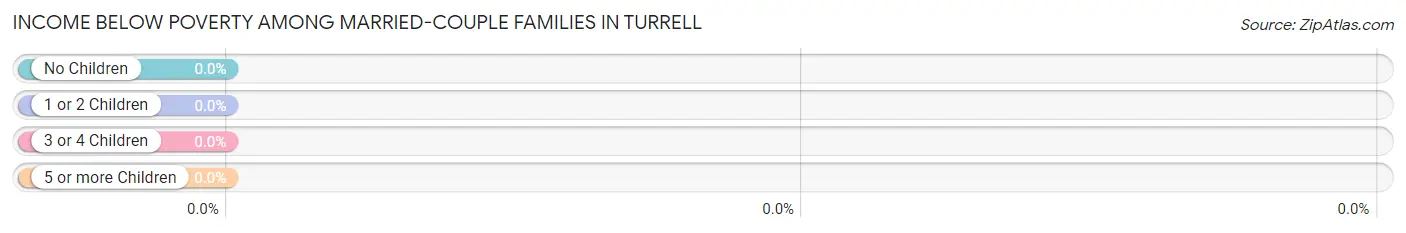
| Children | Above Poverty | Below Poverty |
| No Children | 16 (100.0%) | 0 (0.0%) |
| 1 or 2 Children | 0 (0.0%) | 0 (0.0%) |
| 3 or 4 Children | 1 (100.0%) | 0 (0.0%) |
| 5 or more Children | 0 (0.0%) | 0 (0.0%) |
| Total | 17 (100.0%) | 0 (0.0%) |
Income Below Poverty Among Single-Parent Households in Turrell
According to the poverty data in Turrell, 30.0% or 6 single-father households and 29.2% or 19 single-mother households are living below the poverty line. Among single-father households, those with 1 or 2 children have the highest poverty rate, with 6 households (54.5%) experiencing poverty. Likewise, among single-mother households, those with 3 or 4 children have the highest poverty rate, with 17 households (100.0%) falling below the poverty line.
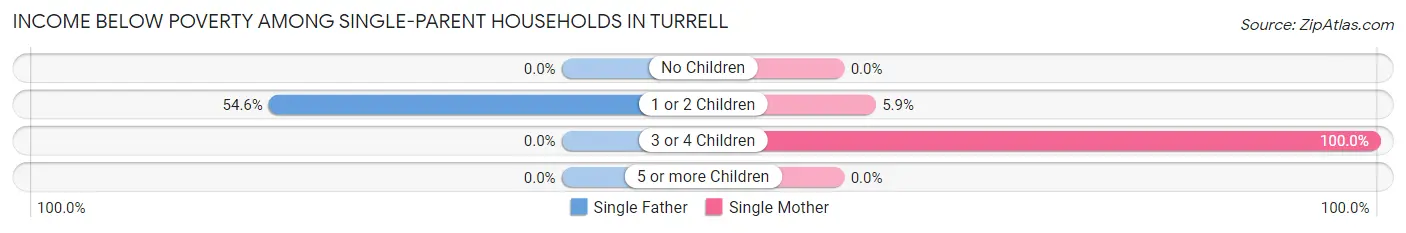
| Children | Single Father | Single Mother |
| No Children | 0 (0.0%) | 0 (0.0%) |
| 1 or 2 Children | 6 (54.5%) | 2 (5.9%) |
| 3 or 4 Children | 0 (0.0%) | 17 (100.0%) |
| 5 or more Children | 0 (0.0%) | 0 (0.0%) |
| Total | 6 (30.0%) | 19 (29.2%) |
Income Below Poverty Among Married-Couple vs Single-Parent Households in Turrell
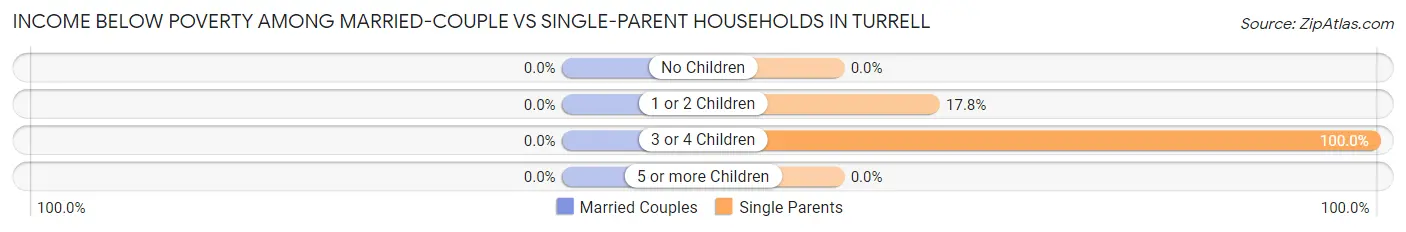
| Children | Married-Couple Families | Single-Parent Households |
| No Children | 0 (0.0%) | 0 (0.0%) |
| 1 or 2 Children | 0 (0.0%) | 8 (17.8%) |
| 3 or 4 Children | 0 (0.0%) | 17 (100.0%) |
| 5 or more Children | 0 (0.0%) | 0 (0.0%) |
| Total | 0 (0.0%) | 25 (29.4%) |
Race in Turrell
The most populous races in Turrell are Black / African American (371 | 76.6%), Two or more Races (61 | 12.6%), and White / Caucasian (52 | 10.7%).
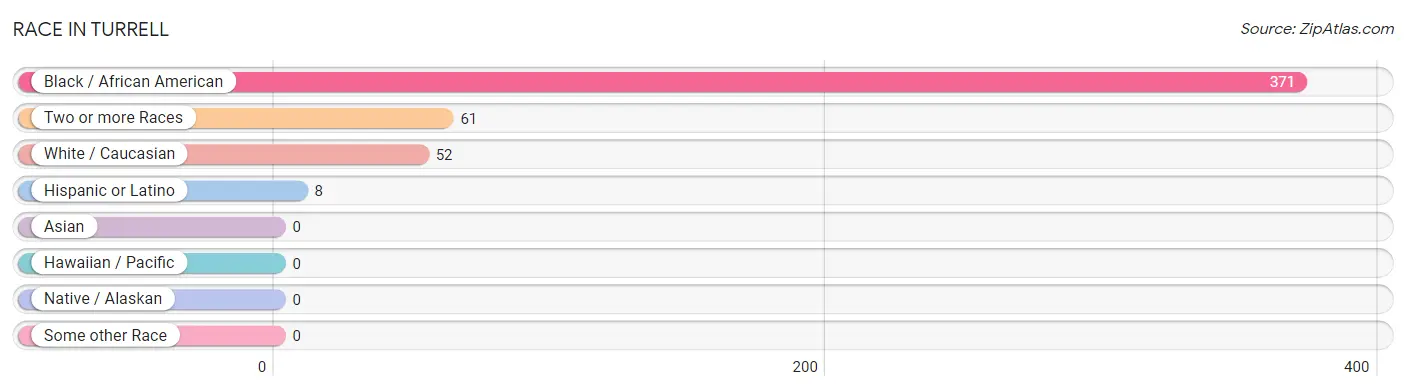
| Race | # Population | % Population |
| Asian | 0 | 0.0% |
| Black / African American | 371 | 76.6% |
| Hawaiian / Pacific | 0 | 0.0% |
| Hispanic or Latino | 8 | 1.7% |
| Native / Alaskan | 0 | 0.0% |
| White / Caucasian | 52 | 10.7% |
| Two or more Races | 61 | 12.6% |
| Some other Race | 0 | 0.0% |
| Total | 484 | 100.0% |
Ancestry in Turrell
The most populous ancestries reported in Turrell are English (43 | 8.9%), Irish (40 | 8.3%), Cherokee (35 | 7.2%), Mexican (8 | 1.7%), and Italian (4 | 0.8%), together accounting for 26.8% of all Turrell residents.
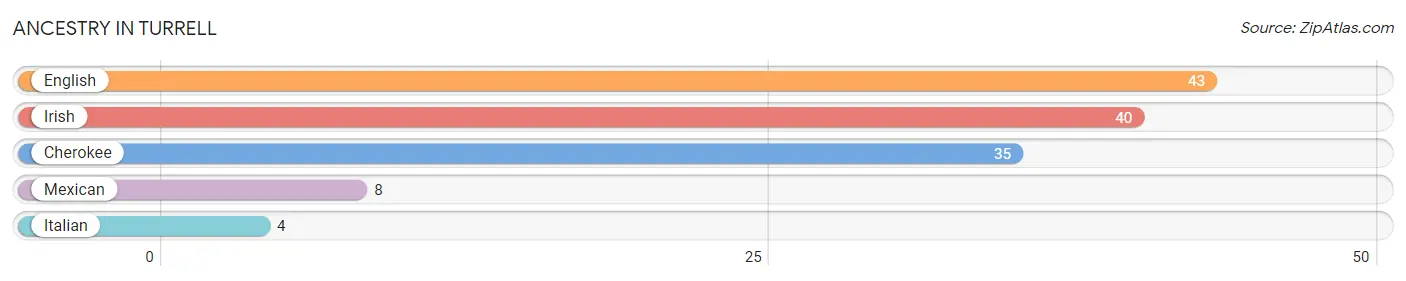
| Ancestry | # Population | % Population |
| Cherokee | 35 | 7.2% |
| English | 43 | 8.9% |
| Irish | 40 | 8.3% |
| Italian | 4 | 0.8% |
| Mexican | 8 | 1.7% | View All 5 Rows |
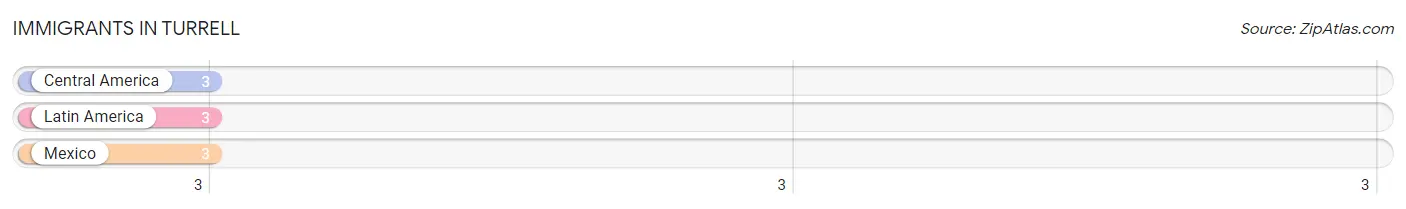
Immigrants in Turrell
The most numerous immigrant groups reported in Turrell came from Central America (3 | 0.6%), Latin America (3 | 0.6%), and Mexico (3 | 0.6%), together accounting for 1.9% of all Turrell residents.
| Immigration Origin | # Population | % Population |
| Central America | 3 | 0.6% |
| Latin America | 3 | 0.6% |
| Mexico | 3 | 0.6% | View All 3 Rows |
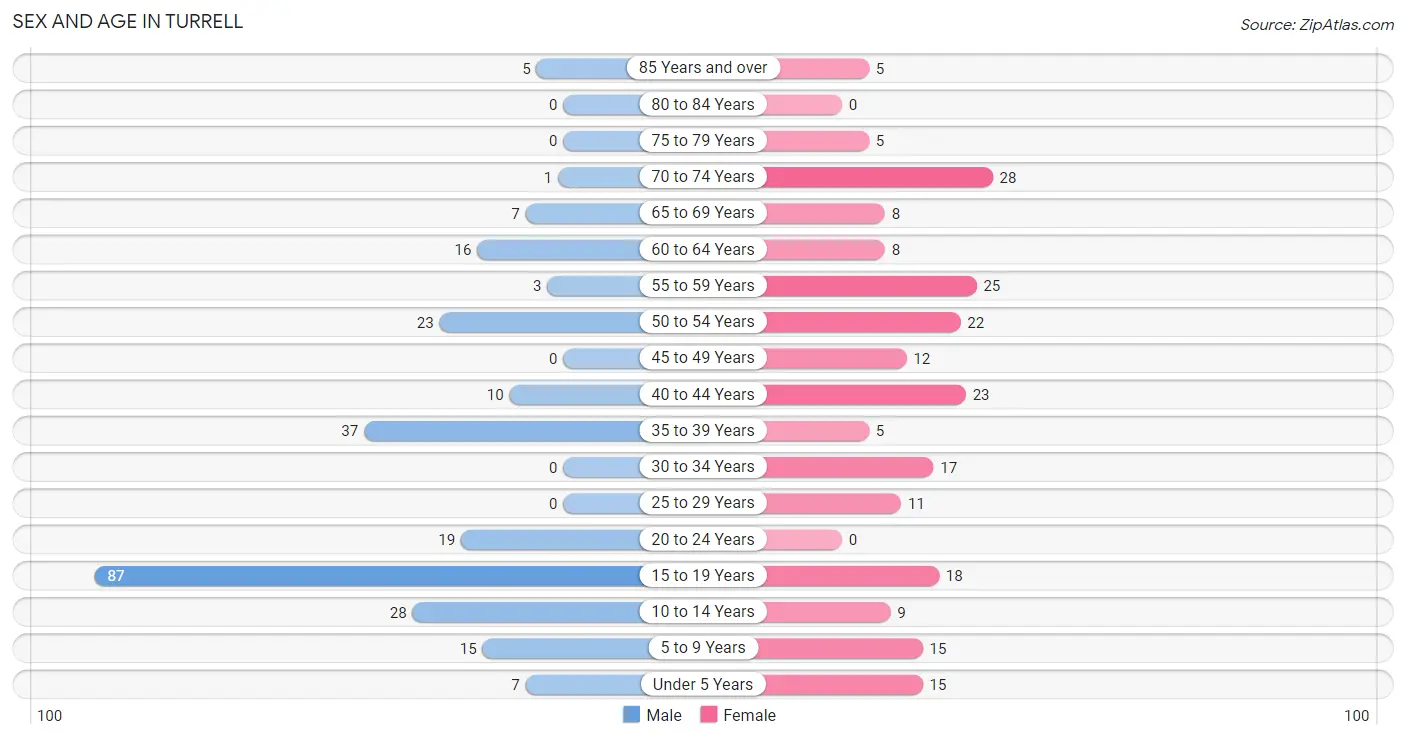
Sex and Age in Turrell
Sex and Age in Turrell
The most populous age groups in Turrell are 15 to 19 Years (87 | 33.7%) for men and 70 to 74 Years (28 | 12.4%) for women.
| Age Bracket | Male | Female |
| Under 5 Years | 7 (2.7%) | 15 (6.6%) |
| 5 to 9 Years | 15 (5.8%) | 15 (6.6%) |
| 10 to 14 Years | 28 (10.8%) | 9 (4.0%) |
| 15 to 19 Years | 87 (33.7%) | 18 (8.0%) |
| 20 to 24 Years | 19 (7.4%) | 0 (0.0%) |
| 25 to 29 Years | 0 (0.0%) | 11 (4.9%) |
| 30 to 34 Years | 0 (0.0%) | 17 (7.5%) |
| 35 to 39 Years | 37 (14.3%) | 5 (2.2%) |
| 40 to 44 Years | 10 (3.9%) | 23 (10.2%) |
| 45 to 49 Years | 0 (0.0%) | 12 (5.3%) |
| 50 to 54 Years | 23 (8.9%) | 22 (9.7%) |
| 55 to 59 Years | 3 (1.2%) | 25 (11.1%) |
| 60 to 64 Years | 16 (6.2%) | 8 (3.5%) |
| 65 to 69 Years | 7 (2.7%) | 8 (3.5%) |
| 70 to 74 Years | 1 (0.4%) | 28 (12.4%) |
| 75 to 79 Years | 0 (0.0%) | 5 (2.2%) |
| 80 to 84 Years | 0 (0.0%) | 0 (0.0%) |
| 85 Years and over | 5 (1.9%) | 5 (2.2%) |
| Total | 258 (100.0%) | 226 (100.0%) |
Families and Households in Turrell
Median Family Size in Turrell
The median family size in Turrell is 4.18 persons per family, with single female/mother families (65 | 63.7%) accounting for the largest median family size of 4.95 persons per family. On the other hand, single male/father families (20 | 19.6%) represent the smallest median family size with 2.60 persons per family.
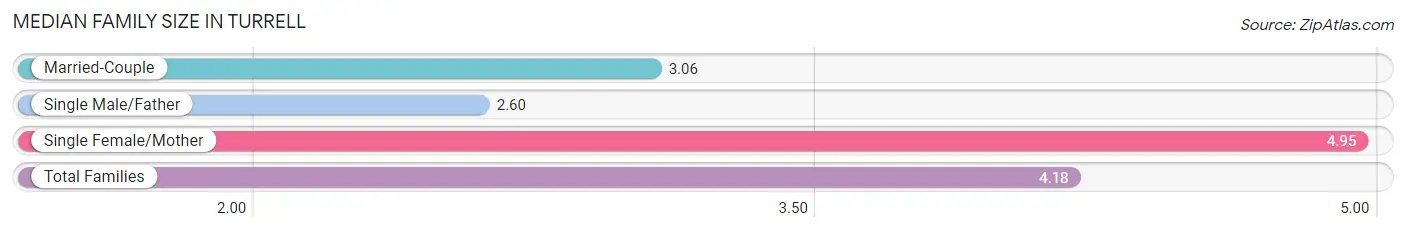
| Family Type | # Families | Family Size |
| Married-Couple | 17 (16.7%) | 3.06 |
| Single Male/Father | 20 (19.6%) | 2.60 |
| Single Female/Mother | 65 (63.7%) | 4.95 |
| Total Families | 102 (100.0%) | 4.18 |
Median Household Size in Turrell
The median household size in Turrell is 3.18 persons per household, with single female/mother households (65 | 42.8%) accounting for the largest median household size of 4.95 persons per household. non-family households (50 | 32.9%) represent the smallest median household size with 1.16 persons per household.
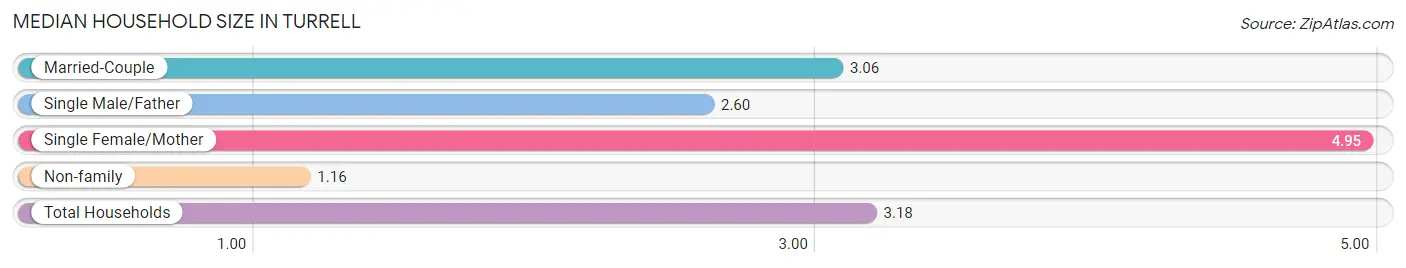
| Household Type | # Households | Household Size |
| Married-Couple | 17 (11.2%) | 3.06 |
| Single Male/Father | 20 (13.2%) | 2.60 |
| Single Female/Mother | 65 (42.8%) | 4.95 |
| Non-family | 50 (32.9%) | 1.16 |
| Total Households | 152 (100.0%) | 3.18 |
Household Size by Marriage Status in Turrell
Out of a total of 152 households in Turrell, 102 (67.1%) are family households, while 50 (32.9%) are nonfamily households. The most numerous type of family households are 5-person households, comprising 49, and the most common type of nonfamily households are 1-person households, comprising 49.
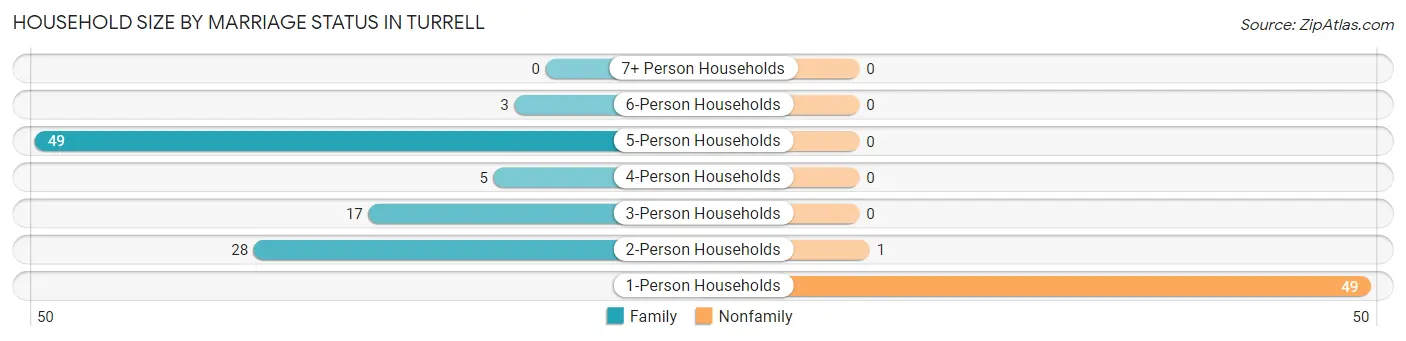
| Household Size | Family Households | Nonfamily Households |
| 1-Person Households | - | 49 (32.2%) |
| 2-Person Households | 28 (18.4%) | 1 (0.7%) |
| 3-Person Households | 17 (11.2%) | 0 (0.0%) |
| 4-Person Households | 5 (3.3%) | 0 (0.0%) |
| 5-Person Households | 49 (32.2%) | 0 (0.0%) |
| 6-Person Households | 3 (2.0%) | 0 (0.0%) |
| 7+ Person Households | 0 (0.0%) | 0 (0.0%) |
| Total | 102 (67.1%) | 50 (32.9%) |
Female Fertility in Turrell
Fertility by Age in Turrell
| Age Bracket | Women with Births | Births / 1,000 Women |
| 15 to 19 years | 0 (0.0%) | 0.0 |
| 20 to 34 years | 0 (0.0%) | 0.0 |
| 35 to 50 years | 0 (0.0%) | 0.0 |
| Total | 0 (0.0%) | 0.0 |
Fertility by Age by Marriage Status in Turrell
| Age Bracket | Married | Unmarried |
| 15 to 19 years | 0 (0.0%) | 0 (0.0%) |
| 20 to 34 years | 0 (0.0%) | 0 (0.0%) |
| 35 to 50 years | 0 (0.0%) | 0 (0.0%) |
| Total | 0 (0.0%) | 0 (0.0%) |
Fertility by Education in Turrell
| Educational Attainment | Women with Births | Births / 1,000 Women |
| Less than High School | 0 (0.0%) | 0.0 |
| High School Diploma | 0 (0.0%) | 0.0 |
| College or Associate's Degree | 0 (0.0%) | 0.0 |
| Bachelor's Degree | 0 (0.0%) | 0.0 |
| Graduate Degree | 0 (0.0%) | 0.0 |
| Total | 0 (0.0%) | 0.0 |
Fertility by Education by Marriage Status in Turrell
| Educational Attainment | Married | Unmarried |
| Less than High School | 0 (0.0%) | 0 (0.0%) |
| High School Diploma | 0 (0.0%) | 0 (0.0%) |
| College or Associate's Degree | 0 (0.0%) | 0 (0.0%) |
| Bachelor's Degree | 0 (0.0%) | 0 (0.0%) |
| Graduate Degree | 0 (0.0%) | 0 (0.0%) |
| Total | 0 (0.0%) | 0 (0.0%) |
Employment Characteristics in Turrell
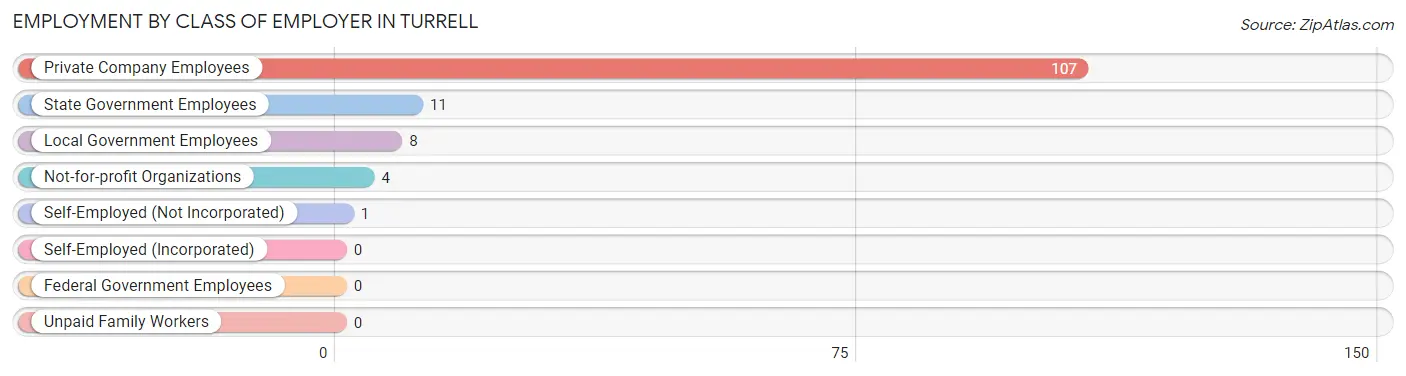
Employment by Class of Employer in Turrell
Among the 131 employed individuals in Turrell, private company employees (107 | 81.7%), state government employees (11 | 8.4%), and local government employees (8 | 6.1%) make up the most common classes of employment.
| Employer Class | # Employees | % Employees |
| Private Company Employees | 107 | 81.7% |
| Self-Employed (Incorporated) | 0 | 0.0% |
| Self-Employed (Not Incorporated) | 1 | 0.8% |
| Not-for-profit Organizations | 4 | 3.0% |
| Local Government Employees | 8 | 6.1% |
| State Government Employees | 11 | 8.4% |
| Federal Government Employees | 0 | 0.0% |
| Unpaid Family Workers | 0 | 0.0% |
| Total | 131 | 100.0% |
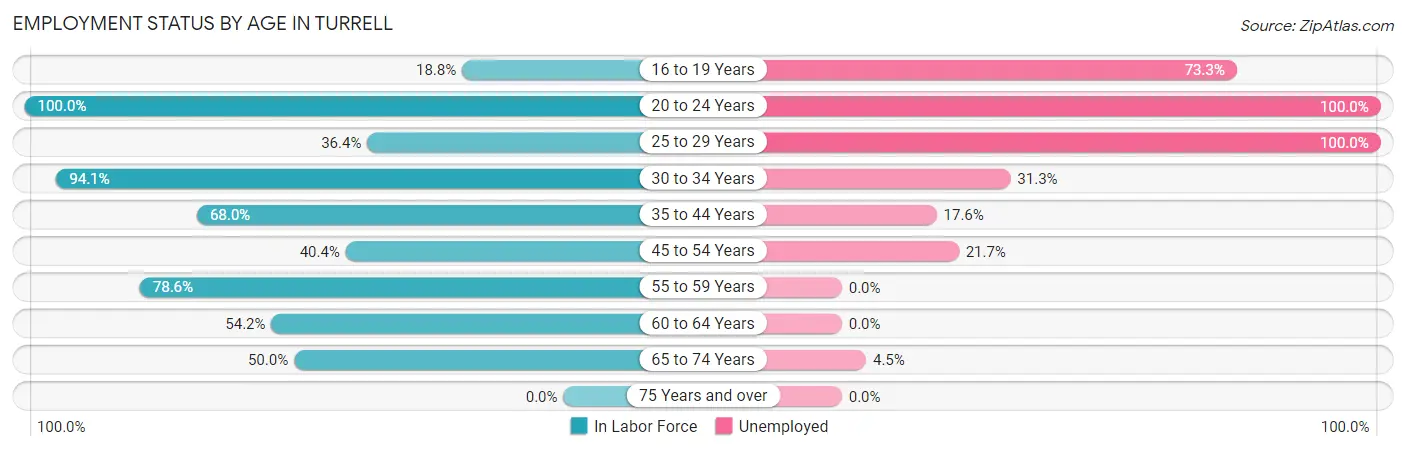
Employment Status by Age in Turrell
According to the labor force statistics for Turrell, out of the total population over 16 years of age (370), 50.0% or 185 individuals are in the labor force, with 29.2% or 54 of them unemployed. The age group with the highest labor force participation rate is 20 to 24 years, with 100.0% or 19 individuals in the labor force. Within the labor force, the 20 to 24 years age range has the highest percentage of unemployed individuals, with 100.0% or 19 of them being unemployed.
| Age Bracket | In Labor Force | Unemployed |
| 16 to 19 Years | 15 (18.8%) | 11 (73.3%) |
| 20 to 24 Years | 19 (100.0%) | 19 (100.0%) |
| 25 to 29 Years | 4 (36.4%) | 4 (100.0%) |
| 30 to 34 Years | 16 (94.1%) | 5 (31.3%) |
| 35 to 44 Years | 51 (68.0%) | 9 (17.6%) |
| 45 to 54 Years | 23 (40.4%) | 5 (21.7%) |
| 55 to 59 Years | 22 (78.6%) | 0 (0.0%) |
| 60 to 64 Years | 13 (54.2%) | 0 (0.0%) |
| 65 to 74 Years | 22 (50.0%) | 1 (4.5%) |
| 75 Years and over | 0 (0.0%) | 0 (0.0%) |
| Total | 185 (50.0%) | 54 (29.2%) |
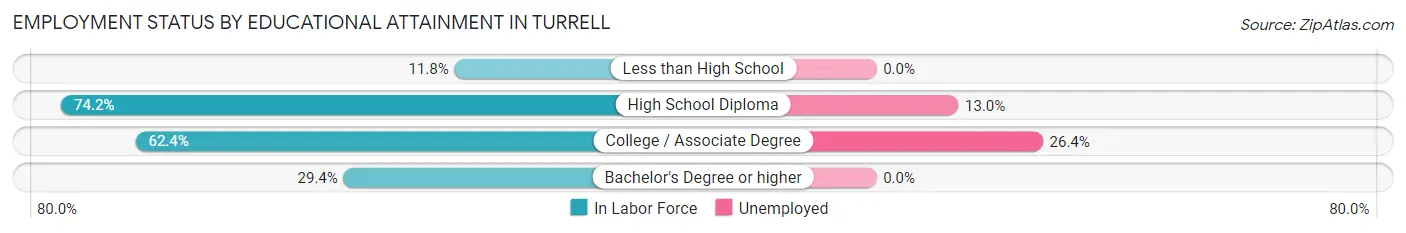
Employment Status by Educational Attainment in Turrell
According to labor force statistics for Turrell, 60.8% of individuals (129) out of the total population between 25 and 64 years of age (212) are in the labor force, with 17.8% or 23 of them being unemployed. The group with the highest labor force participation rate are those with the educational attainment of high school diploma, with 74.2% or 69 individuals in the labor force. Within the labor force, individuals with college / associate degree education have the highest percentage of unemployment, with 26.4% or 14 of them being unemployed.
| Educational Attainment | In Labor Force | Unemployed |
| Less than High School | 2 (11.8%) | 0 (0.0%) |
| High School Diploma | 69 (74.2%) | 12 (13.0%) |
| College / Associate Degree | 53 (62.4%) | 22 (26.4%) |
| Bachelor's Degree or higher | 5 (29.4%) | 0 (0.0%) |
| Total | 129 (60.8%) | 38 (17.8%) |
Employment Occupations by Sex in Turrell
Management, Business, Science and Arts Occupations
The most common Management, Business, Science and Arts occupations in Turrell are Business & Financial (7 | 5.3%), Community & Social Service (5 | 3.8%), Education, Arts & Media (5 | 3.8%), and Management (1 | 0.8%).
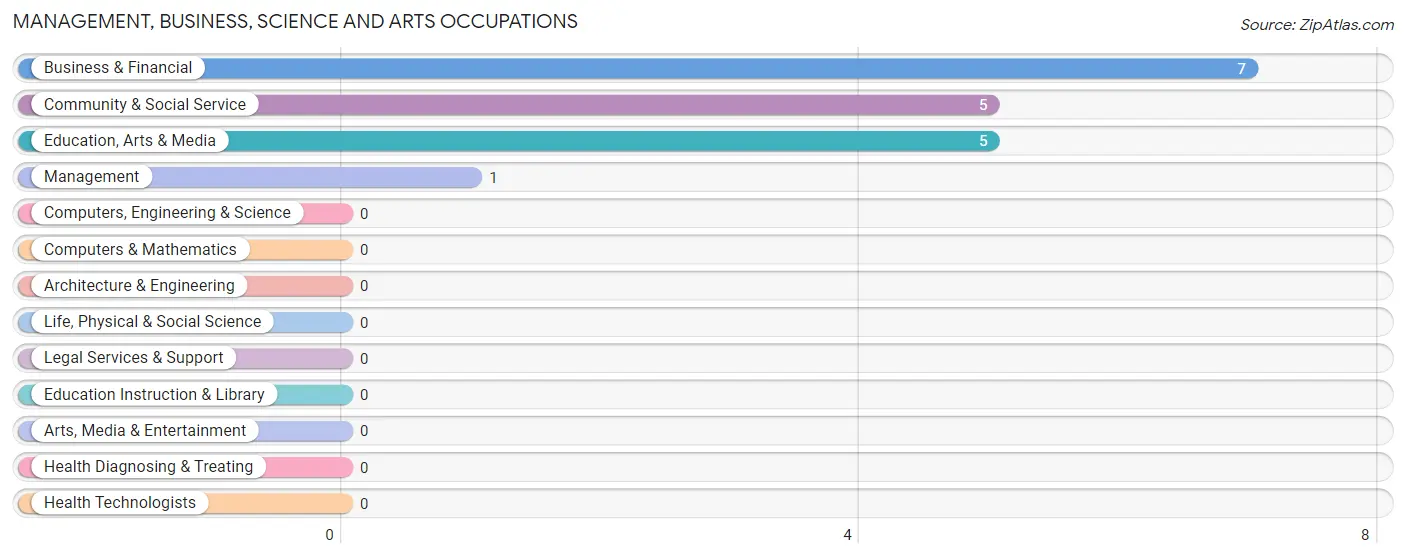
Management, Business, Science and Arts Occupations by Sex
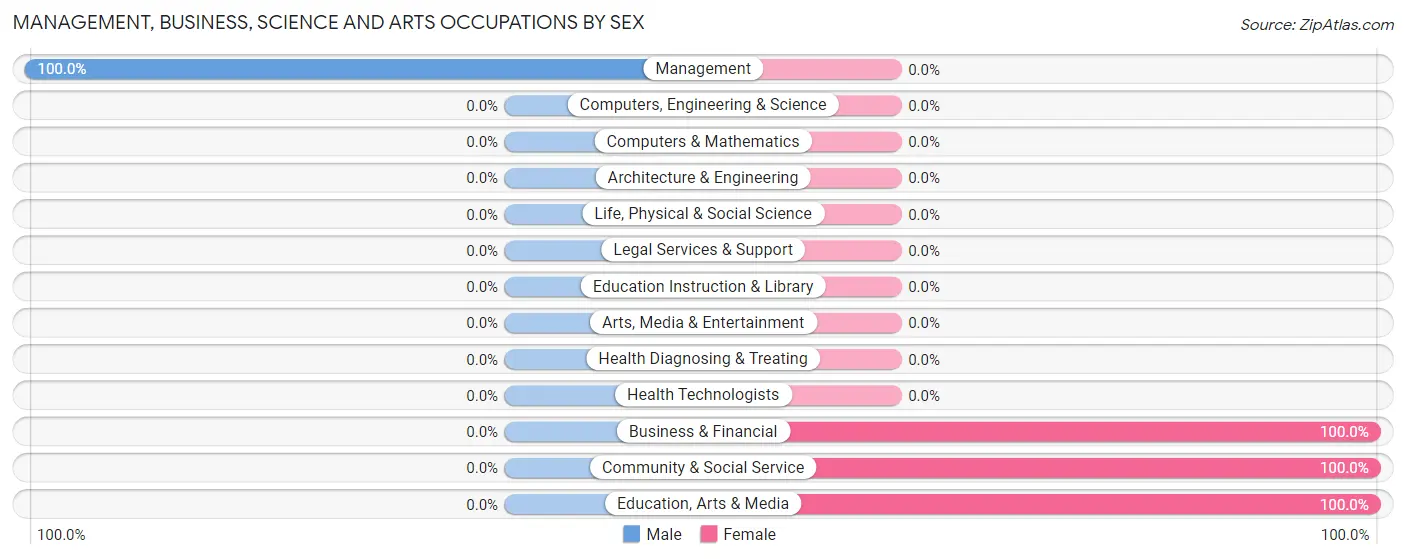
| Occupation | Male | Female |
| Management | 1 (100.0%) | 0 (0.0%) |
| Business & Financial | 0 (0.0%) | 7 (100.0%) |
| Computers, Engineering & Science | 0 (0.0%) | 0 (0.0%) |
| Computers & Mathematics | 0 (0.0%) | 0 (0.0%) |
| Architecture & Engineering | 0 (0.0%) | 0 (0.0%) |
| Life, Physical & Social Science | 0 (0.0%) | 0 (0.0%) |
| Community & Social Service | 0 (0.0%) | 5 (100.0%) |
| Education, Arts & Media | 0 (0.0%) | 5 (100.0%) |
| Legal Services & Support | 0 (0.0%) | 0 (0.0%) |
| Education Instruction & Library | 0 (0.0%) | 0 (0.0%) |
| Arts, Media & Entertainment | 0 (0.0%) | 0 (0.0%) |
| Health Diagnosing & Treating | 0 (0.0%) | 0 (0.0%) |
| Health Technologists | 0 (0.0%) | 0 (0.0%) |
| Total (Category) | 1 (7.7%) | 12 (92.3%) |
| Total (Overall) | 64 (48.8%) | 67 (51.1%) |
Services Occupations
The most common Services occupations in Turrell are Healthcare Support (16 | 12.2%), Food Preparation & Serving (8 | 6.1%), and Cleaning & Maintenance (6 | 4.6%).
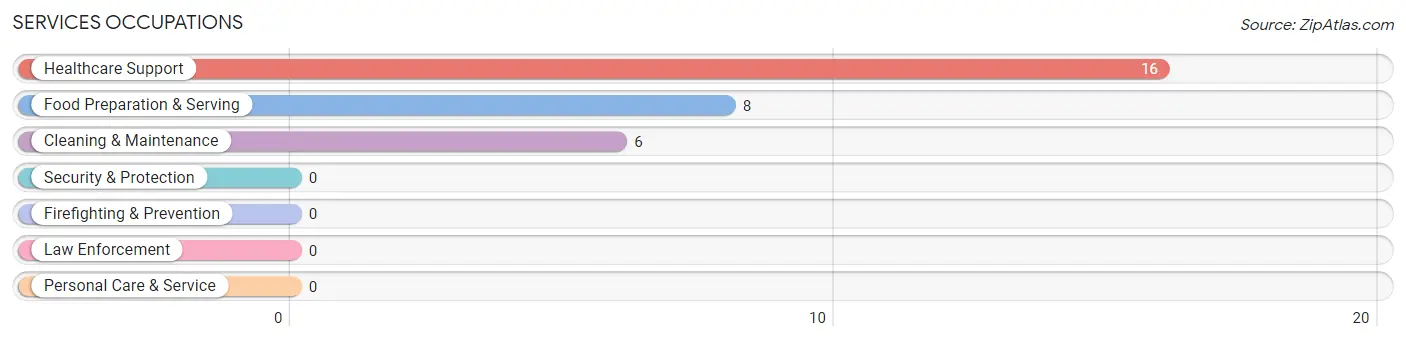
Services Occupations by Sex
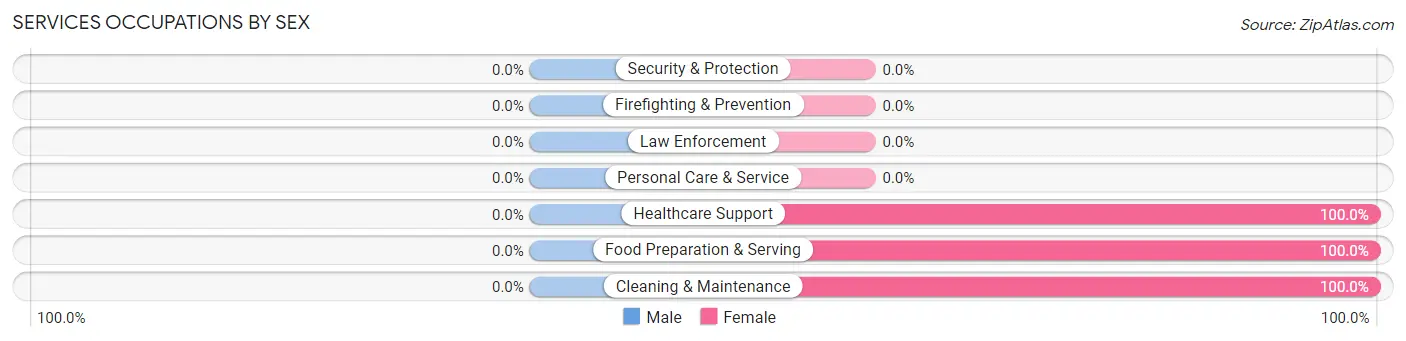
| Occupation | Male | Female |
| Healthcare Support | 0 (0.0%) | 16 (100.0%) |
| Security & Protection | 0 (0.0%) | 0 (0.0%) |
| Firefighting & Prevention | 0 (0.0%) | 0 (0.0%) |
| Law Enforcement | 0 (0.0%) | 0 (0.0%) |
| Food Preparation & Serving | 0 (0.0%) | 8 (100.0%) |
| Cleaning & Maintenance | 0 (0.0%) | 6 (100.0%) |
| Personal Care & Service | 0 (0.0%) | 0 (0.0%) |
| Total (Category) | 0 (0.0%) | 30 (100.0%) |
| Total (Overall) | 64 (48.8%) | 67 (51.1%) |
Sales and Office Occupations
The most common Sales and Office occupations in Turrell are Office & Administration (11 | 8.4%), and Sales & Related (8 | 6.1%).

Sales and Office Occupations by Sex
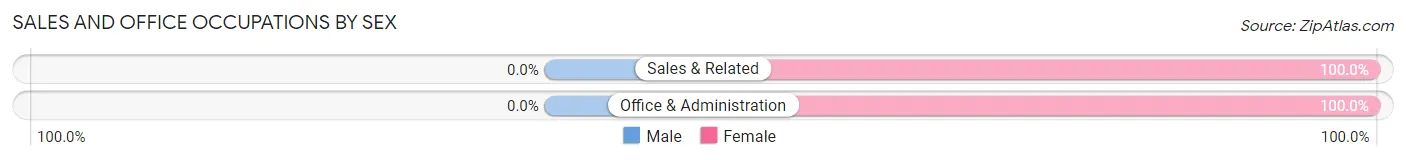
| Occupation | Male | Female |
| Sales & Related | 0 (0.0%) | 8 (100.0%) |
| Office & Administration | 0 (0.0%) | 11 (100.0%) |
| Total (Category) | 0 (0.0%) | 19 (100.0%) |
| Total (Overall) | 64 (48.8%) | 67 (51.1%) |
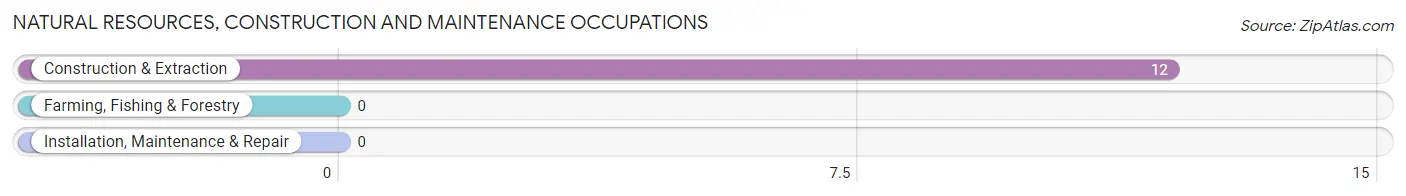
Natural Resources, Construction and Maintenance Occupations
The most common Natural Resources, Construction and Maintenance occupations in Turrell are , and Construction & Extraction (12 | 9.2%).
Natural Resources, Construction and Maintenance Occupations by Sex
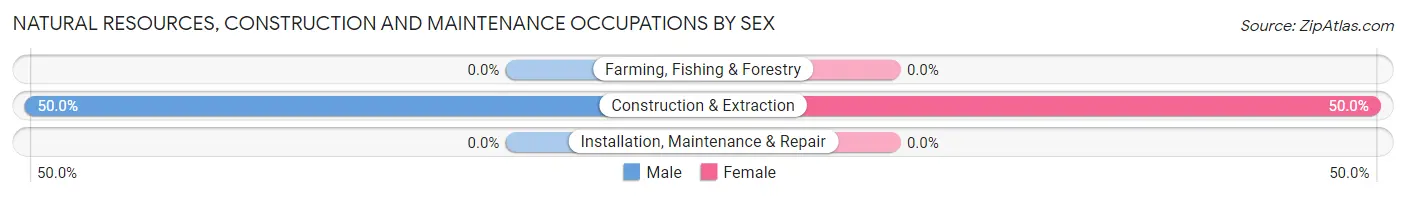
| Occupation | Male | Female |
| Farming, Fishing & Forestry | 0 (0.0%) | 0 (0.0%) |
| Construction & Extraction | 6 (50.0%) | 6 (50.0%) |
| Installation, Maintenance & Repair | 0 (0.0%) | 0 (0.0%) |
| Total (Category) | 6 (50.0%) | 6 (50.0%) |
| Total (Overall) | 64 (48.8%) | 67 (51.1%) |
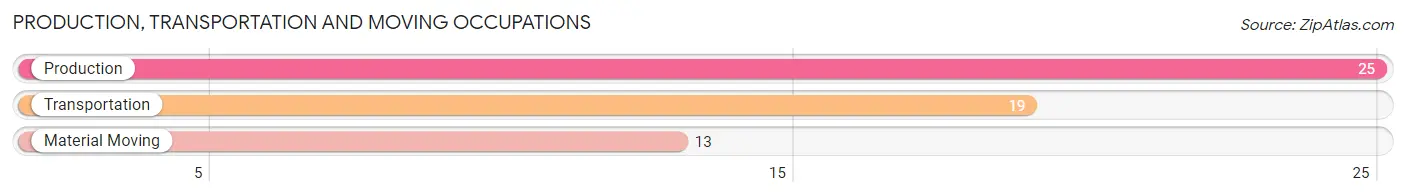
Production, Transportation and Moving Occupations
The most common Production, Transportation and Moving occupations in Turrell are Production (25 | 19.1%), Transportation (19 | 14.5%), and Material Moving (13 | 9.9%).
Production, Transportation and Moving Occupations by Sex
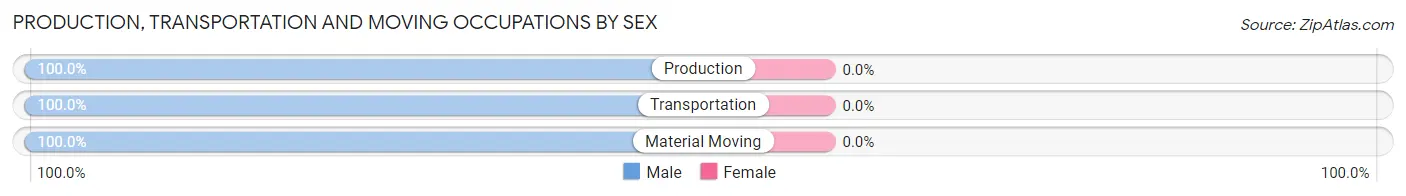
| Occupation | Male | Female |
| Production | 25 (100.0%) | 0 (0.0%) |
| Transportation | 19 (100.0%) | 0 (0.0%) |
| Material Moving | 13 (100.0%) | 0 (0.0%) |
| Total (Category) | 57 (100.0%) | 0 (0.0%) |
| Total (Overall) | 64 (48.8%) | 67 (51.1%) |
Employment Industries by Sex in Turrell
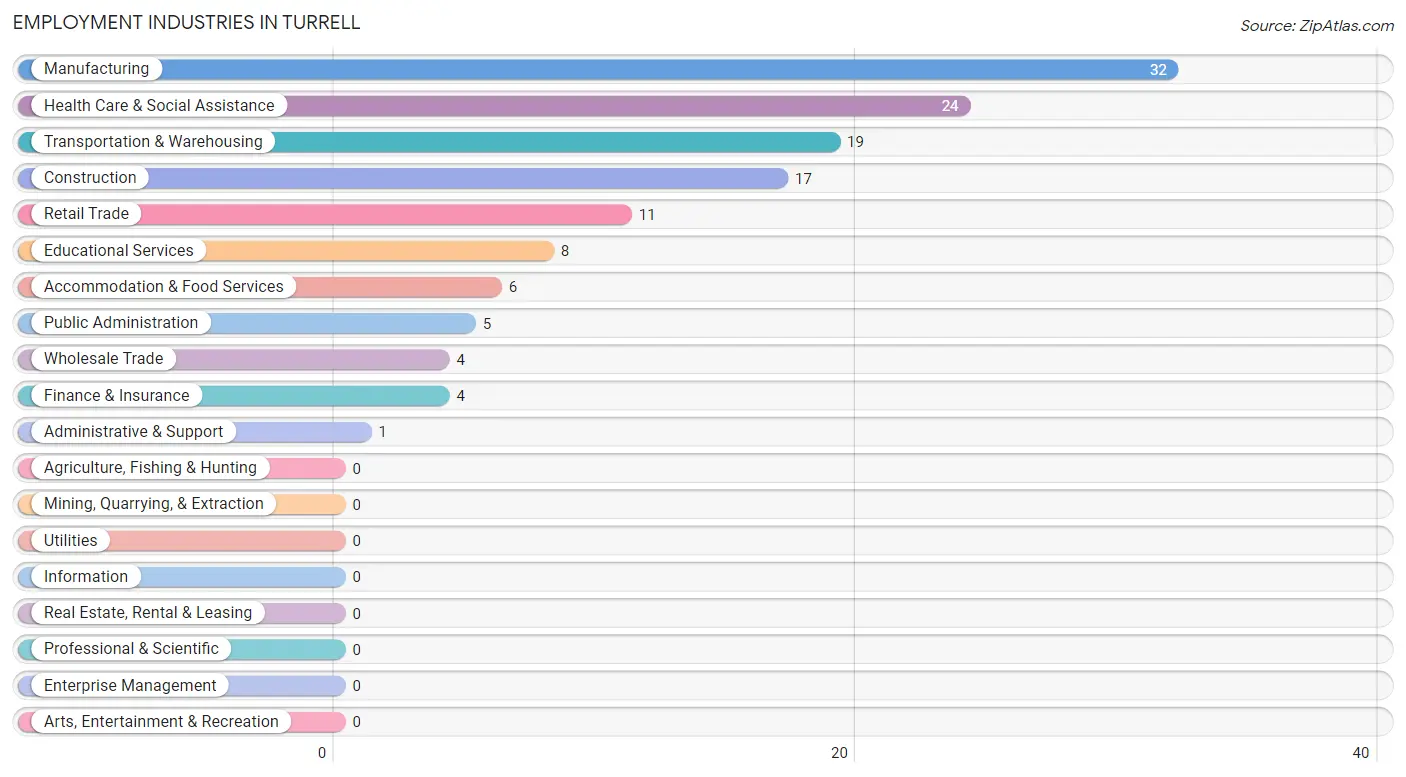
Employment Industries in Turrell
The major employment industries in Turrell include Manufacturing (32 | 24.4%), Health Care & Social Assistance (24 | 18.3%), Transportation & Warehousing (19 | 14.5%), Construction (17 | 13.0%), and Retail Trade (11 | 8.4%).
Employment Industries by Sex in Turrell
The Turrell industries that see more men than women are Transportation & Warehousing (100.0%), Administrative & Support (100.0%), and Public Administration (100.0%), whereas the industries that tend to have a higher number of women are Wholesale Trade (100.0%), Retail Trade (100.0%), and Finance & Insurance (100.0%).
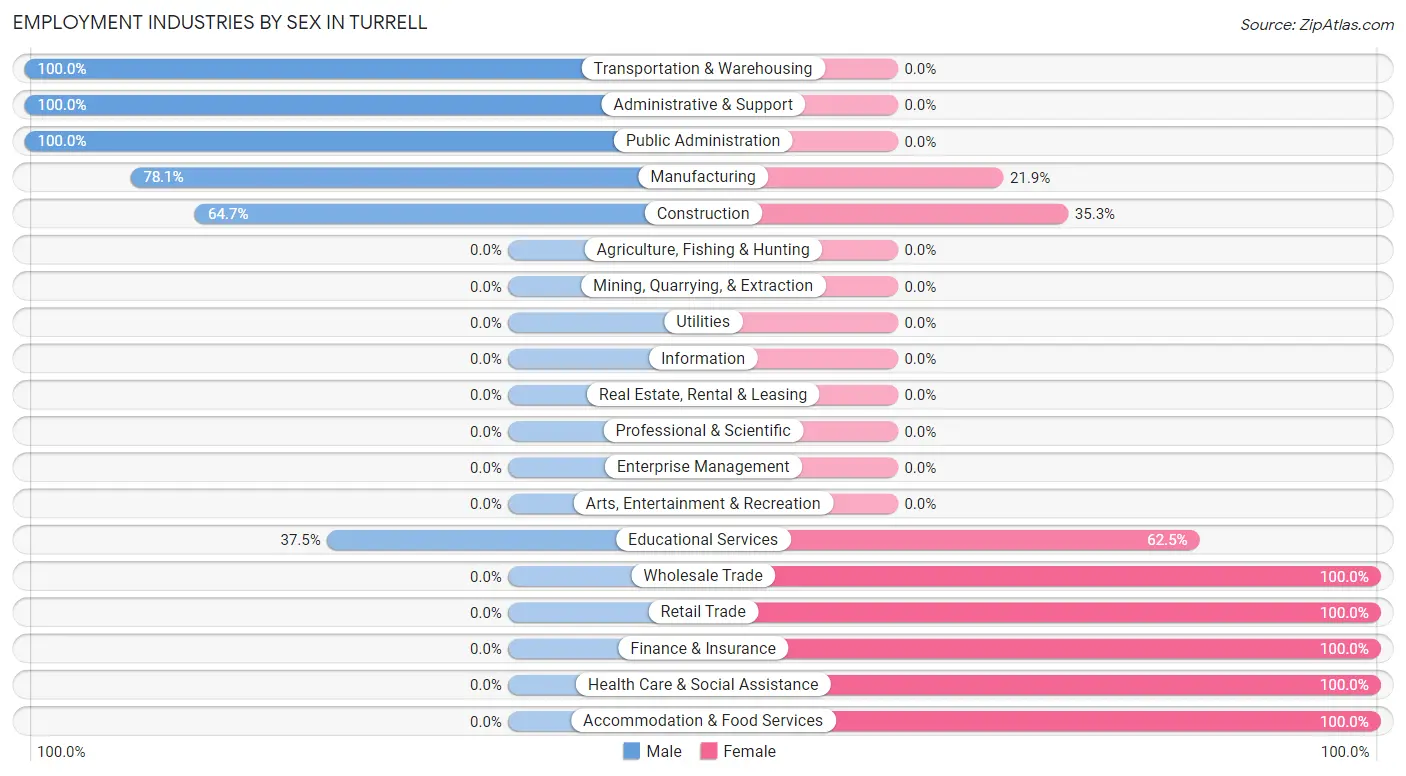
| Industry | Male | Female |
| Agriculture, Fishing & Hunting | 0 (0.0%) | 0 (0.0%) |
| Mining, Quarrying, & Extraction | 0 (0.0%) | 0 (0.0%) |
| Construction | 11 (64.7%) | 6 (35.3%) |
| Manufacturing | 25 (78.1%) | 7 (21.9%) |
| Wholesale Trade | 0 (0.0%) | 4 (100.0%) |
| Retail Trade | 0 (0.0%) | 11 (100.0%) |
| Transportation & Warehousing | 19 (100.0%) | 0 (0.0%) |
| Utilities | 0 (0.0%) | 0 (0.0%) |
| Information | 0 (0.0%) | 0 (0.0%) |
| Finance & Insurance | 0 (0.0%) | 4 (100.0%) |
| Real Estate, Rental & Leasing | 0 (0.0%) | 0 (0.0%) |
| Professional & Scientific | 0 (0.0%) | 0 (0.0%) |
| Enterprise Management | 0 (0.0%) | 0 (0.0%) |
| Administrative & Support | 1 (100.0%) | 0 (0.0%) |
| Educational Services | 3 (37.5%) | 5 (62.5%) |
| Health Care & Social Assistance | 0 (0.0%) | 24 (100.0%) |
| Arts, Entertainment & Recreation | 0 (0.0%) | 0 (0.0%) |
| Accommodation & Food Services | 0 (0.0%) | 6 (100.0%) |
| Public Administration | 5 (100.0%) | 0 (0.0%) |
| Total | 64 (48.8%) | 67 (51.1%) |
Education in Turrell
School Enrollment in Turrell
The most common levels of schooling among the 173 students in Turrell are high school (93 | 53.8%), middle school (41 | 23.7%), and elementary school (34 | 19.7%).
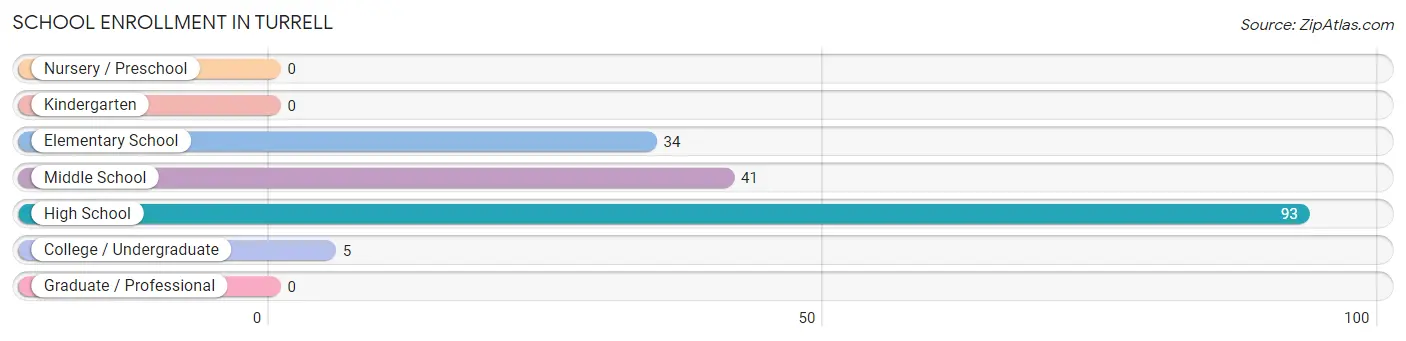
| School Level | # Students | % Students |
| Nursery / Preschool | 0 | 0.0% |
| Kindergarten | 0 | 0.0% |
| Elementary School | 34 | 19.7% |
| Middle School | 41 | 23.7% |
| High School | 93 | 53.8% |
| College / Undergraduate | 5 | 2.9% |
| Graduate / Professional | 0 | 0.0% |
| Total | 173 | 100.0% |
School Enrollment by Age by Funding Source in Turrell
Out of a total of 173 students who are enrolled in schools in Turrell, 9 (5.2%) attend a private institution, while the remaining 164 (94.8%) are enrolled in public schools. The age group of 5 to 9 year old has the highest likelihood of being enrolled in private schools, with 9 (30.0% in the age bracket) enrolled. Conversely, the age group of 10 to 14 year olds has the lowest likelihood of being enrolled in a private school, with 37 (100.0% in the age bracket) attending a public institution.
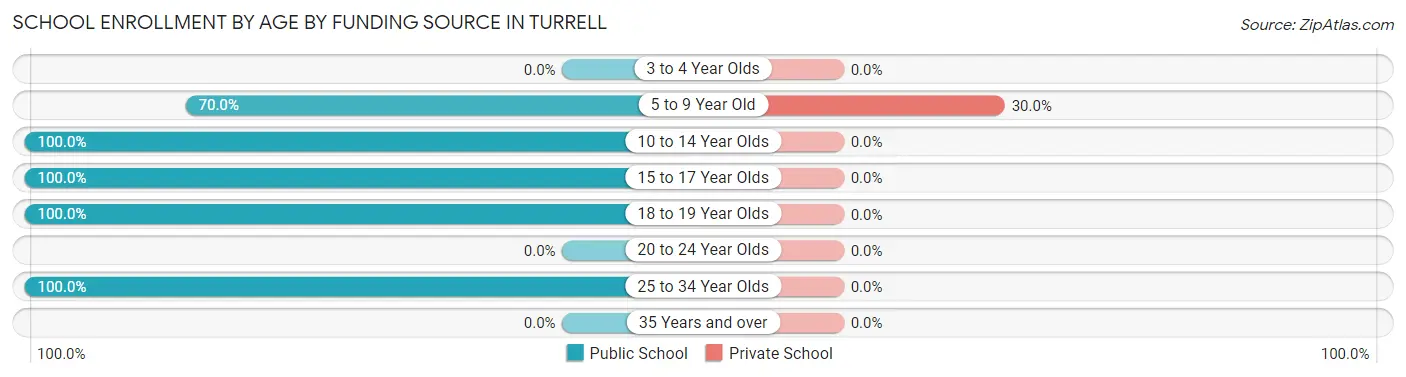
| Age Bracket | Public School | Private School |
| 3 to 4 Year Olds | 0 (0.0%) | 0 (0.0%) |
| 5 to 9 Year Old | 21 (70.0%) | 9 (30.0%) |
| 10 to 14 Year Olds | 37 (100.0%) | 0 (0.0%) |
| 15 to 17 Year Olds | 74 (100.0%) | 0 (0.0%) |
| 18 to 19 Year Olds | 27 (100.0%) | 0 (0.0%) |
| 20 to 24 Year Olds | 0 (0.0%) | 0 (0.0%) |
| 25 to 34 Year Olds | 5 (100.0%) | 0 (0.0%) |
| 35 Years and over | 0 (0.0%) | 0 (0.0%) |
| Total | 164 (94.8%) | 9 (5.2%) |
Educational Attainment by Field of Study in Turrell
Bio, nature & agricultural (10 | 45.5%), business (5 | 22.7%), arts & humanities (5 | 22.7%), and education (2 | 9.1%) are the most common fields of study among 22 individuals in Turrell who have obtained a bachelor's degree or higher.
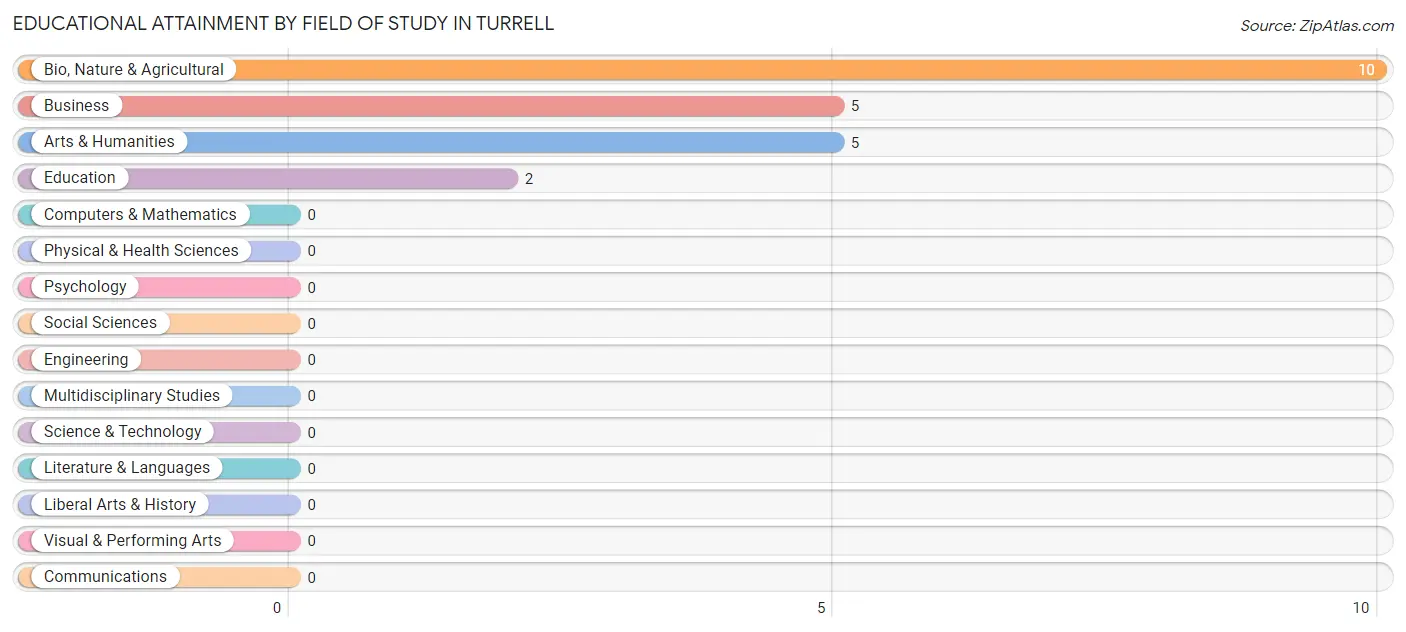
| Field of Study | # Graduates | % Graduates |
| Computers & Mathematics | 0 | 0.0% |
| Bio, Nature & Agricultural | 10 | 45.5% |
| Physical & Health Sciences | 0 | 0.0% |
| Psychology | 0 | 0.0% |
| Social Sciences | 0 | 0.0% |
| Engineering | 0 | 0.0% |
| Multidisciplinary Studies | 0 | 0.0% |
| Science & Technology | 0 | 0.0% |
| Business | 5 | 22.7% |
| Education | 2 | 9.1% |
| Literature & Languages | 0 | 0.0% |
| Liberal Arts & History | 0 | 0.0% |
| Visual & Performing Arts | 0 | 0.0% |
| Communications | 0 | 0.0% |
| Arts & Humanities | 5 | 22.7% |
| Total | 22 | 100.0% |
Transportation & Commute in Turrell
Vehicle Availability by Sex in Turrell
The most prevalent vehicle ownership categories in Turrell are males with 2 vehicles (30, accounting for 46.9%) and females with 2 vehicles (16, making up 44.8%).
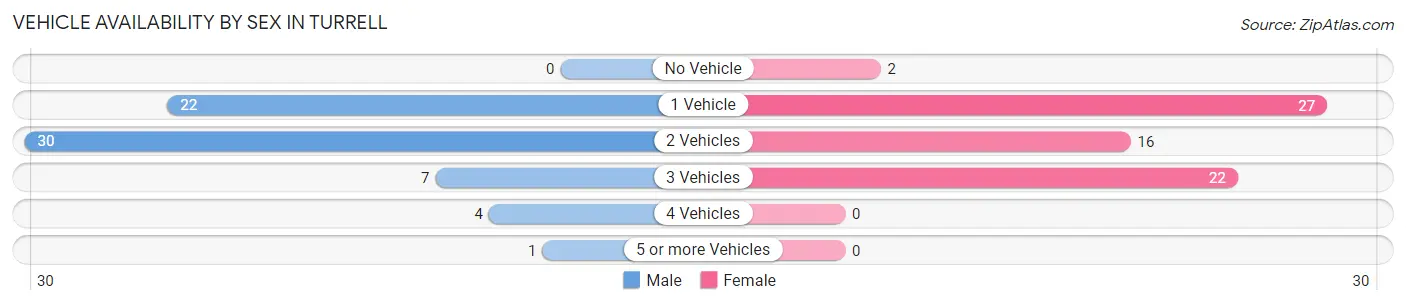
| Vehicles Available | Male | Female |
| No Vehicle | 0 (0.0%) | 2 (3.0%) |
| 1 Vehicle | 22 (34.4%) | 27 (40.3%) |
| 2 Vehicles | 30 (46.9%) | 16 (23.9%) |
| 3 Vehicles | 7 (10.9%) | 22 (32.8%) |
| 4 Vehicles | 4 (6.2%) | 0 (0.0%) |
| 5 or more Vehicles | 1 (1.6%) | 0 (0.0%) |
| Total | 64 (100.0%) | 67 (100.0%) |
Commute Time in Turrell
The most frequently occuring commute durations in Turrell are 25 to 29 minutes (32 commuters, 26.2%), 10 to 14 minutes (23 commuters, 18.9%), and 30 to 34 minutes (16 commuters, 13.1%).
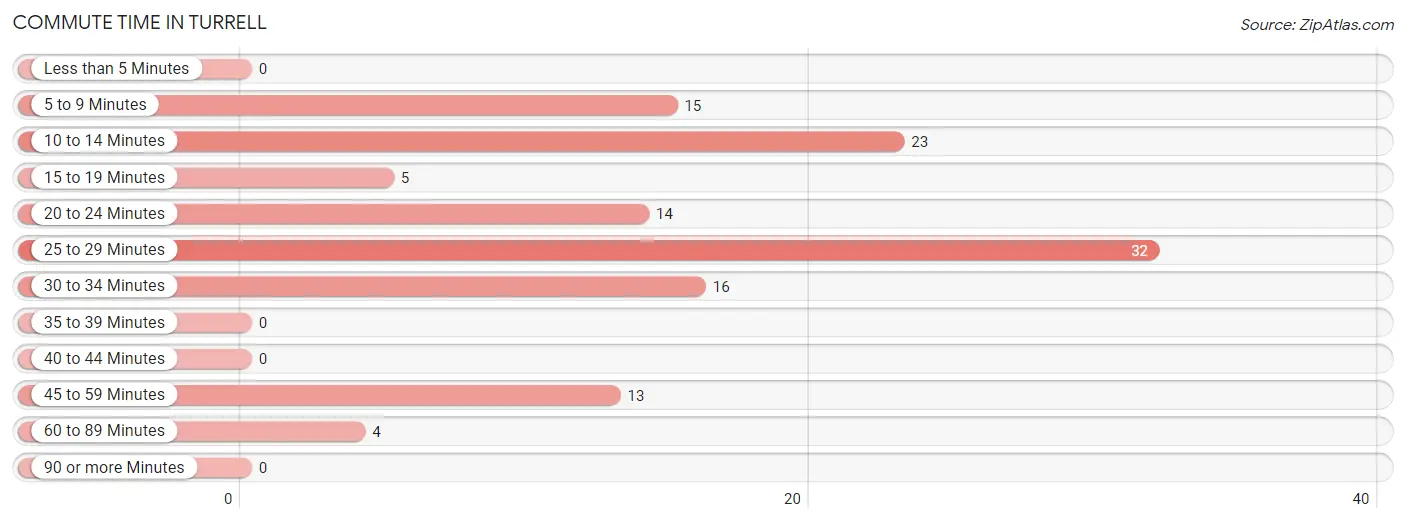
| Commute Time | # Commuters | % Commuters |
| Less than 5 Minutes | 0 | 0.0% |
| 5 to 9 Minutes | 15 | 12.3% |
| 10 to 14 Minutes | 23 | 18.9% |
| 15 to 19 Minutes | 5 | 4.1% |
| 20 to 24 Minutes | 14 | 11.5% |
| 25 to 29 Minutes | 32 | 26.2% |
| 30 to 34 Minutes | 16 | 13.1% |
| 35 to 39 Minutes | 0 | 0.0% |
| 40 to 44 Minutes | 0 | 0.0% |
| 45 to 59 Minutes | 13 | 10.7% |
| 60 to 89 Minutes | 4 | 3.3% |
| 90 or more Minutes | 0 | 0.0% |
Commute Time by Sex in Turrell
The most common commute times in Turrell are 25 to 29 minutes (21 commuters, 35.6%) for males and 10 to 14 minutes (23 commuters, 36.5%) for females.
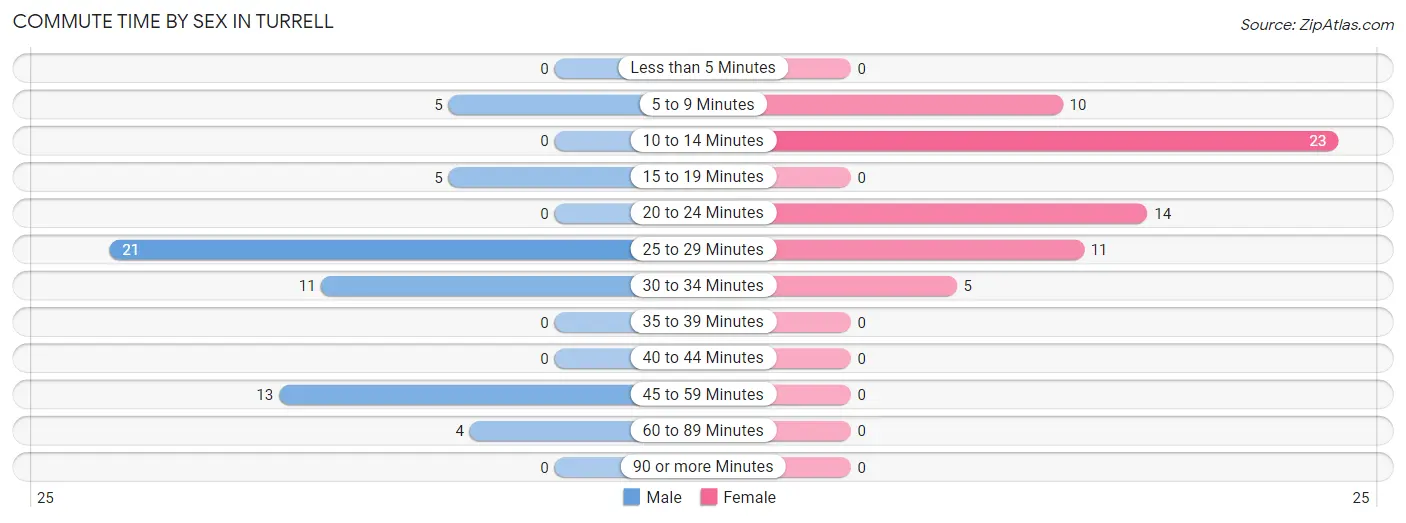
| Commute Time | Male | Female |
| Less than 5 Minutes | 0 (0.0%) | 0 (0.0%) |
| 5 to 9 Minutes | 5 (8.5%) | 10 (15.9%) |
| 10 to 14 Minutes | 0 (0.0%) | 23 (36.5%) |
| 15 to 19 Minutes | 5 (8.5%) | 0 (0.0%) |
| 20 to 24 Minutes | 0 (0.0%) | 14 (22.2%) |
| 25 to 29 Minutes | 21 (35.6%) | 11 (17.5%) |
| 30 to 34 Minutes | 11 (18.6%) | 5 (7.9%) |
| 35 to 39 Minutes | 0 (0.0%) | 0 (0.0%) |
| 40 to 44 Minutes | 0 (0.0%) | 0 (0.0%) |
| 45 to 59 Minutes | 13 (22.0%) | 0 (0.0%) |
| 60 to 89 Minutes | 4 (6.8%) | 0 (0.0%) |
| 90 or more Minutes | 0 (0.0%) | 0 (0.0%) |
Time of Departure to Work by Sex in Turrell
The most frequent times of departure to work in Turrell are 7:30 AM to 7:59 AM (17, 28.8%) for males and 6:30 AM to 6:59 AM (23, 36.5%) for females.
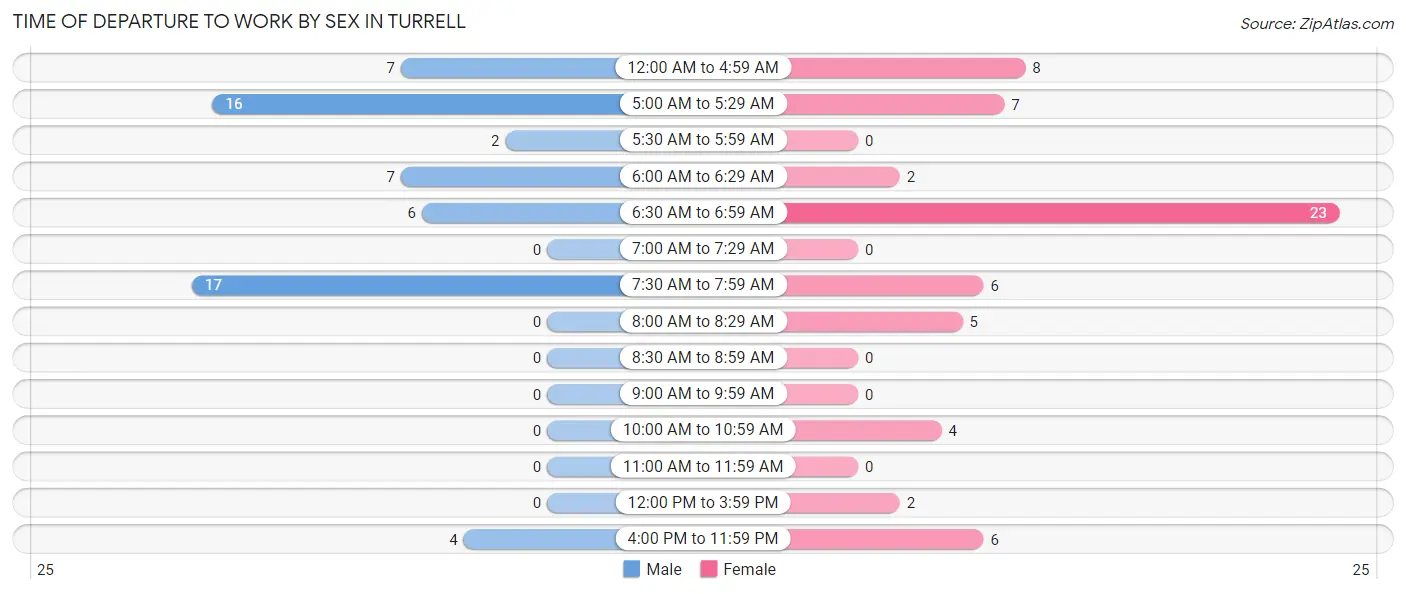
| Time of Departure | Male | Female |
| 12:00 AM to 4:59 AM | 7 (11.9%) | 8 (12.7%) |
| 5:00 AM to 5:29 AM | 16 (27.1%) | 7 (11.1%) |
| 5:30 AM to 5:59 AM | 2 (3.4%) | 0 (0.0%) |
| 6:00 AM to 6:29 AM | 7 (11.9%) | 2 (3.2%) |
| 6:30 AM to 6:59 AM | 6 (10.2%) | 23 (36.5%) |
| 7:00 AM to 7:29 AM | 0 (0.0%) | 0 (0.0%) |
| 7:30 AM to 7:59 AM | 17 (28.8%) | 6 (9.5%) |
| 8:00 AM to 8:29 AM | 0 (0.0%) | 5 (7.9%) |
| 8:30 AM to 8:59 AM | 0 (0.0%) | 0 (0.0%) |
| 9:00 AM to 9:59 AM | 0 (0.0%) | 0 (0.0%) |
| 10:00 AM to 10:59 AM | 0 (0.0%) | 4 (6.4%) |
| 11:00 AM to 11:59 AM | 0 (0.0%) | 0 (0.0%) |
| 12:00 PM to 3:59 PM | 0 (0.0%) | 2 (3.2%) |
| 4:00 PM to 11:59 PM | 4 (6.8%) | 6 (9.5%) |
| Total | 59 (100.0%) | 63 (100.0%) |
Housing Occupancy in Turrell
Occupancy by Ownership in Turrell
Of the total 152 dwellings in Turrell, owner-occupied units account for 80 (52.6%), while renter-occupied units make up 72 (47.4%).
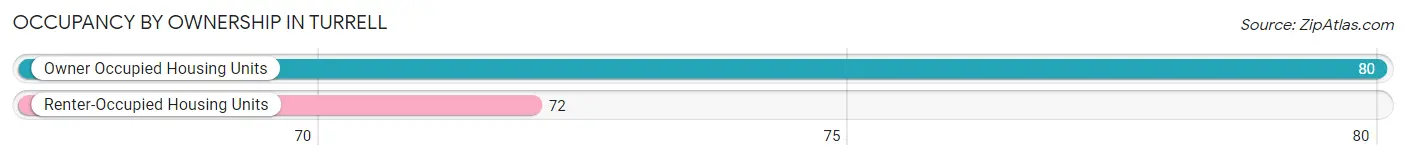
| Occupancy | # Housing Units | % Housing Units |
| Owner Occupied Housing Units | 80 | 52.6% |
| Renter-Occupied Housing Units | 72 | 47.4% |
| Total Occupied Housing Units | 152 | 100.0% |
Occupancy by Household Size in Turrell
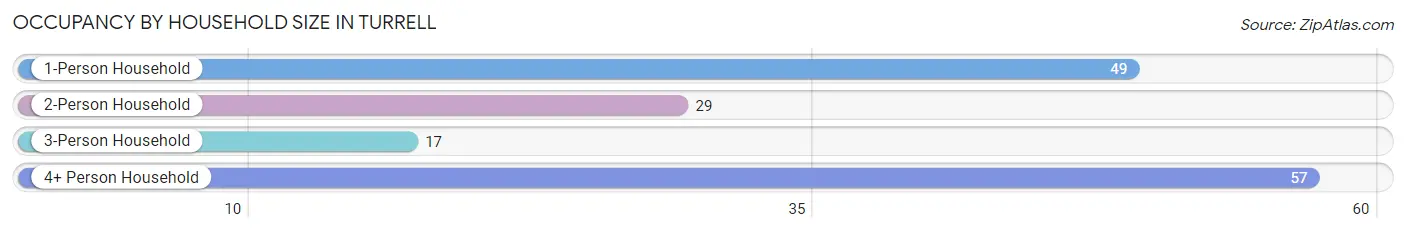
| Household Size | # Housing Units | % Housing Units |
| 1-Person Household | 49 | 32.2% |
| 2-Person Household | 29 | 19.1% |
| 3-Person Household | 17 | 11.2% |
| 4+ Person Household | 57 | 37.5% |
| Total Housing Units | 152 | 100.0% |
Occupancy by Ownership by Household Size in Turrell
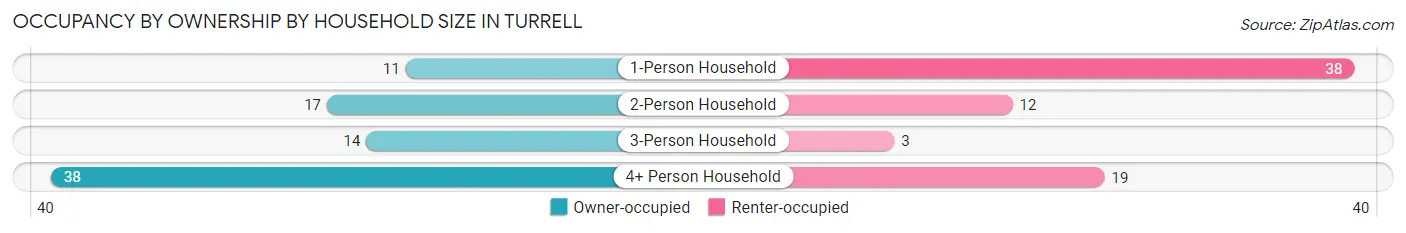
| Household Size | Owner-occupied | Renter-occupied |
| 1-Person Household | 11 (22.5%) | 38 (77.5%) |
| 2-Person Household | 17 (58.6%) | 12 (41.4%) |
| 3-Person Household | 14 (82.4%) | 3 (17.6%) |
| 4+ Person Household | 38 (66.7%) | 19 (33.3%) |
| Total Housing Units | 80 (52.6%) | 72 (47.4%) |
Occupancy by Educational Attainment in Turrell
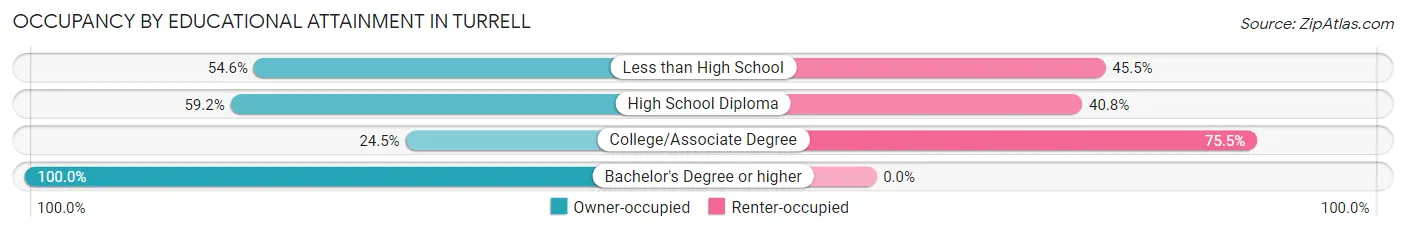
| Household Size | Owner-occupied | Renter-occupied |
| Less than High School | 18 (54.5%) | 15 (45.5%) |
| High School Diploma | 29 (59.2%) | 20 (40.8%) |
| College/Associate Degree | 12 (24.5%) | 37 (75.5%) |
| Bachelor's Degree or higher | 21 (100.0%) | 0 (0.0%) |
Occupancy by Age of Householder in Turrell
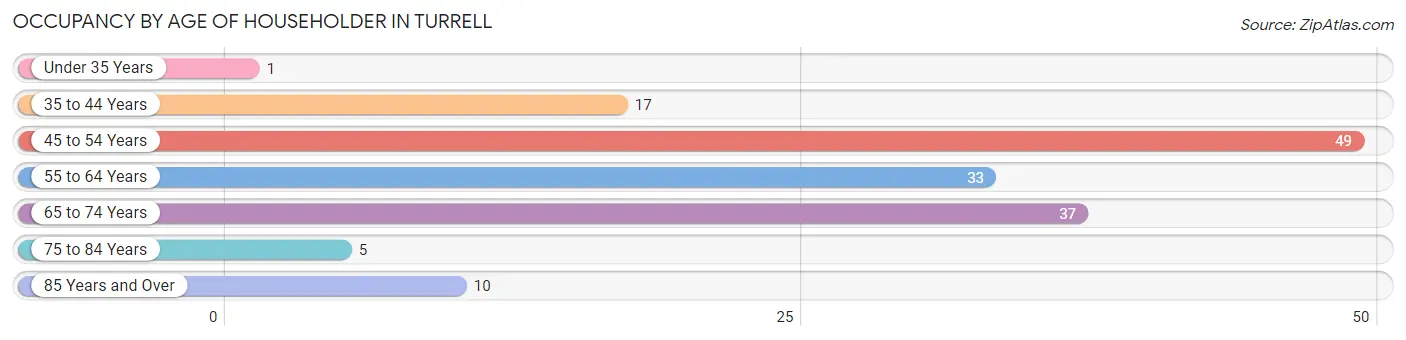
| Age Bracket | # Households | % Households |
| Under 35 Years | 1 | 0.7% |
| 35 to 44 Years | 17 | 11.2% |
| 45 to 54 Years | 49 | 32.2% |
| 55 to 64 Years | 33 | 21.7% |
| 65 to 74 Years | 37 | 24.3% |
| 75 to 84 Years | 5 | 3.3% |
| 85 Years and Over | 10 | 6.6% |
| Total | 152 | 100.0% |
Housing Finances in Turrell
Median Income by Occupancy in Turrell
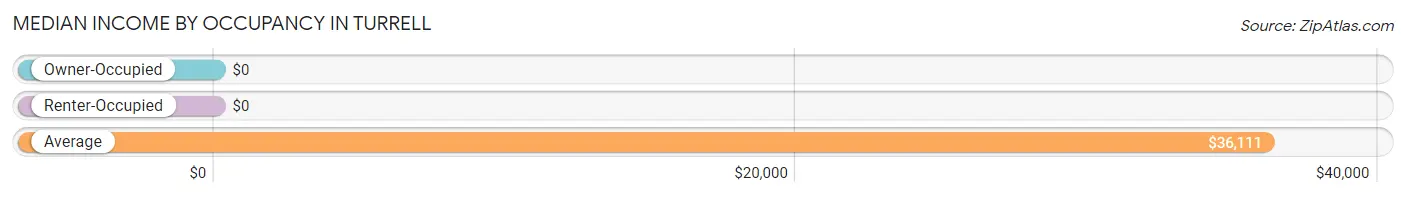
| Occupancy Type | # Households | Median Income |
| Owner-Occupied | 80 (52.6%) | $0 |
| Renter-Occupied | 72 (47.4%) | $0 |
| Average | 152 (100.0%) | $36,111 |
Occupancy by Householder Income Bracket in Turrell
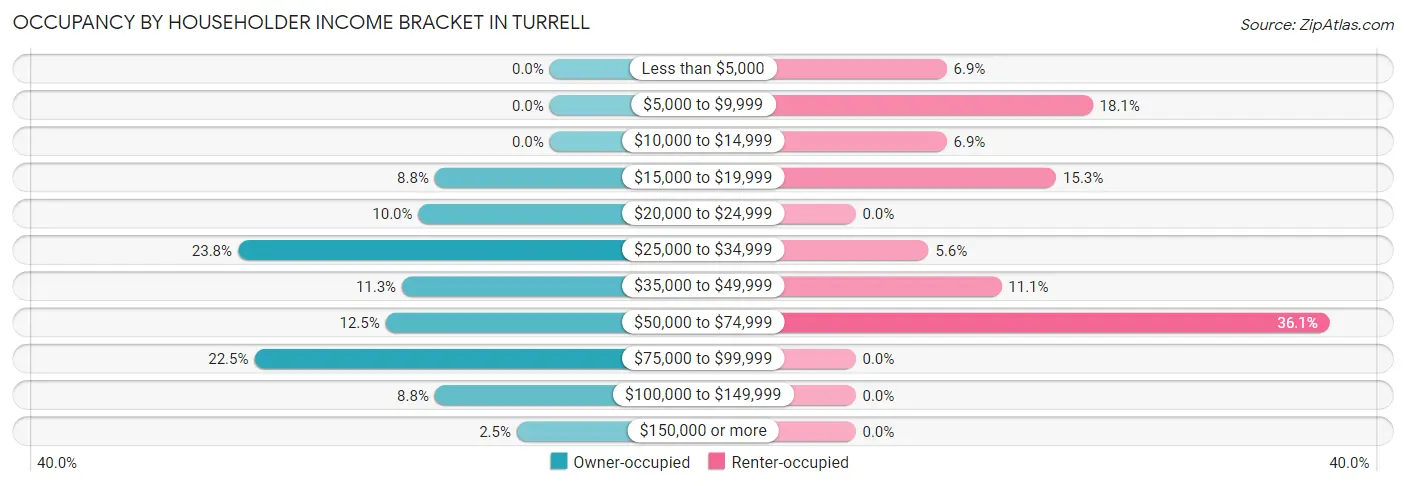
| Income Bracket | Owner-occupied | Renter-occupied |
| Less than $5,000 | 0 (0.0%) | 5 (6.9%) |
| $5,000 to $9,999 | 0 (0.0%) | 13 (18.1%) |
| $10,000 to $14,999 | 0 (0.0%) | 5 (6.9%) |
| $15,000 to $19,999 | 7 (8.7%) | 11 (15.3%) |
| $20,000 to $24,999 | 8 (10.0%) | 0 (0.0%) |
| $25,000 to $34,999 | 19 (23.7%) | 4 (5.6%) |
| $35,000 to $49,999 | 9 (11.3%) | 8 (11.1%) |
| $50,000 to $74,999 | 10 (12.5%) | 26 (36.1%) |
| $75,000 to $99,999 | 18 (22.5%) | 0 (0.0%) |
| $100,000 to $149,999 | 7 (8.7%) | 0 (0.0%) |
| $150,000 or more | 2 (2.5%) | 0 (0.0%) |
| Total | 80 (100.0%) | 72 (100.0%) |
Monthly Housing Cost Tiers in Turrell
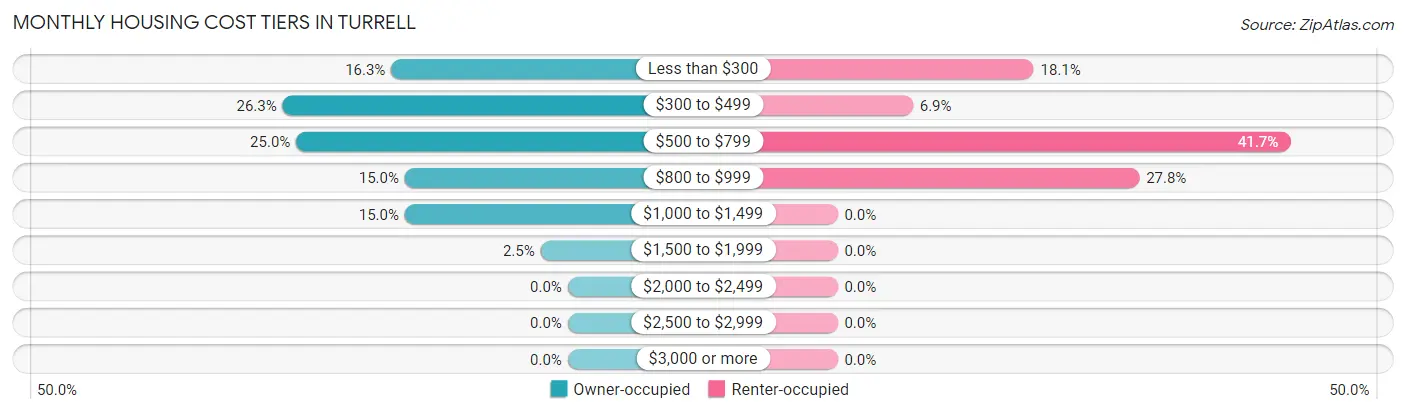
| Monthly Cost | Owner-occupied | Renter-occupied |
| Less than $300 | 13 (16.3%) | 13 (18.1%) |
| $300 to $499 | 21 (26.3%) | 5 (6.9%) |
| $500 to $799 | 20 (25.0%) | 30 (41.7%) |
| $800 to $999 | 12 (15.0%) | 20 (27.8%) |
| $1,000 to $1,499 | 12 (15.0%) | 0 (0.0%) |
| $1,500 to $1,999 | 2 (2.5%) | 0 (0.0%) |
| $2,000 to $2,499 | 0 (0.0%) | 0 (0.0%) |
| $2,500 to $2,999 | 0 (0.0%) | 0 (0.0%) |
| $3,000 or more | 0 (0.0%) | 0 (0.0%) |
| Total | 80 (100.0%) | 72 (100.0%) |
Physical Housing Characteristics in Turrell
Housing Structures in Turrell
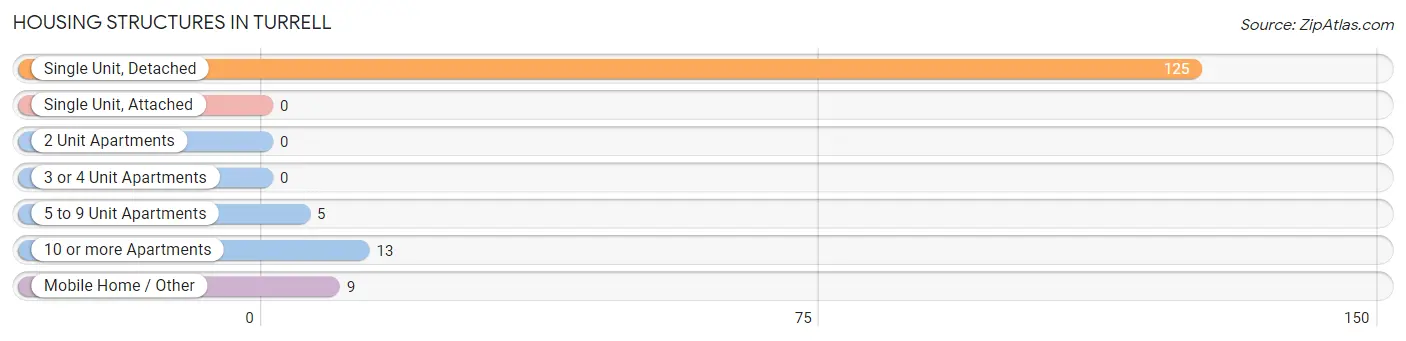
| Structure Type | # Housing Units | % Housing Units |
| Single Unit, Detached | 125 | 82.2% |
| Single Unit, Attached | 0 | 0.0% |
| 2 Unit Apartments | 0 | 0.0% |
| 3 or 4 Unit Apartments | 0 | 0.0% |
| 5 to 9 Unit Apartments | 5 | 3.3% |
| 10 or more Apartments | 13 | 8.6% |
| Mobile Home / Other | 9 | 5.9% |
| Total | 152 | 100.0% |
Housing Structures by Occupancy in Turrell
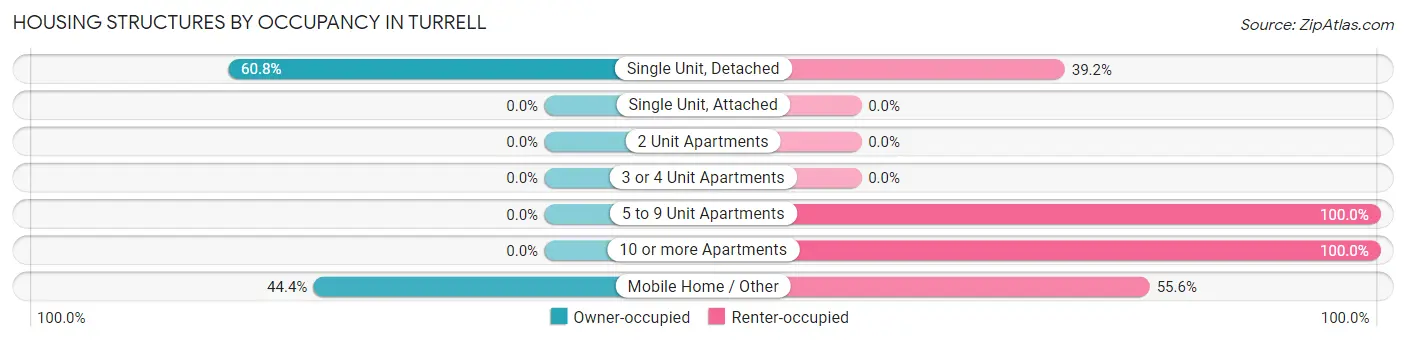
| Structure Type | Owner-occupied | Renter-occupied |
| Single Unit, Detached | 76 (60.8%) | 49 (39.2%) |
| Single Unit, Attached | 0 (0.0%) | 0 (0.0%) |
| 2 Unit Apartments | 0 (0.0%) | 0 (0.0%) |
| 3 or 4 Unit Apartments | 0 (0.0%) | 0 (0.0%) |
| 5 to 9 Unit Apartments | 0 (0.0%) | 5 (100.0%) |
| 10 or more Apartments | 0 (0.0%) | 13 (100.0%) |
| Mobile Home / Other | 4 (44.4%) | 5 (55.6%) |
| Total | 80 (52.6%) | 72 (47.4%) |
Housing Structures by Number of Rooms in Turrell
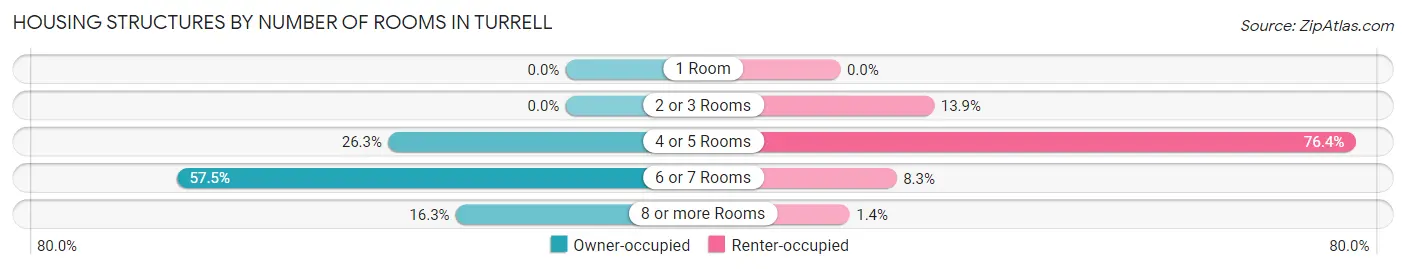
| Number of Rooms | Owner-occupied | Renter-occupied |
| 1 Room | 0 (0.0%) | 0 (0.0%) |
| 2 or 3 Rooms | 0 (0.0%) | 10 (13.9%) |
| 4 or 5 Rooms | 21 (26.3%) | 55 (76.4%) |
| 6 or 7 Rooms | 46 (57.5%) | 6 (8.3%) |
| 8 or more Rooms | 13 (16.3%) | 1 (1.4%) |
| Total | 80 (100.0%) | 72 (100.0%) |
Housing Structure by Heating Type in Turrell
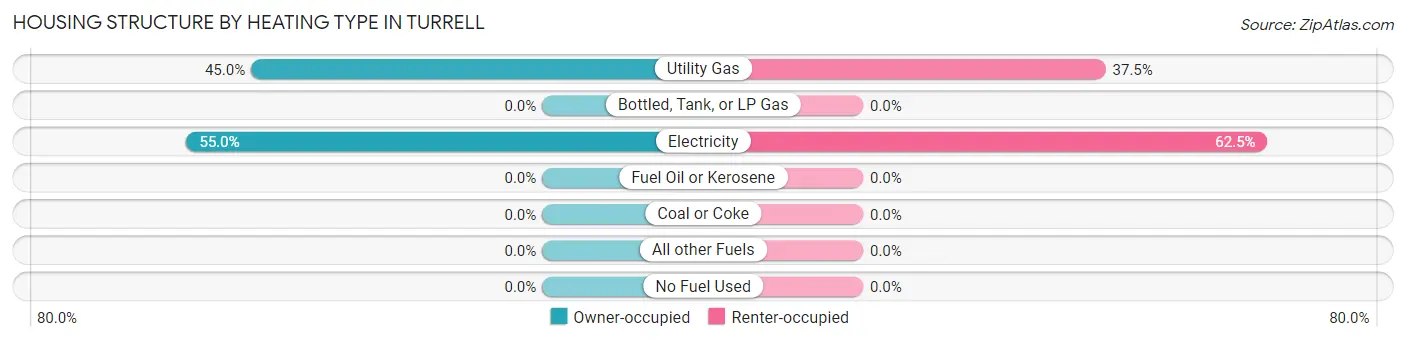
| Heating Type | Owner-occupied | Renter-occupied |
| Utility Gas | 36 (45.0%) | 27 (37.5%) |
| Bottled, Tank, or LP Gas | 0 (0.0%) | 0 (0.0%) |
| Electricity | 44 (55.0%) | 45 (62.5%) |
| Fuel Oil or Kerosene | 0 (0.0%) | 0 (0.0%) |
| Coal or Coke | 0 (0.0%) | 0 (0.0%) |
| All other Fuels | 0 (0.0%) | 0 (0.0%) |
| No Fuel Used | 0 (0.0%) | 0 (0.0%) |
| Total | 80 (100.0%) | 72 (100.0%) |
Household Vehicle Usage in Turrell
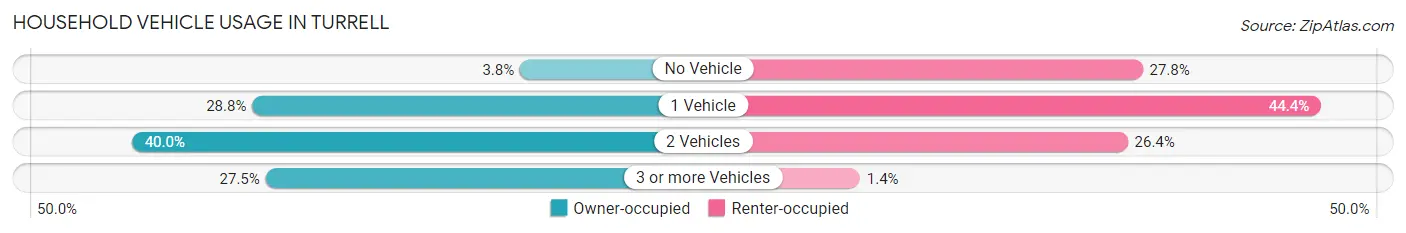
| Vehicles per Household | Owner-occupied | Renter-occupied |
| No Vehicle | 3 (3.7%) | 20 (27.8%) |
| 1 Vehicle | 23 (28.7%) | 32 (44.4%) |
| 2 Vehicles | 32 (40.0%) | 19 (26.4%) |
| 3 or more Vehicles | 22 (27.5%) | 1 (1.4%) |
| Total | 80 (100.0%) | 72 (100.0%) |
Real Estate & Mortgages in Turrell
Real Estate and Mortgage Overview in Turrell
| Characteristic | Without Mortgage | With Mortgage |
| Housing Units | 46 | 34 |
| Median Property Value | $32,500 | $89,300 |
| Median Household Income | - | - |
| Monthly Housing Costs | $390 | $0 |
| Real Estate Taxes | $321 | $0 |
Property Value by Mortgage Status in Turrell
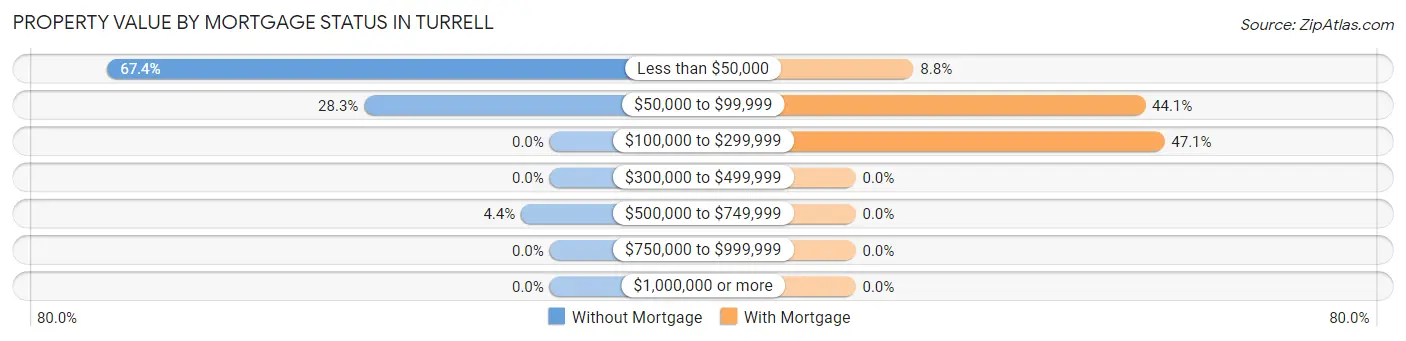
| Property Value | Without Mortgage | With Mortgage |
| Less than $50,000 | 31 (67.4%) | 3 (8.8%) |
| $50,000 to $99,999 | 13 (28.3%) | 15 (44.1%) |
| $100,000 to $299,999 | 0 (0.0%) | 16 (47.1%) |
| $300,000 to $499,999 | 0 (0.0%) | 0 (0.0%) |
| $500,000 to $749,999 | 2 (4.3%) | 0 (0.0%) |
| $750,000 to $999,999 | 0 (0.0%) | 0 (0.0%) |
| $1,000,000 or more | 0 (0.0%) | 0 (0.0%) |
| Total | 46 (100.0%) | 34 (100.0%) |
Household Income by Mortgage Status in Turrell
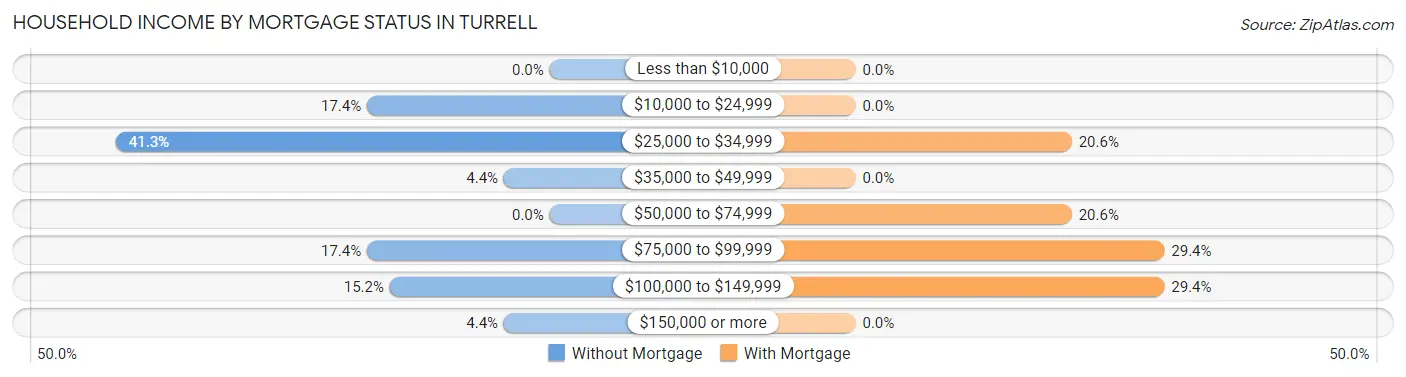
| Household Income | Without Mortgage | With Mortgage |
| Less than $10,000 | 0 (0.0%) | 0 (0.0%) |
| $10,000 to $24,999 | 8 (17.4%) | 0 (0.0%) |
| $25,000 to $34,999 | 19 (41.3%) | 7 (20.6%) |
| $35,000 to $49,999 | 2 (4.3%) | 0 (0.0%) |
| $50,000 to $74,999 | 0 (0.0%) | 7 (20.6%) |
| $75,000 to $99,999 | 8 (17.4%) | 10 (29.4%) |
| $100,000 to $149,999 | 7 (15.2%) | 10 (29.4%) |
| $150,000 or more | 2 (4.3%) | 0 (0.0%) |
| Total | 46 (100.0%) | 34 (100.0%) |
Property Value to Household Income Ratio in Turrell
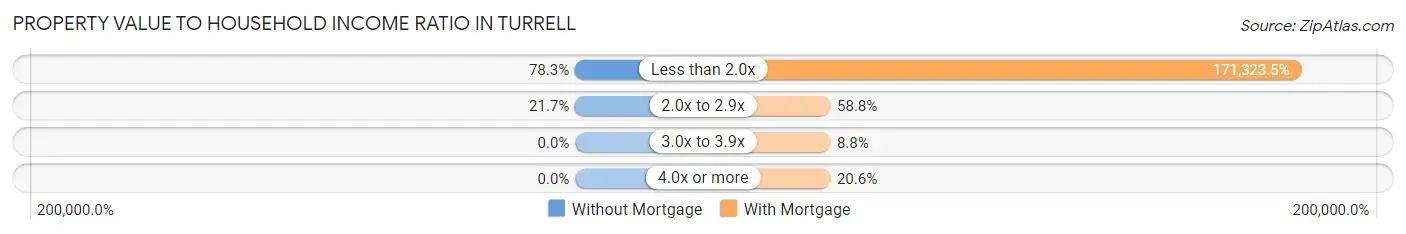
| Value-to-Income Ratio | Without Mortgage | With Mortgage |
| Less than 2.0x | 36 (78.3%) | 58,250 (171,323.5%) |
| 2.0x to 2.9x | 10 (21.7%) | 20 (58.8%) |
| 3.0x to 3.9x | 0 (0.0%) | 3 (8.8%) |
| 4.0x or more | 0 (0.0%) | 7 (20.6%) |
| Total | 46 (100.0%) | 34 (100.0%) |
Real Estate Taxes by Mortgage Status in Turrell
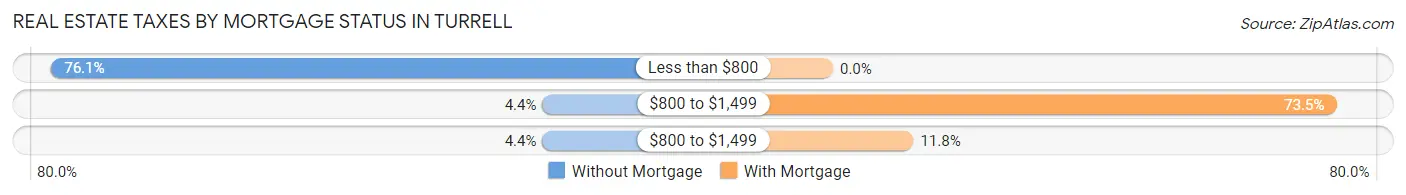
| Property Taxes | Without Mortgage | With Mortgage |
| Less than $800 | 35 (76.1%) | 0 (0.0%) |
| $800 to $1,499 | 2 (4.3%) | 25 (73.5%) |
| $800 to $1,499 | 2 (4.3%) | 4 (11.8%) |
| Total | 46 (100.0%) | 34 (100.0%) |
Health & Disability in Turrell
Health Insurance Coverage by Age in Turrell
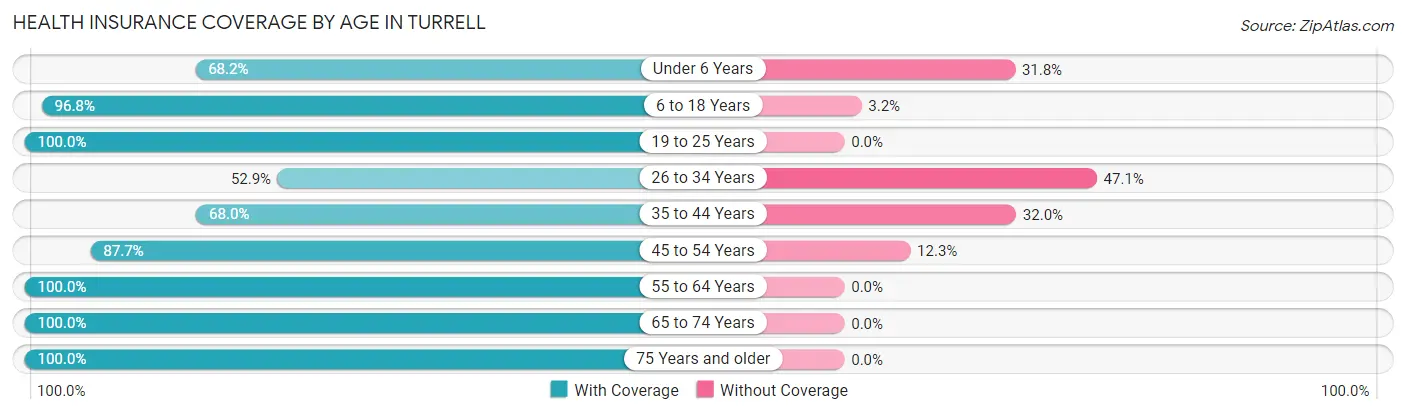
| Age Bracket | With Coverage | Without Coverage |
| Under 6 Years | 15 (68.2%) | 7 (31.8%) |
| 6 to 18 Years | 152 (96.8%) | 5 (3.2%) |
| 19 to 25 Years | 45 (100.0%) | 0 (0.0%) |
| 26 to 34 Years | 9 (52.9%) | 8 (47.1%) |
| 35 to 44 Years | 51 (68.0%) | 24 (32.0%) |
| 45 to 54 Years | 50 (87.7%) | 7 (12.3%) |
| 55 to 64 Years | 52 (100.0%) | 0 (0.0%) |
| 65 to 74 Years | 44 (100.0%) | 0 (0.0%) |
| 75 Years and older | 15 (100.0%) | 0 (0.0%) |
| Total | 433 (89.5%) | 51 (10.5%) |
Health Insurance Coverage by Citizenship Status in Turrell
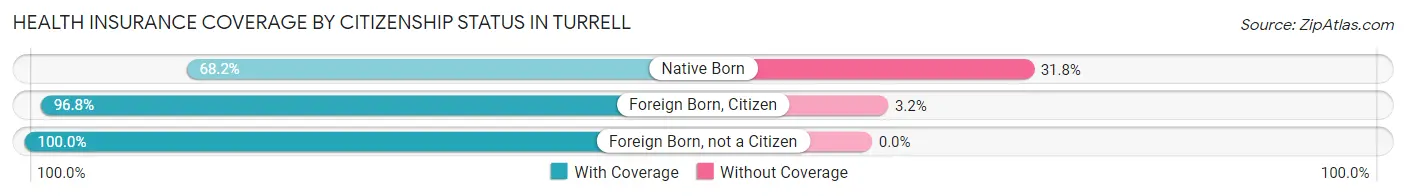
| Citizenship Status | With Coverage | Without Coverage |
| Native Born | 15 (68.2%) | 7 (31.8%) |
| Foreign Born, Citizen | 152 (96.8%) | 5 (3.2%) |
| Foreign Born, not a Citizen | 45 (100.0%) | 0 (0.0%) |
Health Insurance Coverage by Household Income in Turrell
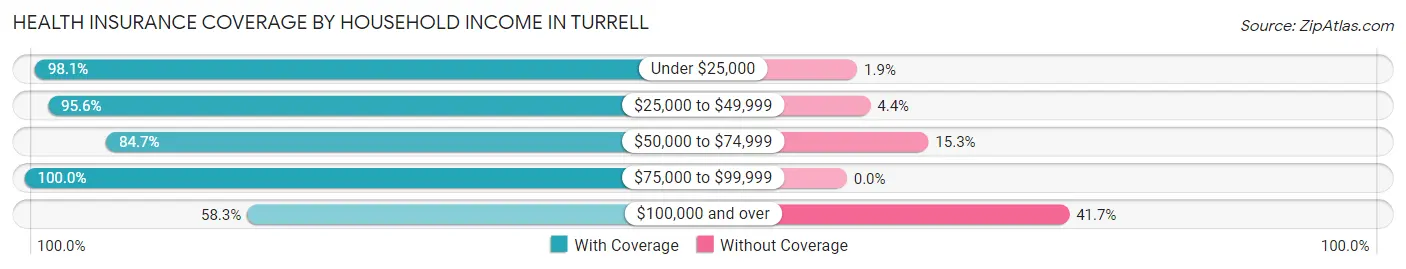
| Household Income | With Coverage | Without Coverage |
| Under $25,000 | 101 (98.1%) | 2 (1.9%) |
| $25,000 to $49,999 | 108 (95.6%) | 5 (4.4%) |
| $50,000 to $74,999 | 133 (84.7%) | 24 (15.3%) |
| $75,000 to $99,999 | 63 (100.0%) | 0 (0.0%) |
| $100,000 and over | 28 (58.3%) | 20 (41.7%) |
Public vs Private Health Insurance Coverage by Age in Turrell
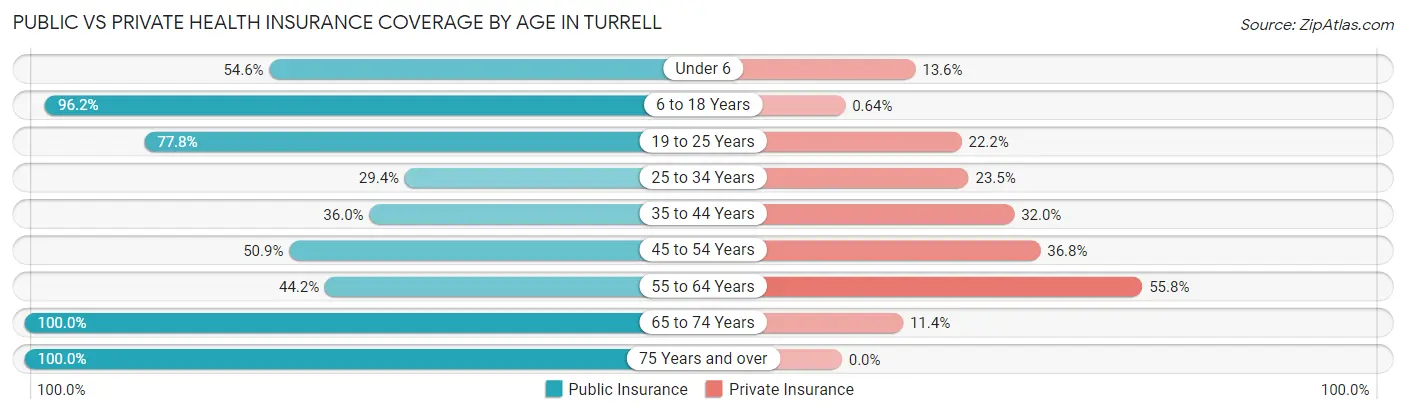
| Age Bracket | Public Insurance | Private Insurance |
| Under 6 | 12 (54.5%) | 3 (13.6%) |
| 6 to 18 Years | 151 (96.2%) | 1 (0.6%) |
| 19 to 25 Years | 35 (77.8%) | 10 (22.2%) |
| 25 to 34 Years | 5 (29.4%) | 4 (23.5%) |
| 35 to 44 Years | 27 (36.0%) | 24 (32.0%) |
| 45 to 54 Years | 29 (50.9%) | 21 (36.8%) |
| 55 to 64 Years | 23 (44.2%) | 29 (55.8%) |
| 65 to 74 Years | 44 (100.0%) | 5 (11.4%) |
| 75 Years and over | 15 (100.0%) | 0 (0.0%) |
| Total | 341 (70.5%) | 97 (20.0%) |
Disability Status by Sex by Age in Turrell
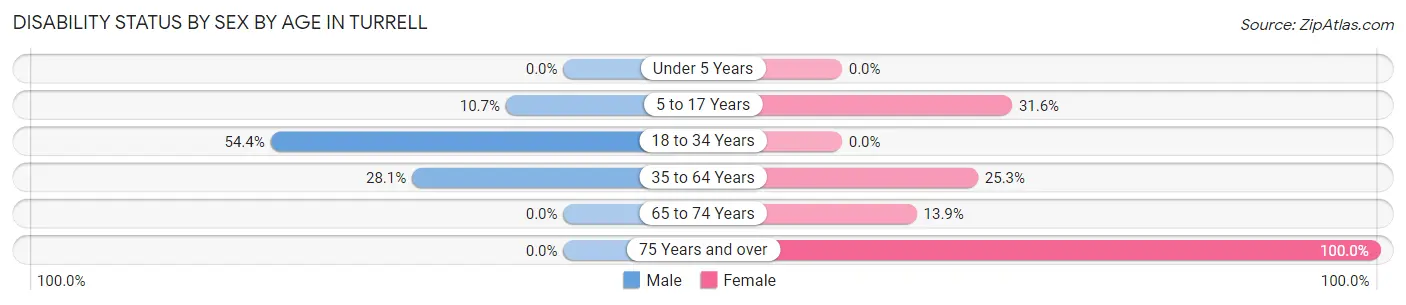
| Age Bracket | Male | Female |
| Under 5 Years | 0 (0.0%) | 0 (0.0%) |
| 5 to 17 Years | 11 (10.7%) | 12 (31.6%) |
| 18 to 34 Years | 25 (54.3%) | 0 (0.0%) |
| 35 to 64 Years | 25 (28.1%) | 24 (25.3%) |
| 65 to 74 Years | 0 (0.0%) | 5 (13.9%) |
| 75 Years and over | 0 (0.0%) | 10 (100.0%) |
Disability Class by Sex by Age in Turrell
Disability Class: Hearing Difficulty
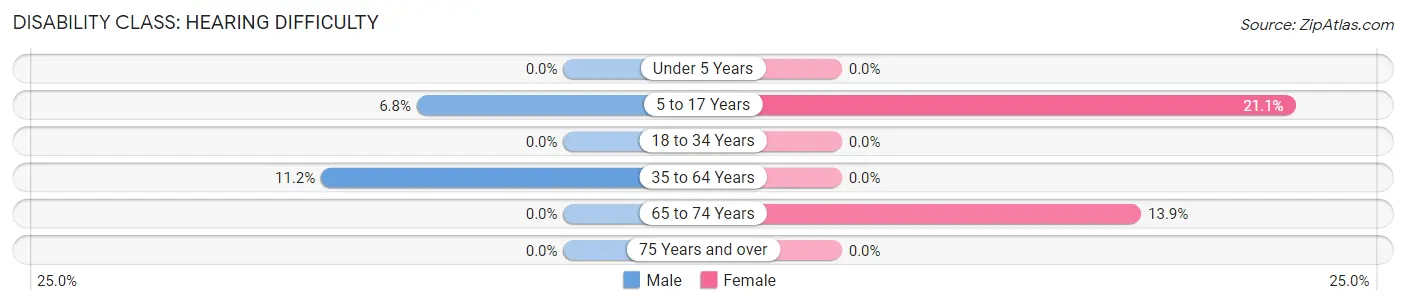
| Age Bracket | Male | Female |
| Under 5 Years | 0 (0.0%) | 0 (0.0%) |
| 5 to 17 Years | 7 (6.8%) | 8 (21.0%) |
| 18 to 34 Years | 0 (0.0%) | 0 (0.0%) |
| 35 to 64 Years | 10 (11.2%) | 0 (0.0%) |
| 65 to 74 Years | 0 (0.0%) | 5 (13.9%) |
| 75 Years and over | 0 (0.0%) | 0 (0.0%) |
Disability Class: Vision Difficulty
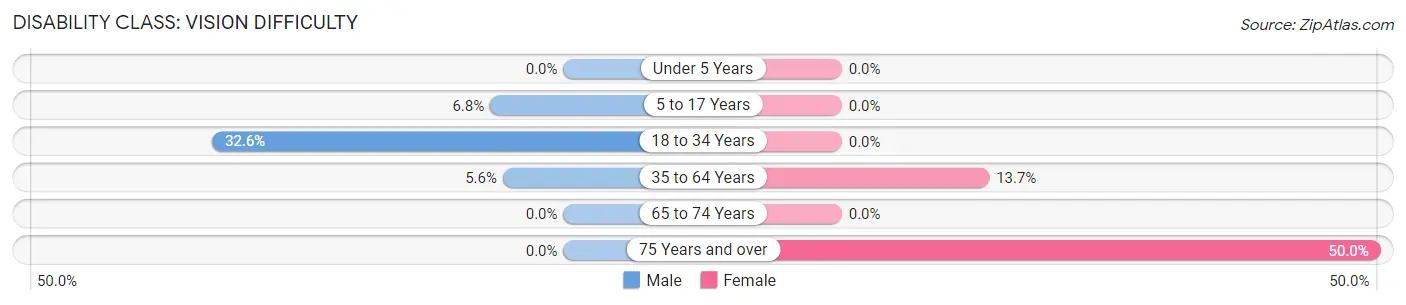
| Age Bracket | Male | Female |
| Under 5 Years | 0 (0.0%) | 0 (0.0%) |
| 5 to 17 Years | 7 (6.8%) | 0 (0.0%) |
| 18 to 34 Years | 15 (32.6%) | 0 (0.0%) |
| 35 to 64 Years | 5 (5.6%) | 13 (13.7%) |
| 65 to 74 Years | 0 (0.0%) | 0 (0.0%) |
| 75 Years and over | 0 (0.0%) | 5 (50.0%) |
Disability Class: Cognitive Difficulty
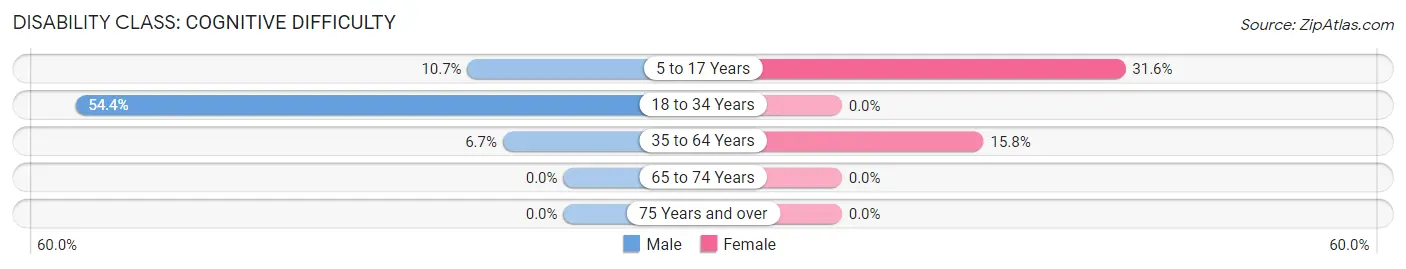
| Age Bracket | Male | Female |
| 5 to 17 Years | 11 (10.7%) | 12 (31.6%) |
| 18 to 34 Years | 25 (54.3%) | 0 (0.0%) |
| 35 to 64 Years | 6 (6.7%) | 15 (15.8%) |
| 65 to 74 Years | 0 (0.0%) | 0 (0.0%) |
| 75 Years and over | 0 (0.0%) | 0 (0.0%) |
Disability Class: Ambulatory Difficulty
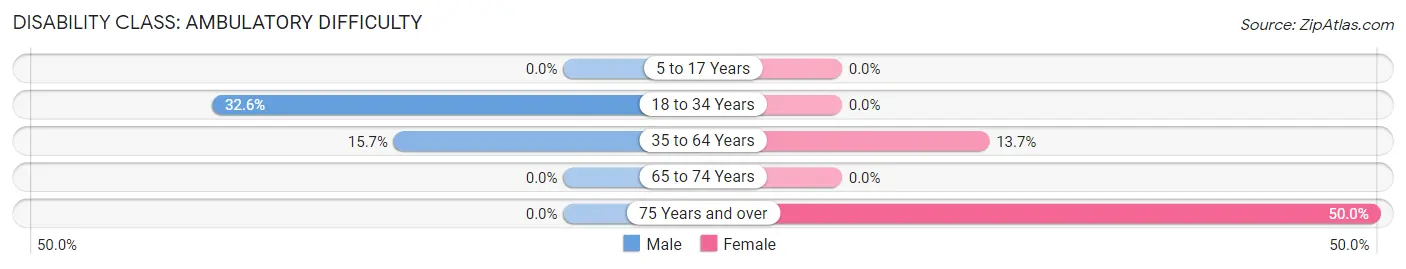
| Age Bracket | Male | Female |
| 5 to 17 Years | 0 (0.0%) | 0 (0.0%) |
| 18 to 34 Years | 15 (32.6%) | 0 (0.0%) |
| 35 to 64 Years | 14 (15.7%) | 13 (13.7%) |
| 65 to 74 Years | 0 (0.0%) | 0 (0.0%) |
| 75 Years and over | 0 (0.0%) | 5 (50.0%) |
Disability Class: Self-Care Difficulty
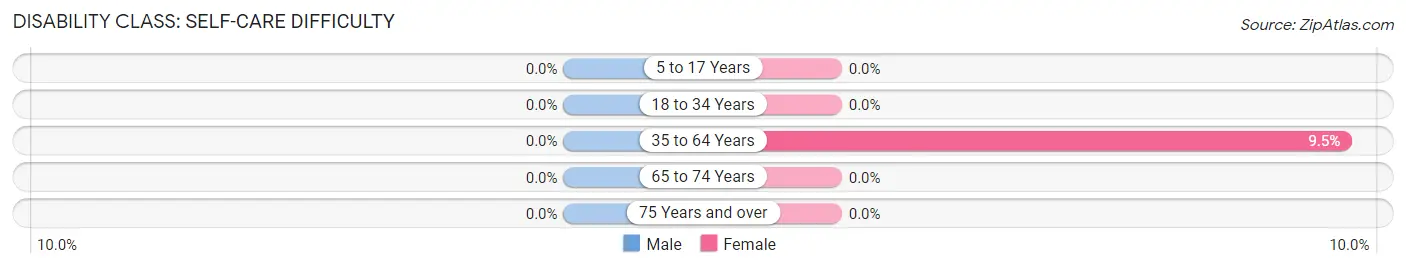
| Age Bracket | Male | Female |
| 5 to 17 Years | 0 (0.0%) | 0 (0.0%) |
| 18 to 34 Years | 0 (0.0%) | 0 (0.0%) |
| 35 to 64 Years | 0 (0.0%) | 9 (9.5%) |
| 65 to 74 Years | 0 (0.0%) | 0 (0.0%) |
| 75 Years and over | 0 (0.0%) | 0 (0.0%) |
Technology Access in Turrell
Computing Device Access in Turrell
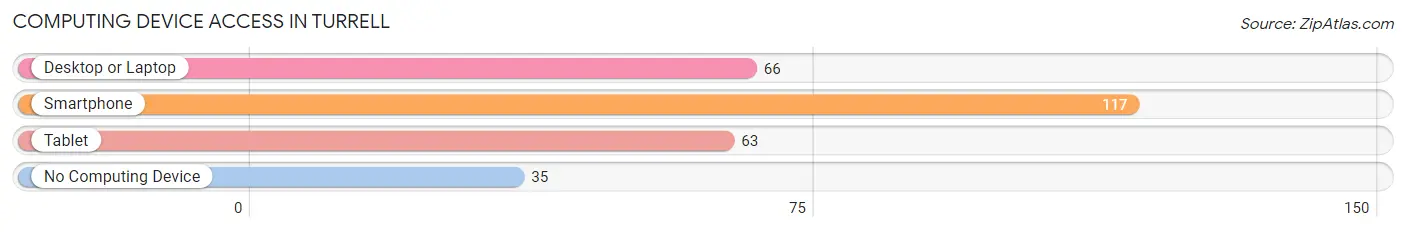
| Device Type | # Households | % Households |
| Desktop or Laptop | 66 | 43.4% |
| Smartphone | 117 | 77.0% |
| Tablet | 63 | 41.4% |
| No Computing Device | 35 | 23.0% |
| Total | 152 | 100.0% |
Internet Access in Turrell
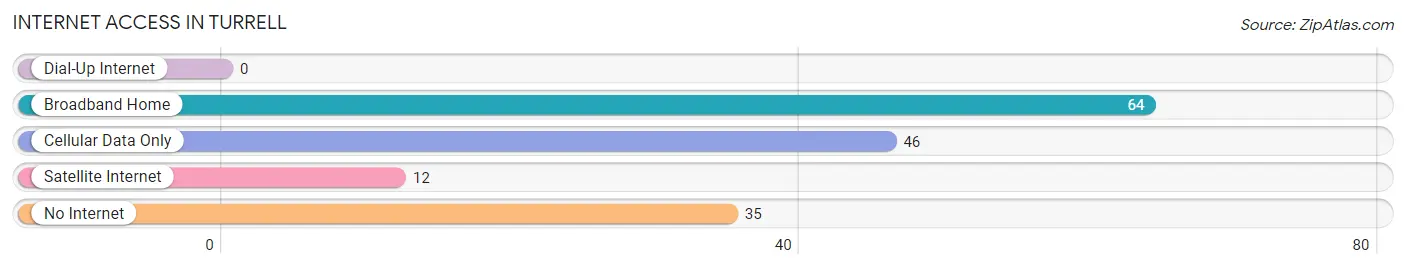
| Internet Type | # Households | % Households |
| Dial-Up Internet | 0 | 0.0% |
| Broadband Home | 64 | 42.1% |
| Cellular Data Only | 46 | 30.3% |
| Satellite Internet | 12 | 7.9% |
| No Internet | 35 | 23.0% |
| Total | 152 | 100.0% |
Turrell Summary
Turrell is a small town located in the northeast corner of Arkansas, in the Mississippi Delta region. It is situated in the county of Crittenden, and is part of the Memphis Metropolitan Statistical Area. The town has a population of 1,093, according to the 2010 census.
History
Turrell was founded in 1883 by the St. Louis, Iron Mountain and Southern Railway. The town was named after the railroad's president, William Turrell. The town was incorporated in 1887.
In the early 1900s, Turrell was a thriving agricultural community. Cotton was the main crop, and the town had several cotton gins and a cottonseed oil mill. The town also had a sawmill, a grist mill, and a brick factory.
In the 1920s, the town began to decline as the cotton industry declined. The Great Depression further exacerbated the town's economic woes. In the 1940s, the town began to experience a resurgence as the economy improved.
Geography
Turrell is located in the northeast corner of Arkansas, in the Mississippi Delta region. It is situated in the county of Crittenden, and is part of the Memphis Metropolitan Statistical Area. The town is located at the intersection of U.S. Route 61 and Arkansas Highway 77.
The town is situated on the banks of the St. Francis River. The town is surrounded by farmland and is located near the Big Lake Wildlife Management Area.
Economy
The economy of Turrell is largely based on agriculture. Cotton is the main crop, and the town has several cotton gins and a cottonseed oil mill. The town also has a sawmill, a grist mill, and a brick factory.
The town also has a few small businesses, including a grocery store, a hardware store, and a few restaurants.
Demographics
According to the 2010 census, Turrell has a population of 1,093. The racial makeup of the town is 79.3% White, 18.2% African American, 0.7% Native American, 0.2% Asian, 0.1% Pacific Islander, 0.7% from other races, and 0.9% from two or more races.
The median household income in Turrell is $25,938, and the median family income is $31,250. The per capita income is $14,845. The town has a poverty rate of 28.3%.
Conclusion
Turrell is a small town located in the northeast corner of Arkansas, in the Mississippi Delta region. It is situated in the county of Crittenden, and is part of the Memphis Metropolitan Statistical Area. The town has a population of 1,093, according to the 2010 census. The economy of Turrell is largely based on agriculture, with cotton being the main crop. The town also has a few small businesses, including a grocery store, a hardware store, and a few restaurants. The median household income in Turrell is $25,938, and the median family income is $31,250. The per capita income is $14,845. The town has a poverty rate of 28.3%.
Common Questions
What is Per Capita Income in Turrell?
Per Capita income in Turrell is $15,479.
What is the Median Family Income in Turrell?
Median Family Income in Turrell is $51,719.
What is the Median Household income in Turrell?
Median Household Income in Turrell is $36,111.
What is Income or Wage Gap in Turrell?
Income or Wage Gap in Turrell is 38.9%.
Women in Turrell earn 61.1 cents for every dollar earned by a man.
What is Inequality or Gini Index in Turrell?
Inequality or Gini Index in Turrell is 0.45.
What is the Total Population of Turrell?
Total Population of Turrell is 484.
What is the Total Male Population of Turrell?
Total Male Population of Turrell is 258.
What is the Total Female Population of Turrell?
Total Female Population of Turrell is 226.
What is the Ratio of Males per 100 Females in Turrell?
There are 114.16 Males per 100 Females in Turrell.
What is the Ratio of Females per 100 Males in Turrell?
There are 87.60 Females per 100 Males in Turrell.
What is the Median Population Age in Turrell?
Median Population Age in Turrell is 35.2 Years.
What is the Average Family Size in Turrell
Average Family Size in Turrell is 4.2 People.
What is the Average Household Size in Turrell
Average Household Size in Turrell is 3.2 People.
How Large is the Labor Force in Turrell?
There are 185 People in the Labor Forcein in Turrell.
What is the Percentage of People in the Labor Force in Turrell?
50.0% of People are in the Labor Force in Turrell.
What is the Unemployment Rate in Turrell?
Unemployment Rate in Turrell is 29.2%.