Russell, AR Map & Demographics
Russell Map
Russell Overview
$15,815
PER CAPITA INCOME
$21,042
AVG FAMILY INCOME
$22,895
AVG HOUSEHOLD INCOME
$14,300
FAMILY INCOME DEFICIT
0.45
INEQUALITY / GINI INDEX
289
TOTAL POPULATION
135
MALE POPULATION
154
FEMALE POPULATION
87.66
MALES / 100 FEMALES
114.07
FEMALES / 100 MALES
39.9
MEDIAN AGE
3.1
AVG FAMILY SIZE
2.3
AVG HOUSEHOLD SIZE
76
LABOR FORCE [ PEOPLE ]
34.5%
PERCENT IN LABOR FORCE
7.9%
UNEMPLOYMENT RATE
Russell Zip Codes
Russell Area Codes
Income in Russell
Income Overview in Russell
Per Capita Income in Russell is $15,815, while median incomes of families and households are $21,042 and $22,895 respectively.
| Characteristic | Number | Measure |
| Per Capita Income | 289 | $15,815 |
| Median Family Income | 65 | $21,042 |
| Mean Family Income | 65 | $40,555 |
| Median Household Income | 126 | $22,895 |
| Mean Household Income | 126 | $34,970 |
| Income Deficit | 65 | $14,300 |
| Wage / Income Gap (%) | 289 | 0.00% |
| Wage / Income Gap ($) | 289 | 100.00¢ per $1 |
| Gini / Inequality Index | 289 | 0.45 |
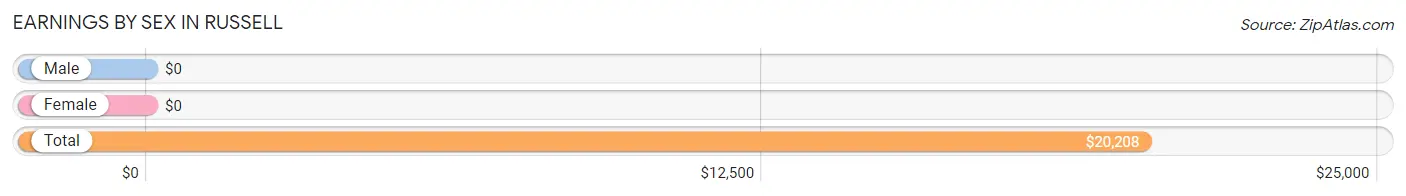
Earnings by Sex in Russell
| Sex | Number | Average Earnings |
| Male | 44 (56.4%) | $0 |
| Female | 34 (43.6%) | $0 |
| Total | 78 (100.0%) | $20,208 |
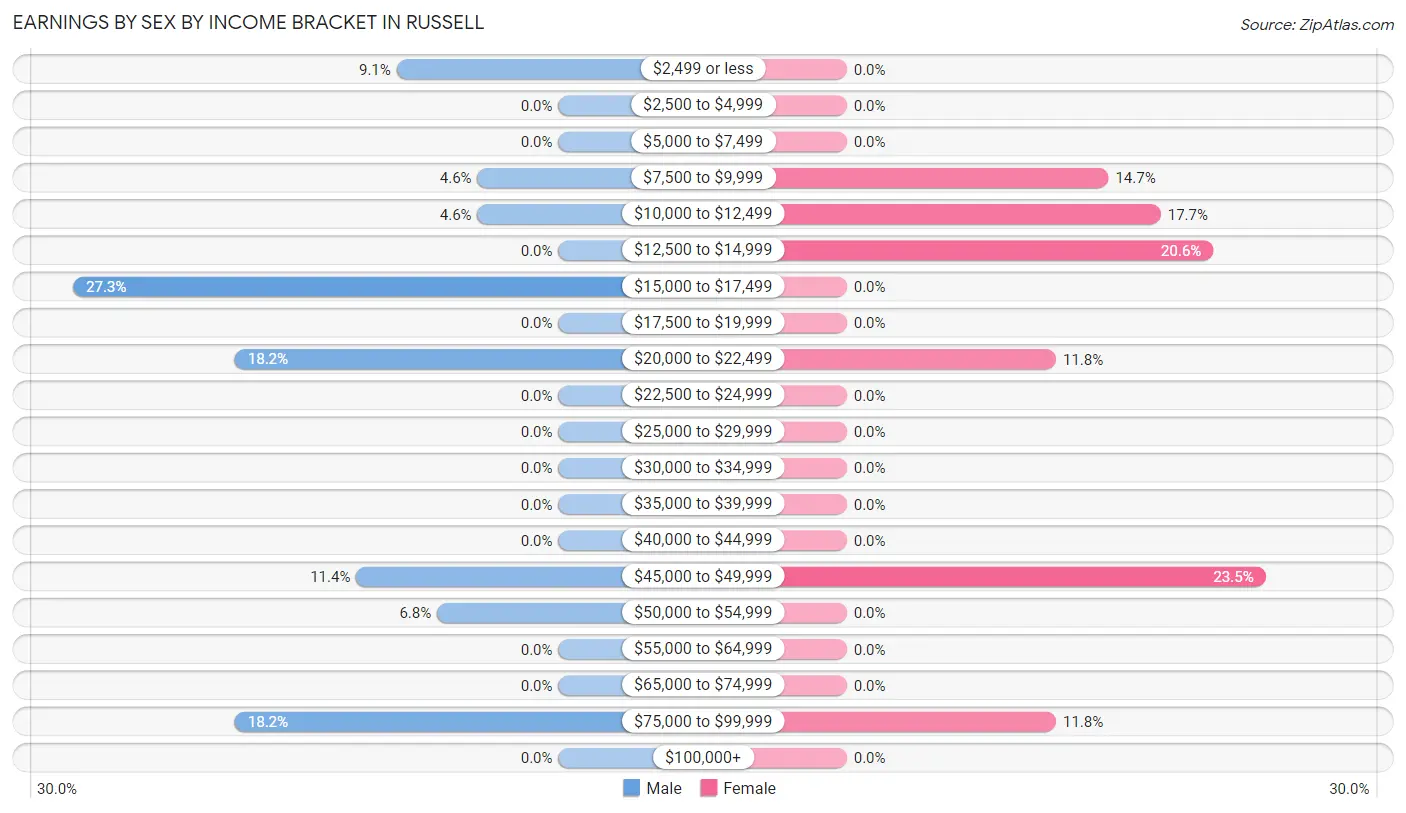
Earnings by Sex by Income Bracket in Russell
The most common earnings brackets in Russell are $15,000 to $17,499 for men (12 | 27.3%) and $45,000 to $49,999 for women (8 | 23.5%).
| Income | Male | Female |
| $2,499 or less | 4 (9.1%) | 0 (0.0%) |
| $2,500 to $4,999 | 0 (0.0%) | 0 (0.0%) |
| $5,000 to $7,499 | 0 (0.0%) | 0 (0.0%) |
| $7,500 to $9,999 | 2 (4.5%) | 5 (14.7%) |
| $10,000 to $12,499 | 2 (4.5%) | 6 (17.6%) |
| $12,500 to $14,999 | 0 (0.0%) | 7 (20.6%) |
| $15,000 to $17,499 | 12 (27.3%) | 0 (0.0%) |
| $17,500 to $19,999 | 0 (0.0%) | 0 (0.0%) |
| $20,000 to $22,499 | 8 (18.2%) | 4 (11.8%) |
| $22,500 to $24,999 | 0 (0.0%) | 0 (0.0%) |
| $25,000 to $29,999 | 0 (0.0%) | 0 (0.0%) |
| $30,000 to $34,999 | 0 (0.0%) | 0 (0.0%) |
| $35,000 to $39,999 | 0 (0.0%) | 0 (0.0%) |
| $40,000 to $44,999 | 0 (0.0%) | 0 (0.0%) |
| $45,000 to $49,999 | 5 (11.4%) | 8 (23.5%) |
| $50,000 to $54,999 | 3 (6.8%) | 0 (0.0%) |
| $55,000 to $64,999 | 0 (0.0%) | 0 (0.0%) |
| $65,000 to $74,999 | 0 (0.0%) | 0 (0.0%) |
| $75,000 to $99,999 | 8 (18.2%) | 4 (11.8%) |
| $100,000+ | 0 (0.0%) | 0 (0.0%) |
| Total | 44 (100.0%) | 34 (100.0%) |
Earnings by Sex by Educational Attainment in Russell
| Educational Attainment | Male Income | Female Income |
| Less than High School | - | - |
| High School Diploma | - | - |
| College or Associate's Degree | - | - |
| Bachelor's Degree | - | - |
| Graduate Degree | - | - |
| Total | - | - |
Family Income in Russell
Family Income Brackets in Russell
According to the Russell family income data, there are 16 families falling into the less than $10,000 income range, which is the most common income bracket and makes up 24.6% of all families.
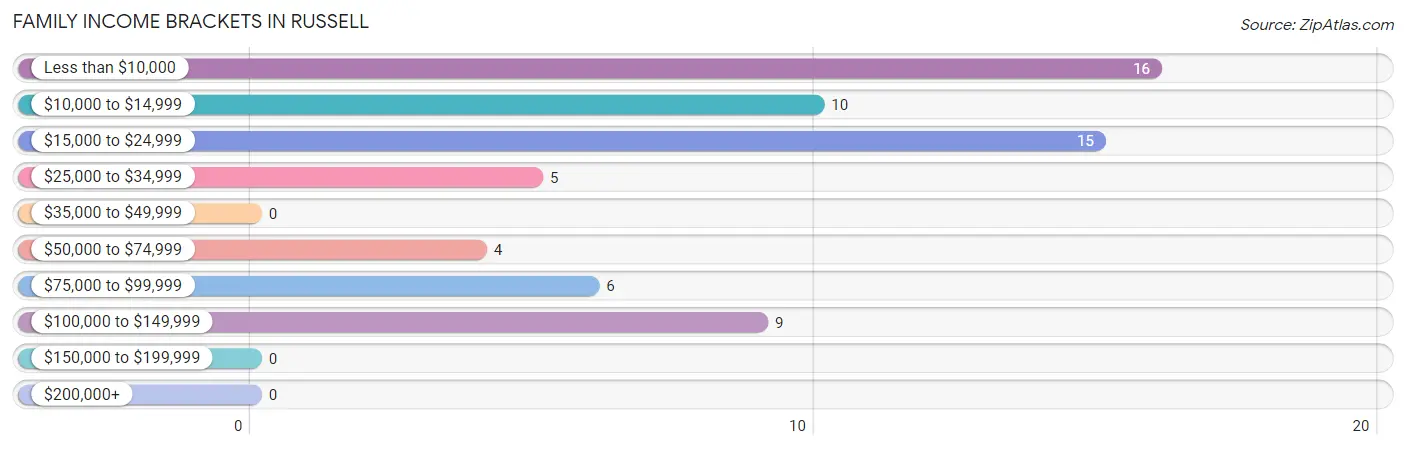
| Income Bracket | # Families | % Families |
| Less than $10,000 | 16 | 24.6% |
| $10,000 to $14,999 | 10 | 15.4% |
| $15,000 to $24,999 | 15 | 23.1% |
| $25,000 to $34,999 | 5 | 7.7% |
| $35,000 to $49,999 | 0 | 0.0% |
| $50,000 to $74,999 | 4 | 6.2% |
| $75,000 to $99,999 | 6 | 9.2% |
| $100,000 to $149,999 | 9 | 13.8% |
| $150,000 to $199,999 | 0 | 0.0% |
| $200,000+ | 0 | 0.0% |
Family Income by Famaliy Size in Russell
2-person families (39 | 60.0%) account for the highest median family income in Russell with $24,250 per family, while 2-person families (39 | 60.0%) have the highest median income of $12,125 per family member.
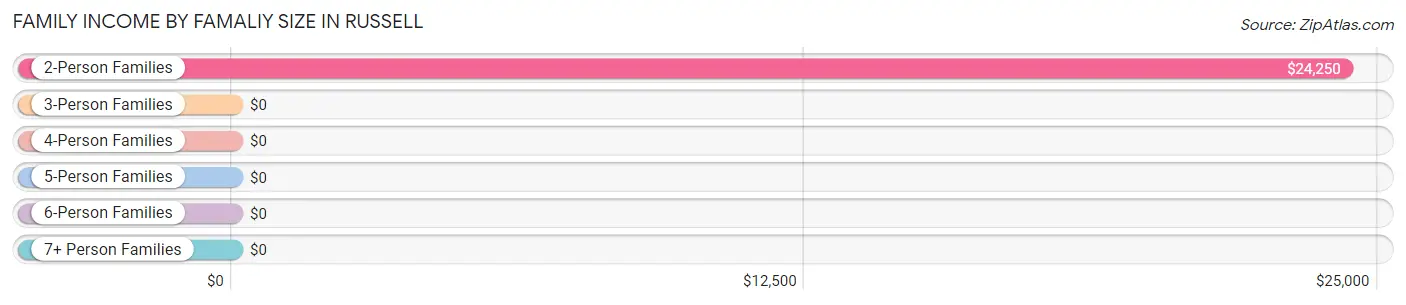
| Income Bracket | # Families | Median Income |
| 2-Person Families | 39 (60.0%) | $24,250 |
| 3-Person Families | 9 (13.9%) | $0 |
| 4-Person Families | 6 (9.2%) | $0 |
| 5-Person Families | 7 (10.8%) | $0 |
| 6-Person Families | 0 (0.0%) | $0 |
| 7+ Person Families | 4 (6.1%) | $0 |
| Total | 65 (100.0%) | $21,042 |
Family Income by Number of Earners in Russell
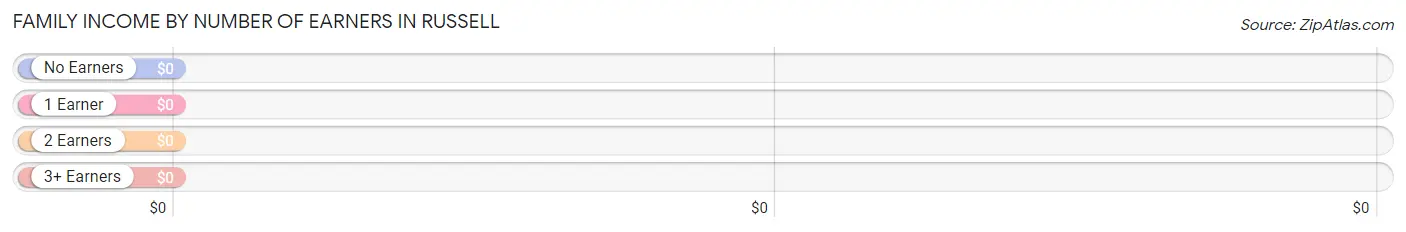
| Number of Earners | # Families | Median Income |
| No Earners | 28 (43.1%) | $0 |
| 1 Earner | 26 (40.0%) | $0 |
| 2 Earners | 9 (13.9%) | $0 |
| 3+ Earners | 2 (3.1%) | $0 |
| Total | 65 (100.0%) | $21,042 |
Household Income in Russell
Household Income Brackets in Russell
With 49 households falling in the category, the $15,000 to $24,999 income range is the most frequent in Russell, accounting for 38.9% of all households.

| Income Bracket | # Households | % Households |
| Less than $10,000 | 20 | 15.9% |
| $10,000 to $14,999 | 10 | 7.9% |
| $15,000 to $24,999 | 49 | 38.9% |
| $25,000 to $34,999 | 18 | 14.3% |
| $35,000 to $49,999 | 6 | 4.8% |
| $50,000 to $74,999 | 4 | 3.2% |
| $75,000 to $99,999 | 10 | 7.9% |
| $100,000 to $149,999 | 9 | 7.1% |
| $150,000 to $199,999 | 0 | 0.0% |
| $200,000+ | 0 | 0.0% |
Household Income by Householder Age in Russell
The median household income in Russell is $22,895, with the highest median household income of $28,958 found in the 45 to 64 years age bracket for the primary householder. A total of 57 households (45.2%) fall into this category. Meanwhile, the 15 to 24 years age bracket for the primary householder has the lowest median household income of $0, with 1 households (0.8%) in this group.
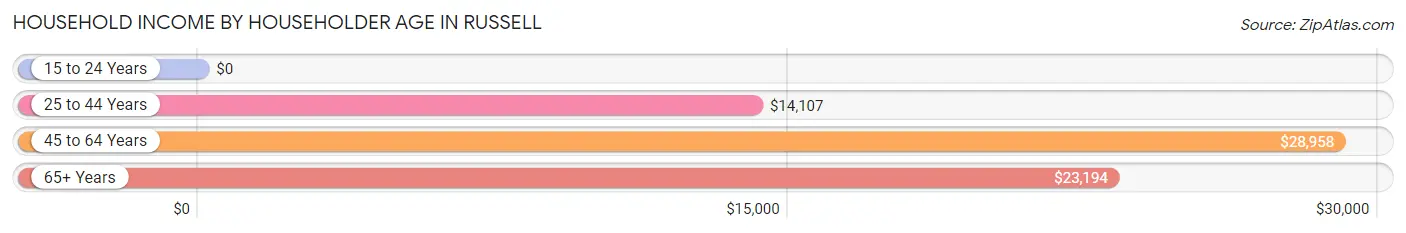
| Income Bracket | # Households | Median Income |
| 15 to 24 Years | 1 (0.8%) | $0 |
| 25 to 44 Years | 25 (19.8%) | $14,107 |
| 45 to 64 Years | 57 (45.2%) | $28,958 |
| 65+ Years | 43 (34.1%) | $23,194 |
| Total | 126 (100.0%) | $22,895 |
Poverty in Russell
Income Below Poverty by Sex and Age in Russell
With 41.1% poverty level for males and 51.9% for females among the residents of Russell, under 5 year old males and under 5 year old females are the most vulnerable to poverty, with 1 males (100.0%) and 10 females (100.0%) in their respective age groups living below the poverty level.
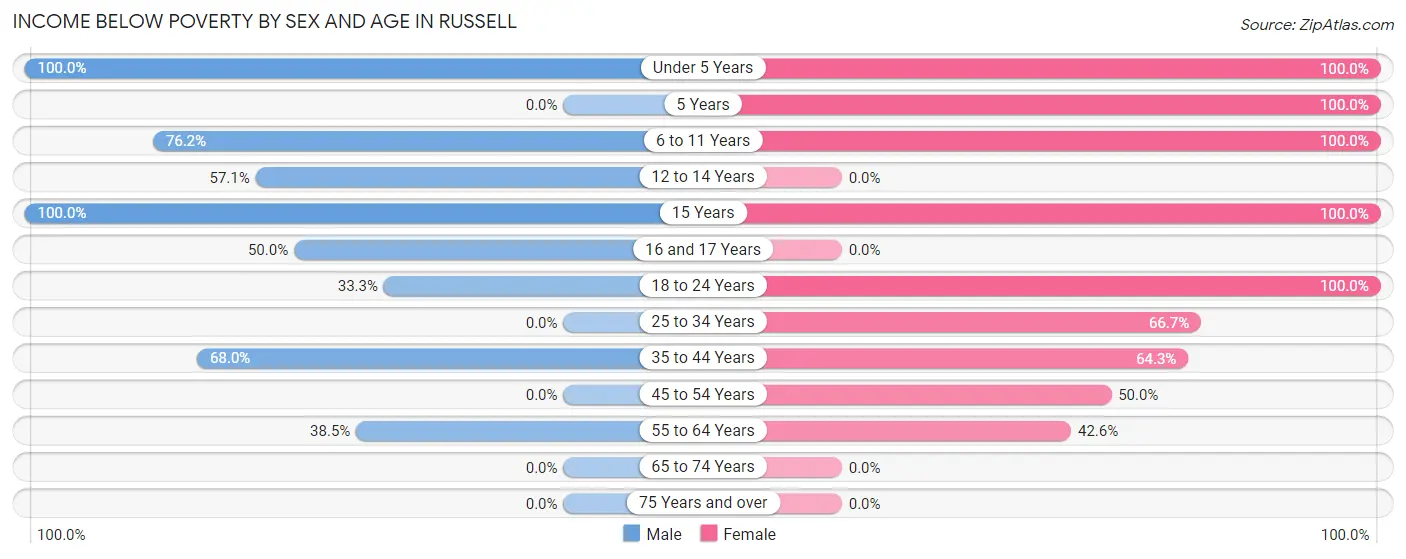
| Age Bracket | Male | Female |
| Under 5 Years | 1 (100.0%) | 10 (100.0%) |
| 5 Years | 0 (0.0%) | 3 (100.0%) |
| 6 to 11 Years | 16 (76.2%) | 8 (100.0%) |
| 12 to 14 Years | 8 (57.1%) | 0 (0.0%) |
| 15 Years | 1 (100.0%) | 5 (100.0%) |
| 16 and 17 Years | 4 (50.0%) | 0 (0.0%) |
| 18 to 24 Years | 1 (33.3%) | 1 (100.0%) |
| 25 to 34 Years | 0 (0.0%) | 20 (66.7%) |
| 35 to 44 Years | 17 (68.0%) | 9 (64.3%) |
| 45 to 54 Years | 0 (0.0%) | 4 (50.0%) |
| 55 to 64 Years | 5 (38.5%) | 20 (42.5%) |
| 65 to 74 Years | 0 (0.0%) | 0 (0.0%) |
| 75 Years and over | 0 (0.0%) | 0 (0.0%) |
| Total | 53 (41.1%) | 80 (51.9%) |
Income Above Poverty by Sex and Age in Russell
According to the poverty statistics in Russell, males aged 25 to 34 years and females aged 65 to 74 years are the age groups that are most secure financially, with 100.0% of males and 100.0% of females in these age groups living above the poverty line.
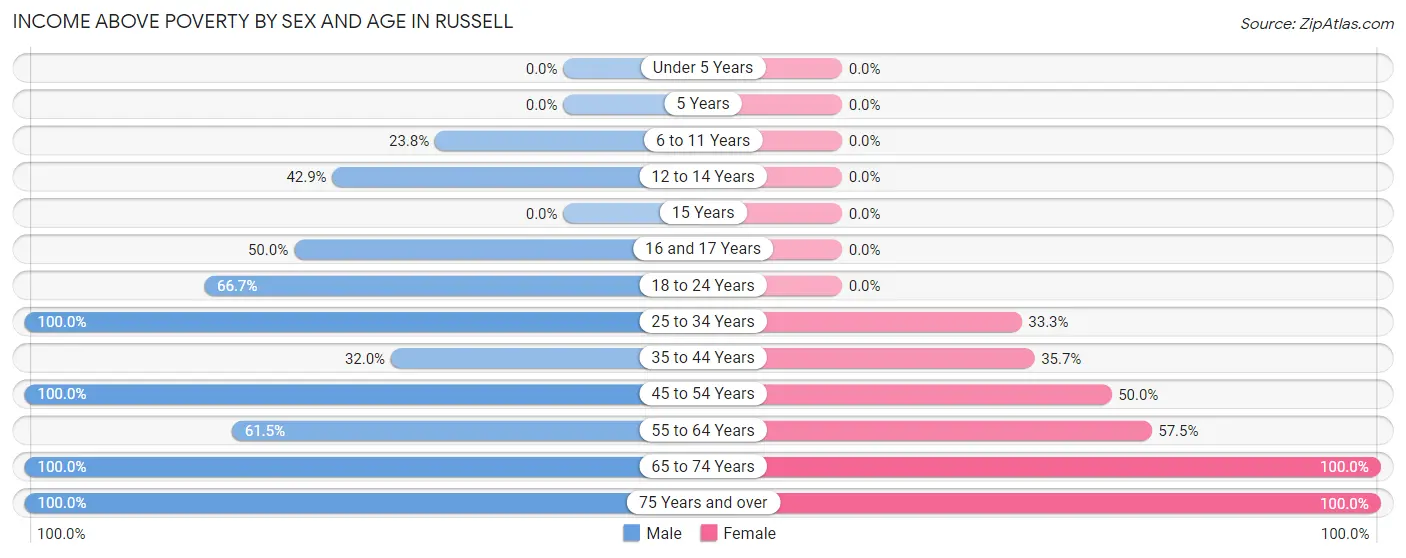
| Age Bracket | Male | Female |
| Under 5 Years | 0 (0.0%) | 0 (0.0%) |
| 5 Years | 0 (0.0%) | 0 (0.0%) |
| 6 to 11 Years | 5 (23.8%) | 0 (0.0%) |
| 12 to 14 Years | 6 (42.9%) | 0 (0.0%) |
| 15 Years | 0 (0.0%) | 0 (0.0%) |
| 16 and 17 Years | 4 (50.0%) | 0 (0.0%) |
| 18 to 24 Years | 2 (66.7%) | 0 (0.0%) |
| 25 to 34 Years | 19 (100.0%) | 10 (33.3%) |
| 35 to 44 Years | 8 (32.0%) | 5 (35.7%) |
| 45 to 54 Years | 4 (100.0%) | 4 (50.0%) |
| 55 to 64 Years | 8 (61.5%) | 27 (57.5%) |
| 65 to 74 Years | 16 (100.0%) | 9 (100.0%) |
| 75 Years and over | 4 (100.0%) | 19 (100.0%) |
| Total | 76 (58.9%) | 74 (48.0%) |
Income Below Poverty Among Married-Couple Families in Russell
The poverty statistics for married-couple families in Russell show that 20.6% or 7 of the total 34 families live below the poverty line. Families with 1 or 2 children have the highest poverty rate of 100.0%, comprising of 1 families. On the other hand, families with 3 or 4 children have the lowest poverty rate of 0.0%, which includes 0 families.
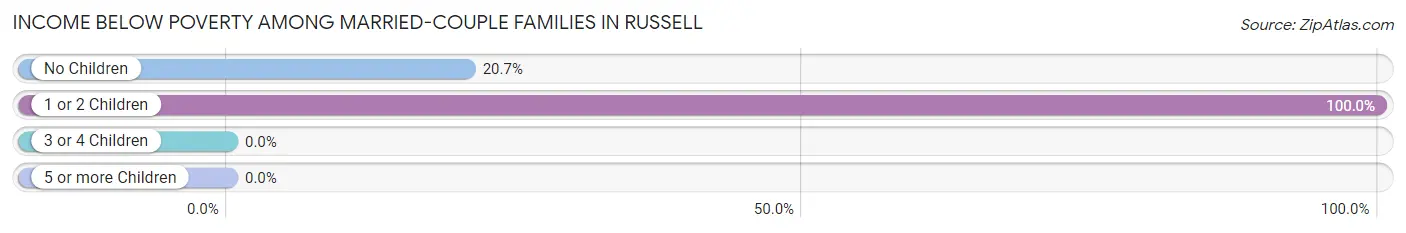
| Children | Above Poverty | Below Poverty |
| No Children | 23 (79.3%) | 6 (20.7%) |
| 1 or 2 Children | 0 (0.0%) | 1 (100.0%) |
| 3 or 4 Children | 4 (100.0%) | 0 (0.0%) |
| 5 or more Children | 0 (0.0%) | 0 (0.0%) |
| Total | 27 (79.4%) | 7 (20.6%) |
Income Below Poverty Among Single-Parent Households in Russell
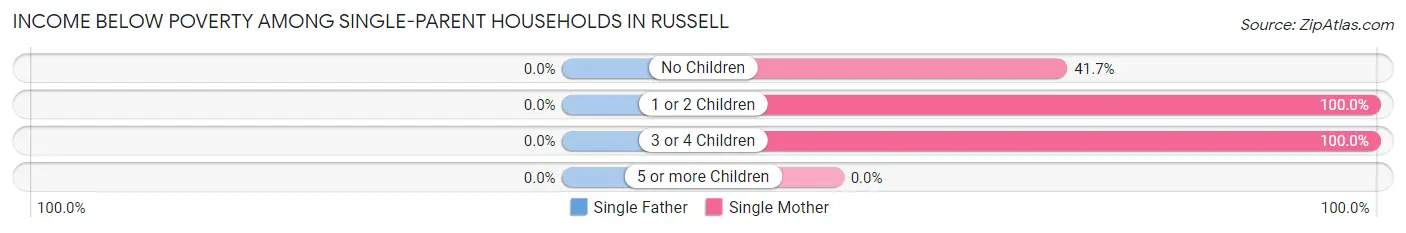
| Children | Single Father | Single Mother |
| No Children | 0 (0.0%) | 5 (41.7%) |
| 1 or 2 Children | 0 (0.0%) | 7 (100.0%) |
| 3 or 4 Children | 0 (0.0%) | 12 (100.0%) |
| 5 or more Children | 0 (0.0%) | 0 (0.0%) |
| Total | 0 (0.0%) | 24 (77.4%) |
Income Below Poverty Among Married-Couple vs Single-Parent Households in Russell
The poverty data for Russell shows that 7 of the married-couple family households (20.6%) and 24 of the single-parent households (77.4%) are living below the poverty level. Within the married-couple family households, those with 1 or 2 children have the highest poverty rate, with 1 households (100.0%) falling below the poverty line. Among the single-parent households, those with 1 or 2 children have the highest poverty rate, with 7 household (100.0%) living below poverty.
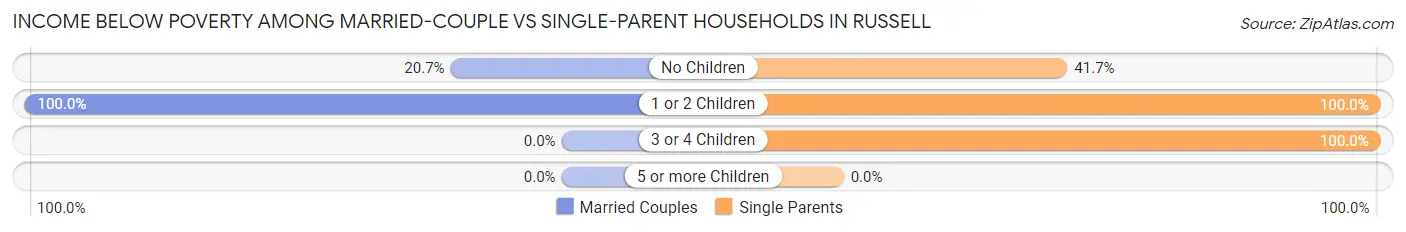
| Children | Married-Couple Families | Single-Parent Households |
| No Children | 6 (20.7%) | 5 (41.7%) |
| 1 or 2 Children | 1 (100.0%) | 7 (100.0%) |
| 3 or 4 Children | 0 (0.0%) | 12 (100.0%) |
| 5 or more Children | 0 (0.0%) | 0 (0.0%) |
| Total | 7 (20.6%) | 24 (77.4%) |
Race in Russell
The most populous races in Russell are White / Caucasian (282 | 97.6%), Hispanic or Latino (2 | 0.7%), and Native / Alaskan (2 | 0.7%).
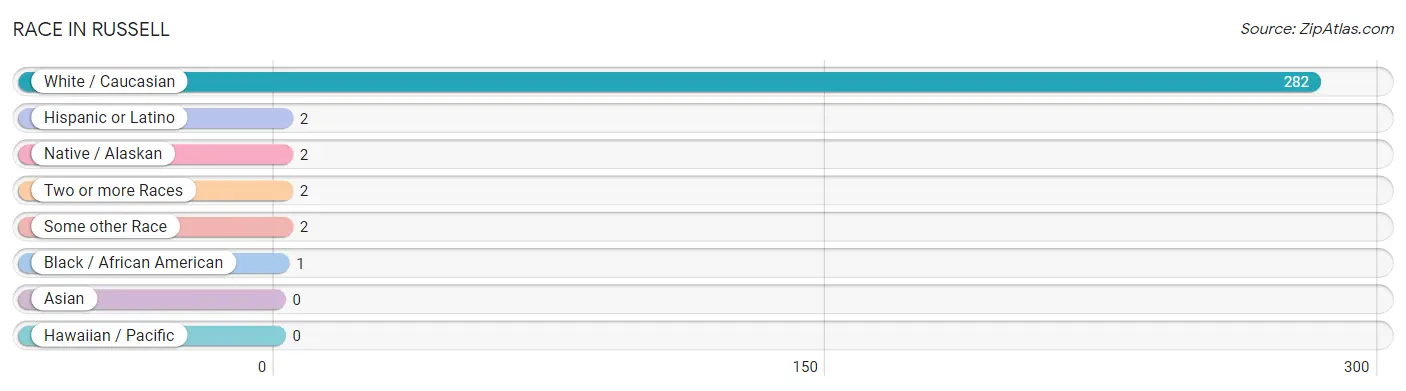
| Race | # Population | % Population |
| Asian | 0 | 0.0% |
| Black / African American | 1 | 0.4% |
| Hawaiian / Pacific | 0 | 0.0% |
| Hispanic or Latino | 2 | 0.7% |
| Native / Alaskan | 2 | 0.7% |
| White / Caucasian | 282 | 97.6% |
| Two or more Races | 2 | 0.7% |
| Some other Race | 2 | 0.7% |
| Total | 289 | 100.0% |
Ancestry in Russell
The most populous ancestries reported in Russell are German (56 | 19.4%), Irish (56 | 19.4%), Dutch (18 | 6.2%), English (12 | 4.2%), and Mexican (2 | 0.7%), together accounting for 49.8% of all Russell residents.
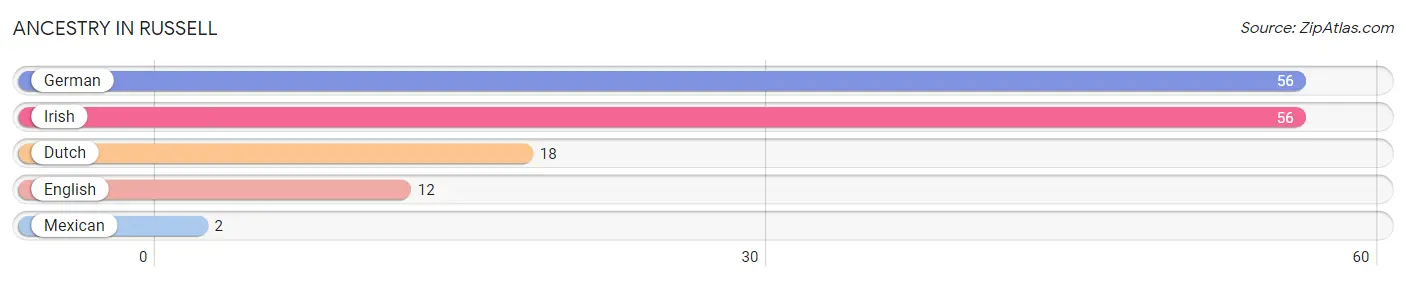
| Ancestry | # Population | % Population |
| Dutch | 18 | 6.2% |
| English | 12 | 4.2% |
| German | 56 | 19.4% |
| Irish | 56 | 19.4% |
| Mexican | 2 | 0.7% | View All 5 Rows |
Immigrants in Russell
The most numerous immigrant groups reported in Russell came from Central America (2 | 0.7%), Latin America (2 | 0.7%), and Mexico (2 | 0.7%), together accounting for 2.1% of all Russell residents.
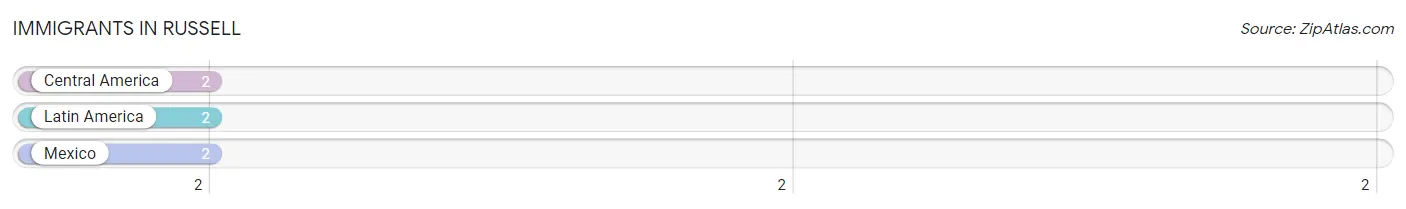
| Immigration Origin | # Population | % Population |
| Central America | 2 | 0.7% |
| Latin America | 2 | 0.7% |
| Mexico | 2 | 0.7% | View All 3 Rows |
Sex and Age in Russell
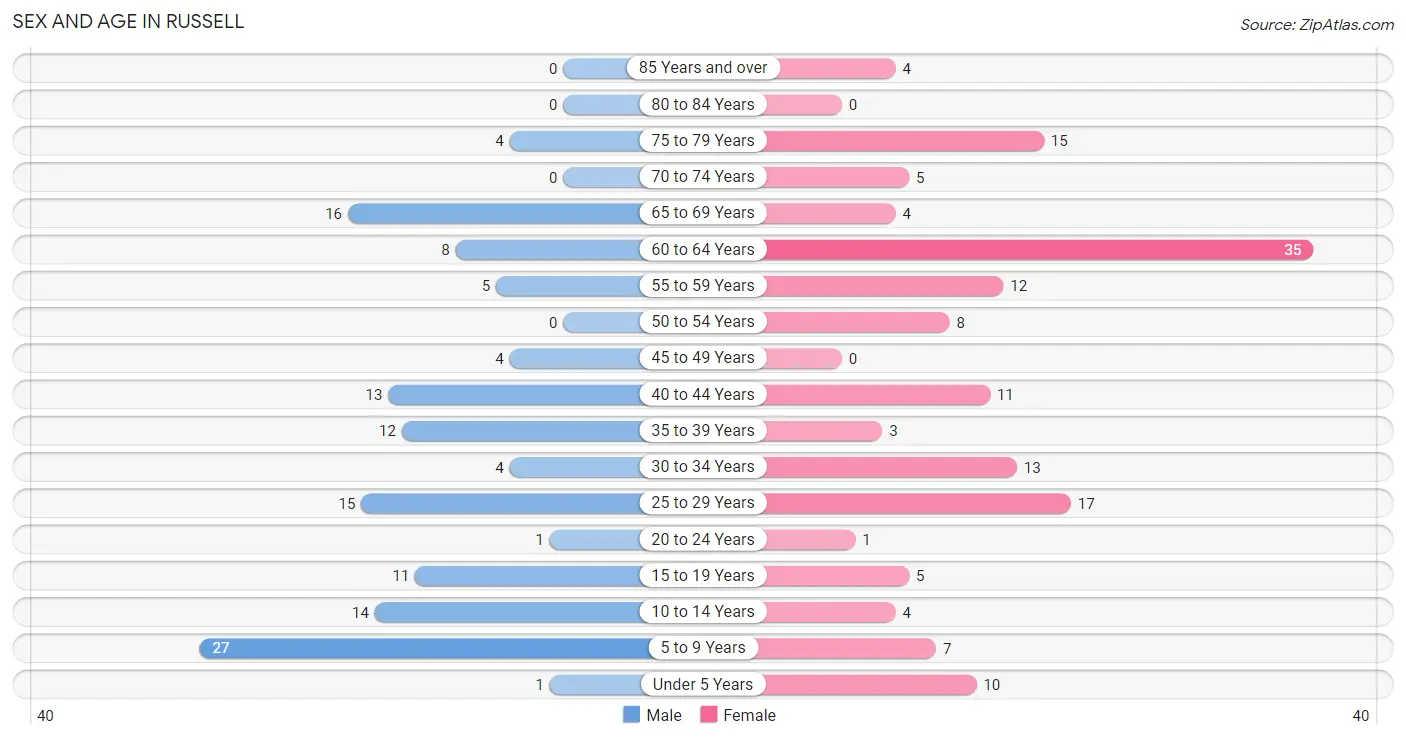
Sex and Age in Russell
The most populous age groups in Russell are 5 to 9 Years (27 | 20.0%) for men and 60 to 64 Years (35 | 22.7%) for women.
| Age Bracket | Male | Female |
| Under 5 Years | 1 (0.7%) | 10 (6.5%) |
| 5 to 9 Years | 27 (20.0%) | 7 (4.5%) |
| 10 to 14 Years | 14 (10.4%) | 4 (2.6%) |
| 15 to 19 Years | 11 (8.2%) | 5 (3.3%) |
| 20 to 24 Years | 1 (0.7%) | 1 (0.6%) |
| 25 to 29 Years | 15 (11.1%) | 17 (11.0%) |
| 30 to 34 Years | 4 (3.0%) | 13 (8.4%) |
| 35 to 39 Years | 12 (8.9%) | 3 (1.9%) |
| 40 to 44 Years | 13 (9.6%) | 11 (7.1%) |
| 45 to 49 Years | 4 (3.0%) | 0 (0.0%) |
| 50 to 54 Years | 0 (0.0%) | 8 (5.2%) |
| 55 to 59 Years | 5 (3.7%) | 12 (7.8%) |
| 60 to 64 Years | 8 (5.9%) | 35 (22.7%) |
| 65 to 69 Years | 16 (11.8%) | 4 (2.6%) |
| 70 to 74 Years | 0 (0.0%) | 5 (3.3%) |
| 75 to 79 Years | 4 (3.0%) | 15 (9.7%) |
| 80 to 84 Years | 0 (0.0%) | 0 (0.0%) |
| 85 Years and over | 0 (0.0%) | 4 (2.6%) |
| Total | 135 (100.0%) | 154 (100.0%) |
Families and Households in Russell
Median Family Size in Russell
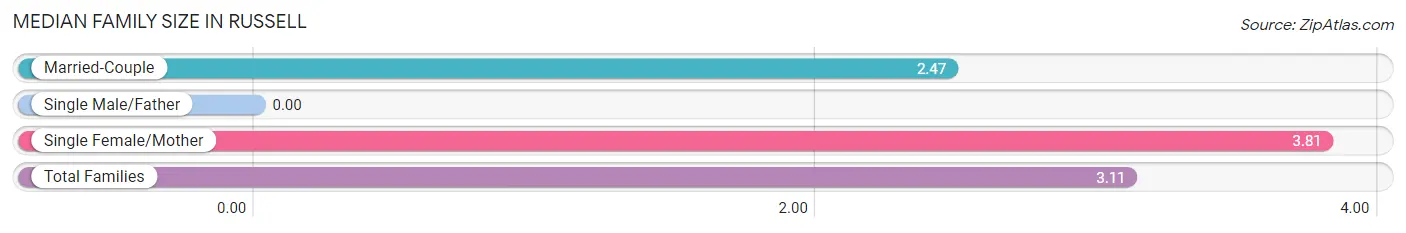
| Family Type | # Families | Family Size |
| Married-Couple | 34 (52.3%) | 2.47 |
| Single Male/Father | 0 (0.0%) | - |
| Single Female/Mother | 31 (47.7%) | 3.81 |
| Total Families | 65 (100.0%) | 3.11 |
Median Household Size in Russell
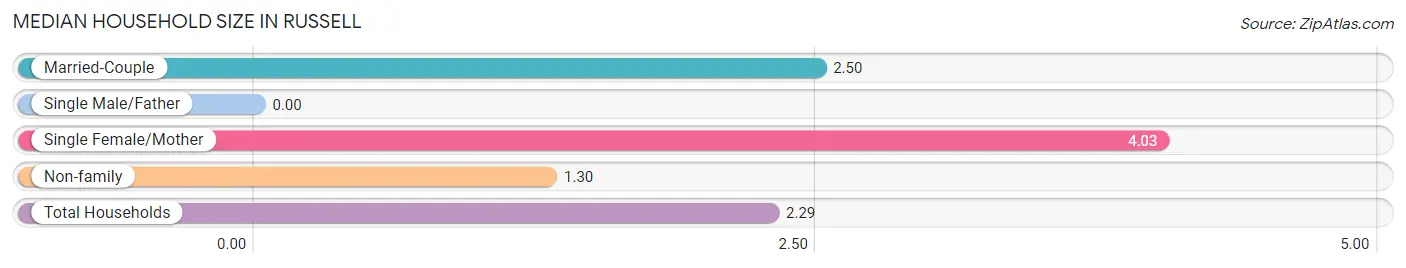
| Household Type | # Households | Household Size |
| Married-Couple | 34 (27.0%) | 2.50 |
| Single Male/Father | 0 (0.0%) | - |
| Single Female/Mother | 31 (24.6%) | 4.03 |
| Non-family | 61 (48.4%) | 1.30 |
| Total Households | 126 (100.0%) | 2.29 |
Household Size by Marriage Status in Russell
Out of a total of 126 households in Russell, 65 (51.6%) are family households, while 61 (48.4%) are nonfamily households. The most numerous type of family households are 2-person households, comprising 38, and the most common type of nonfamily households are 1-person households, comprising 50.
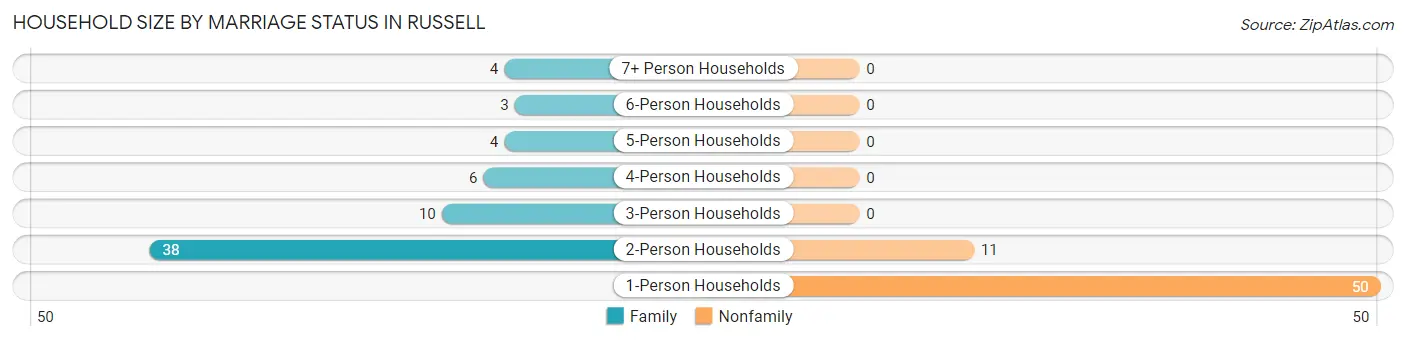
| Household Size | Family Households | Nonfamily Households |
| 1-Person Households | - | 50 (39.7%) |
| 2-Person Households | 38 (30.2%) | 11 (8.7%) |
| 3-Person Households | 10 (7.9%) | 0 (0.0%) |
| 4-Person Households | 6 (4.8%) | 0 (0.0%) |
| 5-Person Households | 4 (3.2%) | 0 (0.0%) |
| 6-Person Households | 3 (2.4%) | 0 (0.0%) |
| 7+ Person Households | 4 (3.2%) | 0 (0.0%) |
| Total | 65 (51.6%) | 61 (48.4%) |
Female Fertility in Russell
Fertility by Age in Russell
Average fertility rate in Russell is 259.0 births per 1,000 women. Women in the age bracket of 20 to 34 years have the highest fertility rate with 452.0 births per 1,000 women. Women in the age bracket of 20 to 34 years acount for 100.0% of all women with births.
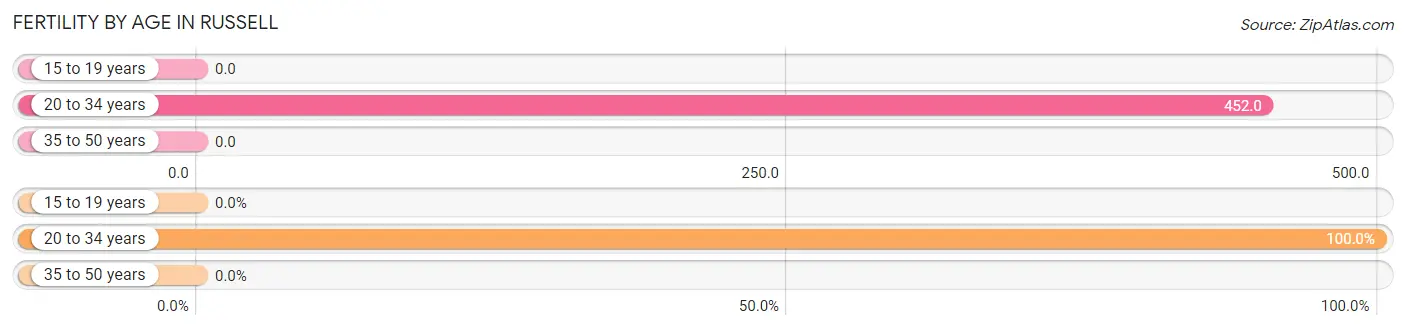
| Age Bracket | Women with Births | Births / 1,000 Women |
| 15 to 19 years | 0 (0.0%) | 0.0 |
| 20 to 34 years | 14 (100.0%) | 452.0 |
| 35 to 50 years | 0 (0.0%) | 0.0 |
| Total | 14 (100.0%) | 259.0 |
Fertility by Age by Marriage Status in Russell
7.1% of women with births (14) in Russell are married. The highest percentage of unmarried women with births falls into 20 to 34 years age bracket with 92.9% of them unmarried at the time of birth, while the lowest percentage of unmarried women with births belong to 20 to 34 years age bracket with 92.9% of them unmarried.
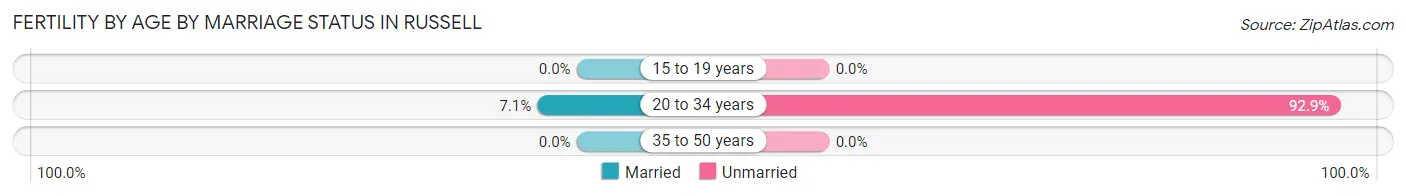
| Age Bracket | Married | Unmarried |
| 15 to 19 years | 0 (0.0%) | 0 (0.0%) |
| 20 to 34 years | 1 (7.1%) | 13 (92.9%) |
| 35 to 50 years | 0 (0.0%) | 0 (0.0%) |
| Total | 1 (7.1%) | 13 (92.9%) |
Fertility by Education in Russell
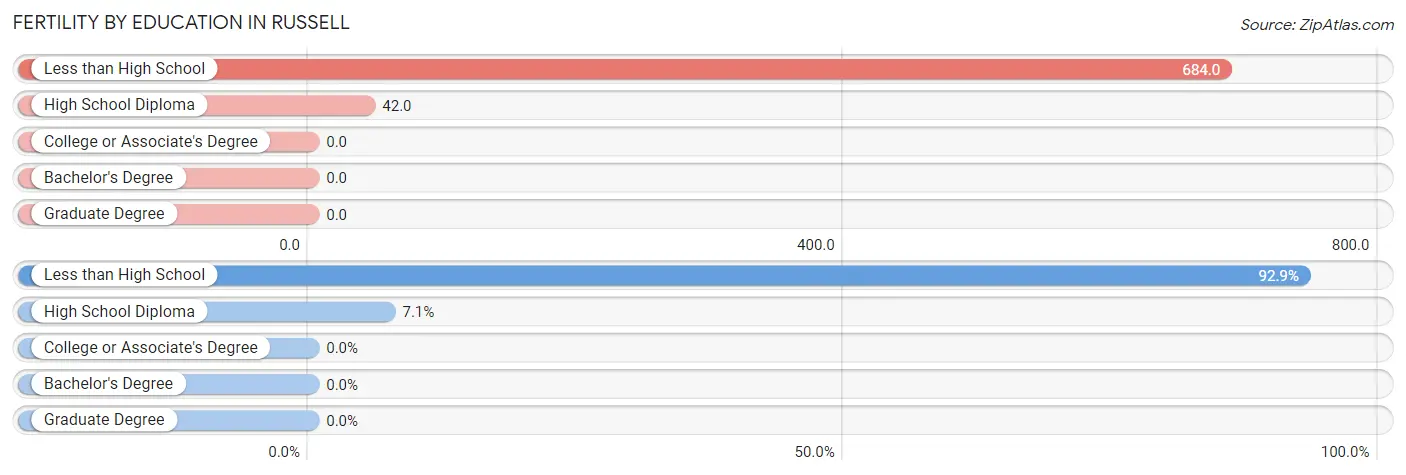
| Educational Attainment | Women with Births | Births / 1,000 Women |
| Less than High School | 13 (92.9%) | 684.0 |
| High School Diploma | 1 (7.1%) | 42.0 |
| College or Associate's Degree | 0 (0.0%) | 0.0 |
| Bachelor's Degree | 0 (0.0%) | 0.0 |
| Graduate Degree | 0 (0.0%) | 0.0 |
| Total | 14 (100.0%) | 259.0 |
Fertility by Education by Marriage Status in Russell
92.9% of women with births in Russell are unmarried. Women with the educational attainment of high school diploma are most likely to be married with 100.0% of them married at childbirth, while women with the educational attainment of less than high school are least likely to be married with 100.0% of them unmarried at childbirth.
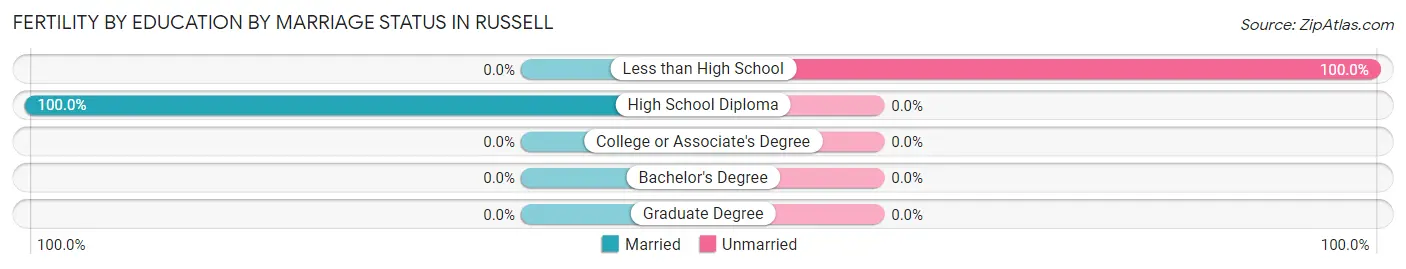
| Educational Attainment | Married | Unmarried |
| Less than High School | 0 (0.0%) | 13 (100.0%) |
| High School Diploma | 1 (100.0%) | 0 (0.0%) |
| College or Associate's Degree | 0 (0.0%) | 0 (0.0%) |
| Bachelor's Degree | 0 (0.0%) | 0 (0.0%) |
| Graduate Degree | 0 (0.0%) | 0 (0.0%) |
| Total | 1 (7.1%) | 13 (92.9%) |
Employment Characteristics in Russell
Employment by Class of Employer in Russell
Among the 70 employed individuals in Russell, private company employees (58 | 82.9%), not-for-profit organizations (6 | 8.6%), and state government employees (6 | 8.6%) make up the most common classes of employment.
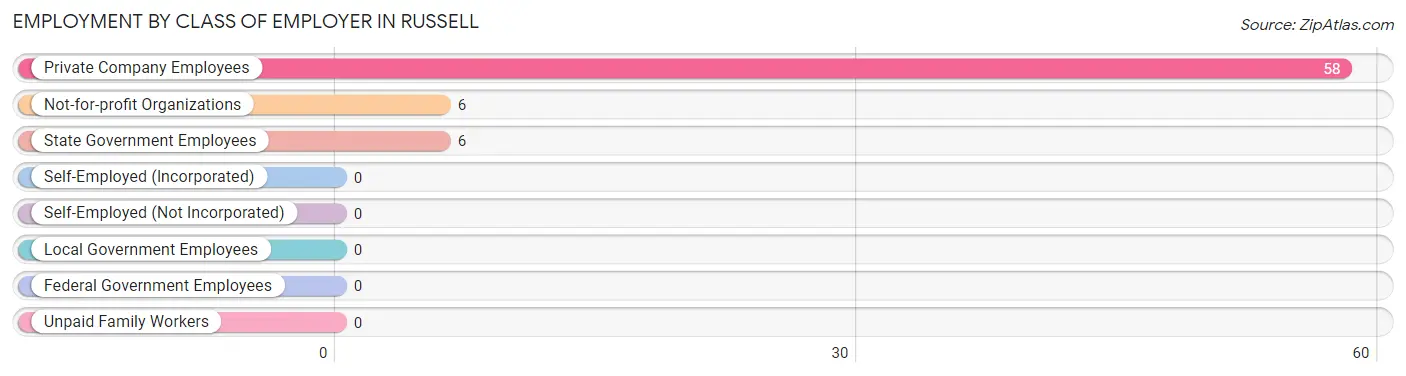
| Employer Class | # Employees | % Employees |
| Private Company Employees | 58 | 82.9% |
| Self-Employed (Incorporated) | 0 | 0.0% |
| Self-Employed (Not Incorporated) | 0 | 0.0% |
| Not-for-profit Organizations | 6 | 8.6% |
| Local Government Employees | 0 | 0.0% |
| State Government Employees | 6 | 8.6% |
| Federal Government Employees | 0 | 0.0% |
| Unpaid Family Workers | 0 | 0.0% |
| Total | 70 | 100.0% |
Employment Status by Age in Russell
According to the labor force statistics for Russell, out of the total population over 16 years of age (220), 34.5% or 76 individuals are in the labor force, with 7.9% or 6 of them unemployed. The age group with the highest labor force participation rate is 30 to 34 years, with 100.0% or 17 individuals in the labor force. Within the labor force, the 35 to 44 years age range has the highest percentage of unemployed individuals, with 66.7% or 4 of them being unemployed.
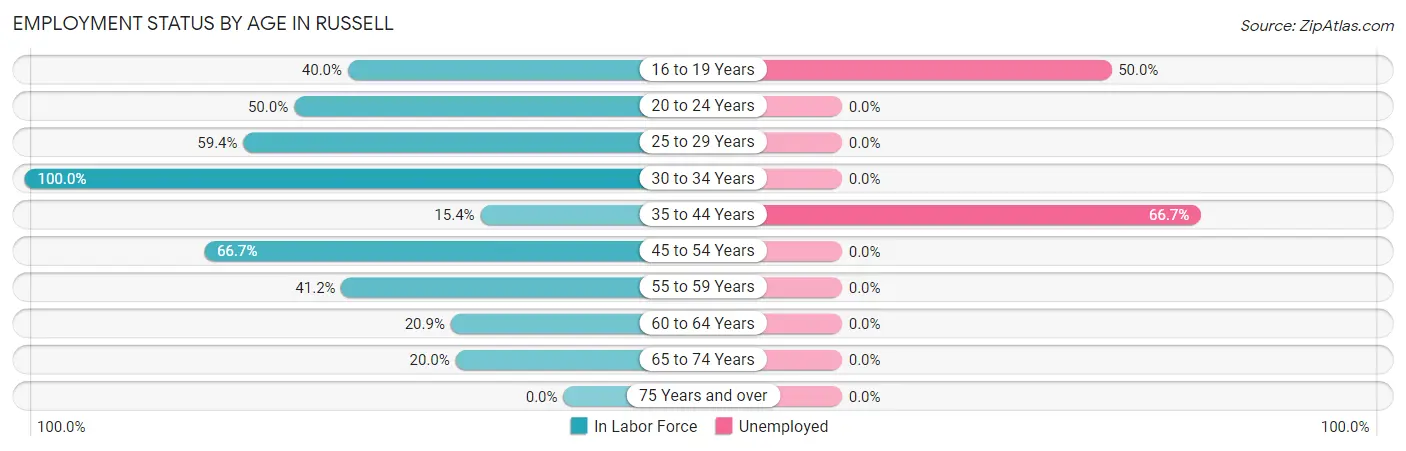
| Age Bracket | In Labor Force | Unemployed |
| 16 to 19 Years | 4 (40.0%) | 2 (50.0%) |
| 20 to 24 Years | 1 (50.0%) | 0 (0.0%) |
| 25 to 29 Years | 19 (59.4%) | 0 (0.0%) |
| 30 to 34 Years | 17 (100.0%) | 0 (0.0%) |
| 35 to 44 Years | 6 (15.4%) | 4 (66.7%) |
| 45 to 54 Years | 8 (66.7%) | 0 (0.0%) |
| 55 to 59 Years | 7 (41.2%) | 0 (0.0%) |
| 60 to 64 Years | 9 (20.9%) | 0 (0.0%) |
| 65 to 74 Years | 5 (20.0%) | 0 (0.0%) |
| 75 Years and over | 0 (0.0%) | 0 (0.0%) |
| Total | 76 (34.5%) | 6 (7.9%) |
Employment Status by Educational Attainment in Russell
According to labor force statistics for Russell, 41.3% of individuals (66) out of the total population between 25 and 64 years of age (160) are in the labor force, with 6.1% or 4 of them being unemployed. The group with the highest labor force participation rate are those with the educational attainment of college / associate degree, with 77.5% or 31 individuals in the labor force. Within the labor force, individuals with college / associate degree education have the highest percentage of unemployment, with 12.9% or 4 of them being unemployed.
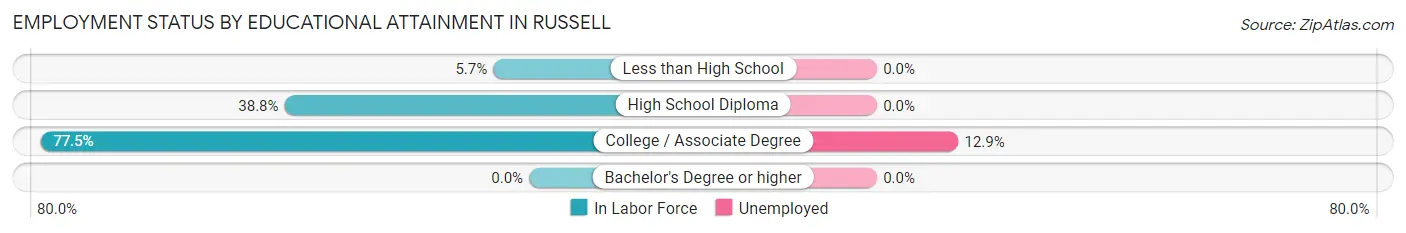
| Educational Attainment | In Labor Force | Unemployed |
| Less than High School | 2 (5.7%) | 0 (0.0%) |
| High School Diploma | 33 (38.8%) | 0 (0.0%) |
| College / Associate Degree | 31 (77.5%) | 5 (12.9%) |
| Bachelor's Degree or higher | 0 (0.0%) | 0 (0.0%) |
| Total | 66 (41.3%) | 10 (6.1%) |
Employment Occupations by Sex in Russell
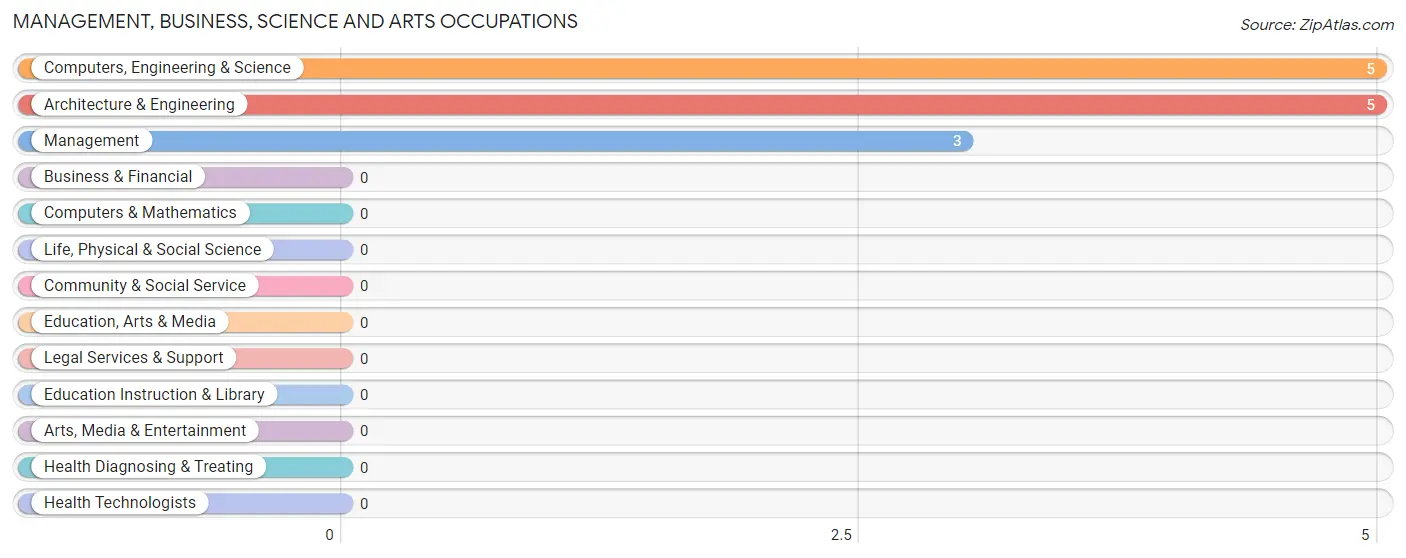
Management, Business, Science and Arts Occupations
The most common Management, Business, Science and Arts occupations in Russell are Computers, Engineering & Science (5 | 7.1%), Architecture & Engineering (5 | 7.1%), and Management (3 | 4.3%).
Management, Business, Science and Arts Occupations by Sex
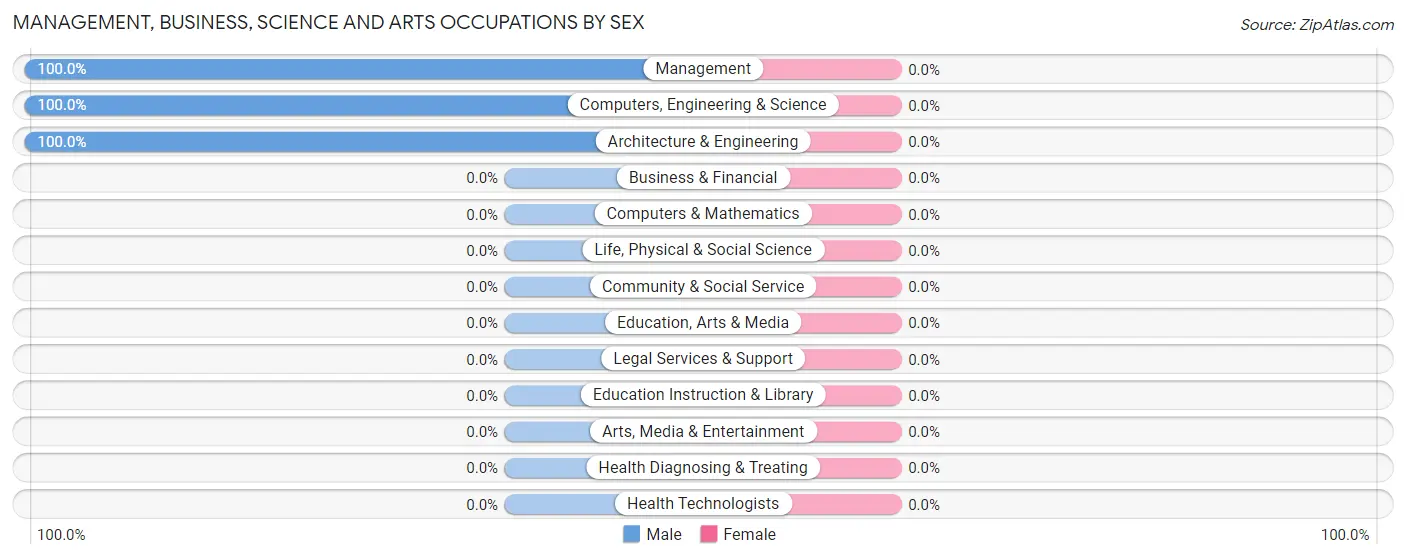
| Occupation | Male | Female |
| Management | 3 (100.0%) | 0 (0.0%) |
| Business & Financial | 0 (0.0%) | 0 (0.0%) |
| Computers, Engineering & Science | 5 (100.0%) | 0 (0.0%) |
| Computers & Mathematics | 0 (0.0%) | 0 (0.0%) |
| Architecture & Engineering | 5 (100.0%) | 0 (0.0%) |
| Life, Physical & Social Science | 0 (0.0%) | 0 (0.0%) |
| Community & Social Service | 0 (0.0%) | 0 (0.0%) |
| Education, Arts & Media | 0 (0.0%) | 0 (0.0%) |
| Legal Services & Support | 0 (0.0%) | 0 (0.0%) |
| Education Instruction & Library | 0 (0.0%) | 0 (0.0%) |
| Arts, Media & Entertainment | 0 (0.0%) | 0 (0.0%) |
| Health Diagnosing & Treating | 0 (0.0%) | 0 (0.0%) |
| Health Technologists | 0 (0.0%) | 0 (0.0%) |
| Total (Category) | 8 (100.0%) | 0 (0.0%) |
| Total (Overall) | 36 (51.4%) | 34 (48.6%) |
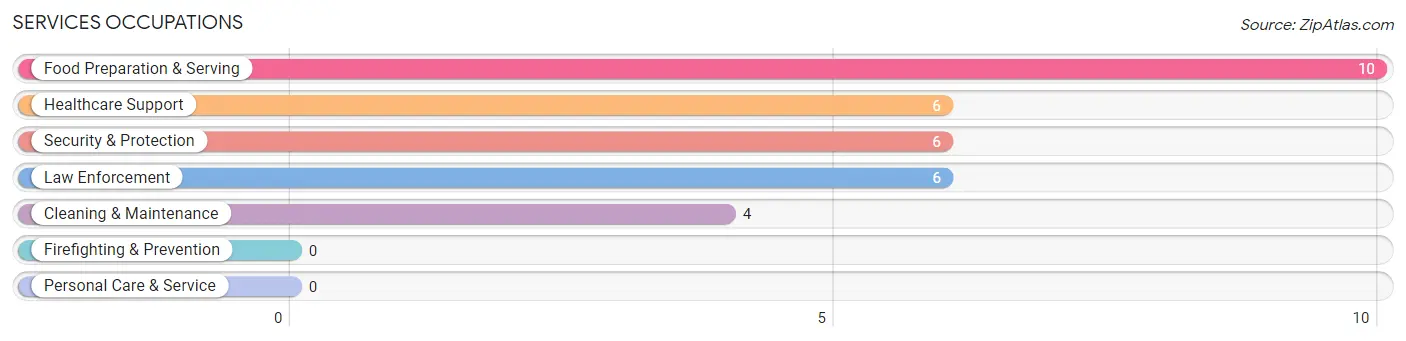
Services Occupations
The most common Services occupations in Russell are Food Preparation & Serving (10 | 14.3%), Healthcare Support (6 | 8.6%), Security & Protection (6 | 8.6%), Law Enforcement (6 | 8.6%), and Cleaning & Maintenance (4 | 5.7%).
Services Occupations by Sex
Within the Services occupations in Russell, the most male-oriented occupations are Cleaning & Maintenance (100.0%), and Food Preparation & Serving (50.0%), while the most female-oriented occupations are Healthcare Support (100.0%), Security & Protection (100.0%), and Law Enforcement (100.0%).
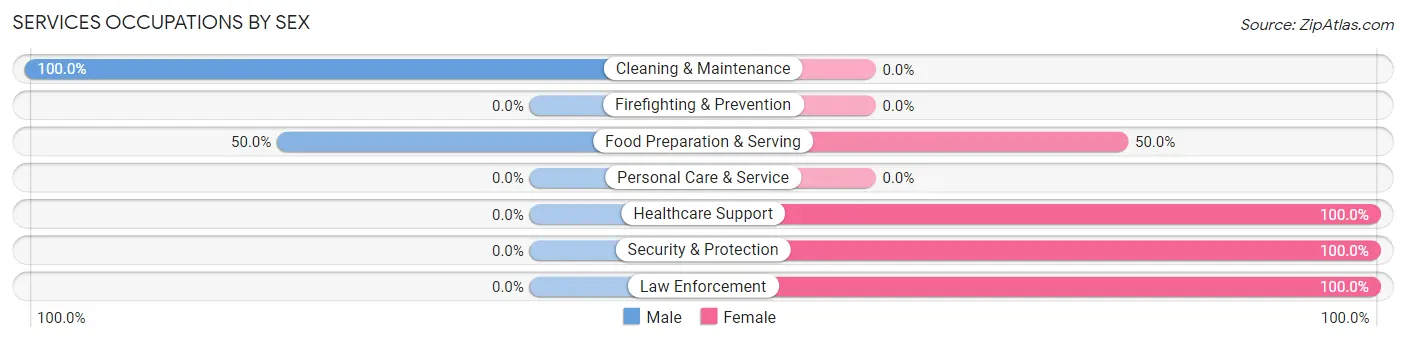
| Occupation | Male | Female |
| Healthcare Support | 0 (0.0%) | 6 (100.0%) |
| Security & Protection | 0 (0.0%) | 6 (100.0%) |
| Firefighting & Prevention | 0 (0.0%) | 0 (0.0%) |
| Law Enforcement | 0 (0.0%) | 6 (100.0%) |
| Food Preparation & Serving | 5 (50.0%) | 5 (50.0%) |
| Cleaning & Maintenance | 4 (100.0%) | 0 (0.0%) |
| Personal Care & Service | 0 (0.0%) | 0 (0.0%) |
| Total (Category) | 9 (34.6%) | 17 (65.4%) |
| Total (Overall) | 36 (51.4%) | 34 (48.6%) |
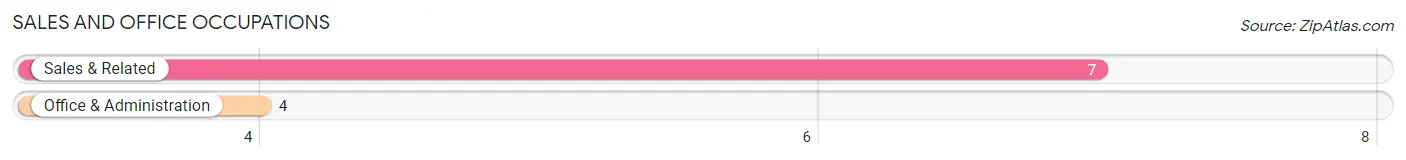
Sales and Office Occupations
The most common Sales and Office occupations in Russell are Sales & Related (7 | 10.0%), and Office & Administration (4 | 5.7%).
Sales and Office Occupations by Sex
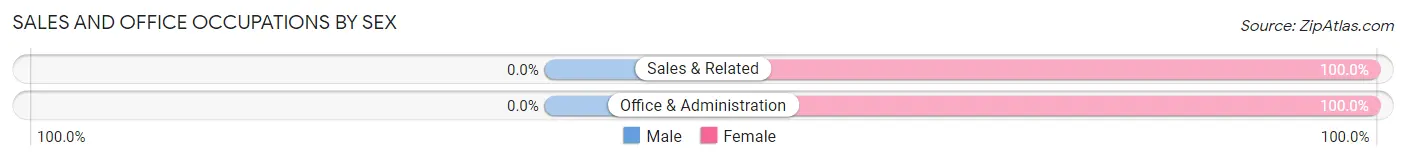
| Occupation | Male | Female |
| Sales & Related | 0 (0.0%) | 7 (100.0%) |
| Office & Administration | 0 (0.0%) | 4 (100.0%) |
| Total (Category) | 0 (0.0%) | 11 (100.0%) |
| Total (Overall) | 36 (51.4%) | 34 (48.6%) |
Natural Resources, Construction and Maintenance Occupations
The most common Natural Resources, Construction and Maintenance occupations in Russell are , and Construction & Extraction (18 | 25.7%).
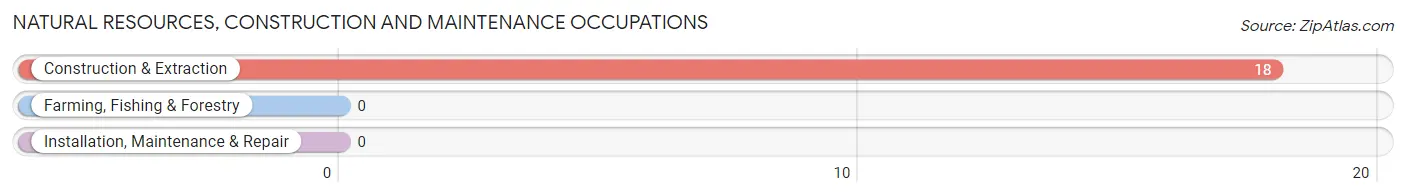
Natural Resources, Construction and Maintenance Occupations by Sex
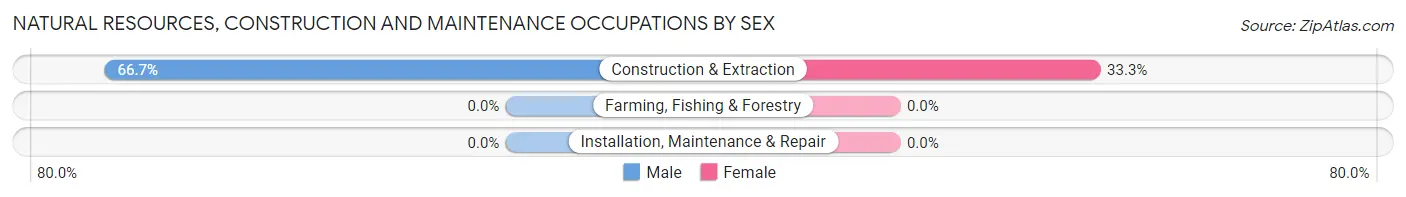
| Occupation | Male | Female |
| Farming, Fishing & Forestry | 0 (0.0%) | 0 (0.0%) |
| Construction & Extraction | 12 (66.7%) | 6 (33.3%) |
| Installation, Maintenance & Repair | 0 (0.0%) | 0 (0.0%) |
| Total (Category) | 12 (66.7%) | 6 (33.3%) |
| Total (Overall) | 36 (51.4%) | 34 (48.6%) |
Production, Transportation and Moving Occupations
The most common Production, Transportation and Moving occupations in Russell are Production (4 | 5.7%), and Material Moving (3 | 4.3%).
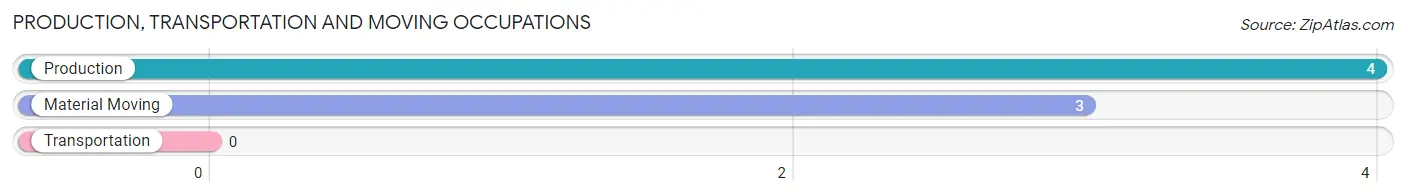
Production, Transportation and Moving Occupations by Sex
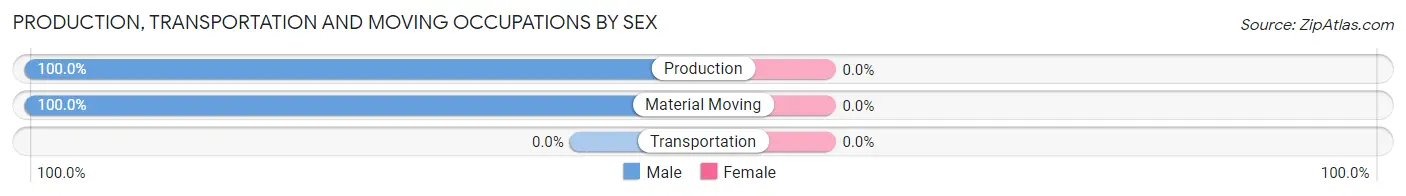
| Occupation | Male | Female |
| Production | 4 (100.0%) | 0 (0.0%) |
| Transportation | 0 (0.0%) | 0 (0.0%) |
| Material Moving | 3 (100.0%) | 0 (0.0%) |
| Total (Category) | 7 (100.0%) | 0 (0.0%) |
| Total (Overall) | 36 (51.4%) | 34 (48.6%) |
Employment Industries by Sex in Russell
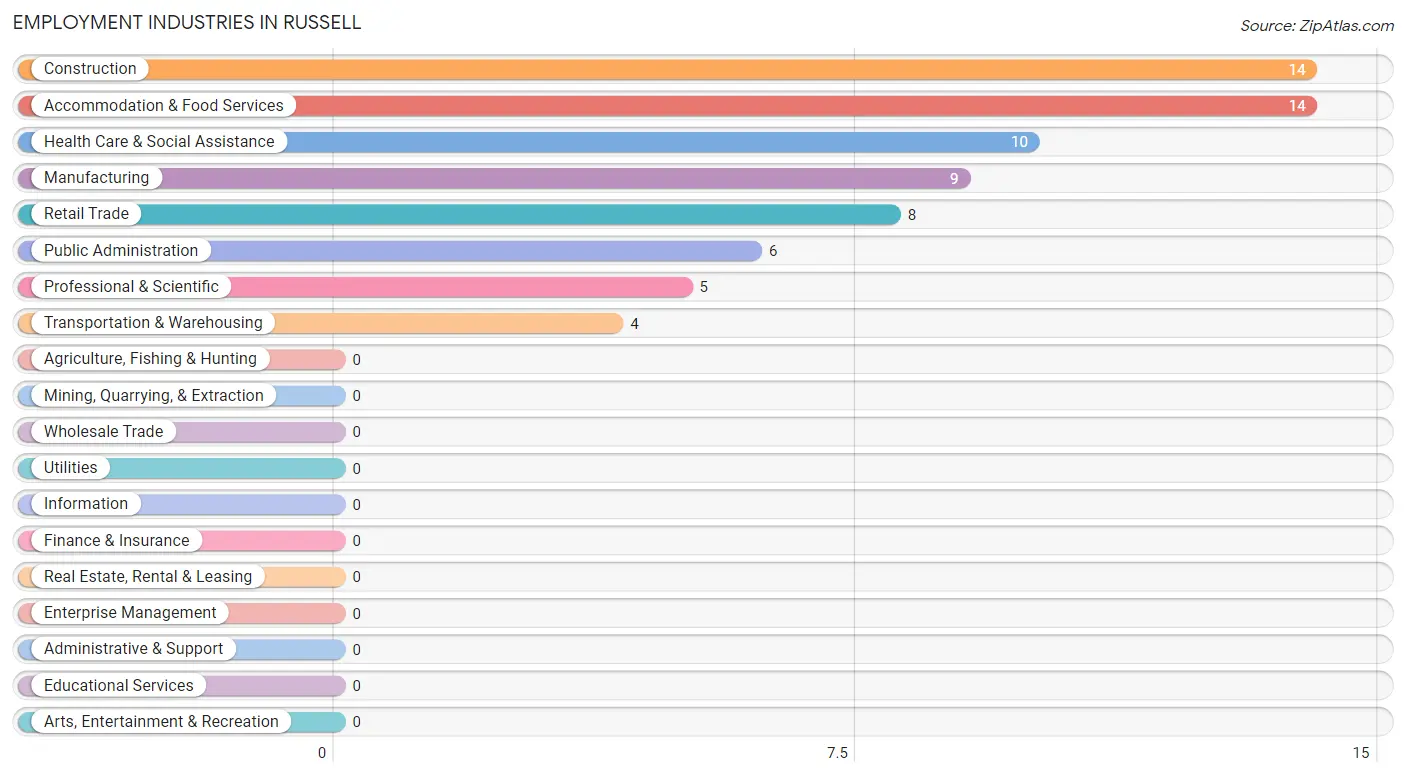
Employment Industries in Russell
The major employment industries in Russell include Construction (14 | 20.0%), Accommodation & Food Services (14 | 20.0%), Health Care & Social Assistance (10 | 14.3%), Manufacturing (9 | 12.9%), and Retail Trade (8 | 11.4%).
Employment Industries by Sex in Russell
The Russell industries that see more men than women are Manufacturing (100.0%), Professional & Scientific (100.0%), and Construction (85.7%), whereas the industries that tend to have a higher number of women are Transportation & Warehousing (100.0%), Health Care & Social Assistance (100.0%), and Public Administration (100.0%).
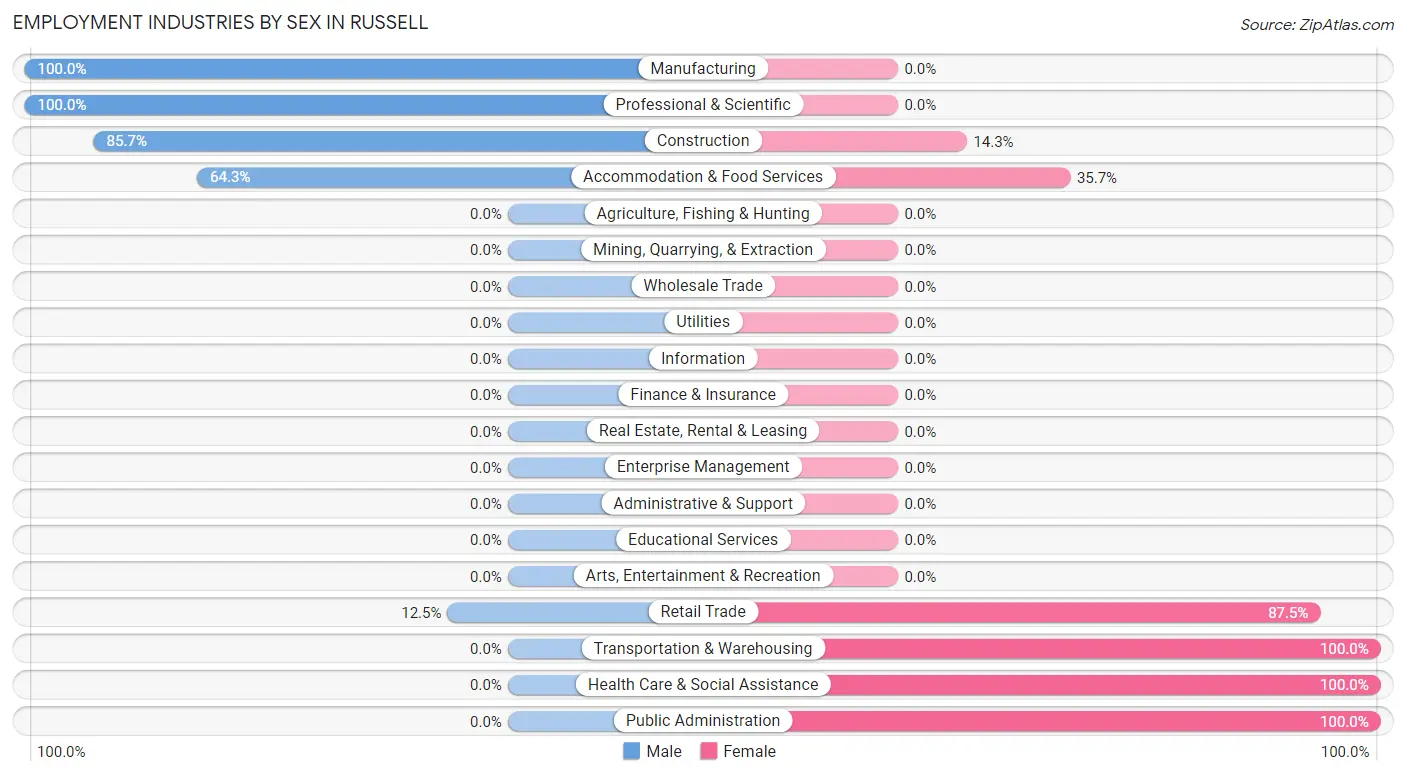
| Industry | Male | Female |
| Agriculture, Fishing & Hunting | 0 (0.0%) | 0 (0.0%) |
| Mining, Quarrying, & Extraction | 0 (0.0%) | 0 (0.0%) |
| Construction | 12 (85.7%) | 2 (14.3%) |
| Manufacturing | 9 (100.0%) | 0 (0.0%) |
| Wholesale Trade | 0 (0.0%) | 0 (0.0%) |
| Retail Trade | 1 (12.5%) | 7 (87.5%) |
| Transportation & Warehousing | 0 (0.0%) | 4 (100.0%) |
| Utilities | 0 (0.0%) | 0 (0.0%) |
| Information | 0 (0.0%) | 0 (0.0%) |
| Finance & Insurance | 0 (0.0%) | 0 (0.0%) |
| Real Estate, Rental & Leasing | 0 (0.0%) | 0 (0.0%) |
| Professional & Scientific | 5 (100.0%) | 0 (0.0%) |
| Enterprise Management | 0 (0.0%) | 0 (0.0%) |
| Administrative & Support | 0 (0.0%) | 0 (0.0%) |
| Educational Services | 0 (0.0%) | 0 (0.0%) |
| Health Care & Social Assistance | 0 (0.0%) | 10 (100.0%) |
| Arts, Entertainment & Recreation | 0 (0.0%) | 0 (0.0%) |
| Accommodation & Food Services | 9 (64.3%) | 5 (35.7%) |
| Public Administration | 0 (0.0%) | 6 (100.0%) |
| Total | 36 (51.4%) | 34 (48.6%) |
Education in Russell
School Enrollment in Russell
The most common levels of schooling among the 68 students in Russell are elementary school (31 | 45.6%), middle school (18 | 26.5%), and high school (14 | 20.6%).
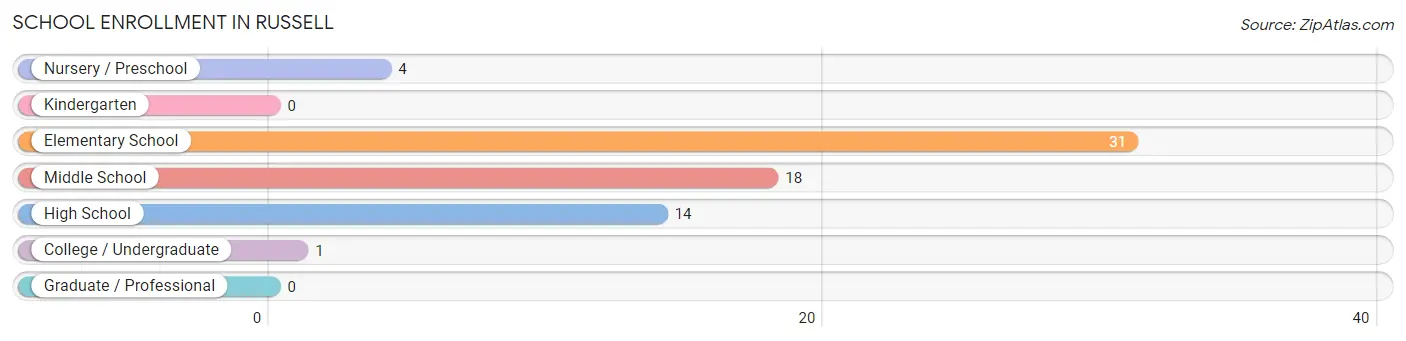
| School Level | # Students | % Students |
| Nursery / Preschool | 4 | 5.9% |
| Kindergarten | 0 | 0.0% |
| Elementary School | 31 | 45.6% |
| Middle School | 18 | 26.5% |
| High School | 14 | 20.6% |
| College / Undergraduate | 1 | 1.5% |
| Graduate / Professional | 0 | 0.0% |
| Total | 68 | 100.0% |
School Enrollment by Age by Funding Source in Russell
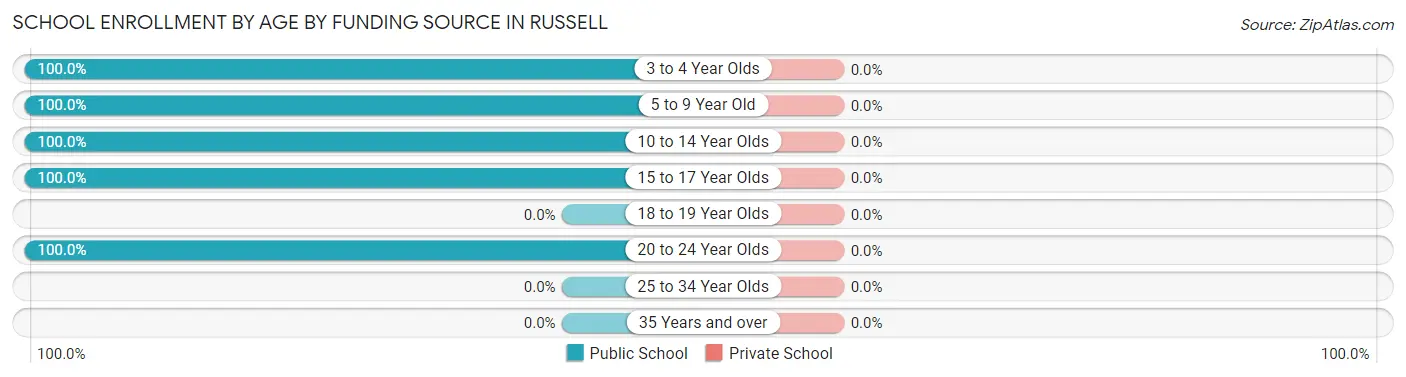
| Age Bracket | Public School | Private School |
| 3 to 4 Year Olds | 4 (100.0%) | 0 (0.0%) |
| 5 to 9 Year Old | 31 (100.0%) | 0 (0.0%) |
| 10 to 14 Year Olds | 18 (100.0%) | 0 (0.0%) |
| 15 to 17 Year Olds | 14 (100.0%) | 0 (0.0%) |
| 18 to 19 Year Olds | 0 (0.0%) | 0 (0.0%) |
| 20 to 24 Year Olds | 1 (100.0%) | 0 (0.0%) |
| 25 to 34 Year Olds | 0 (0.0%) | 0 (0.0%) |
| 35 Years and over | 0 (0.0%) | 0 (0.0%) |
| Total | 68 (100.0%) | 0 (0.0%) |
Educational Attainment by Field of Study in Russell
Business (5 | 55.6%), and education (4 | 44.4%) are the most common fields of study among 9 individuals in Russell who have obtained a bachelor's degree or higher.
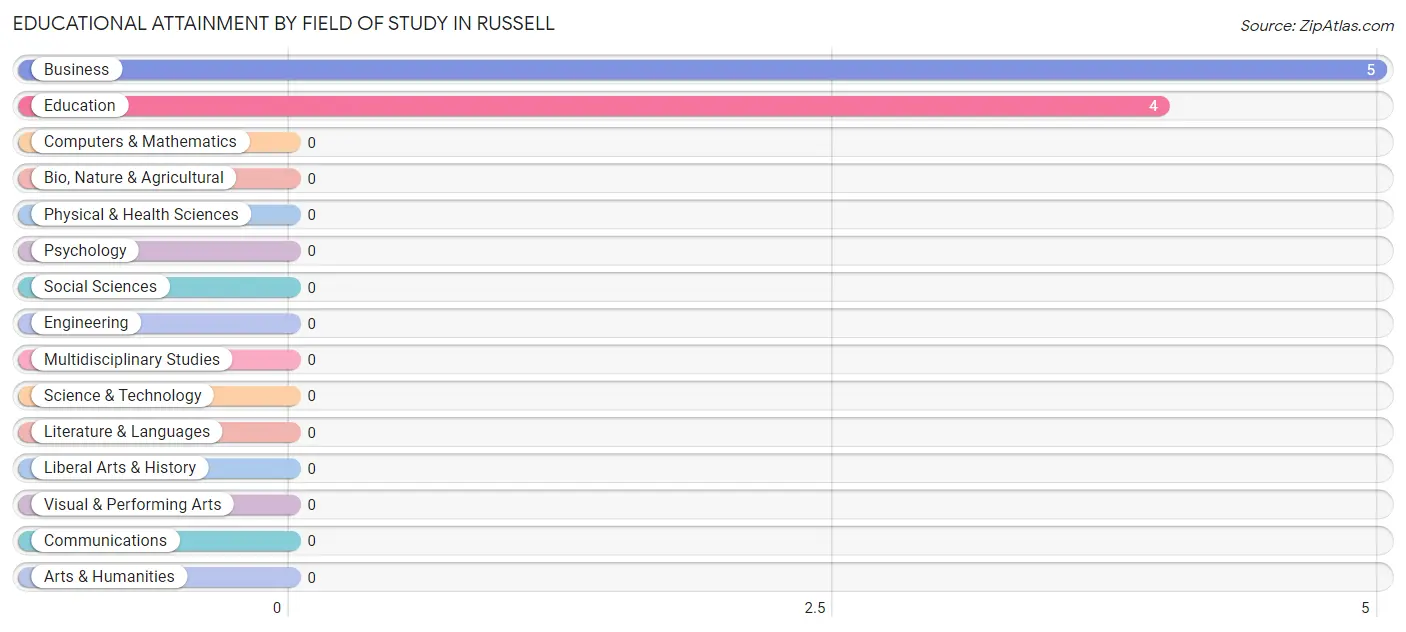
| Field of Study | # Graduates | % Graduates |
| Computers & Mathematics | 0 | 0.0% |
| Bio, Nature & Agricultural | 0 | 0.0% |
| Physical & Health Sciences | 0 | 0.0% |
| Psychology | 0 | 0.0% |
| Social Sciences | 0 | 0.0% |
| Engineering | 0 | 0.0% |
| Multidisciplinary Studies | 0 | 0.0% |
| Science & Technology | 0 | 0.0% |
| Business | 5 | 55.6% |
| Education | 4 | 44.4% |
| Literature & Languages | 0 | 0.0% |
| Liberal Arts & History | 0 | 0.0% |
| Visual & Performing Arts | 0 | 0.0% |
| Communications | 0 | 0.0% |
| Arts & Humanities | 0 | 0.0% |
| Total | 9 | 100.0% |
Transportation & Commute in Russell
Vehicle Availability by Sex in Russell
The most prevalent vehicle ownership categories in Russell are males with 1 vehicle (14, accounting for 38.9%) and females with 1 vehicle (17, making up 41.2%).
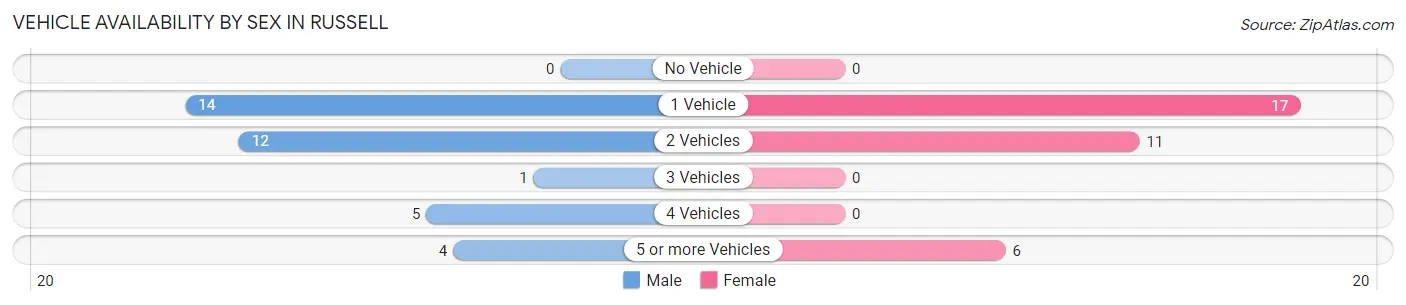
| Vehicles Available | Male | Female |
| No Vehicle | 0 (0.0%) | 0 (0.0%) |
| 1 Vehicle | 14 (38.9%) | 17 (50.0%) |
| 2 Vehicles | 12 (33.3%) | 11 (32.4%) |
| 3 Vehicles | 1 (2.8%) | 0 (0.0%) |
| 4 Vehicles | 5 (13.9%) | 0 (0.0%) |
| 5 or more Vehicles | 4 (11.1%) | 6 (17.6%) |
| Total | 36 (100.0%) | 34 (100.0%) |
Commute Time in Russell
The most frequently occuring commute durations in Russell are 5 to 9 minutes (13 commuters, 18.6%), 10 to 14 minutes (13 commuters, 18.6%), and 35 to 39 minutes (12 commuters, 17.1%).
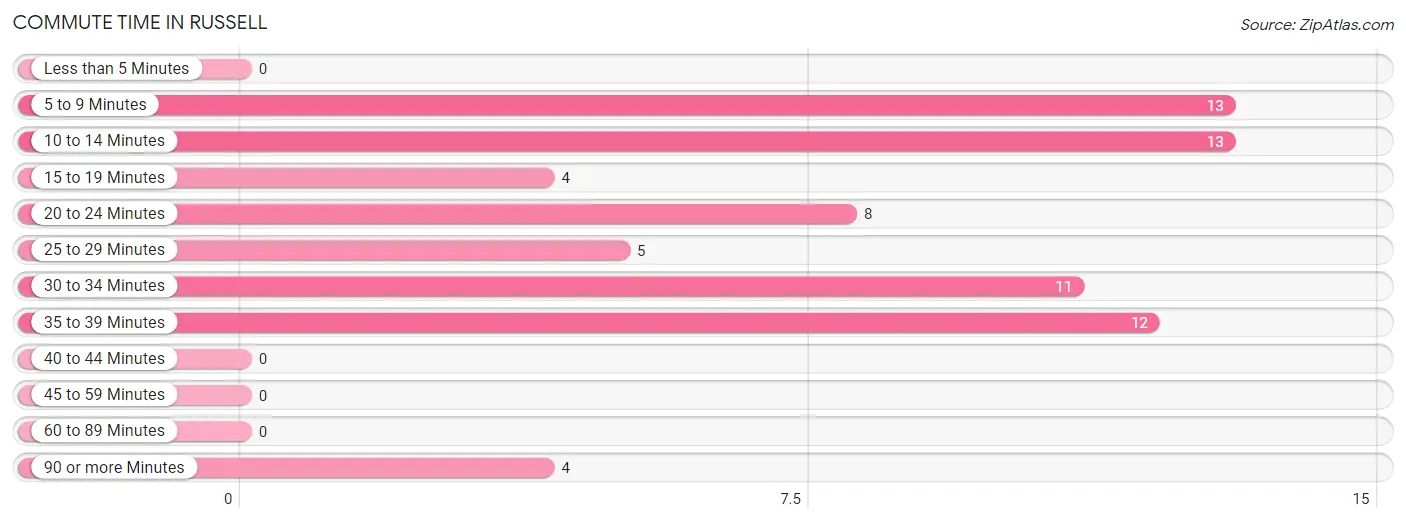
| Commute Time | # Commuters | % Commuters |
| Less than 5 Minutes | 0 | 0.0% |
| 5 to 9 Minutes | 13 | 18.6% |
| 10 to 14 Minutes | 13 | 18.6% |
| 15 to 19 Minutes | 4 | 5.7% |
| 20 to 24 Minutes | 8 | 11.4% |
| 25 to 29 Minutes | 5 | 7.1% |
| 30 to 34 Minutes | 11 | 15.7% |
| 35 to 39 Minutes | 12 | 17.1% |
| 40 to 44 Minutes | 0 | 0.0% |
| 45 to 59 Minutes | 0 | 0.0% |
| 60 to 89 Minutes | 0 | 0.0% |
| 90 or more Minutes | 4 | 5.7% |
Commute Time by Sex in Russell
The most common commute times in Russell are 35 to 39 minutes (12 commuters, 33.3%) for males and 5 to 9 minutes (13 commuters, 38.2%) for females.
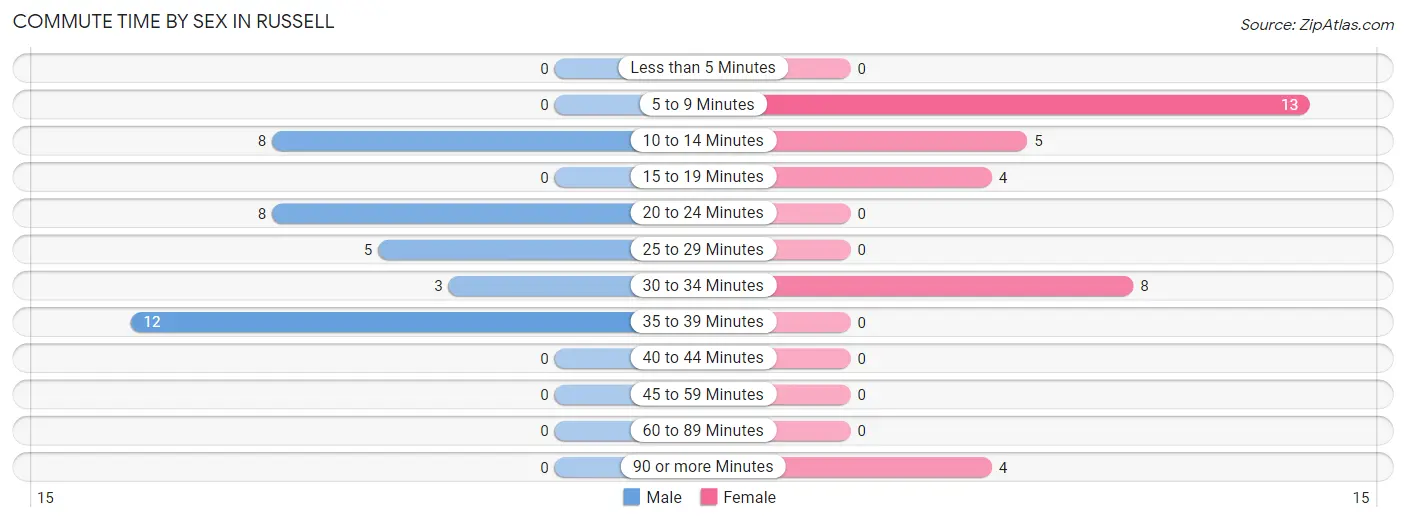
| Commute Time | Male | Female |
| Less than 5 Minutes | 0 (0.0%) | 0 (0.0%) |
| 5 to 9 Minutes | 0 (0.0%) | 13 (38.2%) |
| 10 to 14 Minutes | 8 (22.2%) | 5 (14.7%) |
| 15 to 19 Minutes | 0 (0.0%) | 4 (11.8%) |
| 20 to 24 Minutes | 8 (22.2%) | 0 (0.0%) |
| 25 to 29 Minutes | 5 (13.9%) | 0 (0.0%) |
| 30 to 34 Minutes | 3 (8.3%) | 8 (23.5%) |
| 35 to 39 Minutes | 12 (33.3%) | 0 (0.0%) |
| 40 to 44 Minutes | 0 (0.0%) | 0 (0.0%) |
| 45 to 59 Minutes | 0 (0.0%) | 0 (0.0%) |
| 60 to 89 Minutes | 0 (0.0%) | 0 (0.0%) |
| 90 or more Minutes | 0 (0.0%) | 4 (11.8%) |
Time of Departure to Work by Sex in Russell
The most frequent times of departure to work in Russell are 4:00 PM to 11:59 PM (14, 38.9%) for males and 6:00 AM to 6:29 AM (17, 50.0%) for females.
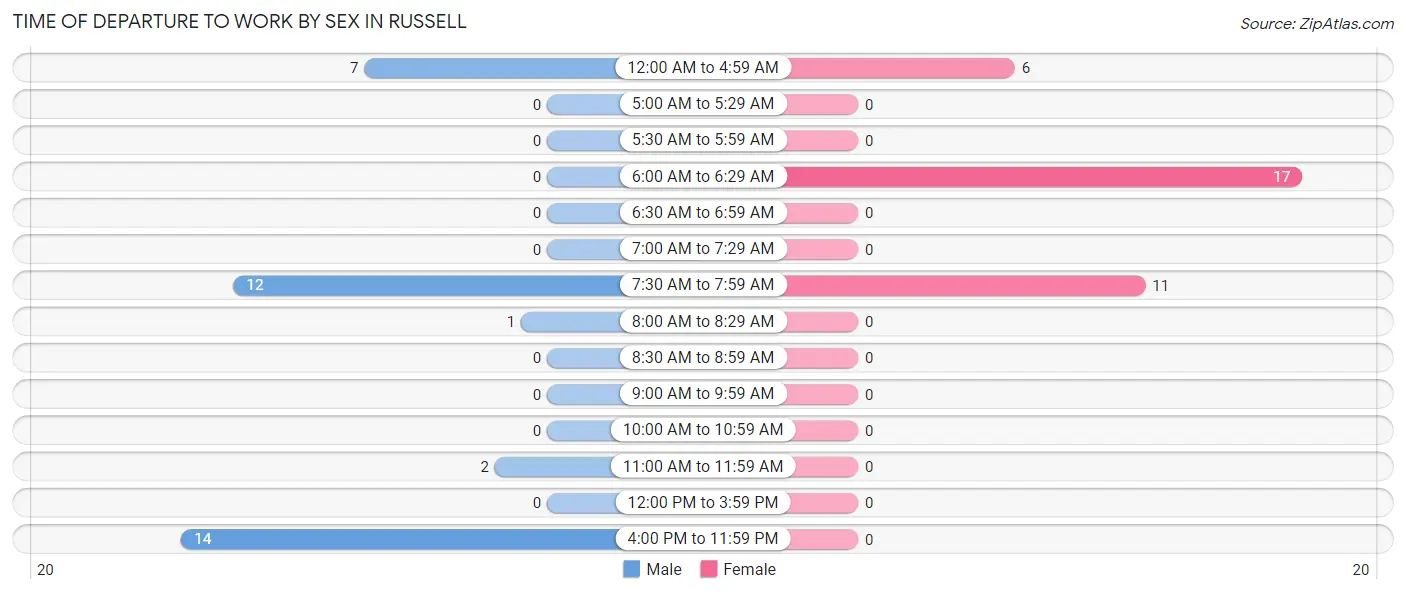
| Time of Departure | Male | Female |
| 12:00 AM to 4:59 AM | 7 (19.4%) | 6 (17.6%) |
| 5:00 AM to 5:29 AM | 0 (0.0%) | 0 (0.0%) |
| 5:30 AM to 5:59 AM | 0 (0.0%) | 0 (0.0%) |
| 6:00 AM to 6:29 AM | 0 (0.0%) | 17 (50.0%) |
| 6:30 AM to 6:59 AM | 0 (0.0%) | 0 (0.0%) |
| 7:00 AM to 7:29 AM | 0 (0.0%) | 0 (0.0%) |
| 7:30 AM to 7:59 AM | 12 (33.3%) | 11 (32.4%) |
| 8:00 AM to 8:29 AM | 1 (2.8%) | 0 (0.0%) |
| 8:30 AM to 8:59 AM | 0 (0.0%) | 0 (0.0%) |
| 9:00 AM to 9:59 AM | 0 (0.0%) | 0 (0.0%) |
| 10:00 AM to 10:59 AM | 0 (0.0%) | 0 (0.0%) |
| 11:00 AM to 11:59 AM | 2 (5.6%) | 0 (0.0%) |
| 12:00 PM to 3:59 PM | 0 (0.0%) | 0 (0.0%) |
| 4:00 PM to 11:59 PM | 14 (38.9%) | 0 (0.0%) |
| Total | 36 (100.0%) | 34 (100.0%) |
Housing Occupancy in Russell
Occupancy by Ownership in Russell
Of the total 126 dwellings in Russell, owner-occupied units account for 61 (48.4%), while renter-occupied units make up 65 (51.6%).
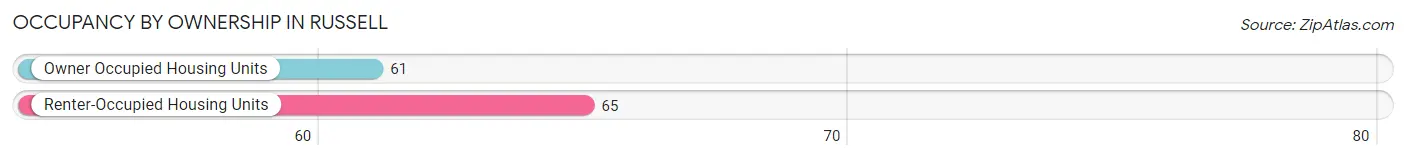
| Occupancy | # Housing Units | % Housing Units |
| Owner Occupied Housing Units | 61 | 48.4% |
| Renter-Occupied Housing Units | 65 | 51.6% |
| Total Occupied Housing Units | 126 | 100.0% |
Occupancy by Household Size in Russell
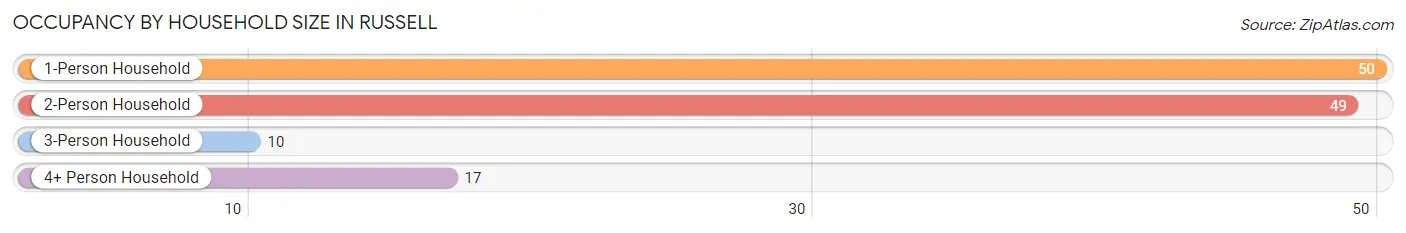
| Household Size | # Housing Units | % Housing Units |
| 1-Person Household | 50 | 39.7% |
| 2-Person Household | 49 | 38.9% |
| 3-Person Household | 10 | 7.9% |
| 4+ Person Household | 17 | 13.5% |
| Total Housing Units | 126 | 100.0% |
Occupancy by Ownership by Household Size in Russell
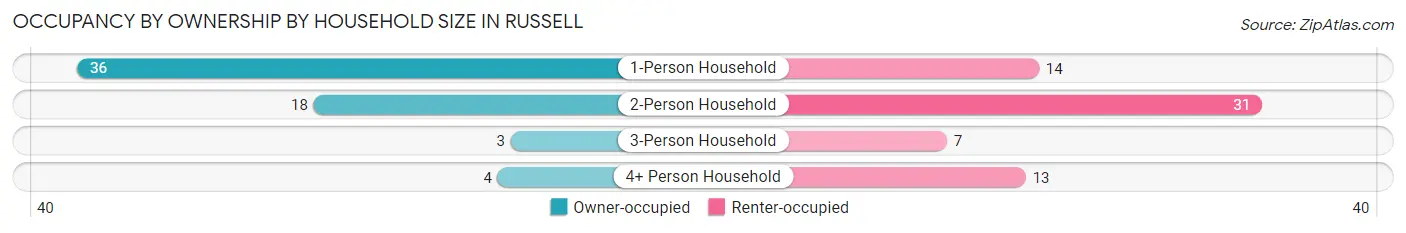
| Household Size | Owner-occupied | Renter-occupied |
| 1-Person Household | 36 (72.0%) | 14 (28.0%) |
| 2-Person Household | 18 (36.7%) | 31 (63.3%) |
| 3-Person Household | 3 (30.0%) | 7 (70.0%) |
| 4+ Person Household | 4 (23.5%) | 13 (76.5%) |
| Total Housing Units | 61 (48.4%) | 65 (51.6%) |
Occupancy by Educational Attainment in Russell
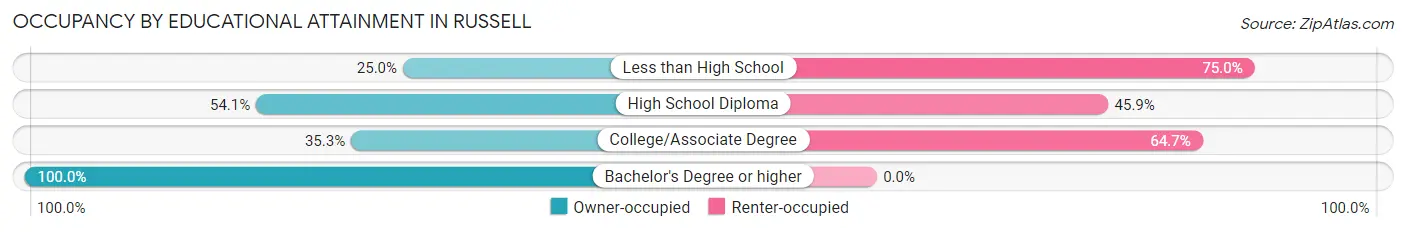
| Household Size | Owner-occupied | Renter-occupied |
| Less than High School | 5 (25.0%) | 15 (75.0%) |
| High School Diploma | 46 (54.1%) | 39 (45.9%) |
| College/Associate Degree | 6 (35.3%) | 11 (64.7%) |
| Bachelor's Degree or higher | 4 (100.0%) | 0 (0.0%) |
Occupancy by Age of Householder in Russell
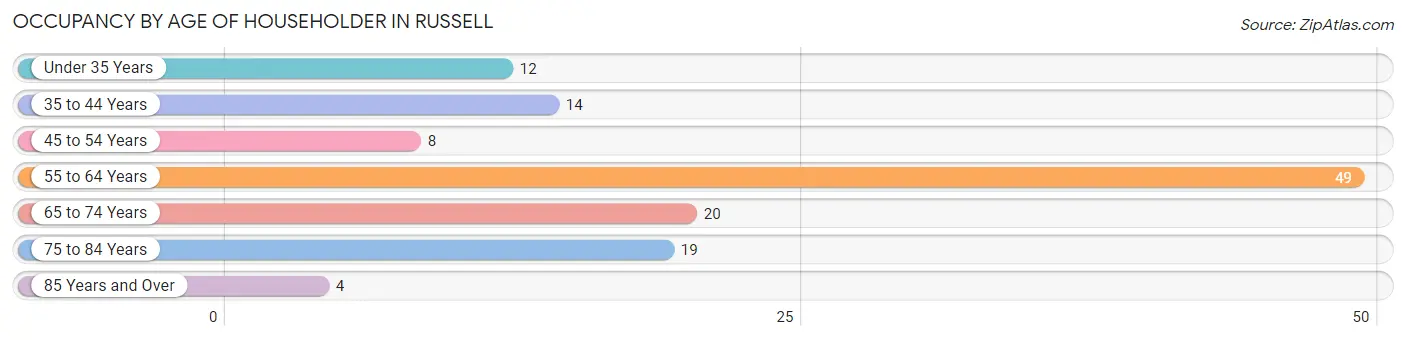
| Age Bracket | # Households | % Households |
| Under 35 Years | 12 | 9.5% |
| 35 to 44 Years | 14 | 11.1% |
| 45 to 54 Years | 8 | 6.4% |
| 55 to 64 Years | 49 | 38.9% |
| 65 to 74 Years | 20 | 15.9% |
| 75 to 84 Years | 19 | 15.1% |
| 85 Years and Over | 4 | 3.2% |
| Total | 126 | 100.0% |
Housing Finances in Russell
Median Income by Occupancy in Russell
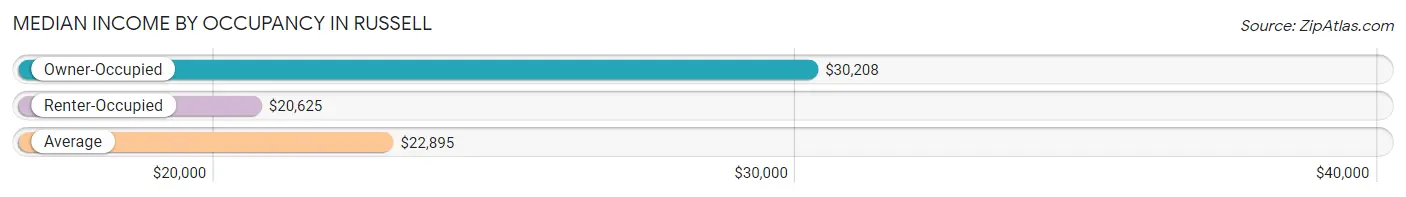
| Occupancy Type | # Households | Median Income |
| Owner-Occupied | 61 (48.4%) | $30,208 |
| Renter-Occupied | 65 (51.6%) | $20,625 |
| Average | 126 (100.0%) | $22,895 |
Occupancy by Householder Income Bracket in Russell
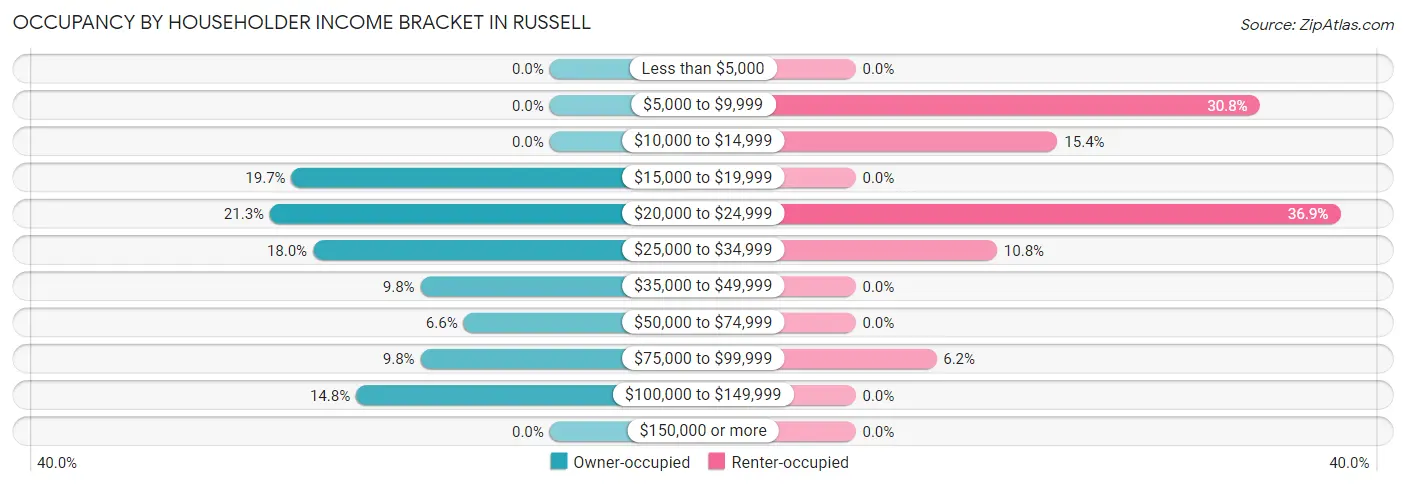
| Income Bracket | Owner-occupied | Renter-occupied |
| Less than $5,000 | 0 (0.0%) | 0 (0.0%) |
| $5,000 to $9,999 | 0 (0.0%) | 20 (30.8%) |
| $10,000 to $14,999 | 0 (0.0%) | 10 (15.4%) |
| $15,000 to $19,999 | 12 (19.7%) | 0 (0.0%) |
| $20,000 to $24,999 | 13 (21.3%) | 24 (36.9%) |
| $25,000 to $34,999 | 11 (18.0%) | 7 (10.8%) |
| $35,000 to $49,999 | 6 (9.8%) | 0 (0.0%) |
| $50,000 to $74,999 | 4 (6.6%) | 0 (0.0%) |
| $75,000 to $99,999 | 6 (9.8%) | 4 (6.1%) |
| $100,000 to $149,999 | 9 (14.7%) | 0 (0.0%) |
| $150,000 or more | 0 (0.0%) | 0 (0.0%) |
| Total | 61 (100.0%) | 65 (100.0%) |
Monthly Housing Cost Tiers in Russell
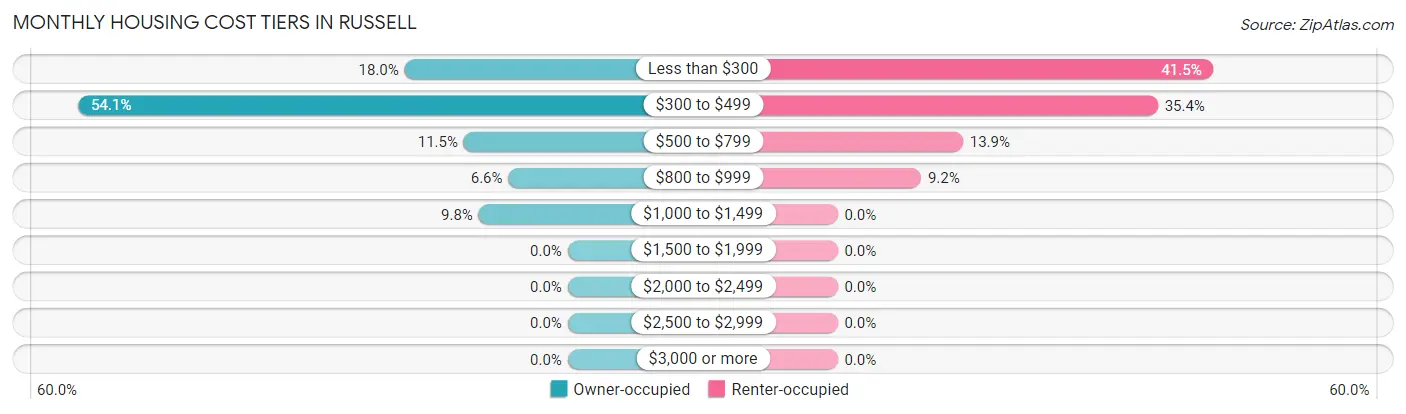
| Monthly Cost | Owner-occupied | Renter-occupied |
| Less than $300 | 11 (18.0%) | 27 (41.5%) |
| $300 to $499 | 33 (54.1%) | 23 (35.4%) |
| $500 to $799 | 7 (11.5%) | 9 (13.9%) |
| $800 to $999 | 4 (6.6%) | 6 (9.2%) |
| $1,000 to $1,499 | 6 (9.8%) | 0 (0.0%) |
| $1,500 to $1,999 | 0 (0.0%) | 0 (0.0%) |
| $2,000 to $2,499 | 0 (0.0%) | 0 (0.0%) |
| $2,500 to $2,999 | 0 (0.0%) | 0 (0.0%) |
| $3,000 or more | 0 (0.0%) | 0 (0.0%) |
| Total | 61 (100.0%) | 65 (100.0%) |
Physical Housing Characteristics in Russell
Housing Structures in Russell
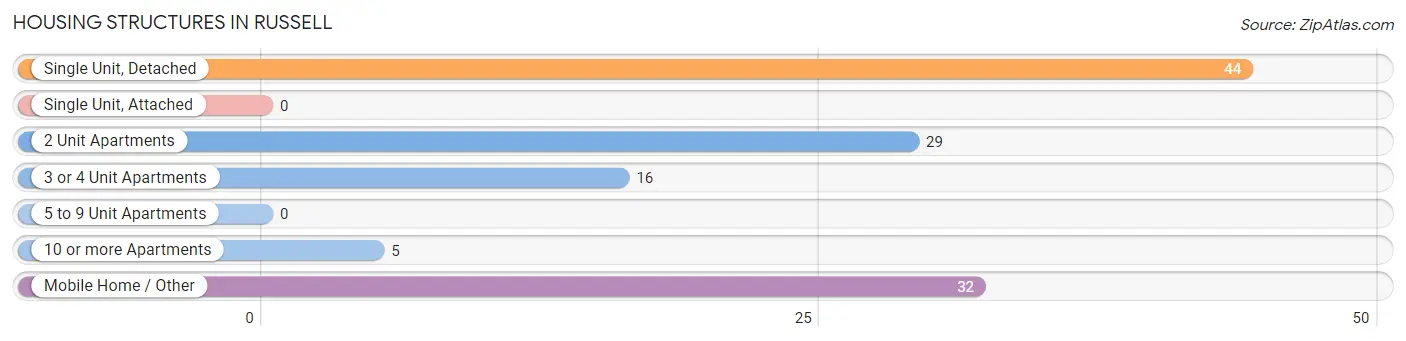
| Structure Type | # Housing Units | % Housing Units |
| Single Unit, Detached | 44 | 34.9% |
| Single Unit, Attached | 0 | 0.0% |
| 2 Unit Apartments | 29 | 23.0% |
| 3 or 4 Unit Apartments | 16 | 12.7% |
| 5 to 9 Unit Apartments | 0 | 0.0% |
| 10 or more Apartments | 5 | 4.0% |
| Mobile Home / Other | 32 | 25.4% |
| Total | 126 | 100.0% |
Housing Structures by Occupancy in Russell
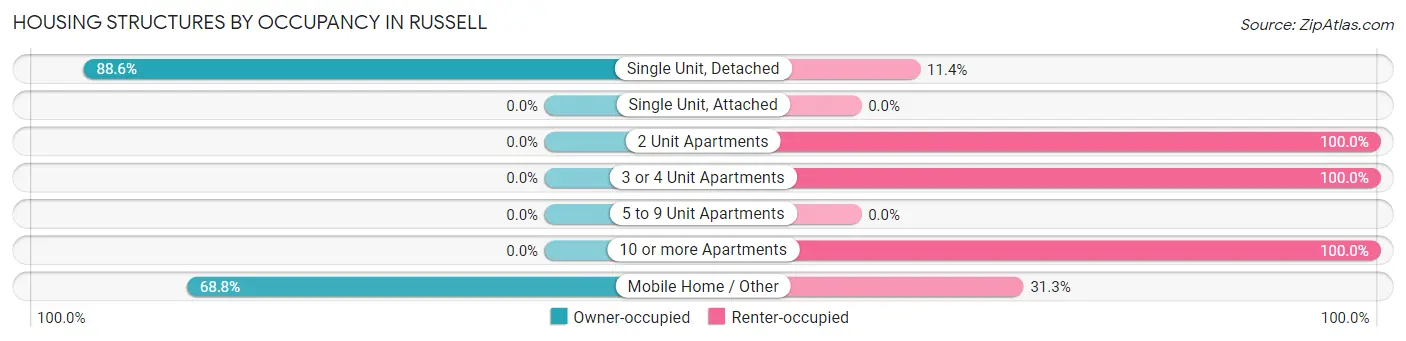
| Structure Type | Owner-occupied | Renter-occupied |
| Single Unit, Detached | 39 (88.6%) | 5 (11.4%) |
| Single Unit, Attached | 0 (0.0%) | 0 (0.0%) |
| 2 Unit Apartments | 0 (0.0%) | 29 (100.0%) |
| 3 or 4 Unit Apartments | 0 (0.0%) | 16 (100.0%) |
| 5 to 9 Unit Apartments | 0 (0.0%) | 0 (0.0%) |
| 10 or more Apartments | 0 (0.0%) | 5 (100.0%) |
| Mobile Home / Other | 22 (68.8%) | 10 (31.2%) |
| Total | 61 (48.4%) | 65 (51.6%) |
Housing Structures by Number of Rooms in Russell
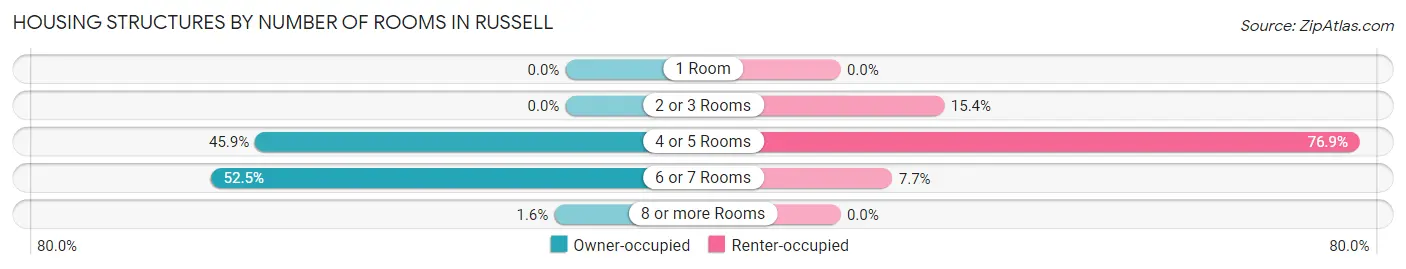
| Number of Rooms | Owner-occupied | Renter-occupied |
| 1 Room | 0 (0.0%) | 0 (0.0%) |
| 2 or 3 Rooms | 0 (0.0%) | 10 (15.4%) |
| 4 or 5 Rooms | 28 (45.9%) | 50 (76.9%) |
| 6 or 7 Rooms | 32 (52.5%) | 5 (7.7%) |
| 8 or more Rooms | 1 (1.6%) | 0 (0.0%) |
| Total | 61 (100.0%) | 65 (100.0%) |
Housing Structure by Heating Type in Russell
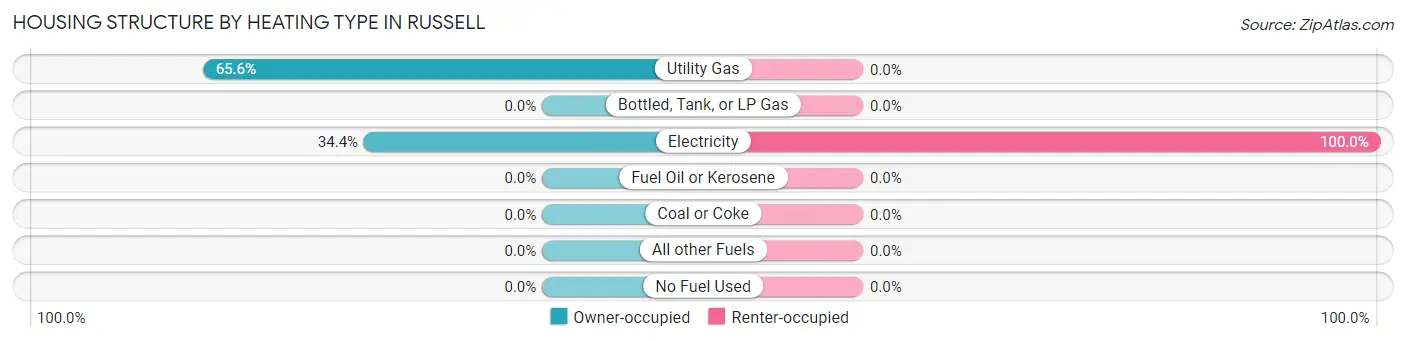
| Heating Type | Owner-occupied | Renter-occupied |
| Utility Gas | 40 (65.6%) | 0 (0.0%) |
| Bottled, Tank, or LP Gas | 0 (0.0%) | 0 (0.0%) |
| Electricity | 21 (34.4%) | 65 (100.0%) |
| Fuel Oil or Kerosene | 0 (0.0%) | 0 (0.0%) |
| Coal or Coke | 0 (0.0%) | 0 (0.0%) |
| All other Fuels | 0 (0.0%) | 0 (0.0%) |
| No Fuel Used | 0 (0.0%) | 0 (0.0%) |
| Total | 61 (100.0%) | 65 (100.0%) |
Household Vehicle Usage in Russell
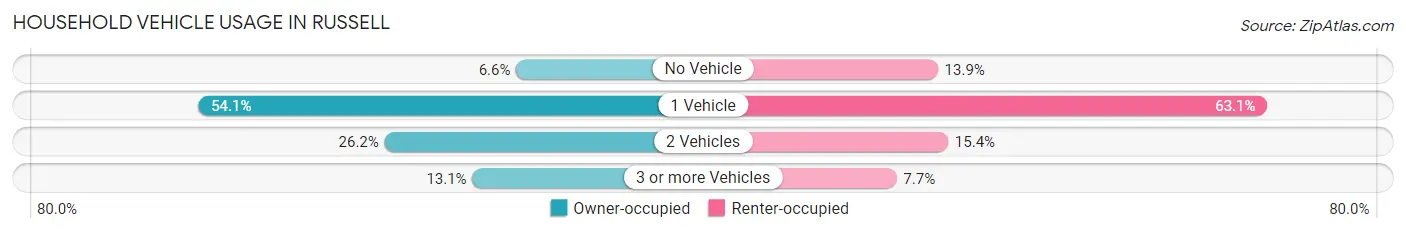
| Vehicles per Household | Owner-occupied | Renter-occupied |
| No Vehicle | 4 (6.6%) | 9 (13.9%) |
| 1 Vehicle | 33 (54.1%) | 41 (63.1%) |
| 2 Vehicles | 16 (26.2%) | 10 (15.4%) |
| 3 or more Vehicles | 8 (13.1%) | 5 (7.7%) |
| Total | 61 (100.0%) | 65 (100.0%) |
Real Estate & Mortgages in Russell
Real Estate and Mortgage Overview in Russell
| Characteristic | Without Mortgage | With Mortgage |
| Housing Units | 35 | 26 |
| Median Property Value | $77,500 | $67,300 |
| Median Household Income | - | - |
| Monthly Housing Costs | $341 | $0 |
| Real Estate Taxes | - | - |
Property Value by Mortgage Status in Russell
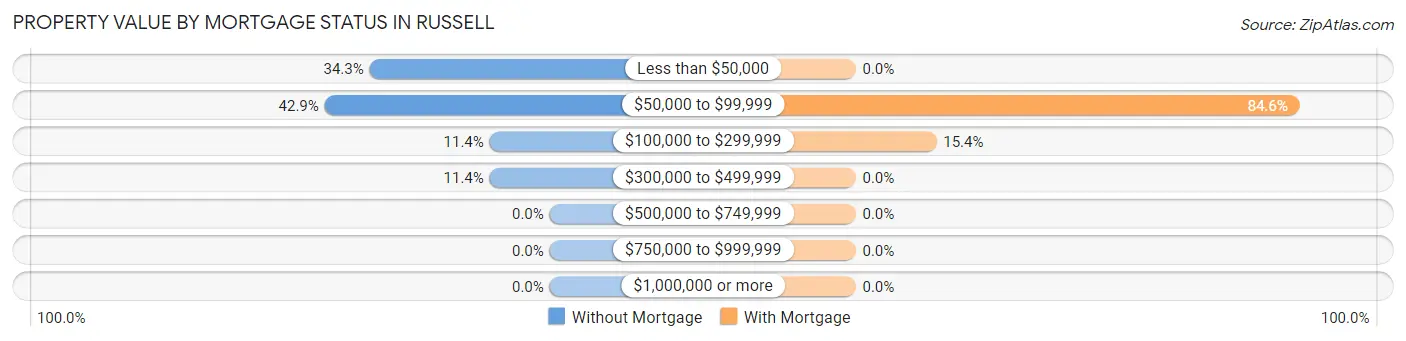
| Property Value | Without Mortgage | With Mortgage |
| Less than $50,000 | 12 (34.3%) | 0 (0.0%) |
| $50,000 to $99,999 | 15 (42.9%) | 22 (84.6%) |
| $100,000 to $299,999 | 4 (11.4%) | 4 (15.4%) |
| $300,000 to $499,999 | 4 (11.4%) | 0 (0.0%) |
| $500,000 to $749,999 | 0 (0.0%) | 0 (0.0%) |
| $750,000 to $999,999 | 0 (0.0%) | 0 (0.0%) |
| $1,000,000 or more | 0 (0.0%) | 0 (0.0%) |
| Total | 35 (100.0%) | 26 (100.0%) |
Household Income by Mortgage Status in Russell
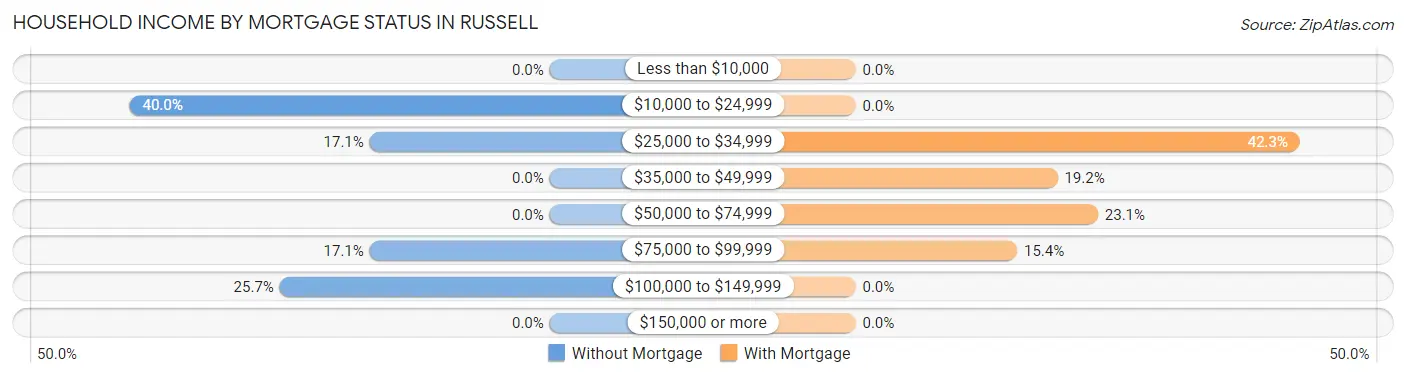
| Household Income | Without Mortgage | With Mortgage |
| Less than $10,000 | 0 (0.0%) | 0 (0.0%) |
| $10,000 to $24,999 | 14 (40.0%) | 0 (0.0%) |
| $25,000 to $34,999 | 6 (17.1%) | 11 (42.3%) |
| $35,000 to $49,999 | 0 (0.0%) | 5 (19.2%) |
| $50,000 to $74,999 | 0 (0.0%) | 6 (23.1%) |
| $75,000 to $99,999 | 6 (17.1%) | 4 (15.4%) |
| $100,000 to $149,999 | 9 (25.7%) | 0 (0.0%) |
| $150,000 or more | 0 (0.0%) | 0 (0.0%) |
| Total | 35 (100.0%) | 26 (100.0%) |
Property Value to Household Income Ratio in Russell
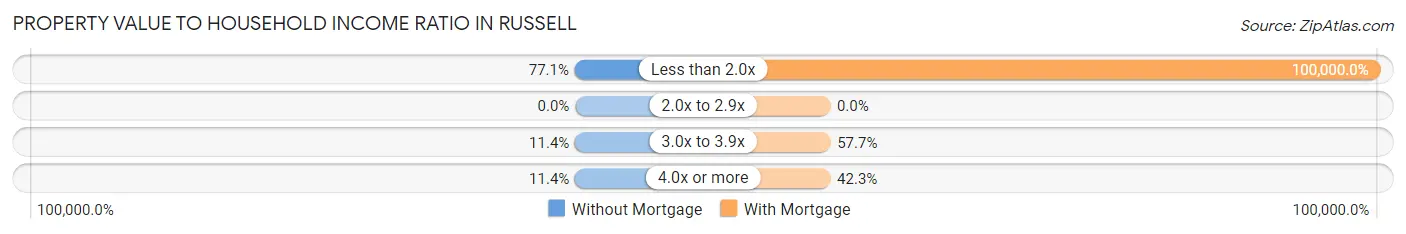
| Value-to-Income Ratio | Without Mortgage | With Mortgage |
| Less than 2.0x | 27 (77.1%) | 26,000 (100,000.0%) |
| 2.0x to 2.9x | 0 (0.0%) | 0 (0.0%) |
| 3.0x to 3.9x | 4 (11.4%) | 15 (57.7%) |
| 4.0x or more | 4 (11.4%) | 11 (42.3%) |
| Total | 35 (100.0%) | 26 (100.0%) |
Real Estate Taxes by Mortgage Status in Russell
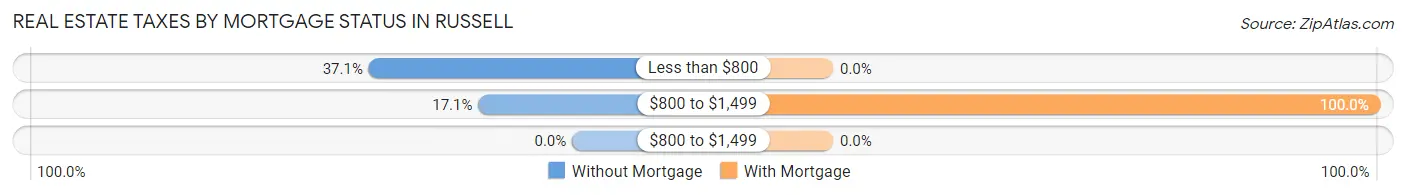
| Property Taxes | Without Mortgage | With Mortgage |
| Less than $800 | 13 (37.1%) | 0 (0.0%) |
| $800 to $1,499 | 6 (17.1%) | 26 (100.0%) |
| $800 to $1,499 | 0 (0.0%) | 0 (0.0%) |
| Total | 35 (100.0%) | 26 (100.0%) |
Health & Disability in Russell
Health Insurance Coverage by Age in Russell
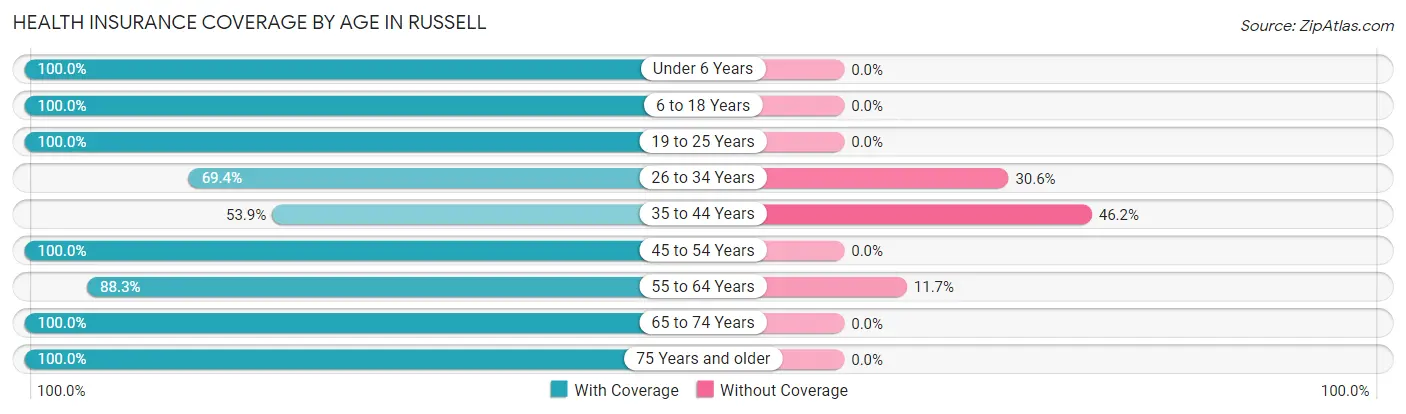
| Age Bracket | With Coverage | Without Coverage |
| Under 6 Years | 14 (100.0%) | 0 (0.0%) |
| 6 to 18 Years | 63 (100.0%) | 0 (0.0%) |
| 19 to 25 Years | 4 (100.0%) | 0 (0.0%) |
| 26 to 34 Years | 34 (69.4%) | 15 (30.6%) |
| 35 to 44 Years | 21 (53.8%) | 18 (46.2%) |
| 45 to 54 Years | 12 (100.0%) | 0 (0.0%) |
| 55 to 64 Years | 53 (88.3%) | 7 (11.7%) |
| 65 to 74 Years | 25 (100.0%) | 0 (0.0%) |
| 75 Years and older | 23 (100.0%) | 0 (0.0%) |
| Total | 249 (86.2%) | 40 (13.8%) |
Health Insurance Coverage by Citizenship Status in Russell
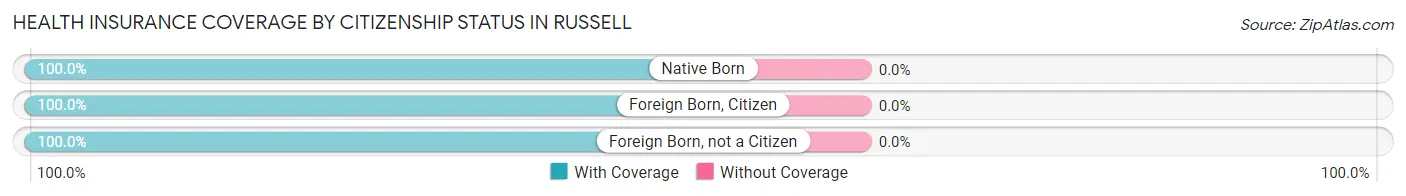
| Citizenship Status | With Coverage | Without Coverage |
| Native Born | 14 (100.0%) | 0 (0.0%) |
| Foreign Born, Citizen | 63 (100.0%) | 0 (0.0%) |
| Foreign Born, not a Citizen | 4 (100.0%) | 0 (0.0%) |
Health Insurance Coverage by Household Income in Russell
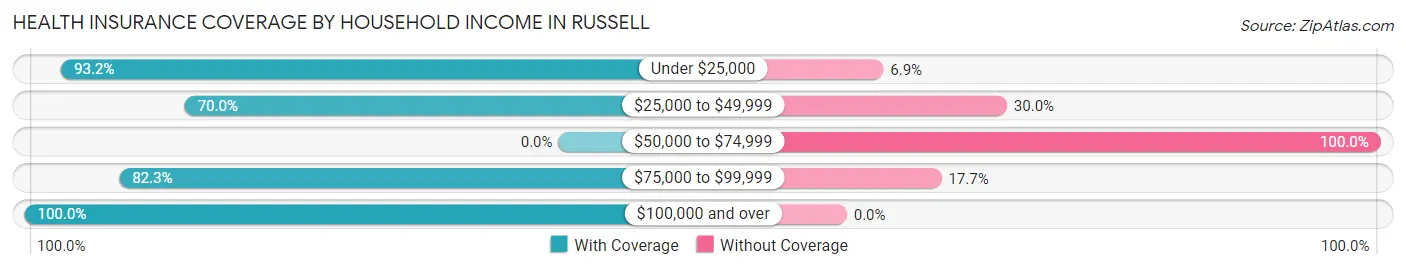
| Household Income | With Coverage | Without Coverage |
| Under $25,000 | 136 (93.1%) | 10 (6.9%) |
| $25,000 to $49,999 | 28 (70.0%) | 12 (30.0%) |
| $50,000 to $74,999 | 0 (0.0%) | 7 (100.0%) |
| $75,000 to $99,999 | 51 (82.3%) | 11 (17.7%) |
| $100,000 and over | 34 (100.0%) | 0 (0.0%) |
Public vs Private Health Insurance Coverage by Age in Russell
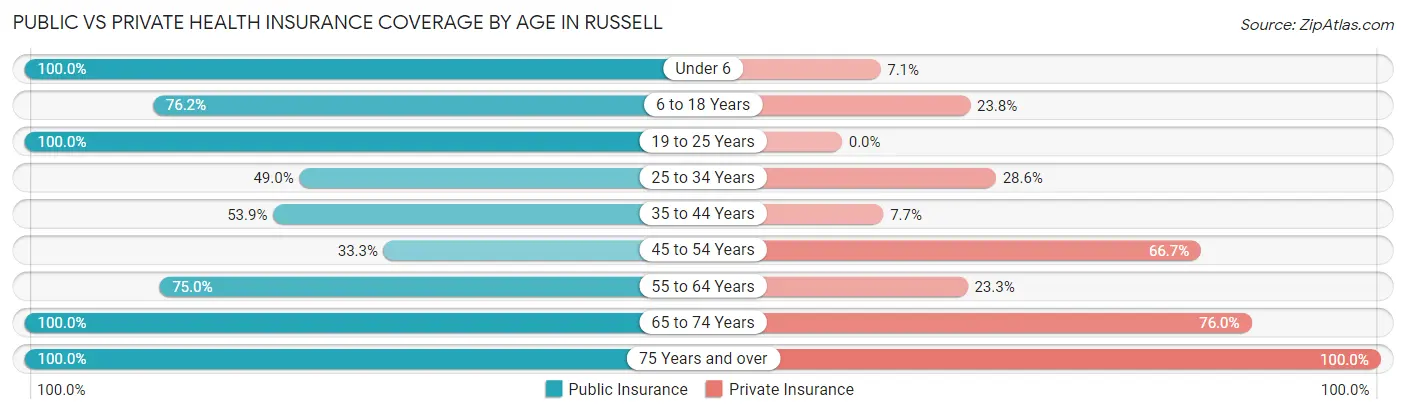
| Age Bracket | Public Insurance | Private Insurance |
| Under 6 | 14 (100.0%) | 1 (7.1%) |
| 6 to 18 Years | 48 (76.2%) | 15 (23.8%) |
| 19 to 25 Years | 4 (100.0%) | 0 (0.0%) |
| 25 to 34 Years | 24 (49.0%) | 14 (28.6%) |
| 35 to 44 Years | 21 (53.8%) | 3 (7.7%) |
| 45 to 54 Years | 4 (33.3%) | 8 (66.7%) |
| 55 to 64 Years | 45 (75.0%) | 14 (23.3%) |
| 65 to 74 Years | 25 (100.0%) | 19 (76.0%) |
| 75 Years and over | 23 (100.0%) | 23 (100.0%) |
| Total | 208 (72.0%) | 97 (33.6%) |
Disability Status by Sex by Age in Russell
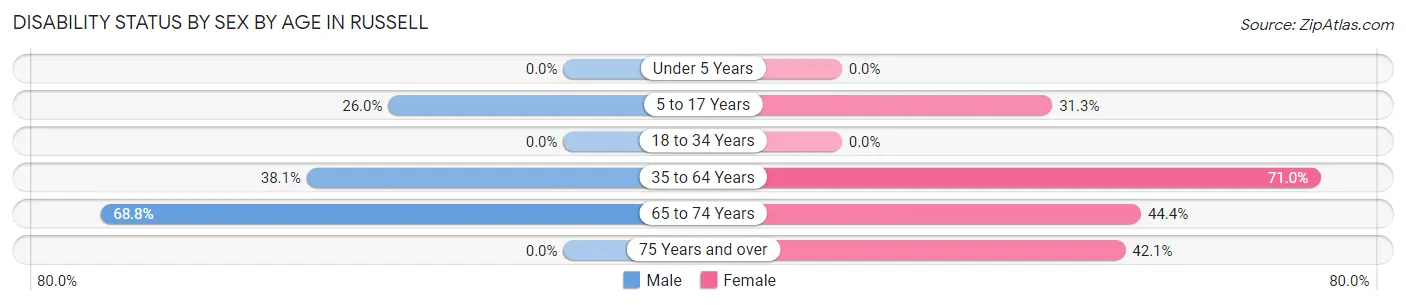
| Age Bracket | Male | Female |
| Under 5 Years | 0 (0.0%) | 0 (0.0%) |
| 5 to 17 Years | 13 (26.0%) | 5 (31.2%) |
| 18 to 34 Years | 0 (0.0%) | 0 (0.0%) |
| 35 to 64 Years | 16 (38.1%) | 49 (71.0%) |
| 65 to 74 Years | 11 (68.8%) | 4 (44.4%) |
| 75 Years and over | 0 (0.0%) | 8 (42.1%) |
Disability Class by Sex by Age in Russell
Disability Class: Hearing Difficulty
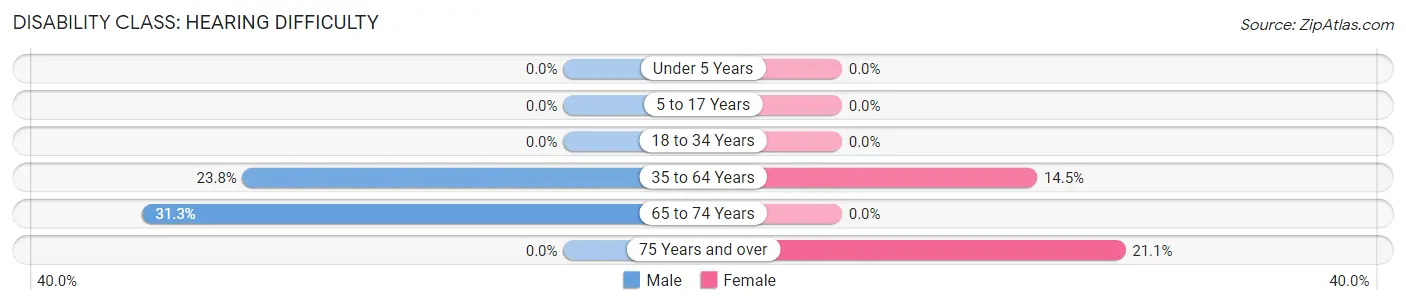
| Age Bracket | Male | Female |
| Under 5 Years | 0 (0.0%) | 0 (0.0%) |
| 5 to 17 Years | 0 (0.0%) | 0 (0.0%) |
| 18 to 34 Years | 0 (0.0%) | 0 (0.0%) |
| 35 to 64 Years | 10 (23.8%) | 10 (14.5%) |
| 65 to 74 Years | 5 (31.2%) | 0 (0.0%) |
| 75 Years and over | 0 (0.0%) | 4 (21.0%) |
Disability Class: Vision Difficulty
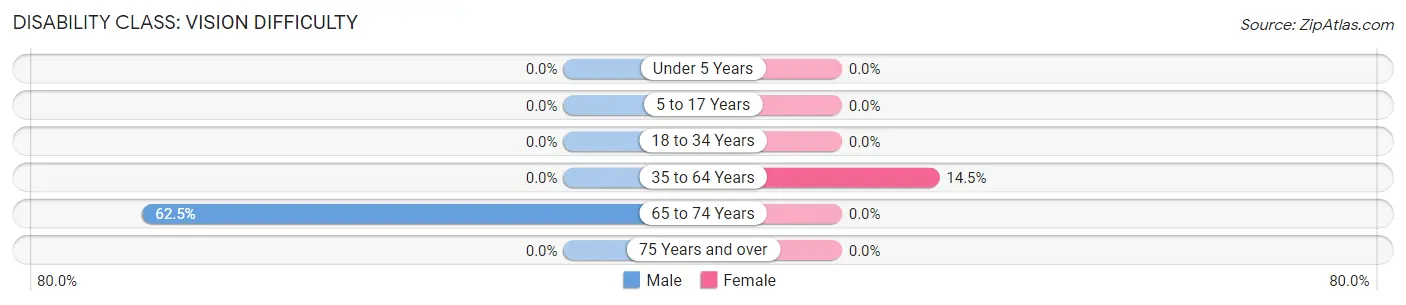
| Age Bracket | Male | Female |
| Under 5 Years | 0 (0.0%) | 0 (0.0%) |
| 5 to 17 Years | 0 (0.0%) | 0 (0.0%) |
| 18 to 34 Years | 0 (0.0%) | 0 (0.0%) |
| 35 to 64 Years | 0 (0.0%) | 10 (14.5%) |
| 65 to 74 Years | 10 (62.5%) | 0 (0.0%) |
| 75 Years and over | 0 (0.0%) | 0 (0.0%) |
Disability Class: Cognitive Difficulty
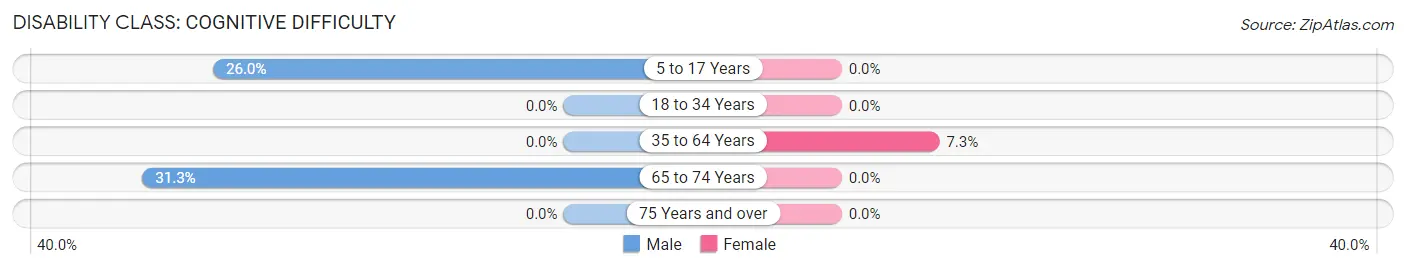
| Age Bracket | Male | Female |
| 5 to 17 Years | 13 (26.0%) | 0 (0.0%) |
| 18 to 34 Years | 0 (0.0%) | 0 (0.0%) |
| 35 to 64 Years | 0 (0.0%) | 5 (7.2%) |
| 65 to 74 Years | 5 (31.2%) | 0 (0.0%) |
| 75 Years and over | 0 (0.0%) | 0 (0.0%) |
Disability Class: Ambulatory Difficulty
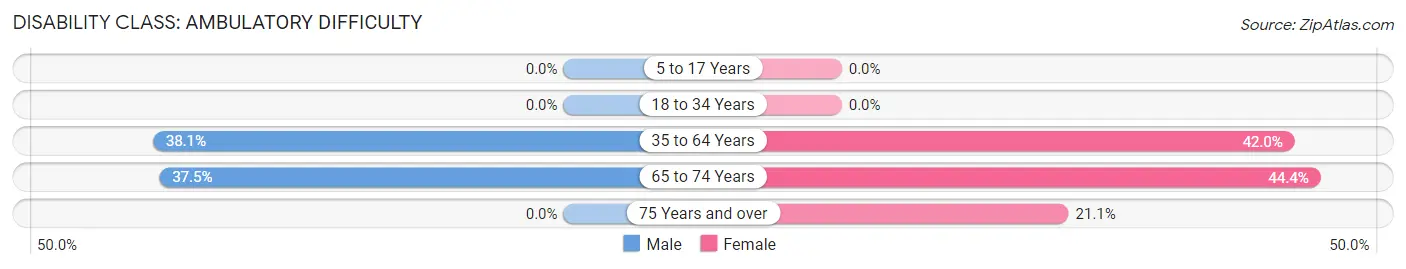
| Age Bracket | Male | Female |
| 5 to 17 Years | 0 (0.0%) | 0 (0.0%) |
| 18 to 34 Years | 0 (0.0%) | 0 (0.0%) |
| 35 to 64 Years | 16 (38.1%) | 29 (42.0%) |
| 65 to 74 Years | 6 (37.5%) | 4 (44.4%) |
| 75 Years and over | 0 (0.0%) | 4 (21.0%) |
Disability Class: Self-Care Difficulty
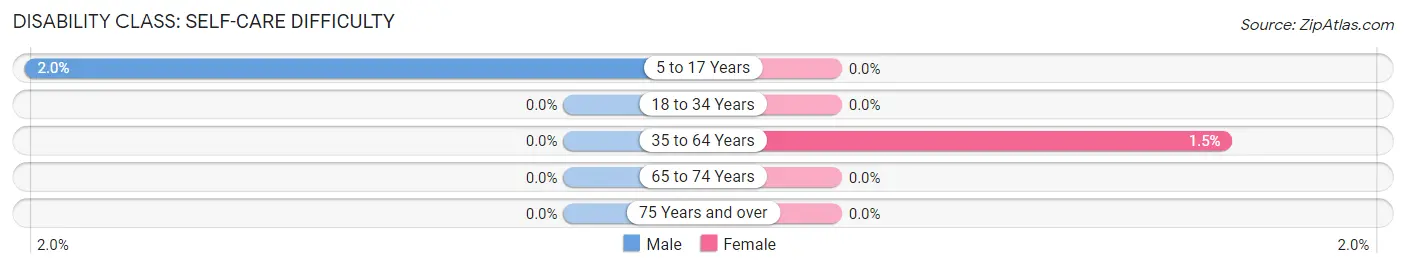
| Age Bracket | Male | Female |
| 5 to 17 Years | 1 (2.0%) | 0 (0.0%) |
| 18 to 34 Years | 0 (0.0%) | 0 (0.0%) |
| 35 to 64 Years | 0 (0.0%) | 1 (1.5%) |
| 65 to 74 Years | 0 (0.0%) | 0 (0.0%) |
| 75 Years and over | 0 (0.0%) | 0 (0.0%) |
Technology Access in Russell
Computing Device Access in Russell
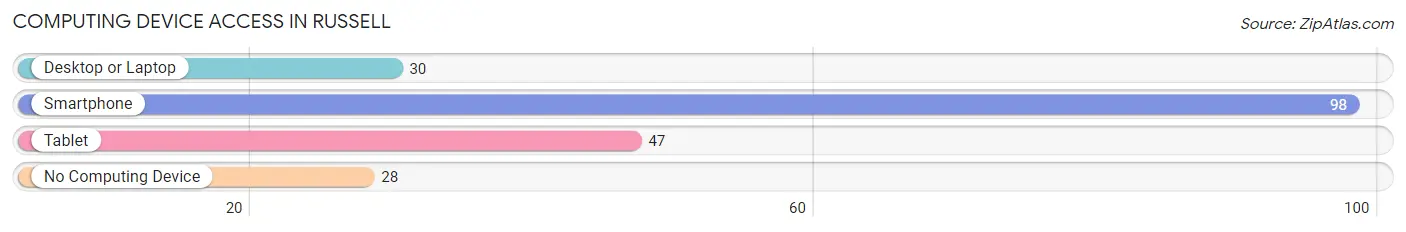
| Device Type | # Households | % Households |
| Desktop or Laptop | 30 | 23.8% |
| Smartphone | 98 | 77.8% |
| Tablet | 47 | 37.3% |
| No Computing Device | 28 | 22.2% |
| Total | 126 | 100.0% |
Internet Access in Russell
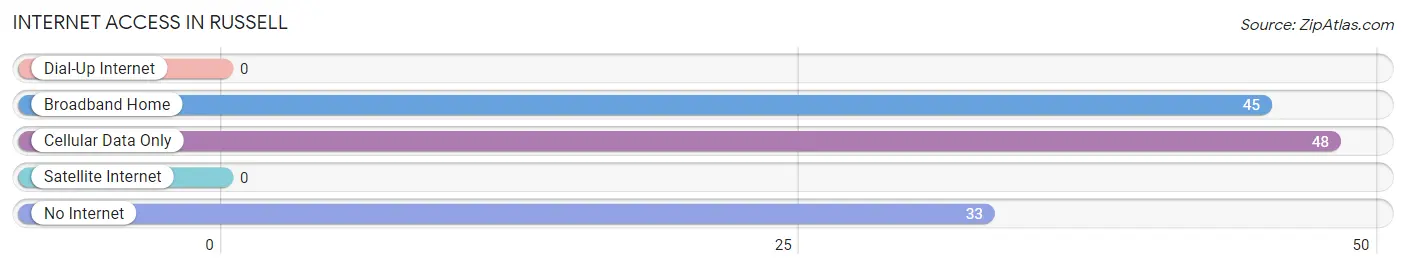
| Internet Type | # Households | % Households |
| Dial-Up Internet | 0 | 0.0% |
| Broadband Home | 45 | 35.7% |
| Cellular Data Only | 48 | 38.1% |
| Satellite Internet | 0 | 0.0% |
| No Internet | 33 | 26.2% |
| Total | 126 | 100.0% |
Russell Summary
Russell is a city located in the state of Arkansas, in the United States of America. It is situated in the northwest corner of the state, in the Ozark Mountains. The city is located in Franklin County, and is the county seat. The population of Russell was estimated to be 1,845 in 2019.
History
The area that is now Russell was first settled in the early 1800s by settlers from Tennessee and Kentucky. The first post office was established in 1837, and the town was named after William Russell, a prominent local landowner. The town was incorporated in 1883.
In the late 1800s, Russell was a thriving agricultural community, with a variety of crops being grown in the area. The town was also home to several sawmills and gristmills. In the early 1900s, the town began to experience a decline in population, as many of the residents moved away to larger cities in search of better economic opportunities.
In the mid-1900s, the town began to experience a resurgence in population, as many of the residents returned to the area. The town was also home to several manufacturing plants, which provided jobs for many of the residents.
Geography
Russell is located in the northwest corner of Arkansas, in the Ozark Mountains. The city is situated in Franklin County, and is the county seat. The city is located at an elevation of 1,072 feet above sea level.
The city is located in a hilly area, with the Ozark Mountains to the north and the Arkansas River to the south. The city is located approximately 30 miles from the state capital of Little Rock.
Economy
The economy of Russell is largely based on agriculture and manufacturing. The city is home to several manufacturing plants, which produce a variety of products, including furniture, clothing, and automotive parts.
The city is also home to several agricultural operations, which produce a variety of crops, including corn, soybeans, and wheat. The city is also home to several sawmills and gristmills, which produce lumber and flour.
Demographics
As of the 2019 census, the population of Russell was estimated to be 1,845. The racial makeup of the city was 94.3% White, 2.2% African American, 0.3% Native American, 0.2% Asian, 0.1% Pacific Islander, and 2.9% from other races.
The median household income in Russell was estimated to be $37,941 in 2019. The median home value was estimated to be $90,000 in 2019. The city has a poverty rate of 17.3%.
Conclusion
Russell is a city located in the northwest corner of Arkansas, in the Ozark Mountains. The city is the county seat of Franklin County, and has an estimated population of 1,845. The economy of Russell is largely based on agriculture and manufacturing, and the city is home to several manufacturing plants and agricultural operations. The median household income in Russell was estimated to be $37,941 in 2019, and the median home value was estimated to be $90,000 in 2019.
Common Questions
What is Per Capita Income in Russell?
Per Capita income in Russell is $15,815.
What is the Median Family Income in Russell?
Median Family Income in Russell is $21,042.
What is the Median Household income in Russell?
Median Household Income in Russell is $22,895.
What is Family Income Deficit in Russell?
Family Income Deficit in Russell is $14,300.
Families that are below poverty line in Russell earn $14,300 less on average than the poverty threshold level.
What is Inequality or Gini Index in Russell?
Inequality or Gini Index in Russell is 0.45.
What is the Total Population of Russell?
Total Population of Russell is 289.
What is the Total Male Population of Russell?
Total Male Population of Russell is 135.
What is the Total Female Population of Russell?
Total Female Population of Russell is 154.
What is the Ratio of Males per 100 Females in Russell?
There are 87.66 Males per 100 Females in Russell.
What is the Ratio of Females per 100 Males in Russell?
There are 114.07 Females per 100 Males in Russell.
What is the Median Population Age in Russell?
Median Population Age in Russell is 39.9 Years.
What is the Average Family Size in Russell
Average Family Size in Russell is 3.1 People.
What is the Average Household Size in Russell
Average Household Size in Russell is 2.3 People.
How Large is the Labor Force in Russell?
There are 76 People in the Labor Forcein in Russell.
What is the Percentage of People in the Labor Force in Russell?
34.5% of People are in the Labor Force in Russell.
What is the Unemployment Rate in Russell?
Unemployment Rate in Russell is 7.9%.