Smithville, AR
Smithville Map
Smithville Overview
92
TOTAL POPULATION
46
MALE POPULATION
46
FEMALE POPULATION
100.00
MALES / 100 FEMALES
100.00
FEMALES / 100 MALES
25.2
MEDIAN AGE
2.9
AVG FAMILY SIZE
2.9
AVG HOUSEHOLD SIZE
$21,517
PER CAPITA INCOME
$52,917
AVG FAMILY INCOME
$53,333
AVG HOUSEHOLD INCOME
0.54
INEQUALITY / GINI INDEX
41
LABOR FORCE [ PEOPLE ]
57.7%
PERCENT IN LABOR FORCE
4.9%
UNEMPLOYMENT RATE
Smithville Zip Codes
Smithville Area Codes
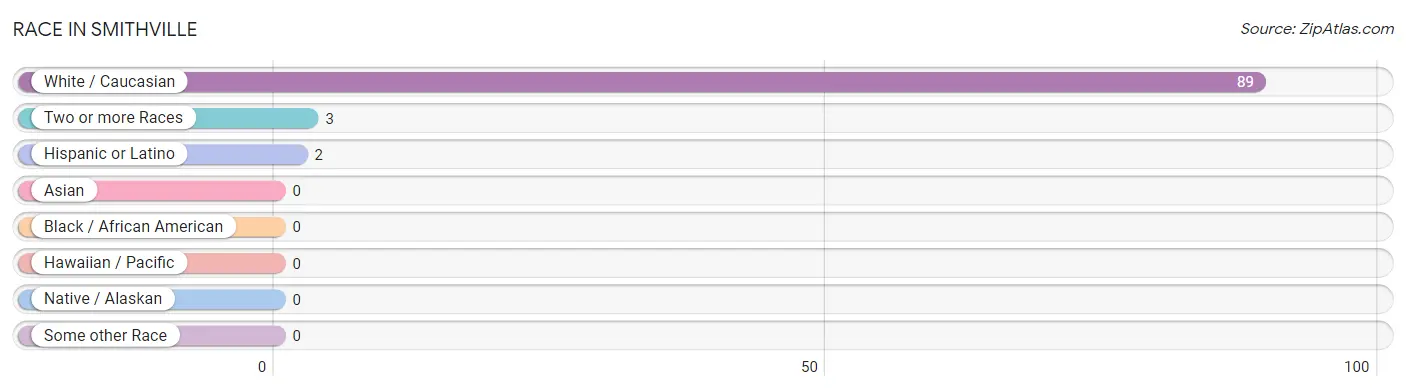
Race in Smithville
The most populous races in Smithville are White / Caucasian (89 | 96.7%), Two or more Races (3 | 3.3%), and Hispanic or Latino (2 | 2.2%).
| Race | # Population | % Population |
| Asian | 0 | 0.0% |
| Black / African American | 0 | 0.0% |
| Hawaiian / Pacific | 0 | 0.0% |
| Hispanic or Latino | 2 | 2.2% |
| Native / Alaskan | 0 | 0.0% |
| White / Caucasian | 89 | 96.7% |
| Two or more Races | 3 | 3.3% |
| Some other Race | 0 | 0.0% |
| Total | 92 | 100.0% |
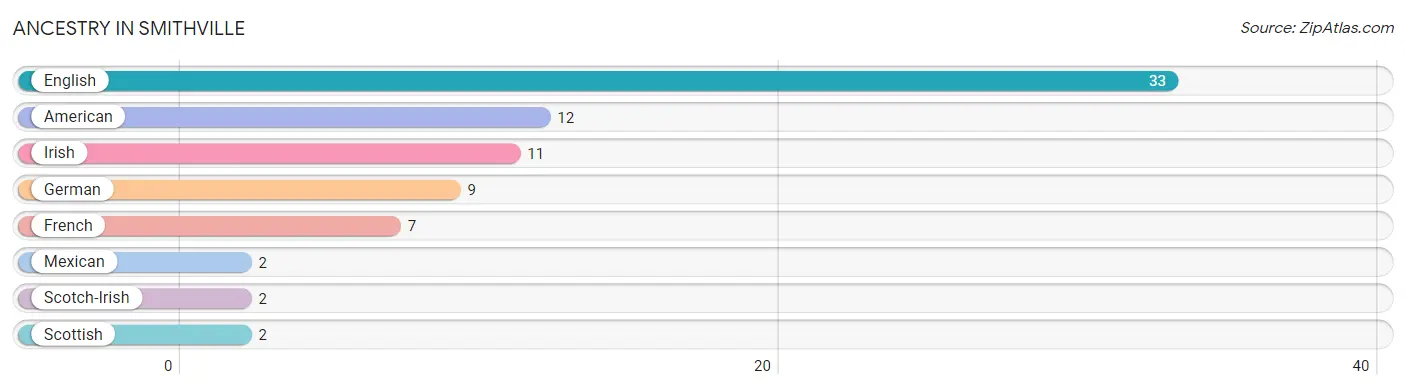
Ancestry in Smithville
The most populous ancestries reported in Smithville are English (33 | 35.9%), American (12 | 13.0%), Irish (11 | 12.0%), German (9 | 9.8%), and French (7 | 7.6%), together accounting for 78.3% of all Smithville residents.
| Ancestry | # Population | % Population |
| American | 12 | 13.0% |
| English | 33 | 35.9% |
| French | 7 | 7.6% |
| German | 9 | 9.8% |
| Irish | 11 | 12.0% |
| Mexican | 2 | 2.2% |
| Scotch-Irish | 2 | 2.2% |
| Scottish | 2 | 2.2% | View All 8 Rows |
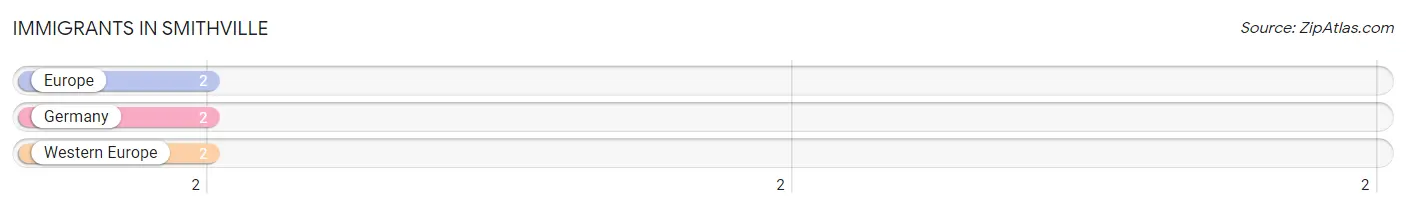
Immigrants in Smithville
The most numerous immigrant groups reported in Smithville came from Europe (2 | 2.2%), Germany (2 | 2.2%), and Western Europe (2 | 2.2%), together accounting for 6.5% of all Smithville residents.
| Immigration Origin | # Population | % Population |
| Europe | 2 | 2.2% |
| Germany | 2 | 2.2% |
| Western Europe | 2 | 2.2% | View All 3 Rows |
Sex and Age in Smithville
Sex and Age in Smithville
The most populous age groups in Smithville are 15 to 19 Years (11 | 23.9%) for men and 15 to 19 Years (10 | 21.7%) for women.
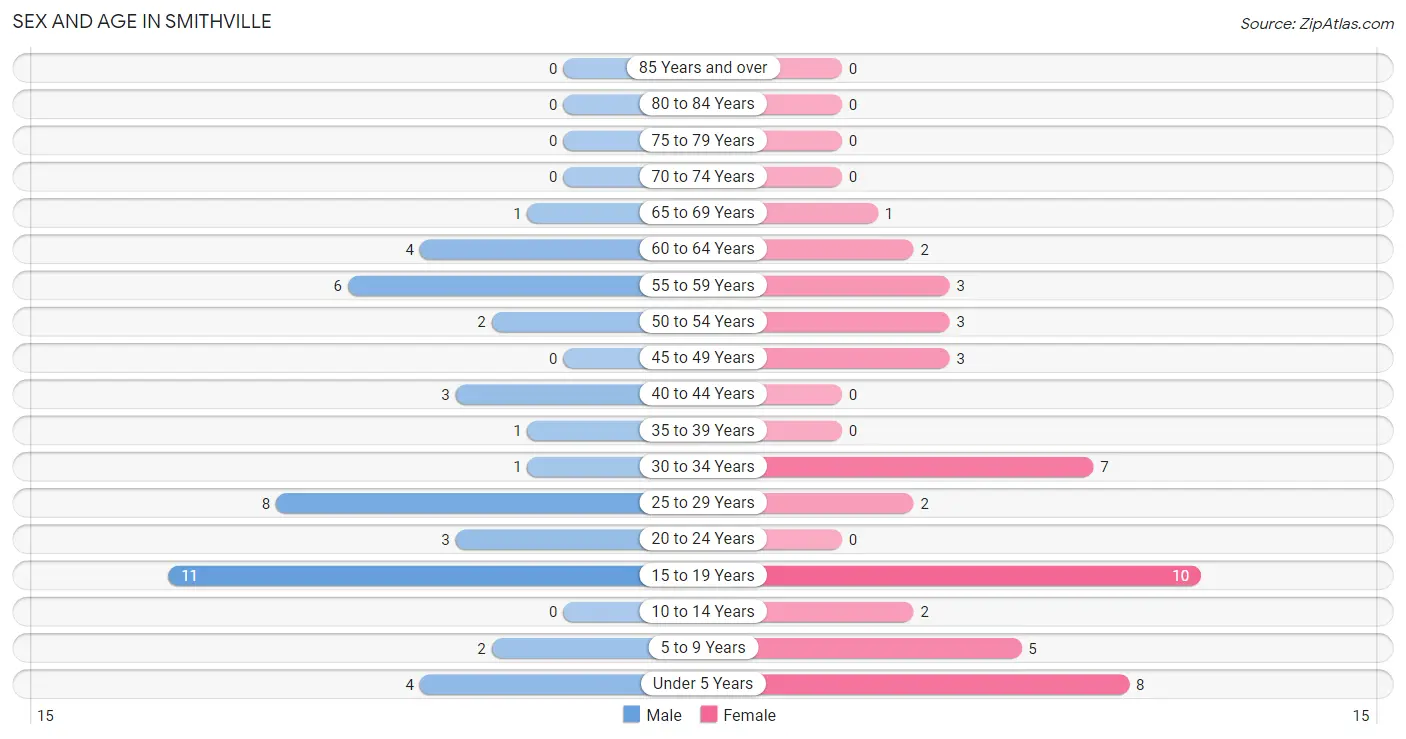
| Age Bracket | Male | Female |
| Under 5 Years | 4 (8.7%) | 8 (17.4%) |
| 5 to 9 Years | 2 (4.3%) | 5 (10.9%) |
| 10 to 14 Years | 0 (0.0%) | 2 (4.3%) |
| 15 to 19 Years | 11 (23.9%) | 10 (21.7%) |
| 20 to 24 Years | 3 (6.5%) | 0 (0.0%) |
| 25 to 29 Years | 8 (17.4%) | 2 (4.3%) |
| 30 to 34 Years | 1 (2.2%) | 7 (15.2%) |
| 35 to 39 Years | 1 (2.2%) | 0 (0.0%) |
| 40 to 44 Years | 3 (6.5%) | 0 (0.0%) |
| 45 to 49 Years | 0 (0.0%) | 3 (6.5%) |
| 50 to 54 Years | 2 (4.3%) | 3 (6.5%) |
| 55 to 59 Years | 6 (13.0%) | 3 (6.5%) |
| 60 to 64 Years | 4 (8.7%) | 2 (4.3%) |
| 65 to 69 Years | 1 (2.2%) | 1 (2.2%) |
| 70 to 74 Years | 0 (0.0%) | 0 (0.0%) |
| 75 to 79 Years | 0 (0.0%) | 0 (0.0%) |
| 80 to 84 Years | 0 (0.0%) | 0 (0.0%) |
| 85 Years and over | 0 (0.0%) | 0 (0.0%) |
| Total | 46 (100.0%) | 46 (100.0%) |
Families and Households in Smithville
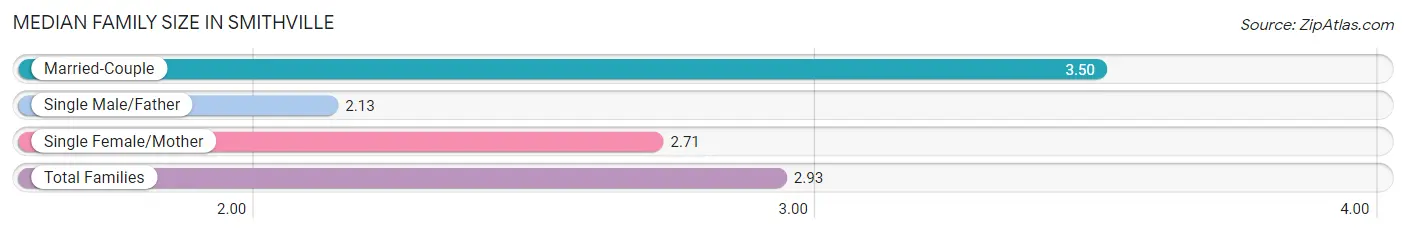
Median Family Size in Smithville
The median family size in Smithville is 2.93 persons per family, with married-couple families (14 | 48.3%) accounting for the largest median family size of 3.5 persons per family. On the other hand, single male/father families (8 | 27.6%) represent the smallest median family size with 2.13 persons per family.
| Family Type | # Families | Family Size |
| Married-Couple | 14 (48.3%) | 3.50 |
| Single Male/Father | 8 (27.6%) | 2.13 |
| Single Female/Mother | 7 (24.1%) | 2.71 |
| Total Families | 29 (100.0%) | 2.93 |
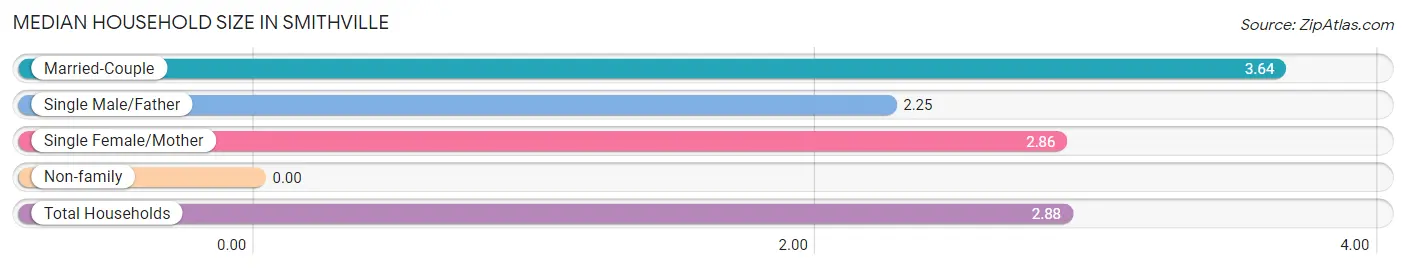
Median Household Size in Smithville
| Household Type | # Households | Household Size |
| Married-Couple | 14 (43.8%) | 3.64 |
| Single Male/Father | 8 (25.0%) | 2.25 |
| Single Female/Mother | 7 (21.9%) | 2.86 |
| Non-family | 3 (9.4%) | - |
| Total Households | 32 (100.0%) | 2.88 |
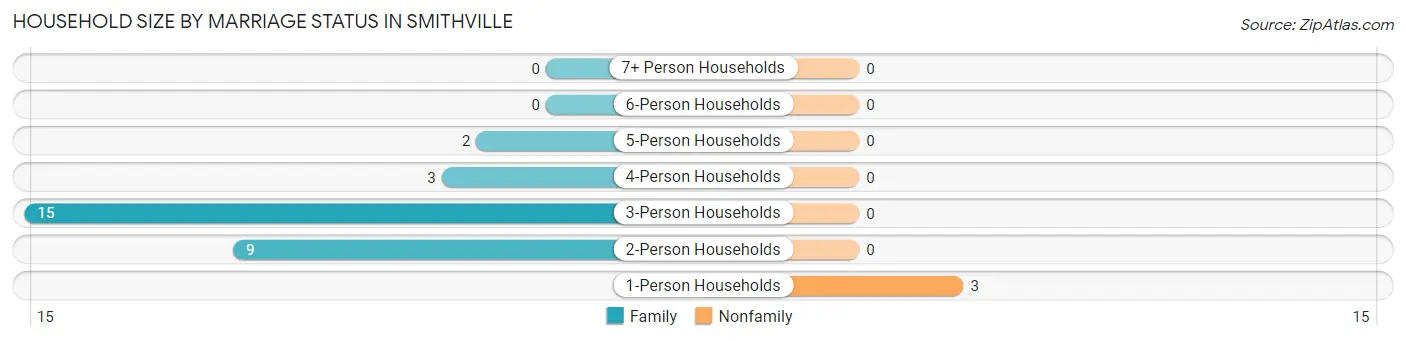
Household Size by Marriage Status in Smithville
Out of a total of 32 households in Smithville, 29 (90.6%) are family households, while 3 (9.4%) are nonfamily households. The most numerous type of family households are 3-person households, comprising 15, and the most common type of nonfamily households are 1-person households, comprising 3.
| Household Size | Family Households | Nonfamily Households |
| 1-Person Households | - | 3 (9.4%) |
| 2-Person Households | 9 (28.1%) | 0 (0.0%) |
| 3-Person Households | 15 (46.9%) | 0 (0.0%) |
| 4-Person Households | 3 (9.4%) | 0 (0.0%) |
| 5-Person Households | 2 (6.2%) | 0 (0.0%) |
| 6-Person Households | 0 (0.0%) | 0 (0.0%) |
| 7+ Person Households | 0 (0.0%) | 0 (0.0%) |
| Total | 29 (90.6%) | 3 (9.4%) |
Female Fertility in Smithville
Fertility by Age in Smithville
Average fertility rate in Smithville is 136.0 births per 1,000 women. Women in the age bracket of 20 to 34 years have the highest fertility rate with 333.0 births per 1,000 women. Women in the age bracket of 20 to 34 years acount for 100.0% of all women with births.
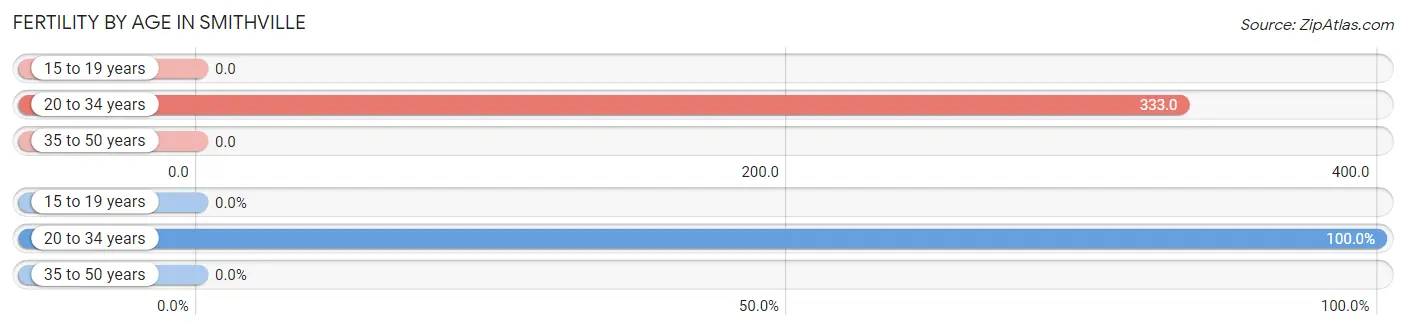
| Age Bracket | Women with Births | Births / 1,000 Women |
| 15 to 19 years | 0 (0.0%) | 0.0 |
| 20 to 34 years | 3 (100.0%) | 333.0 |
| 35 to 50 years | 0 (0.0%) | 0.0 |
| Total | 3 (100.0%) | 136.0 |
Fertility by Age by Marriage Status in Smithville
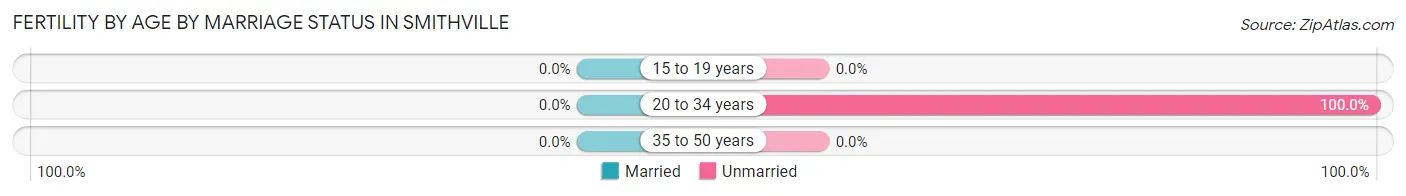
| Age Bracket | Married | Unmarried |
| 15 to 19 years | 0 (0.0%) | 0 (0.0%) |
| 20 to 34 years | 0 (0.0%) | 3 (100.0%) |
| 35 to 50 years | 0 (0.0%) | 0 (0.0%) |
| Total | 0 (0.0%) | 3 (100.0%) |
Fertility by Education in Smithville
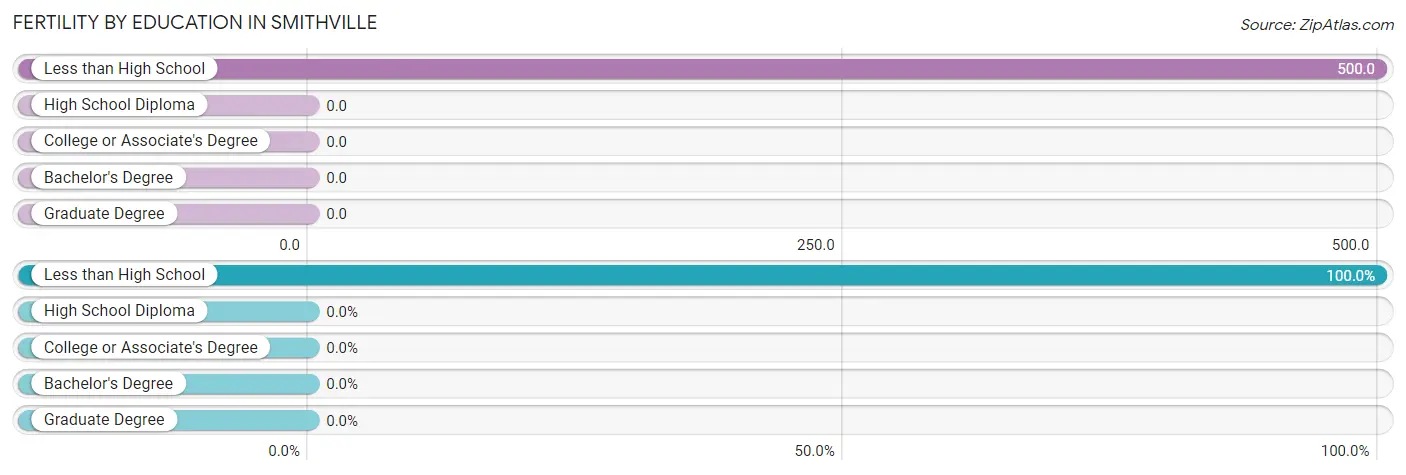
| Educational Attainment | Women with Births | Births / 1,000 Women |
| Less than High School | 3 (100.0%) | 500.0 |
| High School Diploma | 0 (0.0%) | 0.0 |
| College or Associate's Degree | 0 (0.0%) | 0.0 |
| Bachelor's Degree | 0 (0.0%) | 0.0 |
| Graduate Degree | 0 (0.0%) | 0.0 |
| Total | 3 (100.0%) | 136.0 |
Fertility by Education by Marriage Status in Smithville
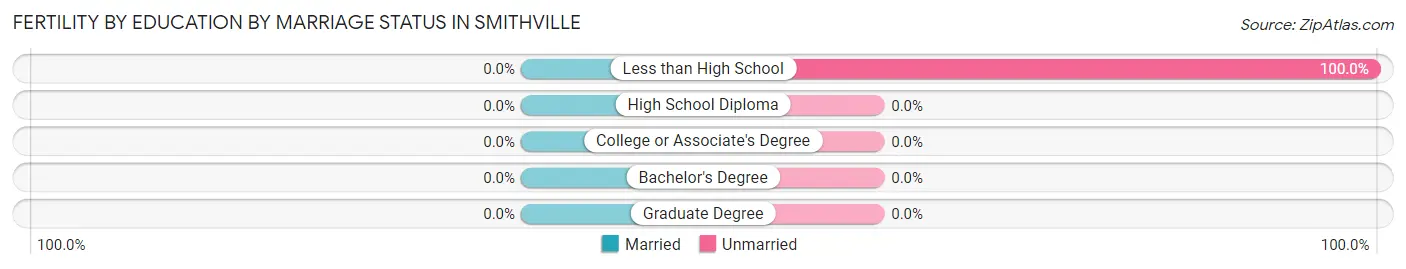
| Educational Attainment | Married | Unmarried |
| Less than High School | 0 (0.0%) | 3 (100.0%) |
| High School Diploma | 0 (0.0%) | 0 (0.0%) |
| College or Associate's Degree | 0 (0.0%) | 0 (0.0%) |
| Bachelor's Degree | 0 (0.0%) | 0 (0.0%) |
| Graduate Degree | 0 (0.0%) | 0 (0.0%) |
| Total | 0 (0.0%) | 3 (100.0%) |
Income in Smithville
Income Overview in Smithville
Per Capita Income in Smithville is $21,517, while median incomes of families and households are $52,917 and $53,333 respectively.
| Characteristic | Number | Measure |
| Per Capita Income | 92 | $21,517 |
| Median Family Income | 29 | $52,917 |
| Mean Family Income | 29 | $62,638 |
| Median Household Income | 32 | $53,333 |
| Mean Household Income | 32 | $60,219 |
| Income Deficit | 29 | $0 |
| Wage / Income Gap (%) | 92 | 0.00% |
| Wage / Income Gap ($) | 92 | 100.00¢ per $1 |
| Gini / Inequality Index | 92 | 0.54 |
Earnings by Sex in Smithville

| Sex | Number | Average Earnings |
| Male | 35 (70.0%) | $24,875 |
| Female | 15 (30.0%) | $0 |
| Total | 50 (100.0%) | $24,750 |
Earnings by Sex by Income Bracket in Smithville
The most common earnings brackets in Smithville are $22,500 to $24,999 for men (10 | 28.6%) and $7,500 to $9,999 for women (4 | 26.7%).
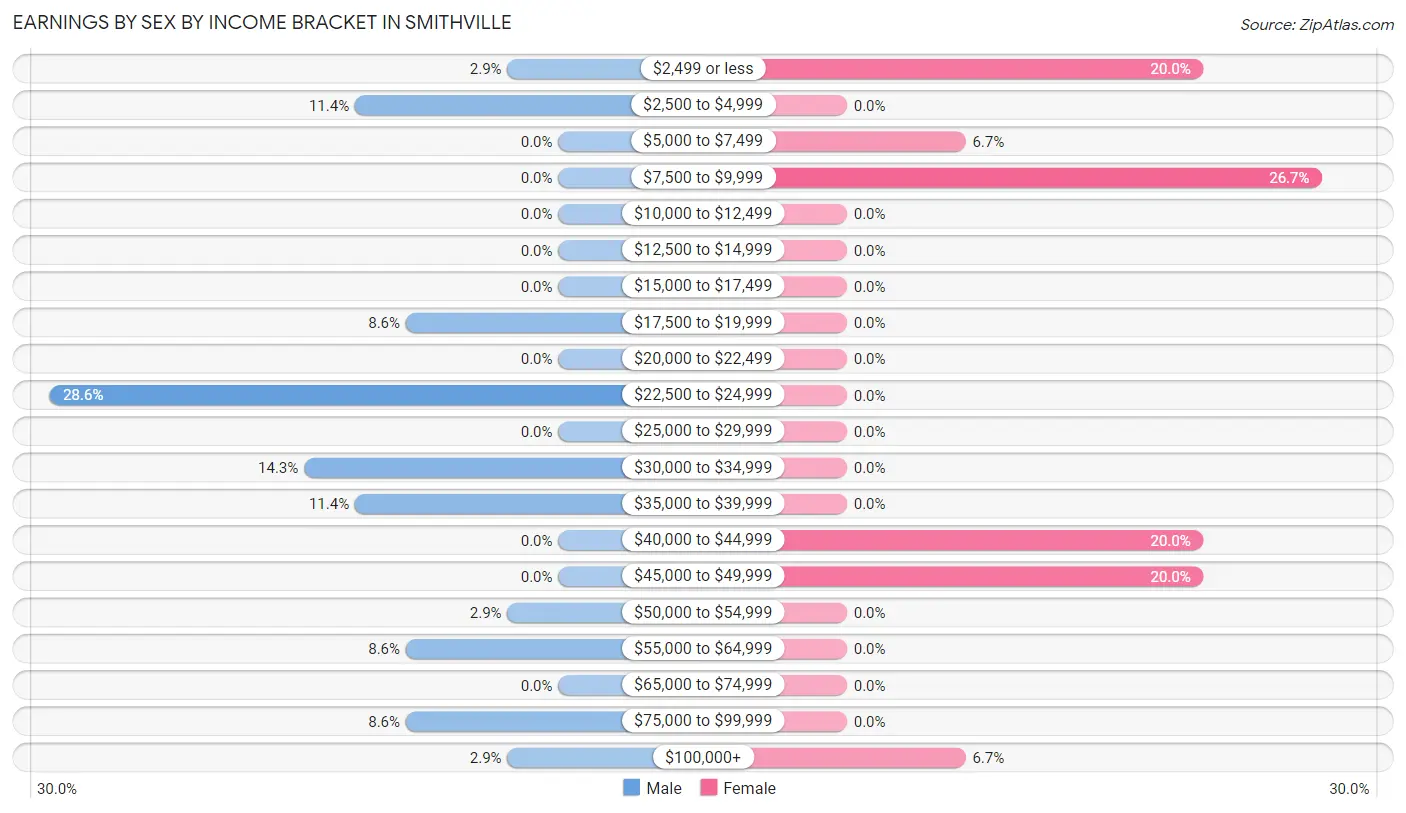
| Income | Male | Female |
| $2,499 or less | 1 (2.9%) | 3 (20.0%) |
| $2,500 to $4,999 | 4 (11.4%) | 0 (0.0%) |
| $5,000 to $7,499 | 0 (0.0%) | 1 (6.7%) |
| $7,500 to $9,999 | 0 (0.0%) | 4 (26.7%) |
| $10,000 to $12,499 | 0 (0.0%) | 0 (0.0%) |
| $12,500 to $14,999 | 0 (0.0%) | 0 (0.0%) |
| $15,000 to $17,499 | 0 (0.0%) | 0 (0.0%) |
| $17,500 to $19,999 | 3 (8.6%) | 0 (0.0%) |
| $20,000 to $22,499 | 0 (0.0%) | 0 (0.0%) |
| $22,500 to $24,999 | 10 (28.6%) | 0 (0.0%) |
| $25,000 to $29,999 | 0 (0.0%) | 0 (0.0%) |
| $30,000 to $34,999 | 5 (14.3%) | 0 (0.0%) |
| $35,000 to $39,999 | 4 (11.4%) | 0 (0.0%) |
| $40,000 to $44,999 | 0 (0.0%) | 3 (20.0%) |
| $45,000 to $49,999 | 0 (0.0%) | 3 (20.0%) |
| $50,000 to $54,999 | 1 (2.9%) | 0 (0.0%) |
| $55,000 to $64,999 | 3 (8.6%) | 0 (0.0%) |
| $65,000 to $74,999 | 0 (0.0%) | 0 (0.0%) |
| $75,000 to $99,999 | 3 (8.6%) | 0 (0.0%) |
| $100,000+ | 1 (2.9%) | 1 (6.7%) |
| Total | 35 (100.0%) | 15 (100.0%) |
Earnings by Sex by Educational Attainment in Smithville
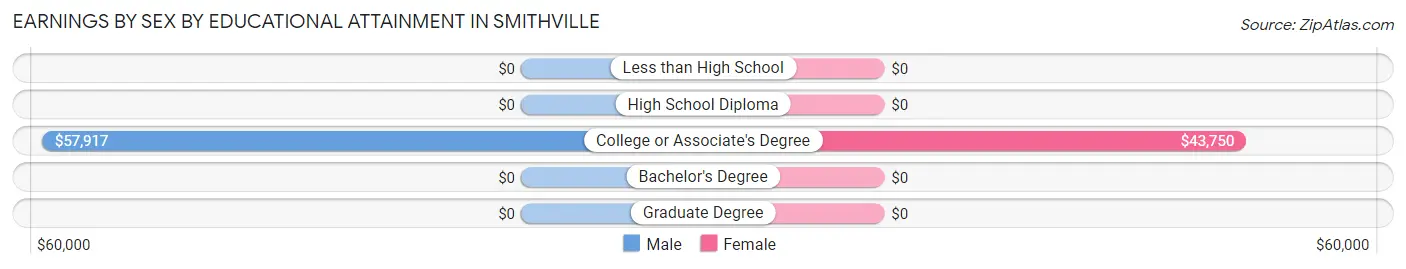
| Educational Attainment | Male Income | Female Income |
| Less than High School | - | - |
| High School Diploma | - | - |
| College or Associate's Degree | $57,917 | $43,750 |
| Bachelor's Degree | - | - |
| Graduate Degree | - | - |
| Total | $38,438 | $0 |
Family Income in Smithville
Family Income Brackets in Smithville
According to the Smithville family income data, there are 7 families falling into the less than $10,000 income range, which is the most common income bracket and makes up 24.1% of all families.
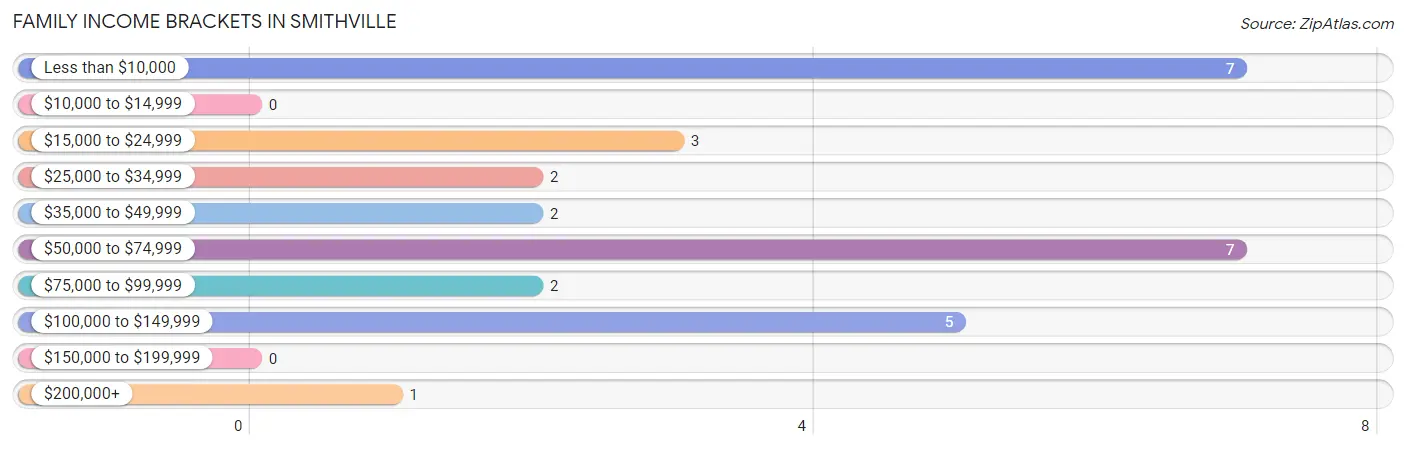
| Income Bracket | # Families | % Families |
| Less than $10,000 | 7 | 24.1% |
| $10,000 to $14,999 | 0 | 0.0% |
| $15,000 to $24,999 | 3 | 10.3% |
| $25,000 to $34,999 | 2 | 6.9% |
| $35,000 to $49,999 | 2 | 6.9% |
| $50,000 to $74,999 | 7 | 24.1% |
| $75,000 to $99,999 | 2 | 6.9% |
| $100,000 to $149,999 | 5 | 17.2% |
| $150,000 to $199,999 | 0 | 0.0% |
| $200,000+ | 1 | 3.4% |
Family Income by Famaliy Size in Smithville
2-person families (14 | 48.3%) account for the highest median family income in Smithville with $54,167 per family, while 2-person families (14 | 48.3%) have the highest median income of $27,084 per family member.
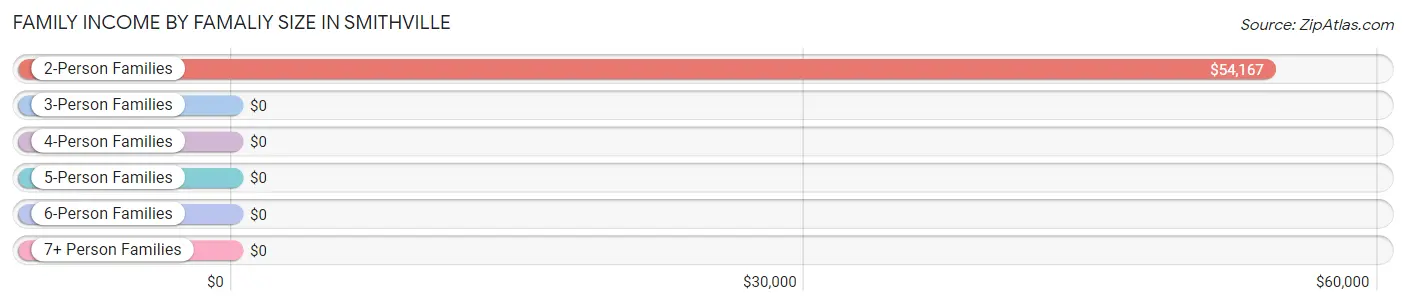
| Income Bracket | # Families | Median Income |
| 2-Person Families | 14 (48.3%) | $54,167 |
| 3-Person Families | 12 (41.4%) | $0 |
| 4-Person Families | 3 (10.3%) | $0 |
| 5-Person Families | 0 (0.0%) | $0 |
| 6-Person Families | 0 (0.0%) | $0 |
| 7+ Person Families | 0 (0.0%) | $0 |
| Total | 29 (100.0%) | $52,917 |
Family Income by Number of Earners in Smithville
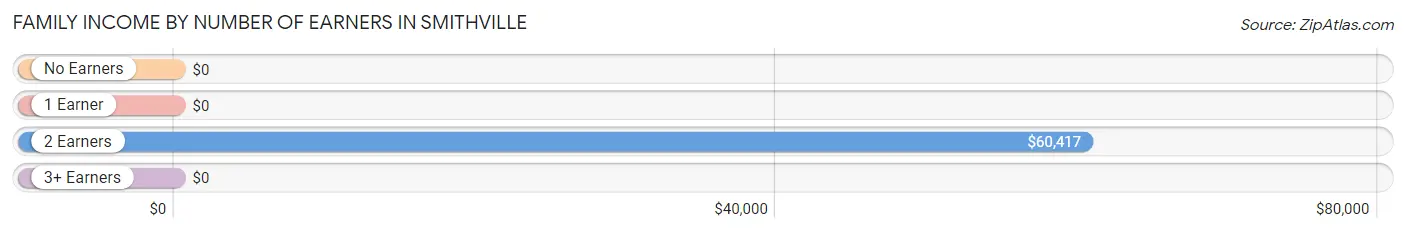
| Number of Earners | # Families | Median Income |
| No Earners | 4 (13.8%) | $0 |
| 1 Earner | 11 (37.9%) | $0 |
| 2 Earners | 11 (37.9%) | $60,417 |
| 3+ Earners | 3 (10.3%) | $0 |
| Total | 29 (100.0%) | $52,917 |
Household Income in Smithville
Household Income Brackets in Smithville
With 9 households falling in the category, the $50,000 to $74,999 income range is the most frequent in Smithville, accounting for 28.1% of all households.
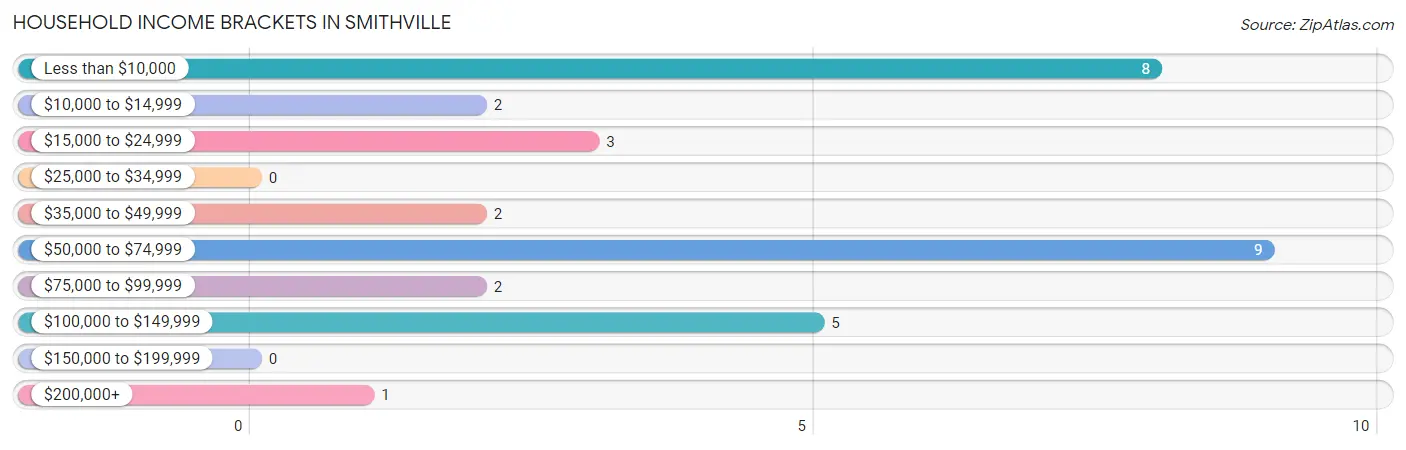
| Income Bracket | # Households | % Households |
| Less than $10,000 | 8 | 25.0% |
| $10,000 to $14,999 | 2 | 6.3% |
| $15,000 to $24,999 | 3 | 9.4% |
| $25,000 to $34,999 | 0 | 0.0% |
| $35,000 to $49,999 | 2 | 6.3% |
| $50,000 to $74,999 | 9 | 28.1% |
| $75,000 to $99,999 | 2 | 6.3% |
| $100,000 to $149,999 | 5 | 15.6% |
| $150,000 to $199,999 | 0 | 0.0% |
| $200,000+ | 1 | 3.1% |
Household Income by Householder Age in Smithville
| Income Bracket | # Households | Median Income |
| 15 to 24 Years | 6 (18.8%) | $0 |
| 25 to 44 Years | 11 (34.4%) | $0 |
| 45 to 64 Years | 14 (43.8%) | $0 |
| 65+ Years | 1 (3.1%) | $0 |
| Total | 32 (100.0%) | $53,333 |
Poverty in Smithville
Income Below Poverty by Sex and Age in Smithville
With 19.6% poverty level for males and 54.5% for females among the residents of Smithville, under 5 year old males and under 5 year old females are the most vulnerable to poverty, with 2 males (50.0%) and 8 females (100.0%) in their respective age groups living below the poverty level.
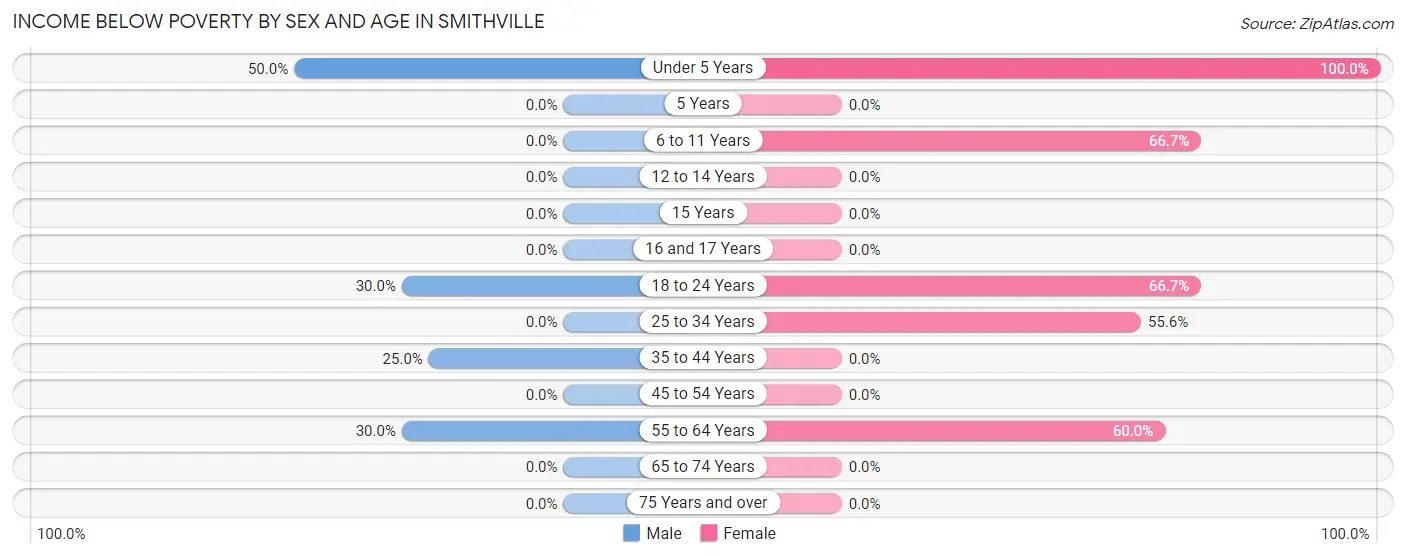
| Age Bracket | Male | Female |
| Under 5 Years | 2 (50.0%) | 8 (100.0%) |
| 5 Years | 0 (0.0%) | 0 (0.0%) |
| 6 to 11 Years | 0 (0.0%) | 2 (66.7%) |
| 12 to 14 Years | 0 (0.0%) | 0 (0.0%) |
| 15 Years | 0 (0.0%) | 0 (0.0%) |
| 16 and 17 Years | 0 (0.0%) | 0 (0.0%) |
| 18 to 24 Years | 3 (30.0%) | 6 (66.7%) |
| 25 to 34 Years | 0 (0.0%) | 5 (55.6%) |
| 35 to 44 Years | 1 (25.0%) | 0 (0.0%) |
| 45 to 54 Years | 0 (0.0%) | 0 (0.0%) |
| 55 to 64 Years | 3 (30.0%) | 3 (60.0%) |
| 65 to 74 Years | 0 (0.0%) | 0 (0.0%) |
| 75 Years and over | 0 (0.0%) | 0 (0.0%) |
| Total | 9 (19.6%) | 24 (54.5%) |
Income Above Poverty by Sex and Age in Smithville
According to the poverty statistics in Smithville, males aged 6 to 11 years and females aged 5 years are the age groups that are most secure financially, with 100.0% of males and 100.0% of females in these age groups living above the poverty line.
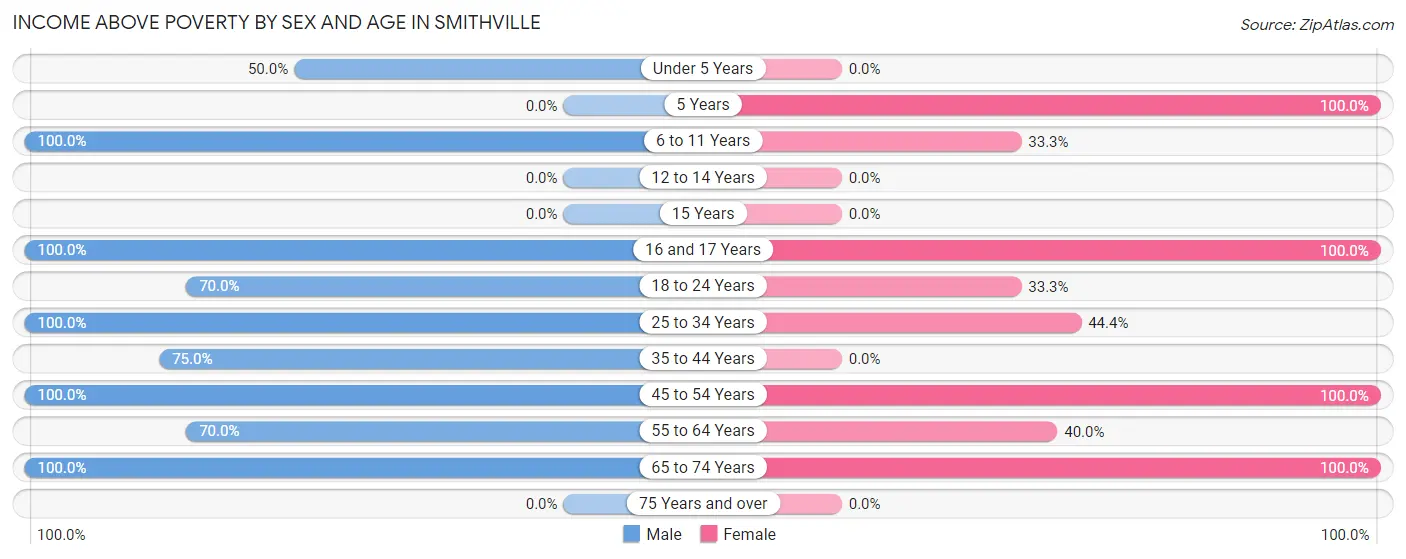
| Age Bracket | Male | Female |
| Under 5 Years | 2 (50.0%) | 0 (0.0%) |
| 5 Years | 0 (0.0%) | 2 (100.0%) |
| 6 to 11 Years | 2 (100.0%) | 1 (33.3%) |
| 12 to 14 Years | 0 (0.0%) | 0 (0.0%) |
| 15 Years | 0 (0.0%) | 0 (0.0%) |
| 16 and 17 Years | 4 (100.0%) | 1 (100.0%) |
| 18 to 24 Years | 7 (70.0%) | 3 (33.3%) |
| 25 to 34 Years | 9 (100.0%) | 4 (44.4%) |
| 35 to 44 Years | 3 (75.0%) | 0 (0.0%) |
| 45 to 54 Years | 2 (100.0%) | 6 (100.0%) |
| 55 to 64 Years | 7 (70.0%) | 2 (40.0%) |
| 65 to 74 Years | 1 (100.0%) | 1 (100.0%) |
| 75 Years and over | 0 (0.0%) | 0 (0.0%) |
| Total | 37 (80.4%) | 20 (45.5%) |
Income Below Poverty Among Married-Couple Families in Smithville
The poverty statistics for married-couple families in Smithville show that 35.7% or 5 of the total 14 families live below the poverty line. Families with 1 or 2 children have the highest poverty rate of 83.3%, comprising of 5 families. On the other hand, families with no children have the lowest poverty rate of 0.0%, which includes 0 families.
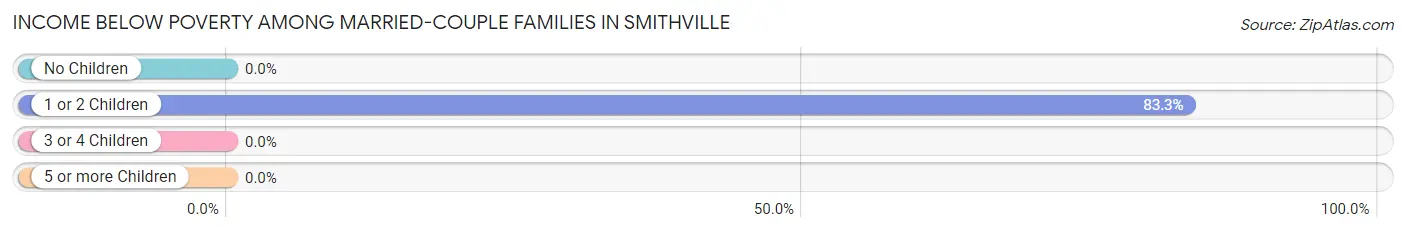
| Children | Above Poverty | Below Poverty |
| No Children | 8 (100.0%) | 0 (0.0%) |
| 1 or 2 Children | 1 (16.7%) | 5 (83.3%) |
| 3 or 4 Children | 0 (0.0%) | 0 (0.0%) |
| 5 or more Children | 0 (0.0%) | 0 (0.0%) |
| Total | 9 (64.3%) | 5 (35.7%) |
Income Below Poverty Among Single-Parent Households in Smithville
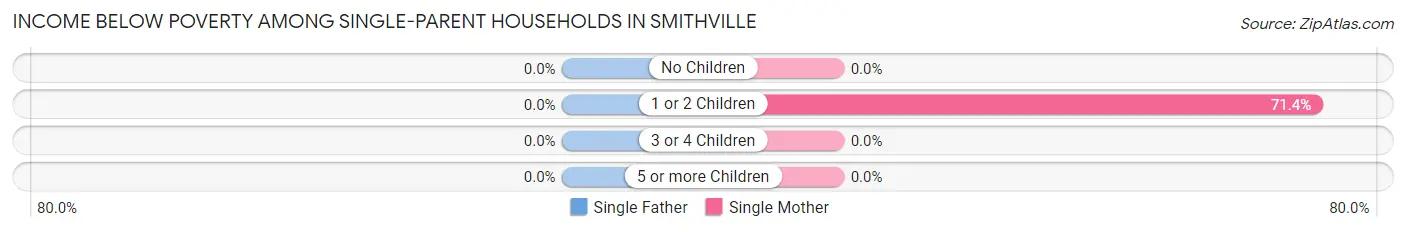
| Children | Single Father | Single Mother |
| No Children | 0 (0.0%) | 0 (0.0%) |
| 1 or 2 Children | 0 (0.0%) | 5 (71.4%) |
| 3 or 4 Children | 0 (0.0%) | 0 (0.0%) |
| 5 or more Children | 0 (0.0%) | 0 (0.0%) |
| Total | 0 (0.0%) | 5 (71.4%) |
Income Below Poverty Among Married-Couple vs Single-Parent Households in Smithville
The poverty data for Smithville shows that 5 of the married-couple family households (35.7%) and 5 of the single-parent households (33.3%) are living below the poverty level. Within the married-couple family households, those with 1 or 2 children have the highest poverty rate, with 5 households (83.3%) falling below the poverty line. Among the single-parent households, those with 1 or 2 children have the highest poverty rate, with 5 household (41.7%) living below poverty.
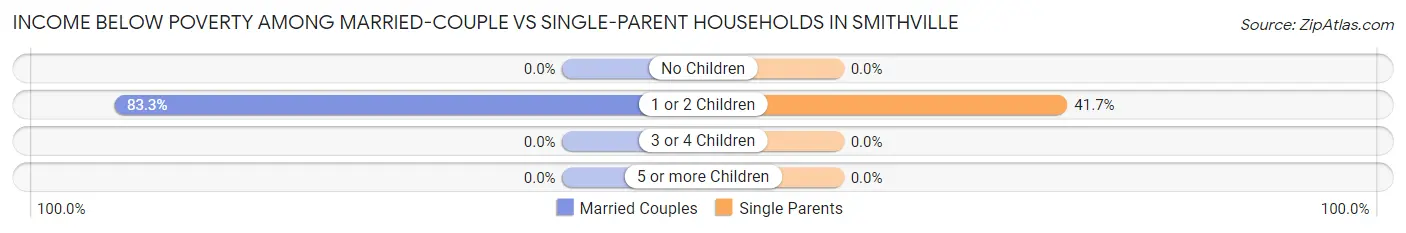
| Children | Married-Couple Families | Single-Parent Households |
| No Children | 0 (0.0%) | 0 (0.0%) |
| 1 or 2 Children | 5 (83.3%) | 5 (41.7%) |
| 3 or 4 Children | 0 (0.0%) | 0 (0.0%) |
| 5 or more Children | 0 (0.0%) | 0 (0.0%) |
| Total | 5 (35.7%) | 5 (33.3%) |
Employment Characteristics in Smithville
Employment by Class of Employer in Smithville
Among the 39 employed individuals in Smithville, private company employees (31 | 79.5%), self-employed (not incorporated) (3 | 7.7%), and not-for-profit organizations (2 | 5.1%) make up the most common classes of employment.
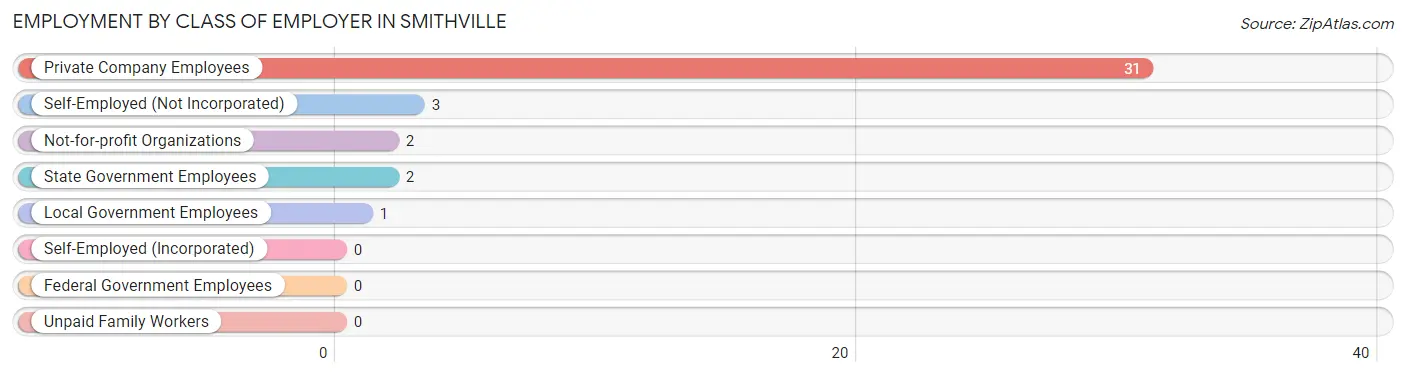
| Employer Class | # Employees | % Employees |
| Private Company Employees | 31 | 79.5% |
| Self-Employed (Incorporated) | 0 | 0.0% |
| Self-Employed (Not Incorporated) | 3 | 7.7% |
| Not-for-profit Organizations | 2 | 5.1% |
| Local Government Employees | 1 | 2.6% |
| State Government Employees | 2 | 5.1% |
| Federal Government Employees | 0 | 0.0% |
| Unpaid Family Workers | 0 | 0.0% |
| Total | 39 | 100.0% |
Employment Status by Age in Smithville
According to the labor force statistics for Smithville, out of the total population over 16 years of age (71), 57.7% or 41 individuals are in the labor force, with 4.9% or 2 of them unemployed. The age group with the highest labor force participation rate is 25 to 29 years, with 100.0% or 10 individuals in the labor force. Within the labor force, the 60 to 64 years age range has the highest percentage of unemployed individuals, with 66.7% or 2 of them being unemployed.
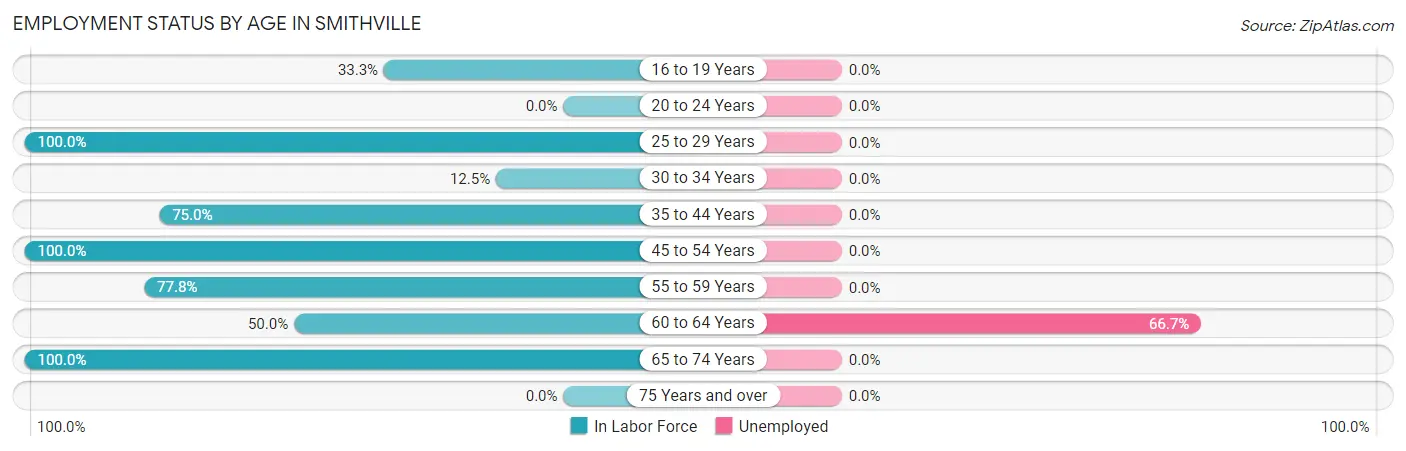
| Age Bracket | In Labor Force | Unemployed |
| 16 to 19 Years | 7 (33.3%) | 0 (0.0%) |
| 20 to 24 Years | 0 (0.0%) | 0 (0.0%) |
| 25 to 29 Years | 10 (100.0%) | 0 (0.0%) |
| 30 to 34 Years | 1 (12.5%) | 0 (0.0%) |
| 35 to 44 Years | 3 (75.0%) | 0 (0.0%) |
| 45 to 54 Years | 8 (100.0%) | 0 (0.0%) |
| 55 to 59 Years | 7 (77.8%) | 0 (0.0%) |
| 60 to 64 Years | 3 (50.0%) | 2 (66.7%) |
| 65 to 74 Years | 2 (100.0%) | 0 (0.0%) |
| 75 Years and over | 0 (0.0%) | 0 (0.0%) |
| Total | 41 (57.7%) | 2 (4.9%) |
Employment Status by Educational Attainment in Smithville
According to labor force statistics for Smithville, 71.1% of individuals (32) out of the total population between 25 and 64 years of age (45) are in the labor force, with 6.3% or 2 of them being unemployed. The group with the highest labor force participation rate are those with the educational attainment of college / associate degree, with 100.0% or 15 individuals in the labor force. Within the labor force, individuals with high school diploma education have the highest percentage of unemployment, with 13.3% or 2 of them being unemployed.
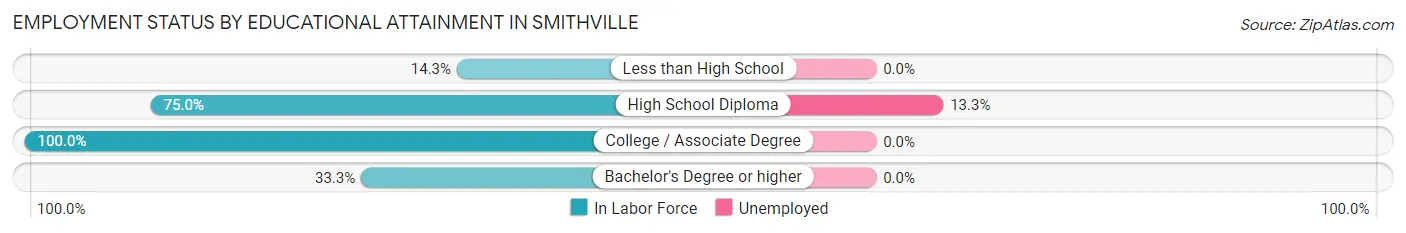
| Educational Attainment | In Labor Force | Unemployed |
| Less than High School | 1 (14.3%) | 0 (0.0%) |
| High School Diploma | 15 (75.0%) | 3 (13.3%) |
| College / Associate Degree | 15 (100.0%) | 0 (0.0%) |
| Bachelor's Degree or higher | 1 (33.3%) | 0 (0.0%) |
| Total | 32 (71.1%) | 3 (6.3%) |
Employment Occupations by Sex in Smithville
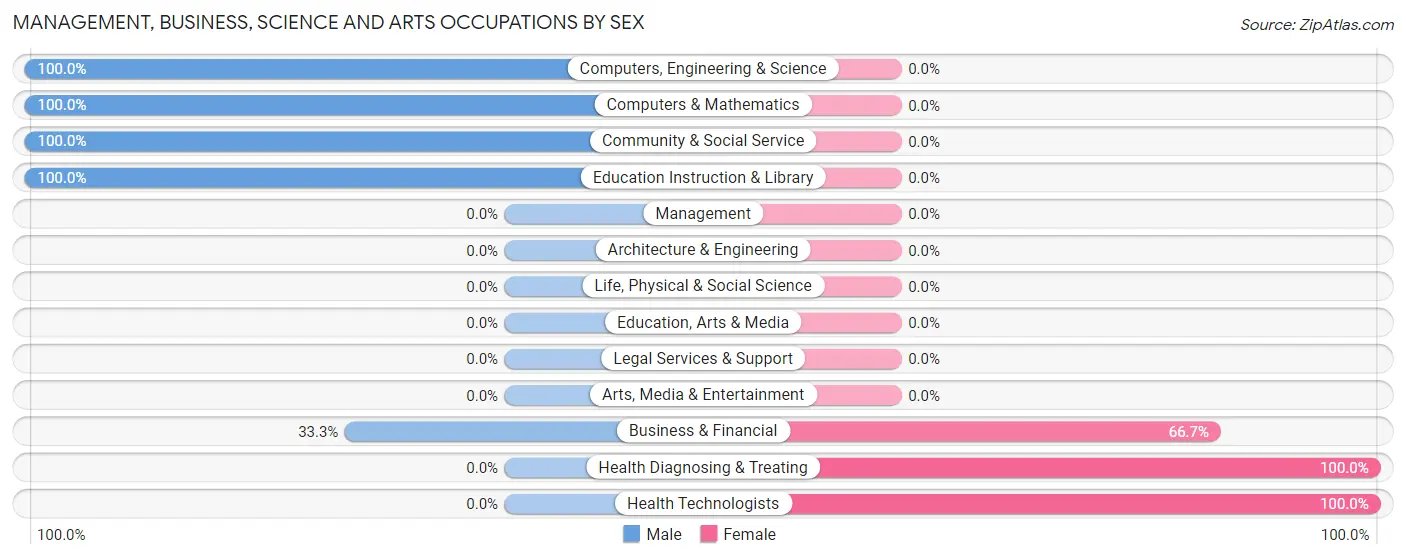
Management, Business, Science and Arts Occupations
The most common Management, Business, Science and Arts occupations in Smithville are Health Diagnosing & Treating (4 | 10.3%), Business & Financial (3 | 7.7%), Health Technologists (3 | 7.7%), Computers, Engineering & Science (2 | 5.1%), and Computers & Mathematics (2 | 5.1%).
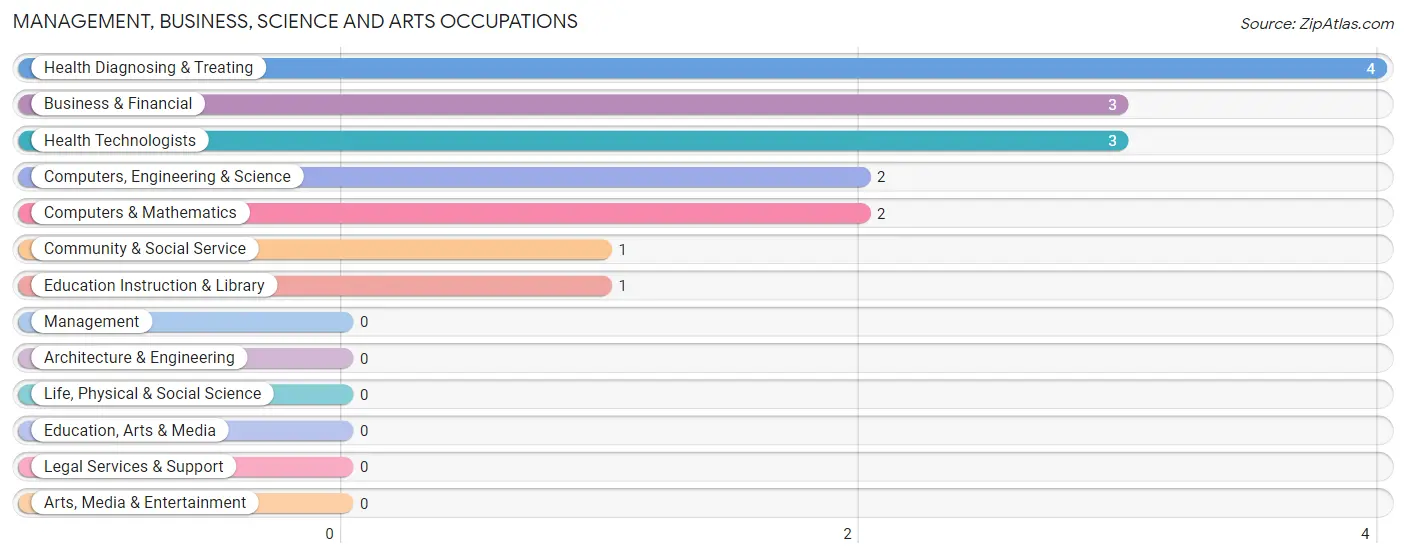
Management, Business, Science and Arts Occupations by Sex
Within the Management, Business, Science and Arts occupations in Smithville, the most male-oriented occupations are Computers, Engineering & Science (100.0%), Computers & Mathematics (100.0%), and Community & Social Service (100.0%), while the most female-oriented occupations are Health Diagnosing & Treating (100.0%), Health Technologists (100.0%), and Business & Financial (66.7%).
| Occupation | Male | Female |
| Management | 0 (0.0%) | 0 (0.0%) |
| Business & Financial | 1 (33.3%) | 2 (66.7%) |
| Computers, Engineering & Science | 2 (100.0%) | 0 (0.0%) |
| Computers & Mathematics | 2 (100.0%) | 0 (0.0%) |
| Architecture & Engineering | 0 (0.0%) | 0 (0.0%) |
| Life, Physical & Social Science | 0 (0.0%) | 0 (0.0%) |
| Community & Social Service | 1 (100.0%) | 0 (0.0%) |
| Education, Arts & Media | 0 (0.0%) | 0 (0.0%) |
| Legal Services & Support | 0 (0.0%) | 0 (0.0%) |
| Education Instruction & Library | 1 (100.0%) | 0 (0.0%) |
| Arts, Media & Entertainment | 0 (0.0%) | 0 (0.0%) |
| Health Diagnosing & Treating | 0 (0.0%) | 4 (100.0%) |
| Health Technologists | 0 (0.0%) | 3 (100.0%) |
| Total (Category) | 4 (40.0%) | 6 (60.0%) |
| Total (Overall) | 27 (69.2%) | 12 (30.8%) |
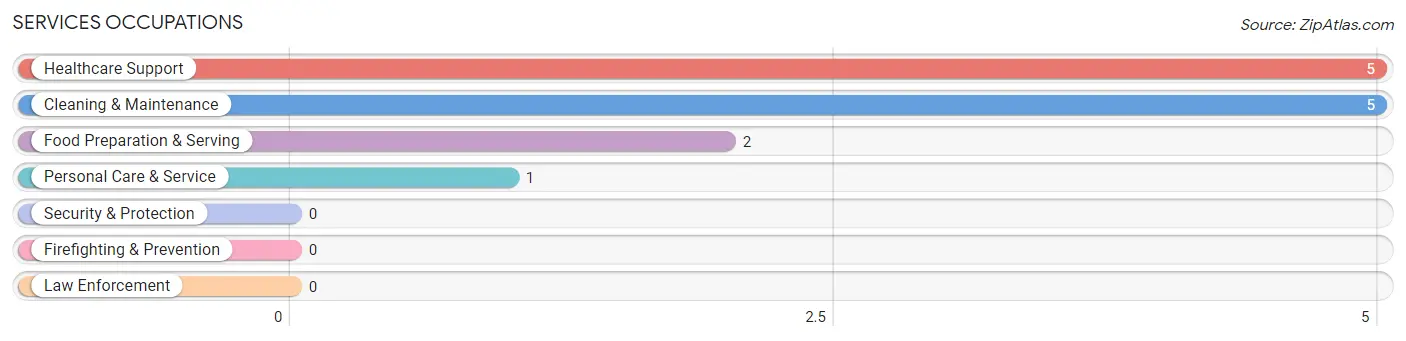
Services Occupations
The most common Services occupations in Smithville are Healthcare Support (5 | 12.8%), Cleaning & Maintenance (5 | 12.8%), Food Preparation & Serving (2 | 5.1%), and Personal Care & Service (1 | 2.6%).
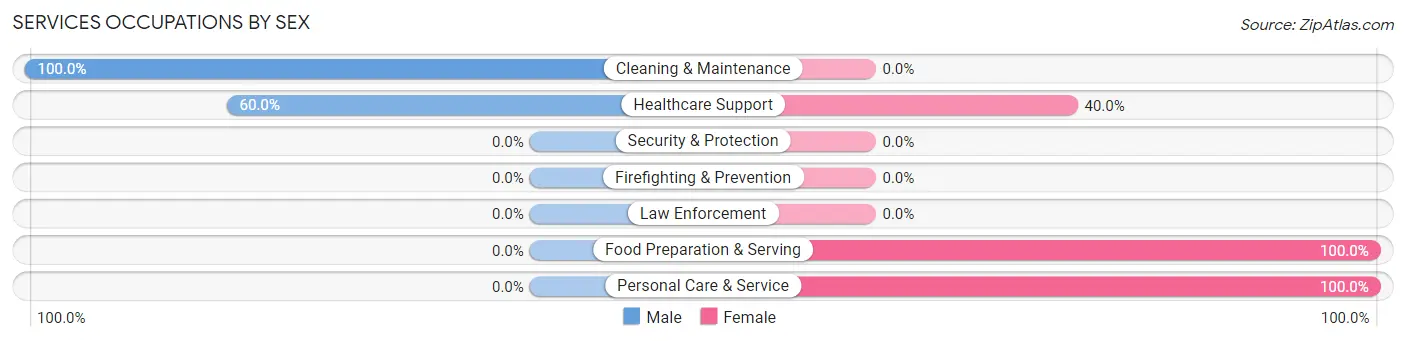
Services Occupations by Sex
Within the Services occupations in Smithville, the most male-oriented occupations are Cleaning & Maintenance (100.0%), and Healthcare Support (60.0%), while the most female-oriented occupations are Food Preparation & Serving (100.0%), Personal Care & Service (100.0%), and Healthcare Support (40.0%).
| Occupation | Male | Female |
| Healthcare Support | 3 (60.0%) | 2 (40.0%) |
| Security & Protection | 0 (0.0%) | 0 (0.0%) |
| Firefighting & Prevention | 0 (0.0%) | 0 (0.0%) |
| Law Enforcement | 0 (0.0%) | 0 (0.0%) |
| Food Preparation & Serving | 0 (0.0%) | 2 (100.0%) |
| Cleaning & Maintenance | 5 (100.0%) | 0 (0.0%) |
| Personal Care & Service | 0 (0.0%) | 1 (100.0%) |
| Total (Category) | 8 (61.5%) | 5 (38.5%) |
| Total (Overall) | 27 (69.2%) | 12 (30.8%) |
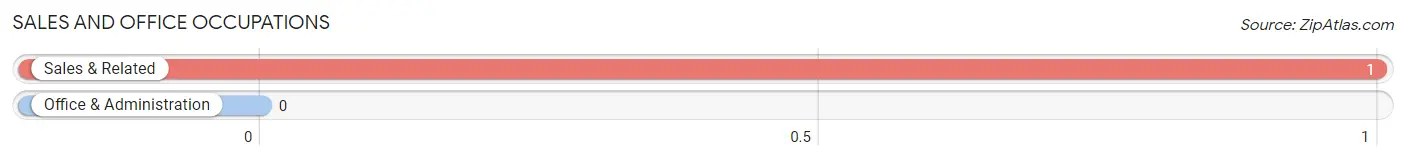
Sales and Office Occupations
The most common Sales and Office occupations in Smithville are , and Sales & Related (1 | 2.6%).
Sales and Office Occupations by Sex
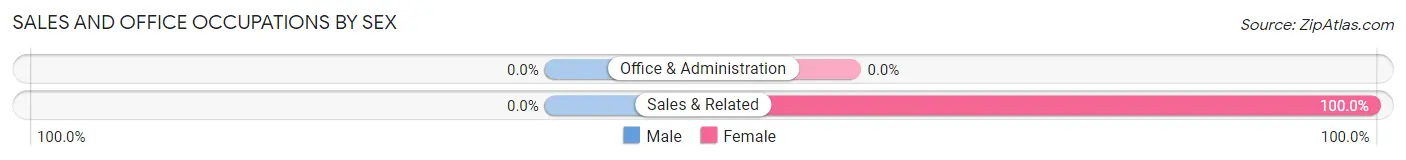
| Occupation | Male | Female |
| Sales & Related | 0 (0.0%) | 1 (100.0%) |
| Office & Administration | 0 (0.0%) | 0 (0.0%) |
| Total (Category) | 0 (0.0%) | 1 (100.0%) |
| Total (Overall) | 27 (69.2%) | 12 (30.8%) |
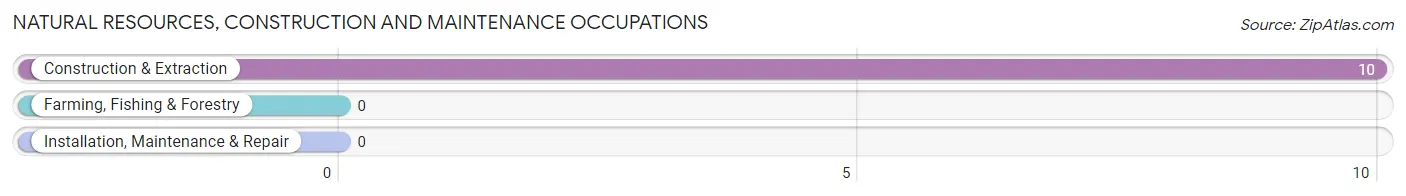
Natural Resources, Construction and Maintenance Occupations
The most common Natural Resources, Construction and Maintenance occupations in Smithville are , and Construction & Extraction (10 | 25.6%).
Natural Resources, Construction and Maintenance Occupations by Sex
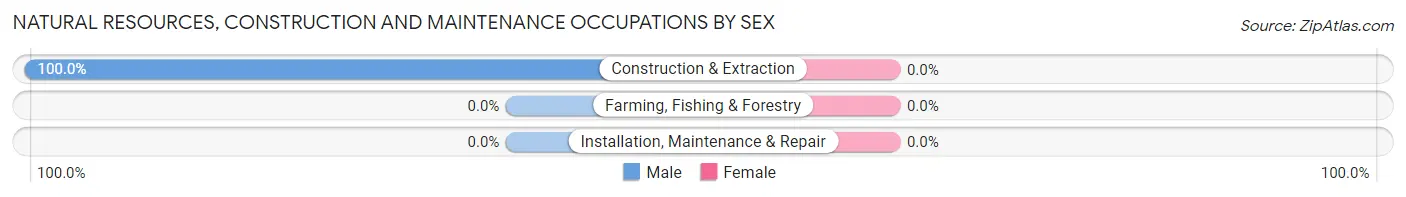
| Occupation | Male | Female |
| Farming, Fishing & Forestry | 0 (0.0%) | 0 (0.0%) |
| Construction & Extraction | 10 (100.0%) | 0 (0.0%) |
| Installation, Maintenance & Repair | 0 (0.0%) | 0 (0.0%) |
| Total (Category) | 10 (100.0%) | 0 (0.0%) |
| Total (Overall) | 27 (69.2%) | 12 (30.8%) |
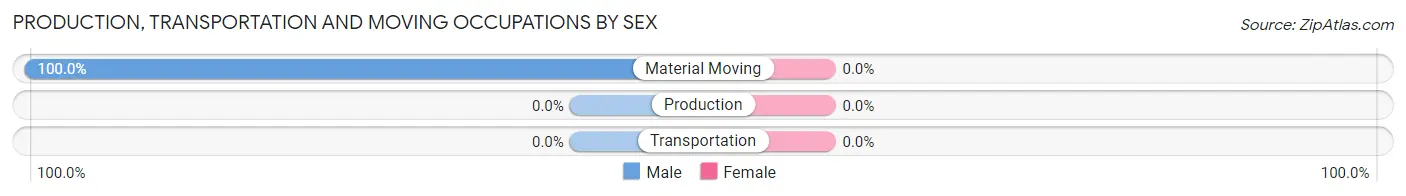
Production, Transportation and Moving Occupations
The most common Production, Transportation and Moving occupations in Smithville are , and Material Moving (5 | 12.8%).
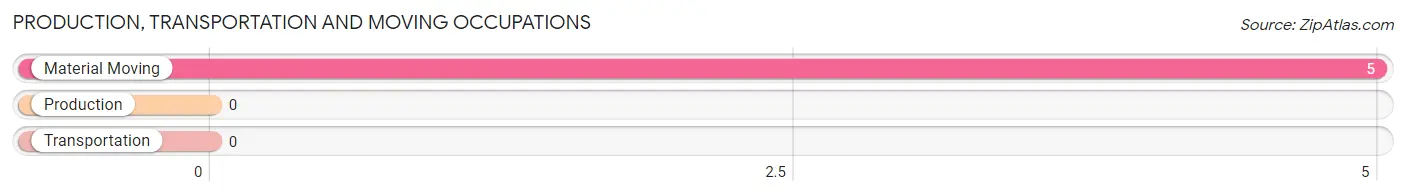
Production, Transportation and Moving Occupations by Sex
| Occupation | Male | Female |
| Production | 0 (0.0%) | 0 (0.0%) |
| Transportation | 0 (0.0%) | 0 (0.0%) |
| Material Moving | 5 (100.0%) | 0 (0.0%) |
| Total (Category) | 5 (100.0%) | 0 (0.0%) |
| Total (Overall) | 27 (69.2%) | 12 (30.8%) |
Employment Industries by Sex in Smithville
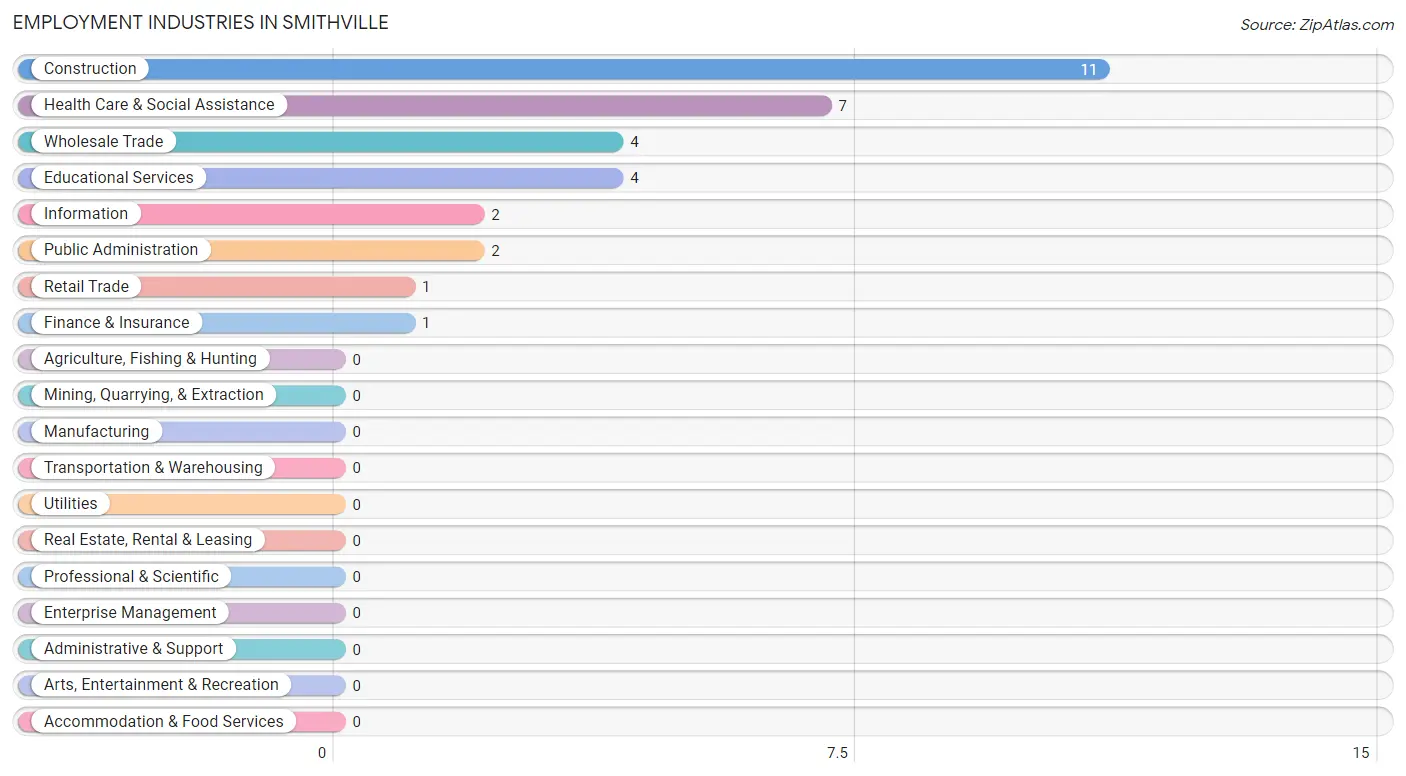
Employment Industries in Smithville
The major employment industries in Smithville include Construction (11 | 28.2%), Health Care & Social Assistance (7 | 17.9%), Wholesale Trade (4 | 10.3%), Educational Services (4 | 10.3%), and Information (2 | 5.1%).
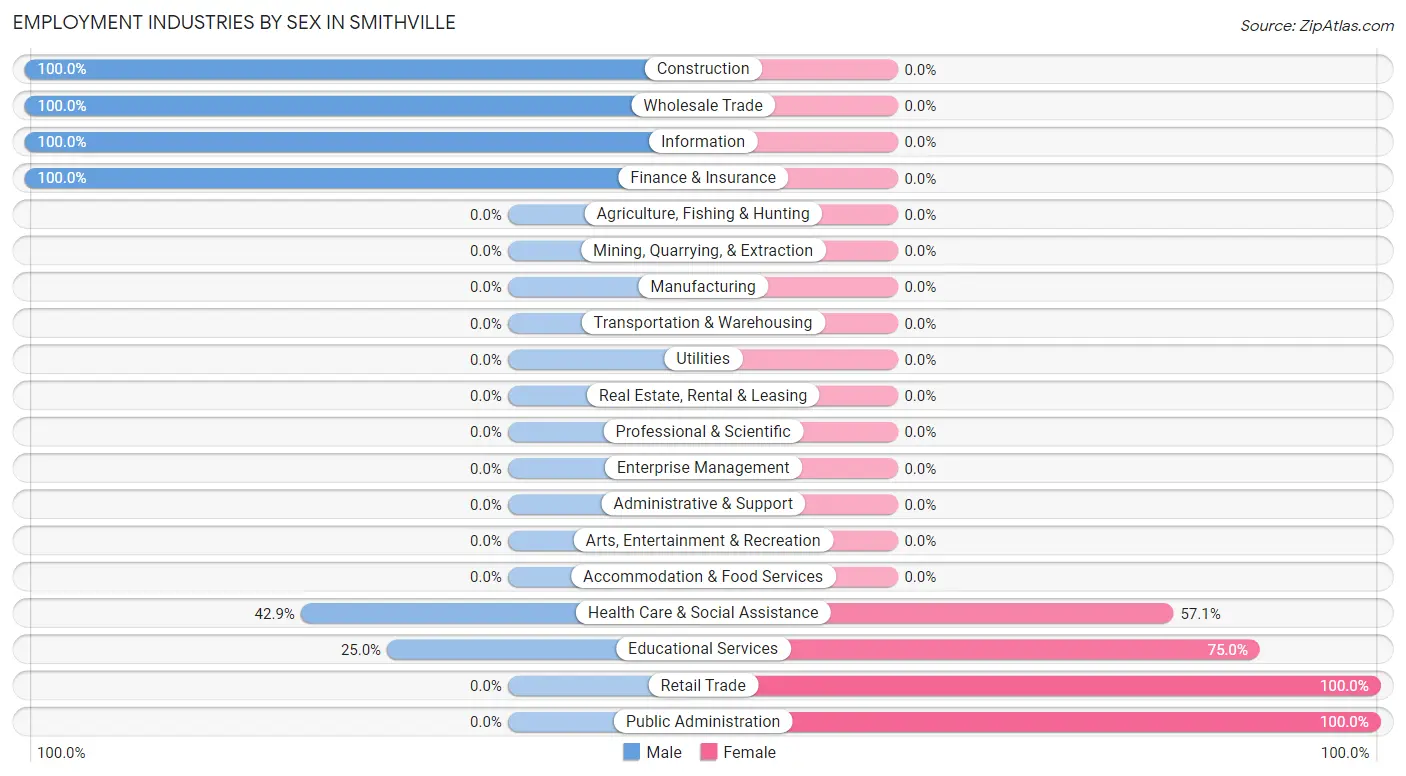
Employment Industries by Sex in Smithville
The Smithville industries that see more men than women are Construction (100.0%), Wholesale Trade (100.0%), and Information (100.0%), whereas the industries that tend to have a higher number of women are Retail Trade (100.0%), Public Administration (100.0%), and Educational Services (75.0%).
| Industry | Male | Female |
| Agriculture, Fishing & Hunting | 0 (0.0%) | 0 (0.0%) |
| Mining, Quarrying, & Extraction | 0 (0.0%) | 0 (0.0%) |
| Construction | 11 (100.0%) | 0 (0.0%) |
| Manufacturing | 0 (0.0%) | 0 (0.0%) |
| Wholesale Trade | 4 (100.0%) | 0 (0.0%) |
| Retail Trade | 0 (0.0%) | 1 (100.0%) |
| Transportation & Warehousing | 0 (0.0%) | 0 (0.0%) |
| Utilities | 0 (0.0%) | 0 (0.0%) |
| Information | 2 (100.0%) | 0 (0.0%) |
| Finance & Insurance | 1 (100.0%) | 0 (0.0%) |
| Real Estate, Rental & Leasing | 0 (0.0%) | 0 (0.0%) |
| Professional & Scientific | 0 (0.0%) | 0 (0.0%) |
| Enterprise Management | 0 (0.0%) | 0 (0.0%) |
| Administrative & Support | 0 (0.0%) | 0 (0.0%) |
| Educational Services | 1 (25.0%) | 3 (75.0%) |
| Health Care & Social Assistance | 3 (42.9%) | 4 (57.1%) |
| Arts, Entertainment & Recreation | 0 (0.0%) | 0 (0.0%) |
| Accommodation & Food Services | 0 (0.0%) | 0 (0.0%) |
| Public Administration | 0 (0.0%) | 2 (100.0%) |
| Total | 27 (69.2%) | 12 (30.8%) |
Education in Smithville
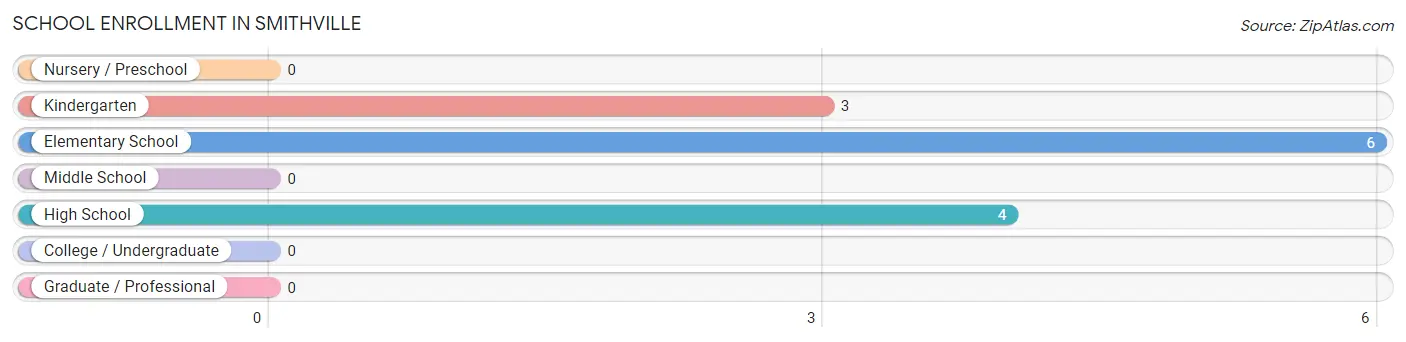
School Enrollment in Smithville
The most common levels of schooling among the 13 students in Smithville are elementary school (6 | 46.2%), high school (4 | 30.8%), and kindergarten (3 | 23.1%).
| School Level | # Students | % Students |
| Nursery / Preschool | 0 | 0.0% |
| Kindergarten | 3 | 23.1% |
| Elementary School | 6 | 46.2% |
| Middle School | 0 | 0.0% |
| High School | 4 | 30.8% |
| College / Undergraduate | 0 | 0.0% |
| Graduate / Professional | 0 | 0.0% |
| Total | 13 | 100.0% |
School Enrollment by Age by Funding Source in Smithville
Out of a total of 13 students who are enrolled in schools in Smithville, 2 (15.4%) attend a private institution, while the remaining 11 (84.6%) are enrolled in public schools. The age group of 5 to 9 year old has the highest likelihood of being enrolled in private schools, with 2 (28.6% in the age bracket) enrolled. Conversely, the age group of 10 to 14 year olds has the lowest likelihood of being enrolled in a private school, with 2 (100.0% in the age bracket) attending a public institution.
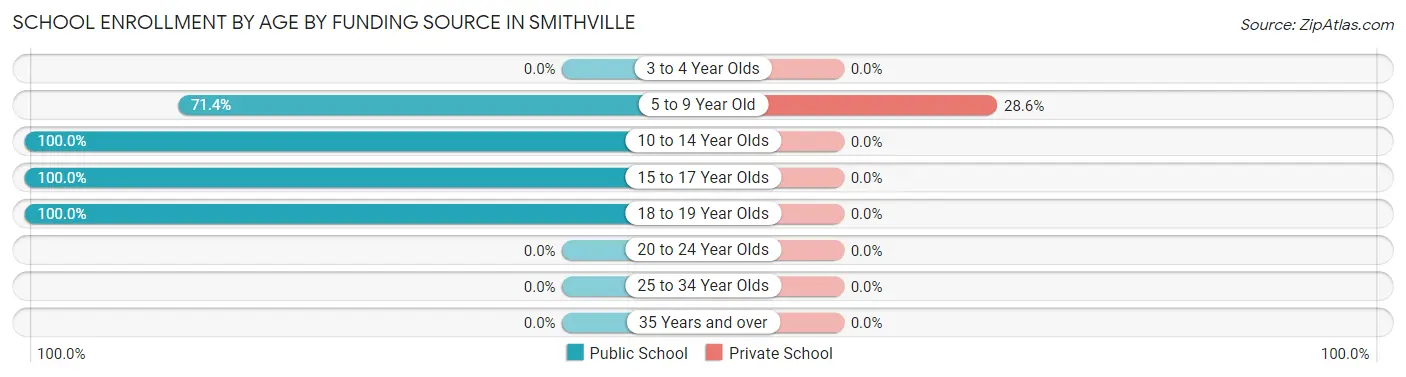
| Age Bracket | Public School | Private School |
| 3 to 4 Year Olds | 0 (0.0%) | 0 (0.0%) |
| 5 to 9 Year Old | 5 (71.4%) | 2 (28.6%) |
| 10 to 14 Year Olds | 2 (100.0%) | 0 (0.0%) |
| 15 to 17 Year Olds | 1 (100.0%) | 0 (0.0%) |
| 18 to 19 Year Olds | 3 (100.0%) | 0 (0.0%) |
| 20 to 24 Year Olds | 0 (0.0%) | 0 (0.0%) |
| 25 to 34 Year Olds | 0 (0.0%) | 0 (0.0%) |
| 35 Years and over | 0 (0.0%) | 0 (0.0%) |
| Total | 11 (84.6%) | 2 (15.4%) |
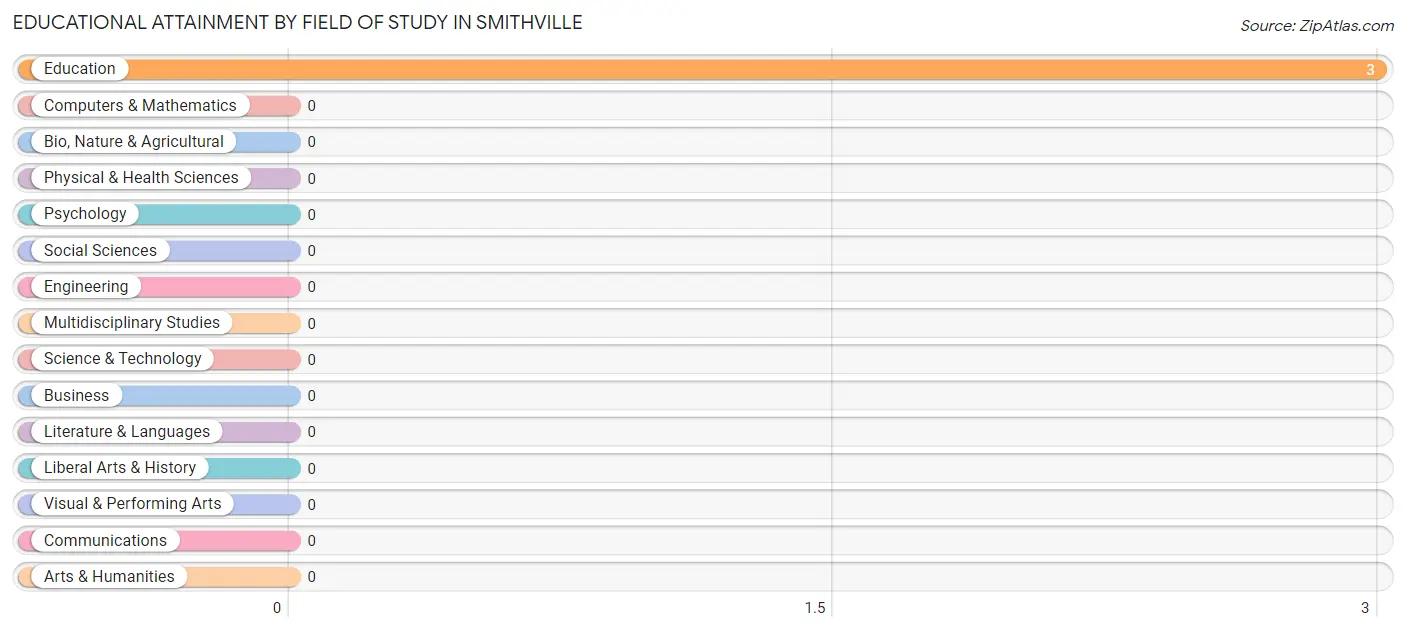
Educational Attainment by Field of Study in Smithville
, and education (3 | 100.0%) are the most common fields of study among 3 individuals in Smithville who have obtained a bachelor's degree or higher.
| Field of Study | # Graduates | % Graduates |
| Computers & Mathematics | 0 | 0.0% |
| Bio, Nature & Agricultural | 0 | 0.0% |
| Physical & Health Sciences | 0 | 0.0% |
| Psychology | 0 | 0.0% |
| Social Sciences | 0 | 0.0% |
| Engineering | 0 | 0.0% |
| Multidisciplinary Studies | 0 | 0.0% |
| Science & Technology | 0 | 0.0% |
| Business | 0 | 0.0% |
| Education | 3 | 100.0% |
| Literature & Languages | 0 | 0.0% |
| Liberal Arts & History | 0 | 0.0% |
| Visual & Performing Arts | 0 | 0.0% |
| Communications | 0 | 0.0% |
| Arts & Humanities | 0 | 0.0% |
| Total | 3 | 100.0% |
Transportation & Commute in Smithville
Vehicle Availability by Sex in Smithville
The most prevalent vehicle ownership categories in Smithville are males with 2 vehicles (13, accounting for 48.1%) and females with 2 vehicles (5, making up 108.3%).
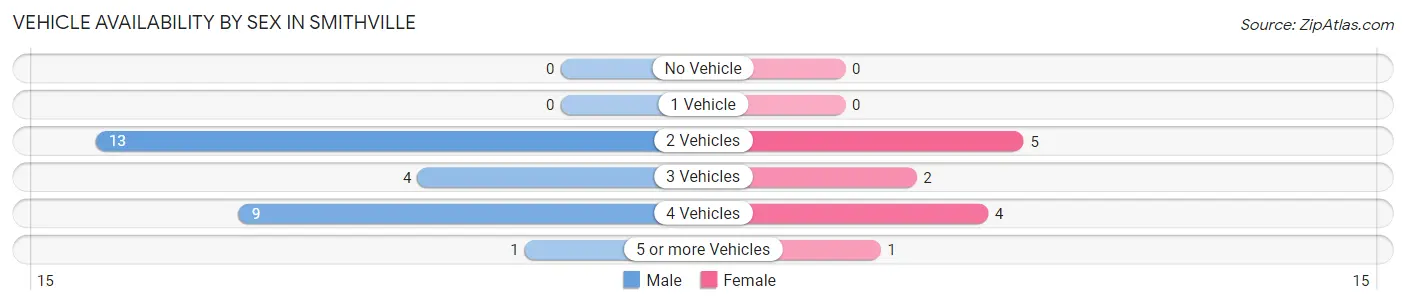
| Vehicles Available | Male | Female |
| No Vehicle | 0 (0.0%) | 0 (0.0%) |
| 1 Vehicle | 0 (0.0%) | 0 (0.0%) |
| 2 Vehicles | 13 (48.1%) | 5 (41.7%) |
| 3 Vehicles | 4 (14.8%) | 2 (16.7%) |
| 4 Vehicles | 9 (33.3%) | 4 (33.3%) |
| 5 or more Vehicles | 1 (3.7%) | 1 (8.3%) |
| Total | 27 (100.0%) | 12 (100.0%) |
Commute Time in Smithville
The most frequently occuring commute durations in Smithville are 60 to 89 minutes (12 commuters, 30.8%), 40 to 44 minutes (9 commuters, 23.1%), and 10 to 14 minutes (4 commuters, 10.3%).
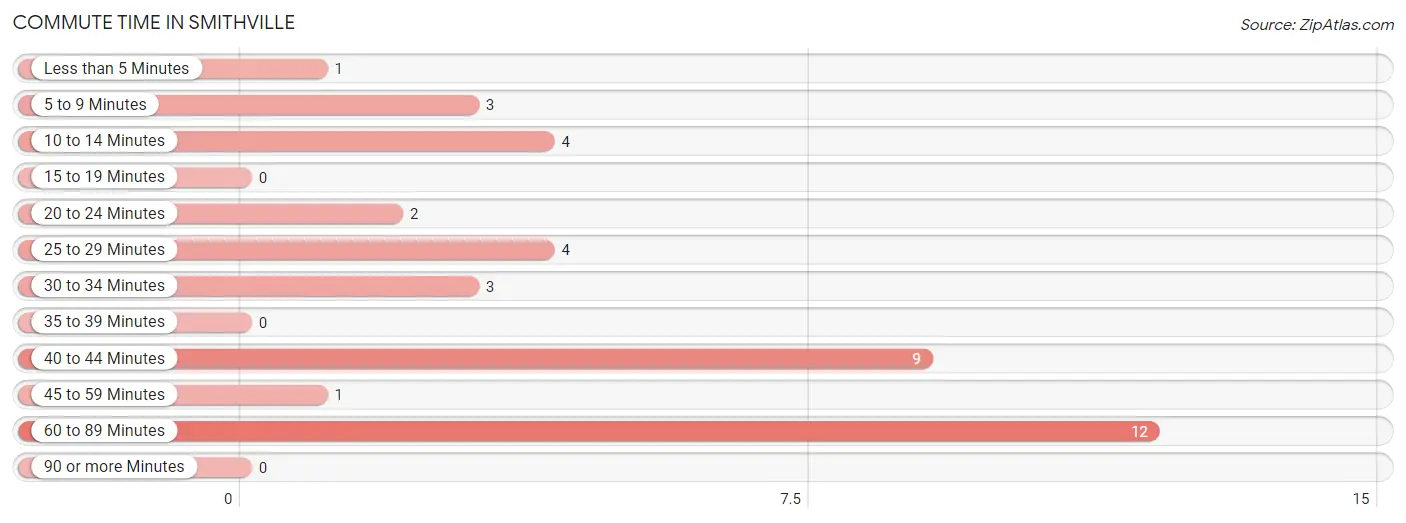
| Commute Time | # Commuters | % Commuters |
| Less than 5 Minutes | 1 | 2.6% |
| 5 to 9 Minutes | 3 | 7.7% |
| 10 to 14 Minutes | 4 | 10.3% |
| 15 to 19 Minutes | 0 | 0.0% |
| 20 to 24 Minutes | 2 | 5.1% |
| 25 to 29 Minutes | 4 | 10.3% |
| 30 to 34 Minutes | 3 | 7.7% |
| 35 to 39 Minutes | 0 | 0.0% |
| 40 to 44 Minutes | 9 | 23.1% |
| 45 to 59 Minutes | 1 | 2.6% |
| 60 to 89 Minutes | 12 | 30.8% |
| 90 or more Minutes | 0 | 0.0% |
Commute Time by Sex in Smithville
The most common commute times in Smithville are 40 to 44 minutes (9 commuters, 33.3%) for males and 10 to 14 minutes (4 commuters, 33.3%) for females.
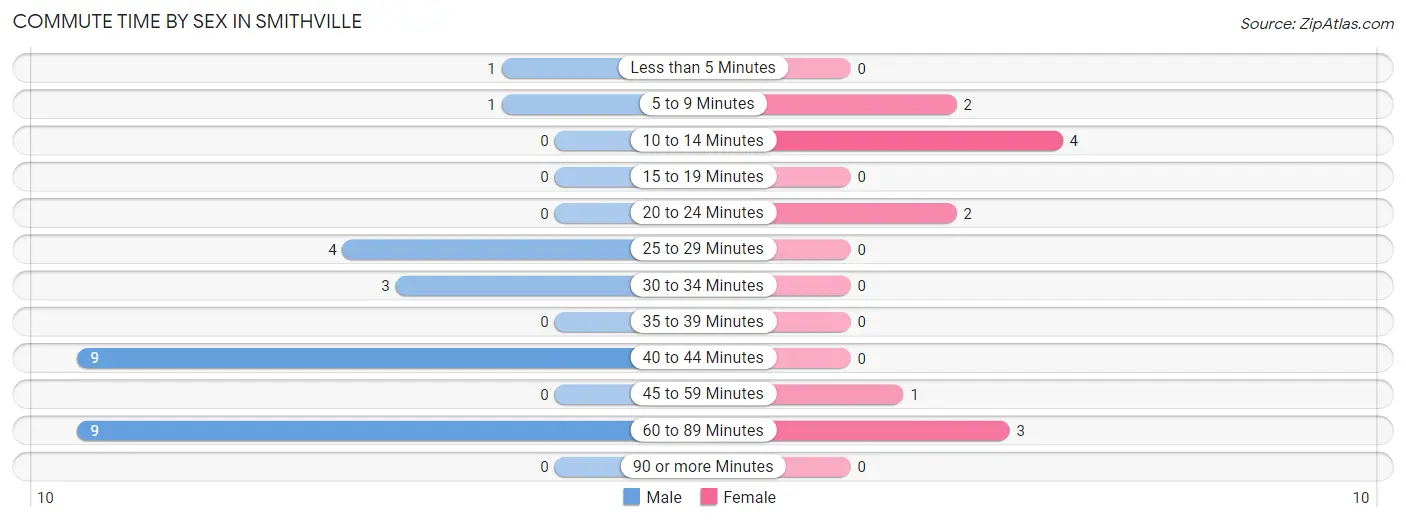
| Commute Time | Male | Female |
| Less than 5 Minutes | 1 (3.7%) | 0 (0.0%) |
| 5 to 9 Minutes | 1 (3.7%) | 2 (16.7%) |
| 10 to 14 Minutes | 0 (0.0%) | 4 (33.3%) |
| 15 to 19 Minutes | 0 (0.0%) | 0 (0.0%) |
| 20 to 24 Minutes | 0 (0.0%) | 2 (16.7%) |
| 25 to 29 Minutes | 4 (14.8%) | 0 (0.0%) |
| 30 to 34 Minutes | 3 (11.1%) | 0 (0.0%) |
| 35 to 39 Minutes | 0 (0.0%) | 0 (0.0%) |
| 40 to 44 Minutes | 9 (33.3%) | 0 (0.0%) |
| 45 to 59 Minutes | 0 (0.0%) | 1 (8.3%) |
| 60 to 89 Minutes | 9 (33.3%) | 3 (25.0%) |
| 90 or more Minutes | 0 (0.0%) | 0 (0.0%) |
Time of Departure to Work by Sex in Smithville
The most frequent times of departure to work in Smithville are 5:30 AM to 5:59 AM (9, 33.3%) for males and 7:30 AM to 7:59 AM (4, 33.3%) for females.
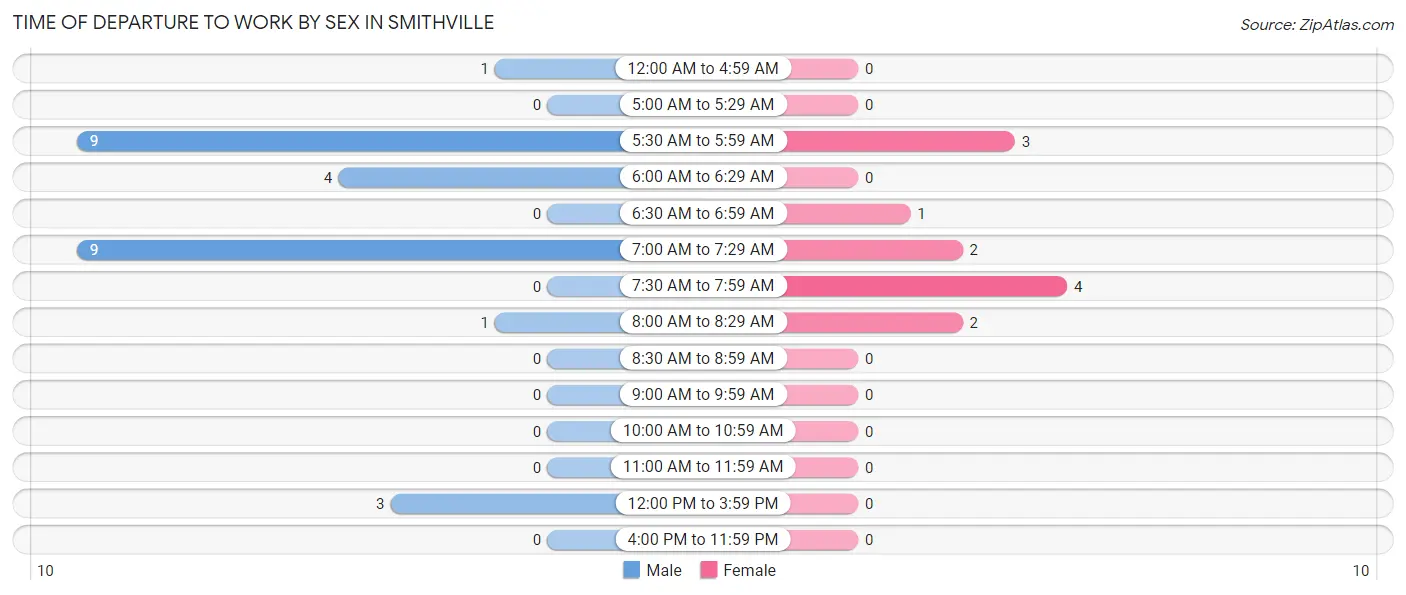
| Time of Departure | Male | Female |
| 12:00 AM to 4:59 AM | 1 (3.7%) | 0 (0.0%) |
| 5:00 AM to 5:29 AM | 0 (0.0%) | 0 (0.0%) |
| 5:30 AM to 5:59 AM | 9 (33.3%) | 3 (25.0%) |
| 6:00 AM to 6:29 AM | 4 (14.8%) | 0 (0.0%) |
| 6:30 AM to 6:59 AM | 0 (0.0%) | 1 (8.3%) |
| 7:00 AM to 7:29 AM | 9 (33.3%) | 2 (16.7%) |
| 7:30 AM to 7:59 AM | 0 (0.0%) | 4 (33.3%) |
| 8:00 AM to 8:29 AM | 1 (3.7%) | 2 (16.7%) |
| 8:30 AM to 8:59 AM | 0 (0.0%) | 0 (0.0%) |
| 9:00 AM to 9:59 AM | 0 (0.0%) | 0 (0.0%) |
| 10:00 AM to 10:59 AM | 0 (0.0%) | 0 (0.0%) |
| 11:00 AM to 11:59 AM | 0 (0.0%) | 0 (0.0%) |
| 12:00 PM to 3:59 PM | 3 (11.1%) | 0 (0.0%) |
| 4:00 PM to 11:59 PM | 0 (0.0%) | 0 (0.0%) |
| Total | 27 (100.0%) | 12 (100.0%) |
Housing Occupancy in Smithville
Occupancy by Ownership in Smithville
Of the total 32 dwellings in Smithville, owner-occupied units account for 20 (62.5%), while renter-occupied units make up 12 (37.5%).
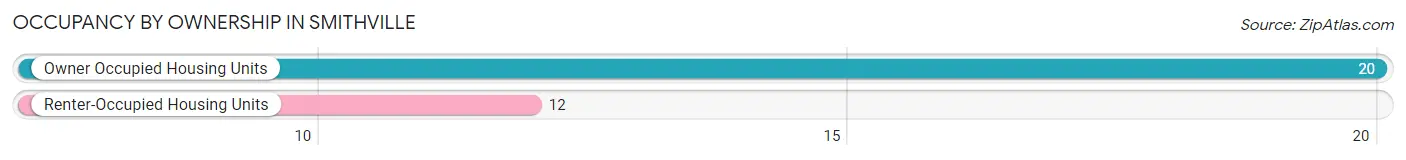
| Occupancy | # Housing Units | % Housing Units |
| Owner Occupied Housing Units | 20 | 62.5% |
| Renter-Occupied Housing Units | 12 | 37.5% |
| Total Occupied Housing Units | 32 | 100.0% |
Occupancy by Household Size in Smithville
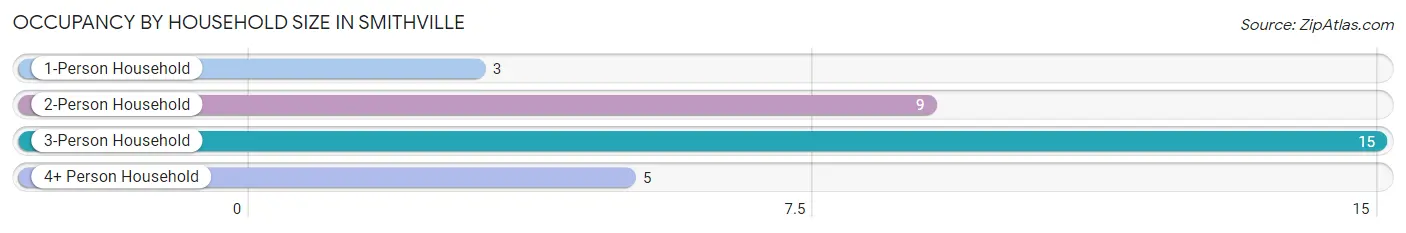
| Household Size | # Housing Units | % Housing Units |
| 1-Person Household | 3 | 9.4% |
| 2-Person Household | 9 | 28.1% |
| 3-Person Household | 15 | 46.9% |
| 4+ Person Household | 5 | 15.6% |
| Total Housing Units | 32 | 100.0% |
Occupancy by Ownership by Household Size in Smithville
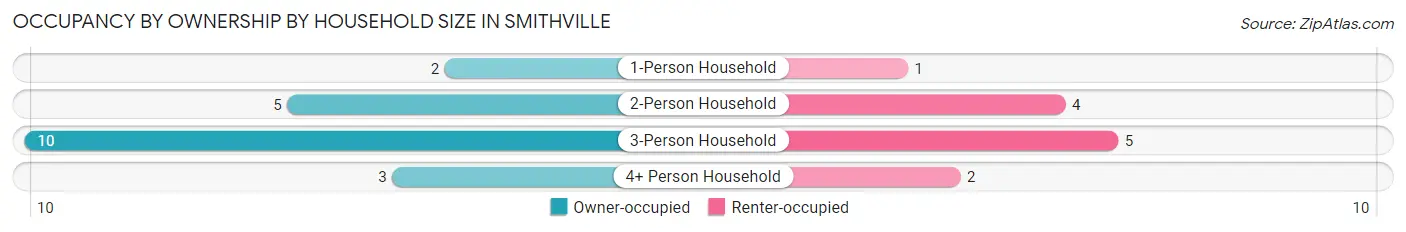
| Household Size | Owner-occupied | Renter-occupied |
| 1-Person Household | 2 (66.7%) | 1 (33.3%) |
| 2-Person Household | 5 (55.6%) | 4 (44.4%) |
| 3-Person Household | 10 (66.7%) | 5 (33.3%) |
| 4+ Person Household | 3 (60.0%) | 2 (40.0%) |
| Total Housing Units | 20 (62.5%) | 12 (37.5%) |
Occupancy by Educational Attainment in Smithville
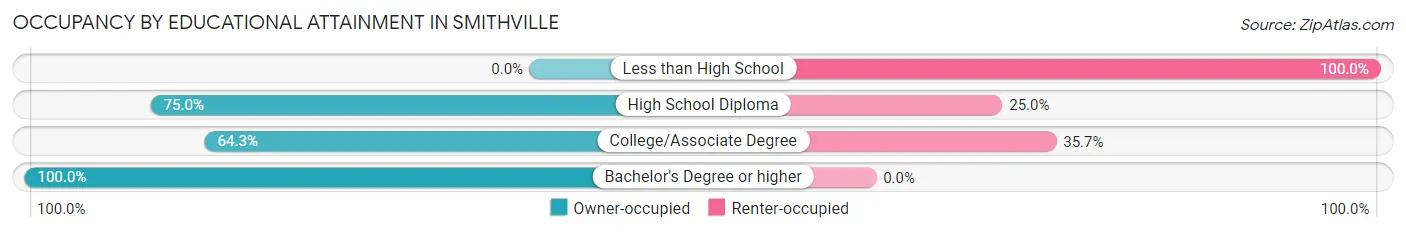
| Household Size | Owner-occupied | Renter-occupied |
| Less than High School | 0 (0.0%) | 4 (100.0%) |
| High School Diploma | 9 (75.0%) | 3 (25.0%) |
| College/Associate Degree | 9 (64.3%) | 5 (35.7%) |
| Bachelor's Degree or higher | 2 (100.0%) | 0 (0.0%) |
Occupancy by Age of Householder in Smithville
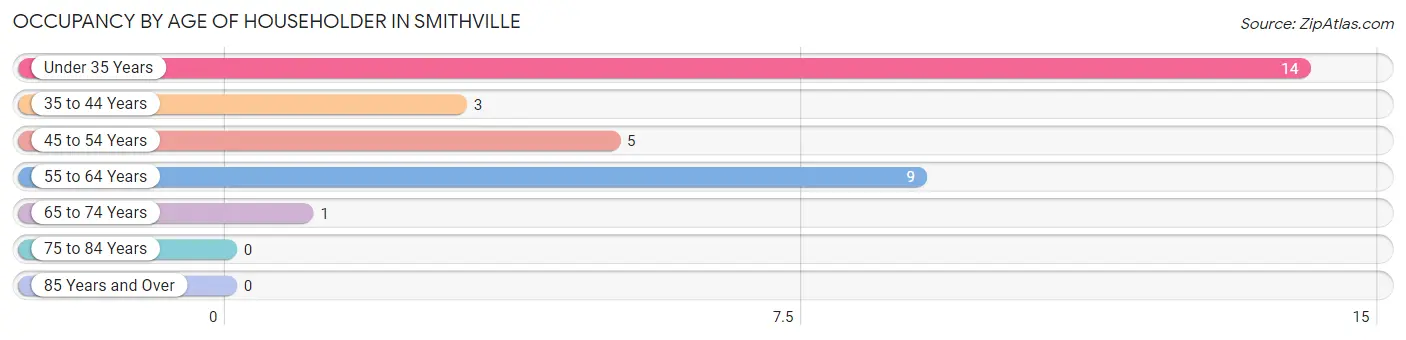
| Age Bracket | # Households | % Households |
| Under 35 Years | 14 | 43.8% |
| 35 to 44 Years | 3 | 9.4% |
| 45 to 54 Years | 5 | 15.6% |
| 55 to 64 Years | 9 | 28.1% |
| 65 to 74 Years | 1 | 3.1% |
| 75 to 84 Years | 0 | 0.0% |
| 85 Years and Over | 0 | 0.0% |
| Total | 32 | 100.0% |
Housing Finances in Smithville
Median Income by Occupancy in Smithville
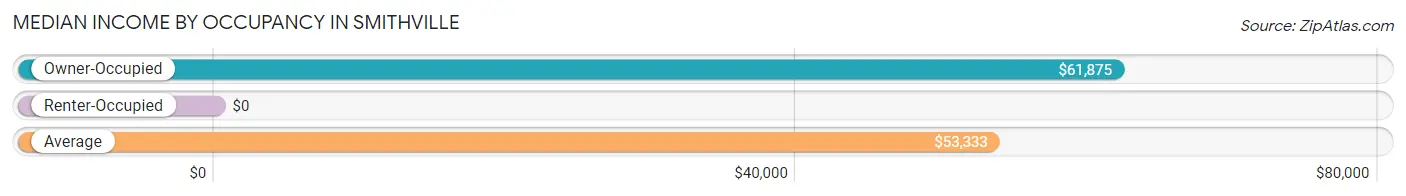
| Occupancy Type | # Households | Median Income |
| Owner-Occupied | 20 (62.5%) | $61,875 |
| Renter-Occupied | 12 (37.5%) | $0 |
| Average | 32 (100.0%) | $53,333 |
Occupancy by Householder Income Bracket in Smithville
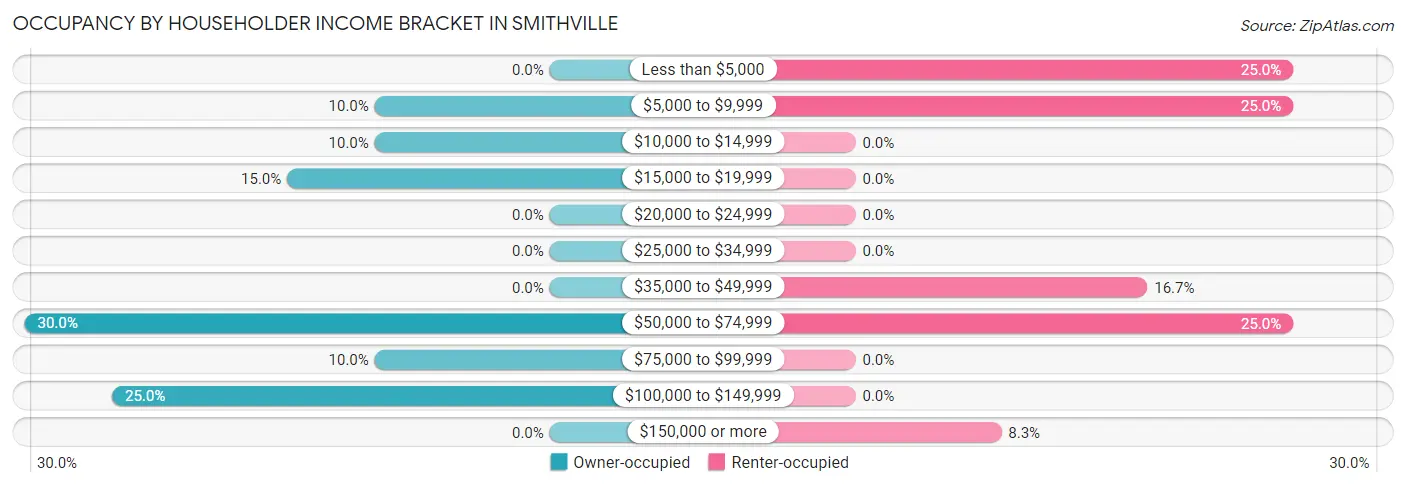
| Income Bracket | Owner-occupied | Renter-occupied |
| Less than $5,000 | 0 (0.0%) | 3 (25.0%) |
| $5,000 to $9,999 | 2 (10.0%) | 3 (25.0%) |
| $10,000 to $14,999 | 2 (10.0%) | 0 (0.0%) |
| $15,000 to $19,999 | 3 (15.0%) | 0 (0.0%) |
| $20,000 to $24,999 | 0 (0.0%) | 0 (0.0%) |
| $25,000 to $34,999 | 0 (0.0%) | 0 (0.0%) |
| $35,000 to $49,999 | 0 (0.0%) | 2 (16.7%) |
| $50,000 to $74,999 | 6 (30.0%) | 3 (25.0%) |
| $75,000 to $99,999 | 2 (10.0%) | 0 (0.0%) |
| $100,000 to $149,999 | 5 (25.0%) | 0 (0.0%) |
| $150,000 or more | 0 (0.0%) | 1 (8.3%) |
| Total | 20 (100.0%) | 12 (100.0%) |
Monthly Housing Cost Tiers in Smithville
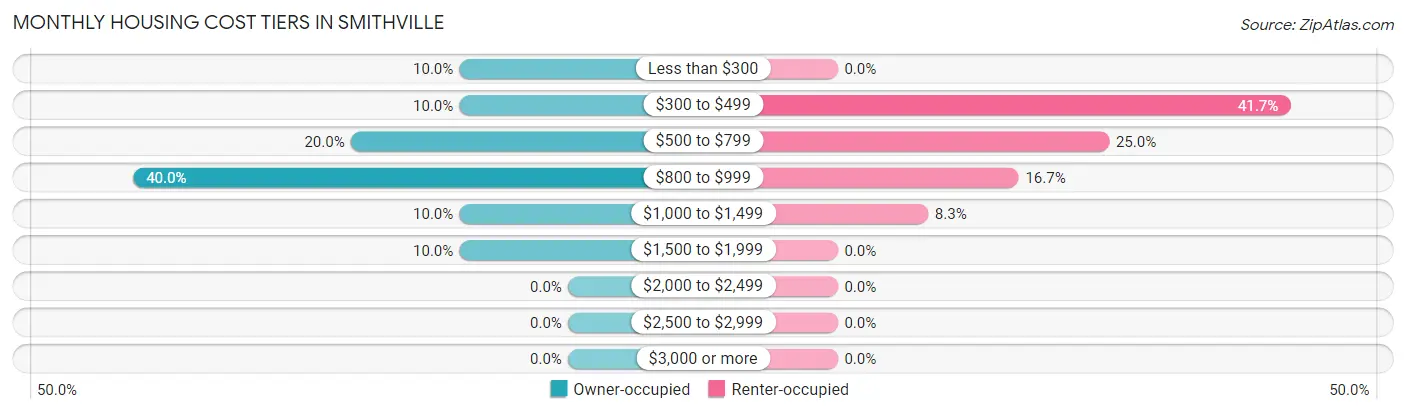
| Monthly Cost | Owner-occupied | Renter-occupied |
| Less than $300 | 2 (10.0%) | 0 (0.0%) |
| $300 to $499 | 2 (10.0%) | 5 (41.7%) |
| $500 to $799 | 4 (20.0%) | 3 (25.0%) |
| $800 to $999 | 8 (40.0%) | 2 (16.7%) |
| $1,000 to $1,499 | 2 (10.0%) | 1 (8.3%) |
| $1,500 to $1,999 | 2 (10.0%) | 0 (0.0%) |
| $2,000 to $2,499 | 0 (0.0%) | 0 (0.0%) |
| $2,500 to $2,999 | 0 (0.0%) | 0 (0.0%) |
| $3,000 or more | 0 (0.0%) | 0 (0.0%) |
| Total | 20 (100.0%) | 12 (100.0%) |
Physical Housing Characteristics in Smithville
Housing Structures in Smithville
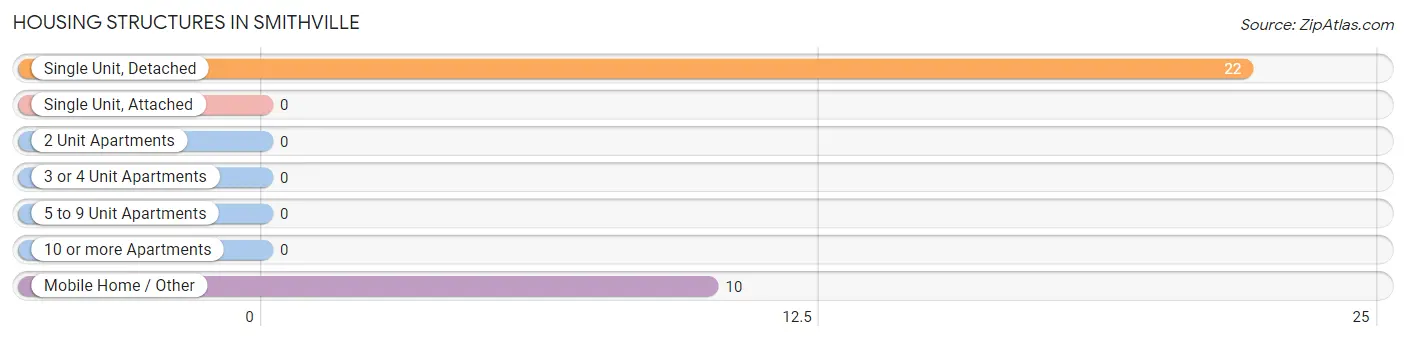
| Structure Type | # Housing Units | % Housing Units |
| Single Unit, Detached | 22 | 68.8% |
| Single Unit, Attached | 0 | 0.0% |
| 2 Unit Apartments | 0 | 0.0% |
| 3 or 4 Unit Apartments | 0 | 0.0% |
| 5 to 9 Unit Apartments | 0 | 0.0% |
| 10 or more Apartments | 0 | 0.0% |
| Mobile Home / Other | 10 | 31.2% |
| Total | 32 | 100.0% |
Housing Structures by Occupancy in Smithville
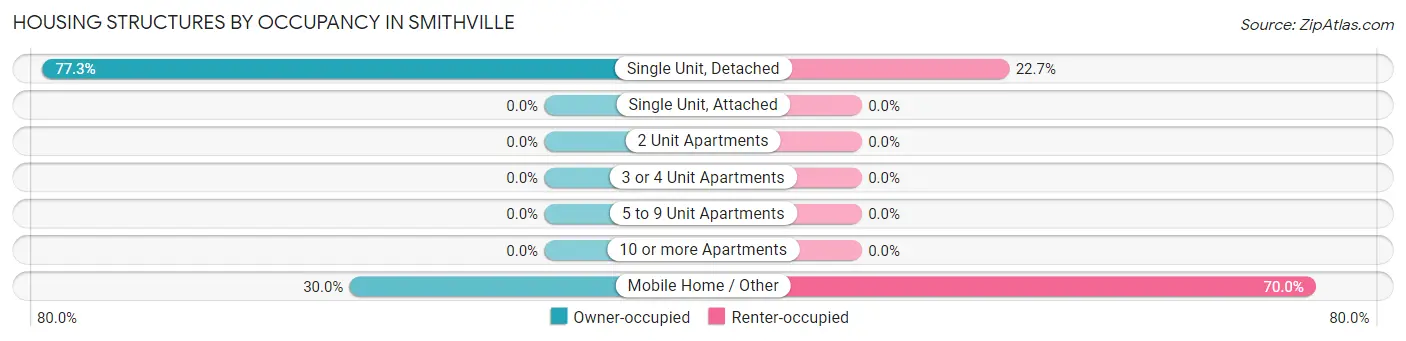
| Structure Type | Owner-occupied | Renter-occupied |
| Single Unit, Detached | 17 (77.3%) | 5 (22.7%) |
| Single Unit, Attached | 0 (0.0%) | 0 (0.0%) |
| 2 Unit Apartments | 0 (0.0%) | 0 (0.0%) |
| 3 or 4 Unit Apartments | 0 (0.0%) | 0 (0.0%) |
| 5 to 9 Unit Apartments | 0 (0.0%) | 0 (0.0%) |
| 10 or more Apartments | 0 (0.0%) | 0 (0.0%) |
| Mobile Home / Other | 3 (30.0%) | 7 (70.0%) |
| Total | 20 (62.5%) | 12 (37.5%) |
Housing Structures by Number of Rooms in Smithville
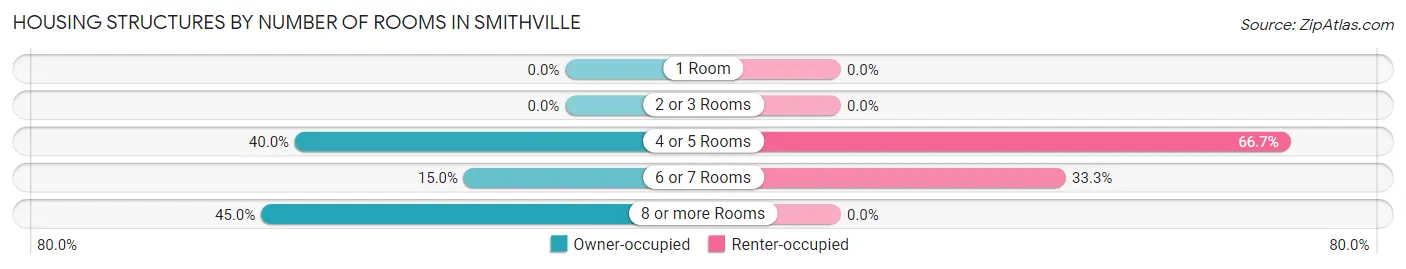
| Number of Rooms | Owner-occupied | Renter-occupied |
| 1 Room | 0 (0.0%) | 0 (0.0%) |
| 2 or 3 Rooms | 0 (0.0%) | 0 (0.0%) |
| 4 or 5 Rooms | 8 (40.0%) | 8 (66.7%) |
| 6 or 7 Rooms | 3 (15.0%) | 4 (33.3%) |
| 8 or more Rooms | 9 (45.0%) | 0 (0.0%) |
| Total | 20 (100.0%) | 12 (100.0%) |
Housing Structure by Heating Type in Smithville
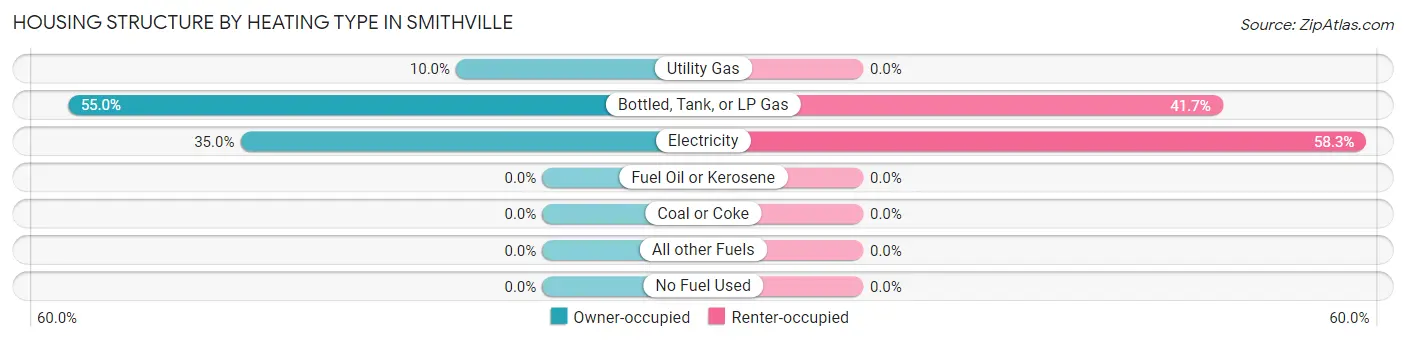
| Heating Type | Owner-occupied | Renter-occupied |
| Utility Gas | 2 (10.0%) | 0 (0.0%) |
| Bottled, Tank, or LP Gas | 11 (55.0%) | 5 (41.7%) |
| Electricity | 7 (35.0%) | 7 (58.3%) |
| Fuel Oil or Kerosene | 0 (0.0%) | 0 (0.0%) |
| Coal or Coke | 0 (0.0%) | 0 (0.0%) |
| All other Fuels | 0 (0.0%) | 0 (0.0%) |
| No Fuel Used | 0 (0.0%) | 0 (0.0%) |
| Total | 20 (100.0%) | 12 (100.0%) |
Household Vehicle Usage in Smithville
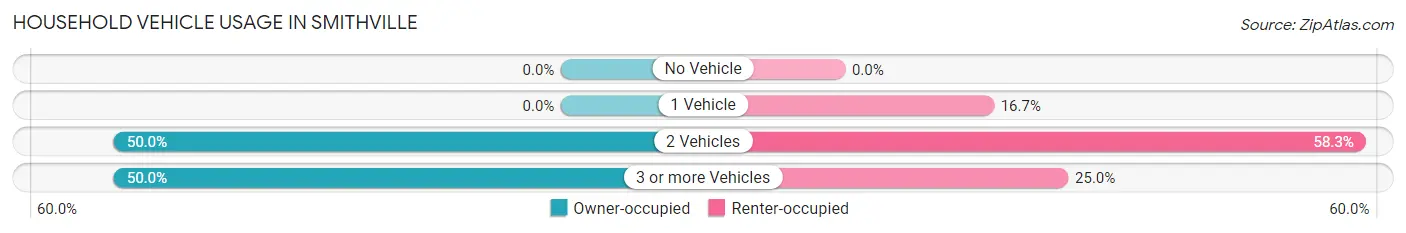
| Vehicles per Household | Owner-occupied | Renter-occupied |
| No Vehicle | 0 (0.0%) | 0 (0.0%) |
| 1 Vehicle | 0 (0.0%) | 2 (16.7%) |
| 2 Vehicles | 10 (50.0%) | 7 (58.3%) |
| 3 or more Vehicles | 10 (50.0%) | 3 (25.0%) |
| Total | 20 (100.0%) | 12 (100.0%) |
Real Estate & Mortgages in Smithville
Real Estate and Mortgage Overview in Smithville
| Characteristic | Without Mortgage | With Mortgage |
| Housing Units | 7 | 13 |
| Median Property Value | - | - |
| Median Household Income | - | - |
| Monthly Housing Costs | - | - |
| Real Estate Taxes | $250 | $3 |
Property Value by Mortgage Status in Smithville
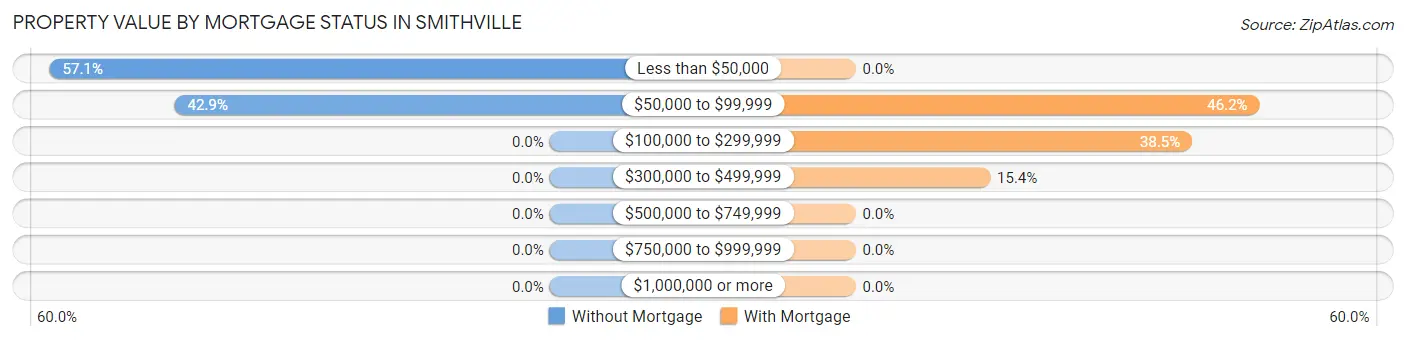
| Property Value | Without Mortgage | With Mortgage |
| Less than $50,000 | 4 (57.1%) | 0 (0.0%) |
| $50,000 to $99,999 | 3 (42.9%) | 6 (46.2%) |
| $100,000 to $299,999 | 0 (0.0%) | 5 (38.5%) |
| $300,000 to $499,999 | 0 (0.0%) | 2 (15.4%) |
| $500,000 to $749,999 | 0 (0.0%) | 0 (0.0%) |
| $750,000 to $999,999 | 0 (0.0%) | 0 (0.0%) |
| $1,000,000 or more | 0 (0.0%) | 0 (0.0%) |
| Total | 7 (100.0%) | 13 (100.0%) |
Household Income by Mortgage Status in Smithville
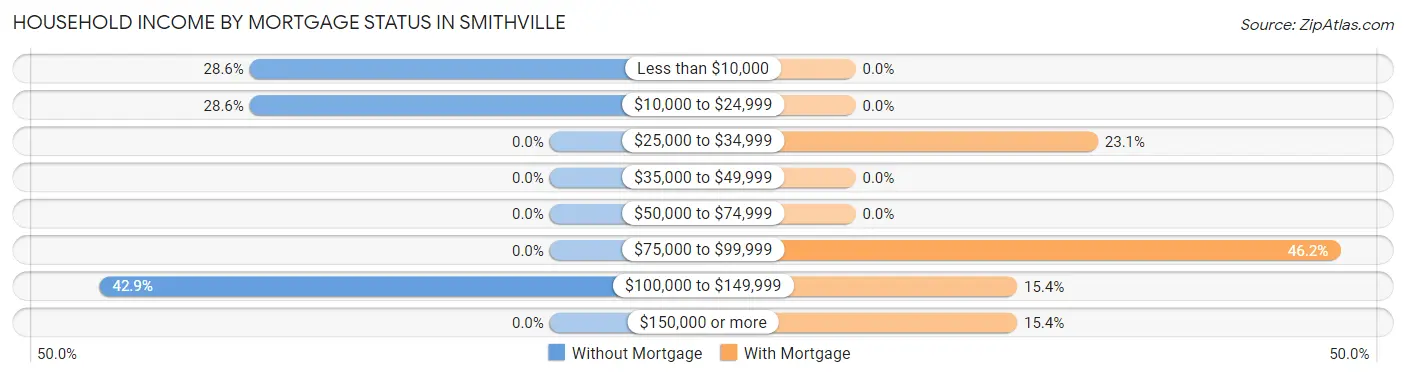
| Household Income | Without Mortgage | With Mortgage |
| Less than $10,000 | 2 (28.6%) | 0 (0.0%) |
| $10,000 to $24,999 | 2 (28.6%) | 0 (0.0%) |
| $25,000 to $34,999 | 0 (0.0%) | 3 (23.1%) |
| $35,000 to $49,999 | 0 (0.0%) | 0 (0.0%) |
| $50,000 to $74,999 | 0 (0.0%) | 0 (0.0%) |
| $75,000 to $99,999 | 0 (0.0%) | 6 (46.2%) |
| $100,000 to $149,999 | 3 (42.9%) | 2 (15.4%) |
| $150,000 or more | 0 (0.0%) | 2 (15.4%) |
| Total | 7 (100.0%) | 13 (100.0%) |
Property Value to Household Income Ratio in Smithville
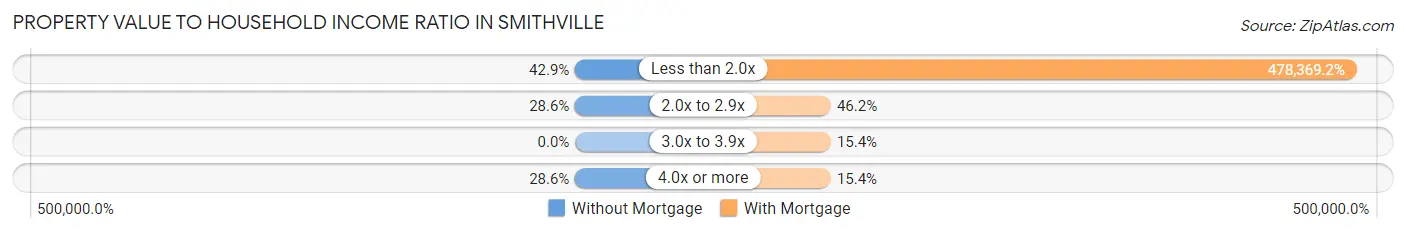
| Value-to-Income Ratio | Without Mortgage | With Mortgage |
| Less than 2.0x | 3 (42.9%) | 62,188 (478,369.2%) |
| 2.0x to 2.9x | 2 (28.6%) | 6 (46.2%) |
| 3.0x to 3.9x | 0 (0.0%) | 2 (15.4%) |
| 4.0x or more | 2 (28.6%) | 2 (15.4%) |
| Total | 7 (100.0%) | 13 (100.0%) |
Real Estate Taxes by Mortgage Status in Smithville
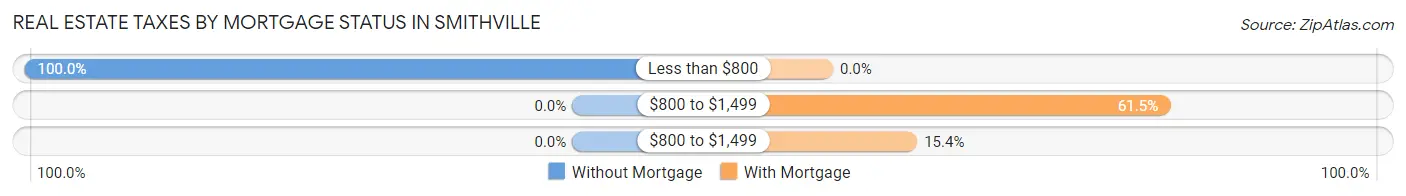
| Property Taxes | Without Mortgage | With Mortgage |
| Less than $800 | 7 (100.0%) | 0 (0.0%) |
| $800 to $1,499 | 0 (0.0%) | 8 (61.5%) |
| $800 to $1,499 | 0 (0.0%) | 2 (15.4%) |
| Total | 7 (100.0%) | 13 (100.0%) |
Health & Disability in Smithville
Health Insurance Coverage by Age in Smithville
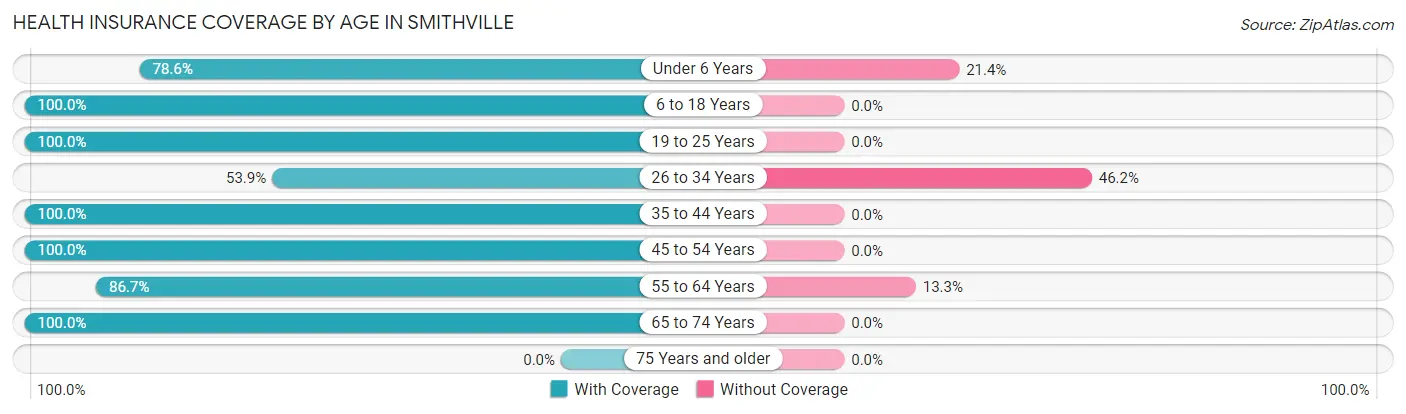
| Age Bracket | With Coverage | Without Coverage |
| Under 6 Years | 11 (78.6%) | 3 (21.4%) |
| 6 to 18 Years | 16 (100.0%) | 0 (0.0%) |
| 19 to 25 Years | 20 (100.0%) | 0 (0.0%) |
| 26 to 34 Years | 7 (53.8%) | 6 (46.2%) |
| 35 to 44 Years | 4 (100.0%) | 0 (0.0%) |
| 45 to 54 Years | 8 (100.0%) | 0 (0.0%) |
| 55 to 64 Years | 13 (86.7%) | 2 (13.3%) |
| 65 to 74 Years | 2 (100.0%) | 0 (0.0%) |
| 75 Years and older | 0 (0.0%) | 0 (0.0%) |
| Total | 81 (88.0%) | 11 (12.0%) |
Health Insurance Coverage by Citizenship Status in Smithville
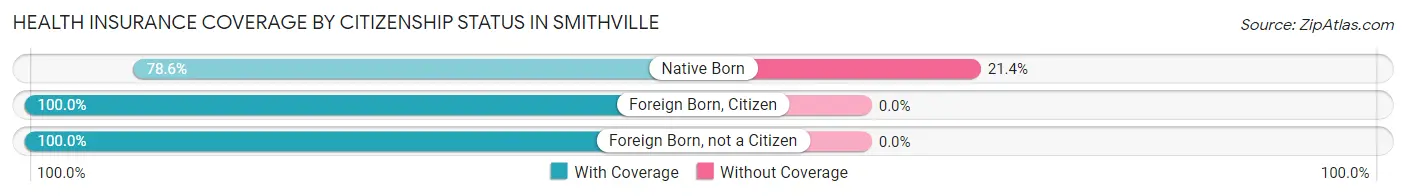
| Citizenship Status | With Coverage | Without Coverage |
| Native Born | 11 (78.6%) | 3 (21.4%) |
| Foreign Born, Citizen | 16 (100.0%) | 0 (0.0%) |
| Foreign Born, not a Citizen | 20 (100.0%) | 0 (0.0%) |
Health Insurance Coverage by Household Income in Smithville
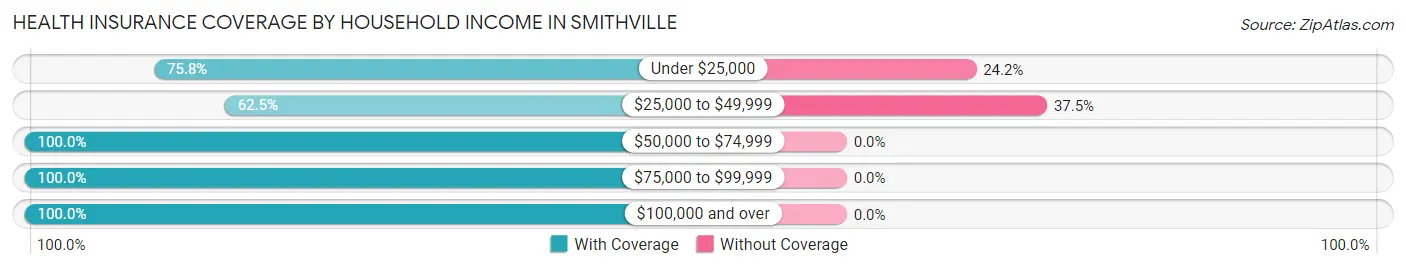
| Household Income | With Coverage | Without Coverage |
| Under $25,000 | 25 (75.8%) | 8 (24.2%) |
| $25,000 to $49,999 | 5 (62.5%) | 3 (37.5%) |
| $50,000 to $74,999 | 25 (100.0%) | 0 (0.0%) |
| $75,000 to $99,999 | 8 (100.0%) | 0 (0.0%) |
| $100,000 and over | 18 (100.0%) | 0 (0.0%) |
Public vs Private Health Insurance Coverage by Age in Smithville
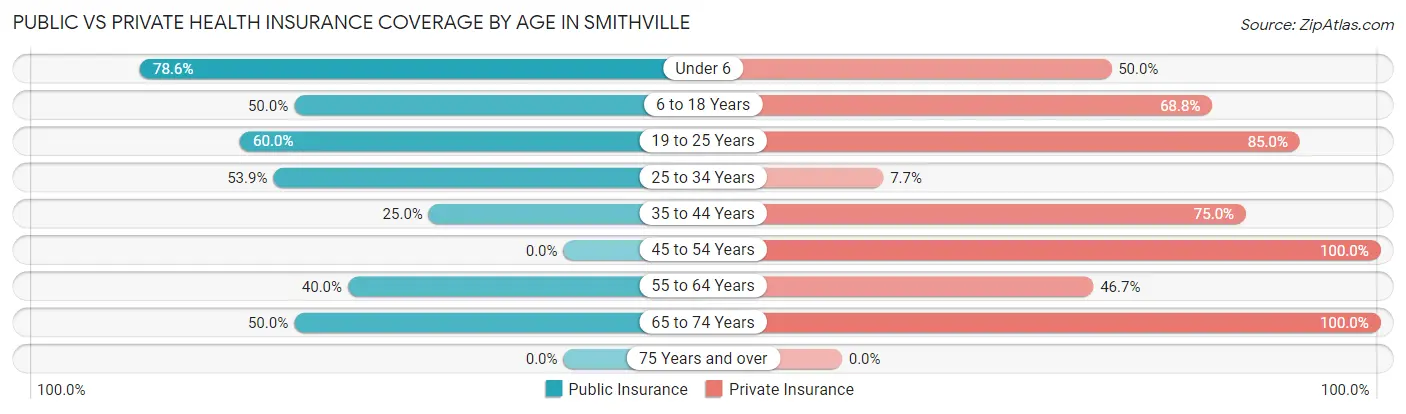
| Age Bracket | Public Insurance | Private Insurance |
| Under 6 | 11 (78.6%) | 7 (50.0%) |
| 6 to 18 Years | 8 (50.0%) | 11 (68.8%) |
| 19 to 25 Years | 12 (60.0%) | 17 (85.0%) |
| 25 to 34 Years | 7 (53.8%) | 1 (7.7%) |
| 35 to 44 Years | 1 (25.0%) | 3 (75.0%) |
| 45 to 54 Years | 0 (0.0%) | 8 (100.0%) |
| 55 to 64 Years | 6 (40.0%) | 7 (46.7%) |
| 65 to 74 Years | 1 (50.0%) | 2 (100.0%) |
| 75 Years and over | 0 (0.0%) | 0 (0.0%) |
| Total | 46 (50.0%) | 56 (60.9%) |
Disability Status by Sex by Age in Smithville
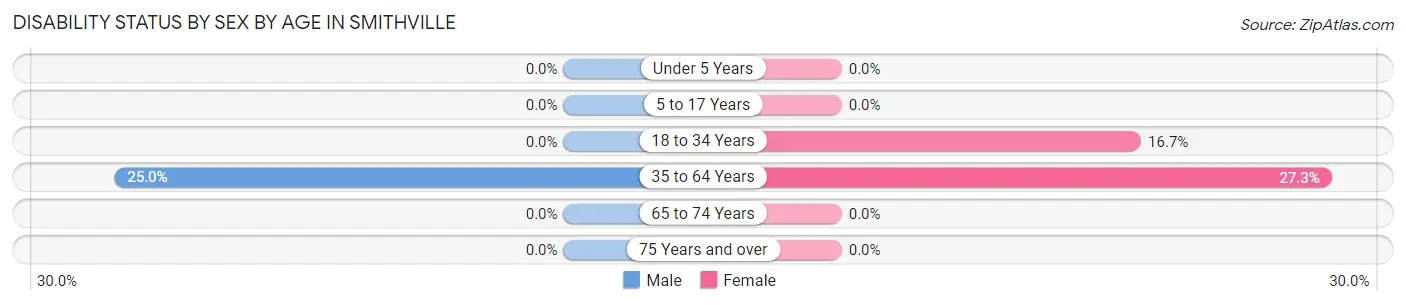
| Age Bracket | Male | Female |
| Under 5 Years | 0 (0.0%) | 0 (0.0%) |
| 5 to 17 Years | 0 (0.0%) | 0 (0.0%) |
| 18 to 34 Years | 0 (0.0%) | 3 (16.7%) |
| 35 to 64 Years | 4 (25.0%) | 3 (27.3%) |
| 65 to 74 Years | 0 (0.0%) | 0 (0.0%) |
| 75 Years and over | 0 (0.0%) | 0 (0.0%) |
Disability Class by Sex by Age in Smithville
Disability Class: Hearing Difficulty
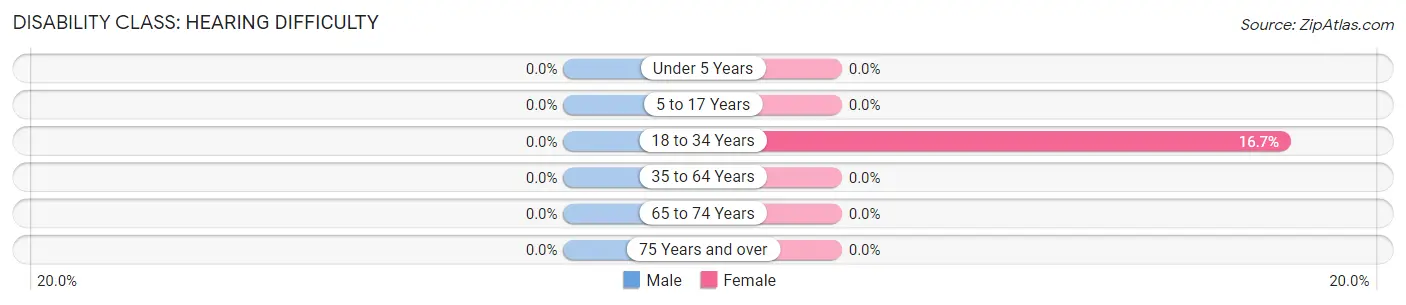
| Age Bracket | Male | Female |
| Under 5 Years | 0 (0.0%) | 0 (0.0%) |
| 5 to 17 Years | 0 (0.0%) | 0 (0.0%) |
| 18 to 34 Years | 0 (0.0%) | 3 (16.7%) |
| 35 to 64 Years | 0 (0.0%) | 0 (0.0%) |
| 65 to 74 Years | 0 (0.0%) | 0 (0.0%) |
| 75 Years and over | 0 (0.0%) | 0 (0.0%) |
Disability Class: Vision Difficulty
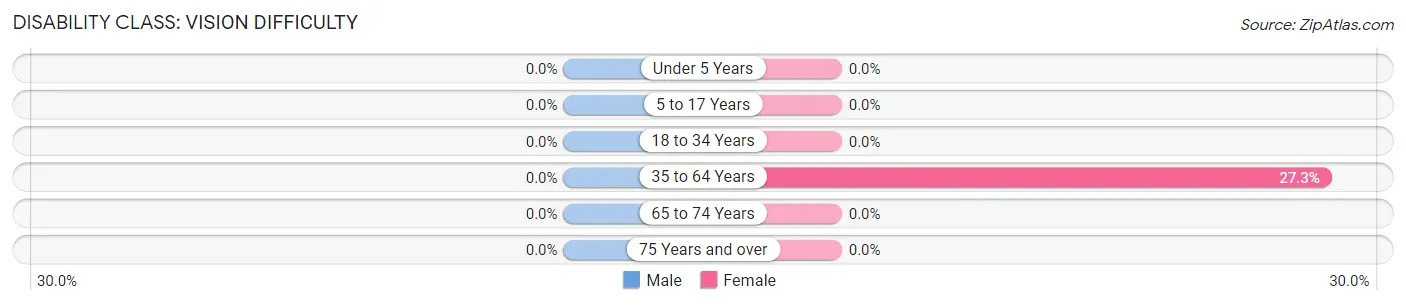
| Age Bracket | Male | Female |
| Under 5 Years | 0 (0.0%) | 0 (0.0%) |
| 5 to 17 Years | 0 (0.0%) | 0 (0.0%) |
| 18 to 34 Years | 0 (0.0%) | 0 (0.0%) |
| 35 to 64 Years | 0 (0.0%) | 3 (27.3%) |
| 65 to 74 Years | 0 (0.0%) | 0 (0.0%) |
| 75 Years and over | 0 (0.0%) | 0 (0.0%) |
Disability Class: Cognitive Difficulty
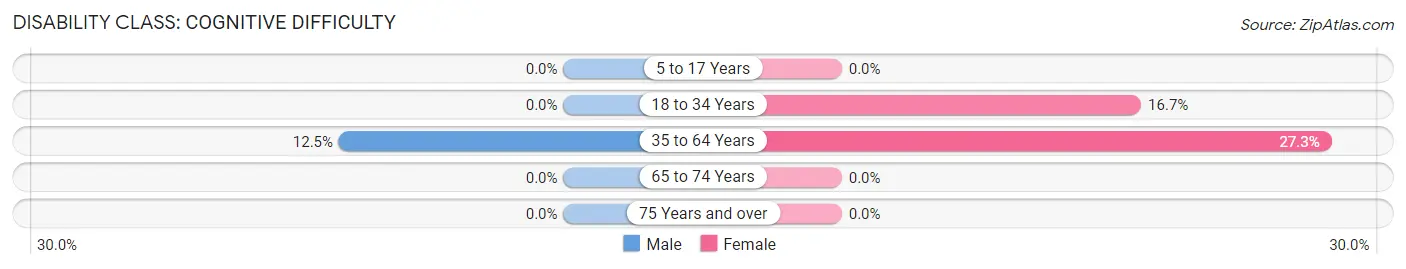
| Age Bracket | Male | Female |
| 5 to 17 Years | 0 (0.0%) | 0 (0.0%) |
| 18 to 34 Years | 0 (0.0%) | 3 (16.7%) |
| 35 to 64 Years | 2 (12.5%) | 3 (27.3%) |
| 65 to 74 Years | 0 (0.0%) | 0 (0.0%) |
| 75 Years and over | 0 (0.0%) | 0 (0.0%) |
Disability Class: Ambulatory Difficulty
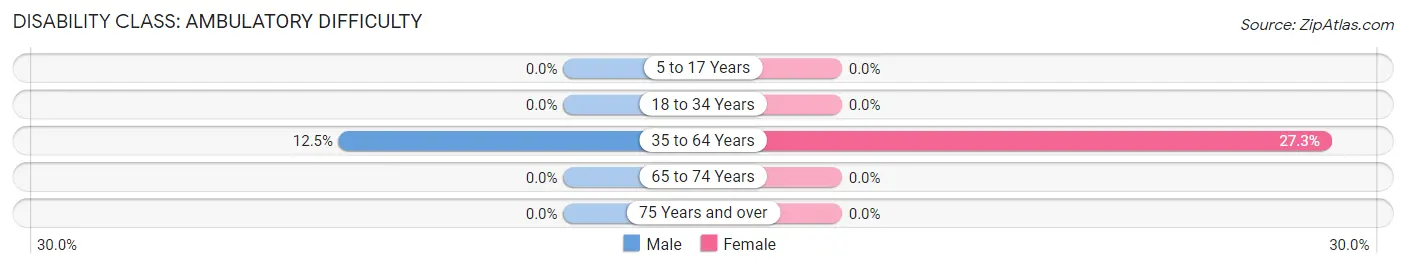
| Age Bracket | Male | Female |
| 5 to 17 Years | 0 (0.0%) | 0 (0.0%) |
| 18 to 34 Years | 0 (0.0%) | 0 (0.0%) |
| 35 to 64 Years | 2 (12.5%) | 3 (27.3%) |
| 65 to 74 Years | 0 (0.0%) | 0 (0.0%) |
| 75 Years and over | 0 (0.0%) | 0 (0.0%) |
Disability Class: Self-Care Difficulty
| Age Bracket | Male | Female |
| 5 to 17 Years | 0 (0.0%) | 0 (0.0%) |
| 18 to 34 Years | 0 (0.0%) | 0 (0.0%) |
| 35 to 64 Years | 0 (0.0%) | 0 (0.0%) |
| 65 to 74 Years | 0 (0.0%) | 0 (0.0%) |
| 75 Years and over | 0 (0.0%) | 0 (0.0%) |
Technology Access in Smithville
Computing Device Access in Smithville
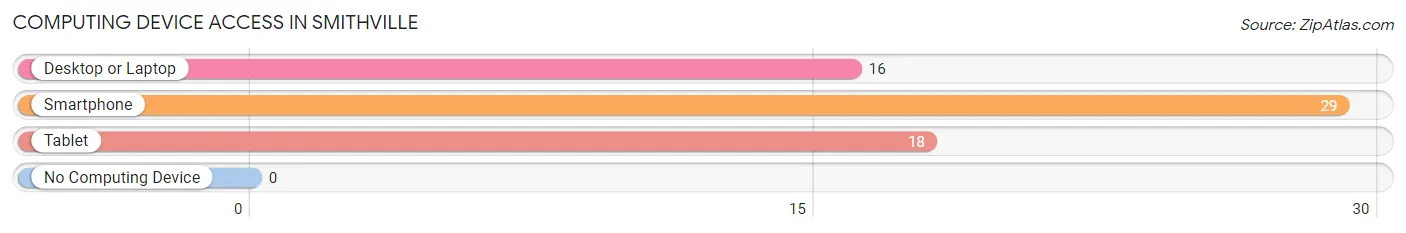
| Device Type | # Households | % Households |
| Desktop or Laptop | 16 | 50.0% |
| Smartphone | 29 | 90.6% |
| Tablet | 18 | 56.2% |
| No Computing Device | 0 | 0.0% |
| Total | 32 | 100.0% |
Internet Access in Smithville
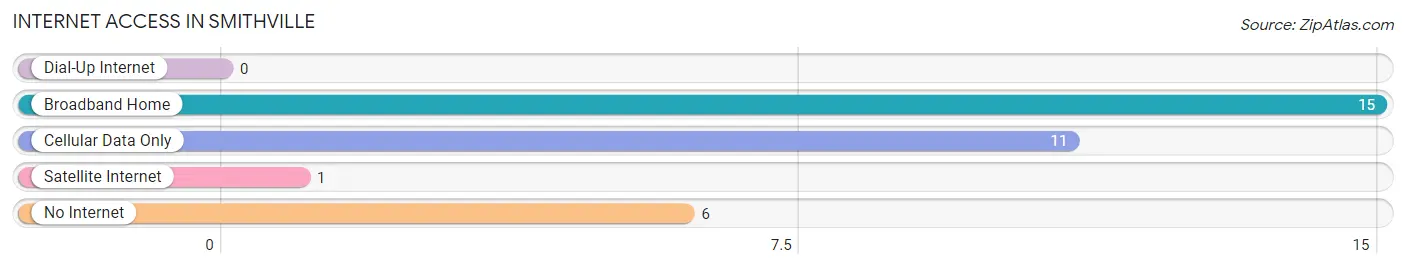
| Internet Type | # Households | % Households |
| Dial-Up Internet | 0 | 0.0% |
| Broadband Home | 15 | 46.9% |
| Cellular Data Only | 11 | 34.4% |
| Satellite Internet | 1 | 3.1% |
| No Internet | 6 | 18.8% |
| Total | 32 | 100.0% |
Smithville Summary
History
The town of Smithville, Arkansas is located in the northwest corner of the state, in the foothills of the Ozark Mountains. It is a small town with a population of just over 500 people, and it has a rich history that dates back to the early 1800s.
The first settlers to the area were Native Americans, who were drawn to the area for its abundant natural resources. The first white settlers arrived in the area in the early 1800s, and the town was officially founded in 1836. The town was named after a local settler, William Smith, who was a prominent figure in the area.
The town grew slowly over the years, and by the late 1800s, it had become a thriving agricultural community. The town was home to several cotton gins, a sawmill, and a gristmill. The town also had a post office, a school, and several churches.
In the early 1900s, the town began to experience a period of growth and prosperity. The town was home to several businesses, including a bank, a hotel, and a movie theater. The town also had a thriving agricultural industry, and it was home to several large farms.
The town experienced a period of decline in the mid-1900s, as many of the businesses and farms closed down. However, the town has experienced a resurgence in recent years, and it is now home to several small businesses and a vibrant arts and culture scene.
Geography
Smithville is located in the northwest corner of Arkansas, in the foothills of the Ozark Mountains. The town is situated on the banks of the White River, and it is surrounded by rolling hills and lush forests. The town is located about 30 miles from the state capital of Little Rock, and it is about an hour and a half drive from the larger cities of Fayetteville and Fort Smith.
The town has a total area of 1.2 square miles, and it is located at an elevation of 845 feet. The climate in Smithville is mild, with hot summers and cold winters. The average annual temperature is around 60 degrees Fahrenheit, and the average annual precipitation is around 45 inches.
Economy
The economy of Smithville is largely based on agriculture and tourism. The town is home to several small businesses, including a grocery store, a hardware store, and a few restaurants. The town is also home to several farms, which produce a variety of crops, including corn, soybeans, and cotton.
The town is also home to several tourist attractions, including the White River National Wildlife Refuge, which is a popular destination for birdwatchers and nature lovers. The town also has several parks and recreational areas, including the Smithville State Park, which offers camping, fishing, and hiking opportunities.
Demographics
As of the 2010 census, the population of Smithville was 514 people. The racial makeup of the town was 97.3% White, 0.6% African American, 0.2% Native American, 0.2% Asian, 0.2% from other races, and 1.7% from two or more races. The median household income in Smithville was $35,625, and the median family income was $41,250. The per capita income in Smithville was $17,845.
Common Questions
What is the Total Population of Smithville?
Total Population of Smithville is 92.
What is the Total Male Population of Smithville?
Total Male Population of Smithville is 46.
What is the Total Female Population of Smithville?
Total Female Population of Smithville is 46.
What is the Ratio of Males per 100 Females in Smithville?
There are 100.00 Males per 100 Females in Smithville.
What is the Ratio of Females per 100 Males in Smithville?
There are 100.00 Females per 100 Males in Smithville.
What is the Median Population Age in Smithville?
Median Population Age in Smithville is 25.2 Years.
What is the Average Family Size in Smithville
Average Family Size in Smithville is 2.9 People.
What is the Average Household Size in Smithville
Average Household Size in Smithville is 2.9 People.
What is Per Capita Income in Smithville?
Per Capita income in Smithville is $21,517.
What is the Median Family Income in Smithville?
Median Family Income in Smithville is $52,917.
What is the Median Household income in Smithville?
Median Household Income in Smithville is $53,333.
What is Inequality or Gini Index in Smithville?
Inequality or Gini Index in Smithville is 0.54.
How Large is the Labor Force in Smithville?
There are 41 People in the Labor Forcein in Smithville.
What is the Percentage of People in the Labor Force in Smithville?
57.7% of People are in the Labor Force in Smithville.
What is the Unemployment Rate in Smithville?
Unemployment Rate in Smithville is 4.9%.